 Open Access Article
Spatiotemporal dynamics of DNA nanocage uptake in zebrafish embryos for targeted tissue bioimaging applications†
Krupa
Kansara
a,
Abdulkhalik
Mansuri
b,
Anjali
Rajwar
a,
Payal
Vaswani
a,
Ramesh
Singh
a,
Ashutosh
Kumar
 b and
Dhiraj
Bhatia
 *a
*a
aBiological and Engineering Discipline, Indian Institute of Technology – Gandhinagar (IITGN), India. E-mail: dhiraj.bhatia@iitgn.ac.in
bBiological and Life Sciences, School of Arts and Sciences, Ahmedabad University Central Campus, Navrangpura, India
First published on 17th April 2023
Abstract
Three-dimensional DNA nanocages have attracted significant attention for various biomedical applications including targeted bioimaging in vivo. Despite the numerous advantages, the use and in vivo exploration of DNA nanocages are limited as the cellular targeting and intracellular fate of these DNA nanocages within various model systems have not been explored well. Herein, using a zebrafish model system, we provide a detailed understanding of time-, tissue- and geometry-dependent DNA nanocage uptake in developing embryos and larvae. Of all the geometries tested, tetrahedrons showed significant internalization in 72 hours post-fertilized larvae upon exposure, without disturbing the expression of genes involved in embryo development. Our study provides a detailed understanding of the time and tissue-specific uptake of DNA nanocages in the zebrafish embryos and larvae. These findings will provide valuable insights into the internalization and biocompatible potential of DNA nanocages and will help to predict their candidature for biomedical applications.
Introduction
DNA nanotechnology is used to construct designer 3D DNA nanocages for advanced biomedical applications.1 The global community has witnessed the rapid revolution of DNA nanotechnology in the last two decades.2 DNA offers excellent control of matter at the nanoscale and biological activities imparted to it by complementary biomolecules. The virtual programmable DNA nanostructure can be predicted through Watson and Crick base pairing and it has unparalleled advantages.3 The self-assembled wide varieties of 1D, 2D and 3D DNA nanocages with a precise size and geometry in nanoscale diameter have been developed over the years.4–6 These DNA nanocages are water-soluble biocompatible materials, which have applications in various fields, including biosensing, bioimaging, drug delivery and theranostics.7–10 DNA nanocages have exceptional functionalization properties through which they could be site-specifically modified with biological moieties, such as aptamers, nanomaterials, antibodies and peptides. Moreover, DNA nanocages have the potential to conjugate and encapsulate nanocargoes on the surface and within their internal void.11–14 The cellular studies on modified DNA tetrahedrons (TdNs) with small molecules, such as doxorubicin, methylene blue and actinomycin D, have been successfully conducted.15–17 Despite the numerous advantages, the use and in vivo exploration of DNA nanocages are limited as the investigation of the targeting and intracellular fate of these DNA nanocages in in vivo models is very limited. Additionally, the limitations are due to their molecular barriers towards (i) targeting site and the efficient delivery of DNA nanocages, (ii) the stability of the external DNA nanocage in vehicle media and (iii) limited access of toxicity in various in vivo models. However, there are limited reports available in literature for DNA nanocage in vivo exposure, and TdNs make a strong case to understand the intra-molecular mechanisms and barriers.Zebrafish has attracted the attention of researchers across the globe due to its transparent embryos, least maintenance, high fecundity and the attractive visualization of nanomaterial uptake and growth.18,19 It has gained interest as it can be used for larger chemical molecule screening at reasonable costs compared to rodent models. The zebrafish genome has 70% similarity with humans, which makes it an eminent in vivo model to assess the uptake of various biological molecules. As there is limited knowledge of DNA nanocage uptake and its intracellular fate, understanding the uptake behaviours of these DNA nanocages in developing zebrafish larvae and their mechanism is of vital importance. Additionally, the time-dependent and geometry-based uptake of DNA nanocages in developing zebrafish has not been explored and reported in detail. From this perspective, the present study was designed to provide a holistic understanding of time- and geometry-based uptake behaviours exerted by DNA nanocages in the developing zebrafish larvae. The time-dependent uptake was studied from 4 h to 96 h. Additionally, the geometry-based uptake of the tetrahedron (TdN), icosahedron (ID), cube and buckyball (BB) were studied on 72 hours post-fertilized (hpf) larvae for 12 h. Moreover, the developmental changes in exposed zebrafish larvae were also assessed at the molecular level using genomic approaches. Having established the biocompatible potential of DNA nanocages, the study has further been extended to assess the changes in vital organs in detail.
The study uniquely demonstrated the internalization of DNA nanocages in developing zebrafish larvae and their biocompatible potential using various genomic expression profiles. These findings will boost future investigations on DNA nanocage candidature using in vivo models. Specifically, this study has provided the potential candidature of DNA nanocages for various biomedical applications such as biosensing, bioimaging and drug delivery.
Materials and methods
Synthesis of the DNA tetrahedron
Four single strands of the oligonucleotide which are complementary to each other were used (Table 1). The primers were dissolved in nuclease-free water to make a 100 μM stock solution. The concentration of the working solution of primers was 10 μM. They were mixed in an equimolar ratio along with 2 mM MgCl2. It was then subjected to a temperature ranging from 95 °C to 4 °C with decreasing 5 °C after every 15 minutes in a thermocycler. It was stored at 4 °C until further use.| Name | Sequence |
|---|---|
| T1 | ACATTCCTAAGTCTGAAACATTACAGCTTGCTACACGAGAAGAGCCGCCATAGTA |
| T2 | TATCACCAGGCAGTTGACAGTGTAGCAAGCTGTAATAGATGCGAGGGTCCAATAC |
| T3 | TCAACTGCCTGGTGATAAAACGACACTACGTGGGAATCTACTATGGCGGCTCTTC |
| T4 | TTCAGACTTAGGAATGTGCTTCCCACGTAGTGTCGTTTGTATTGGACCCTCGCAT (modification 5′ Cy5 labelled (Cyanine5)) |
Characterization of DNA TdN
Electrophoretic mobility shift assay (EMSA)
EMSA was performed to check for higher-order structure formation using Native-PAGE. For this, 5% polyacrylamide gel was used. The sample was 5 μL of TdN sample + 3 μL of loading buffer +1 μL of 6 X loading dye. The gel was run at 80 V for 80 min. The gel was further subjected to EtBr stain and visualized using a Gel Image Documentation system (BioRad ChemiDoc MP Imaging System).Dynamic light scattering (DLS)
The hydrodynamic size of the TdN was measured by DLS. The sample was diluted in 1![[thin space (1/6-em)]](https://www.rsc.org/images/entities/char_2009.gif) :
:![[thin space (1/6-em)]](https://www.rsc.org/images/entities/char_2009.gif) 20 ratio. It was subjected to 10 minutes centrifugation at 10
20 ratio. It was subjected to 10 minutes centrifugation at 10![[thin space (1/6-em)]](https://www.rsc.org/images/entities/char_2009.gif) 000 rpm. Then, 50 μL of supernatant was used in the Malvern analytical Zetasizer instrument to find out the hydrodynamic size. The readings were taken in triplicates.
000 rpm. Then, 50 μL of supernatant was used in the Malvern analytical Zetasizer instrument to find out the hydrodynamic size. The readings were taken in triplicates.
Atomic force microscopy (AFM)
AFM was performed to confirm the morphology of the TdN. A fresh mica sheet was used and 20–30 μL droplets of TdN were overlaid on top of the mica sheet. It was allowed to dry in a desiccator. It was then imaged using a Bruker BIO AFM in the tapping mode in the air.Zebrafish husbandry and maintenance
The zebrafish used in this study was of the Assam wild-type strain and was grown in the lab from embryo to adult stage. The lab conditions were maintained as explained in ZFIN (Zebrafish Information Network), which includes a 14 h light/10 h darkness cycle at a temperature of 26–28 °C. The fish were kept in a 20 L tank with aeration pumps. The water of the tanks was prepared by adding 60 mg L−1 sea salt (Red Sea Coral Pro salt). Various parameters were maintained to mimic the natural environment, i.e., pH = 7–7.4, conductivity = 250–350 μS, TDS = 220–320 mg L−1, salinity = 210–310 mg L−1, and dissolved oxygen > 6 mg L−1 using a multi-parameter instrument (Model PCD 650, Eutech, India). The zebrafish were fed with brine shrimp (live artemia) and basic flakes (Aquafin). They were fed with the artemia twice and flakes once a day. The breeding setup was prepared in the lab in a ratio of 3 females to 2 males in the breeding chamber. Post breeding, the embryos were collected into an E3 medium in a sterile Petri dish and kept in a BOD incubator (MIR-154, Panasonic, Japan) at 28.0 °C. The embryos were raised in the same medium for three days and then the healthy larvae were used for the experiment.Uptake of DNA nanocages in zebrafish larvae
Time dependant uptake of tetrahedrons
To evaluate the time-dependent uptake of TdN nanocages, different time points from 4 h to 96 hours post fertilisation of zebrafish were selected. The dead embryos/larvae were removed, and the live embryos/larvae were placed in six-well plates at a density of 15 embryos/larvae per well. Each set of the larva is treated with the Cy3-labelled TdN for different time points (4, 6, 48, 72 and 96 h) at 300 nM concentration. One well was designated as the control in each group without any nanocages. After Ts treatment, the medium was replaced with an E3 media, and the embryos/larvae were washed with fresh E3 media twice to remove the excess TdN. The embryos/larvae were fixed with a fixative solution (4% PFA) for 2–3 minutes. Post fixation, the larvae were mounted on a glass slide using the mounting solution Mowiol. The zebrafish larva slides were first dried and then used for further confocal imaging analyses. Similarly, Cy5-labelled TdNs were used for the uptake analysis for 4, 6 and 24 h at 300 nM concentration. We studied the uptake of Cy5-labelled TdNs with Alexa647-labelled transferrin (Tf-A647) for 6 h as well.Geometry-dependent uptake of DNA nanocages
The 72 hours post-fertilized live larvae were used for the geometry-dependent uptake experiment. The dead larvae were removed, and the live larvae were placed in six-well plates at a density of 15 larvae in one well. Each set of the larva is treated with different DNA nanocages, i.e., tetrahedron, icosahedron, cube and buckyball with the same concentration of 300 nM and the treatment time was fixed at 12 h. One well was designated as the control in each group without any nanocages. Post DNA nanocage treatment, the medium was replaced with an E3 media, and the larvae were washed twice with a fresh E3 media to remove the excess nanocages. The larvae were fixed with a fixative solution (4% PFA) for 2–3 minutes. Post fixation, the larvae were mounted on a glass slide using the mounting solution Mowiol. The zebrafish larva slides were first dried and then used for further confocal imaging analyses.Total RNA isolation and gene expression
To understand the effects of DNA cage uptake on the cellular physiology of tissues in zebrafish, 72 hours post-fertilized larvae were exposed to 300 nM concentrations of TdN. The exposed larvae were used for total RNA isolation and for further studies. Total RNA was isolated from 15 larvae using a FavroPrepTM Tissue Total RNA Purification Mini Kit (Favorgen Biotech Corp) following the manufacturer's protocol. The quality and quantity of the isolated RNA were determined using a SYNERGY – HT multiwell plate reader (Bio – TEK, USA) and the Gen5 software.The isolated RNA was used to synthesize first-strand cDNA using a Verso cDNA Synthesis Kit (ThermoFisher Scientific, USA); from each sample, 1000 ng of RNA was used to synthesize the first strand of cDNA. A quantitative real-time PCR was done in Quantstudio 5 (ThermoFisher Scientific, USA) using a powerupTM sybr® green master mix (ThermoFisher Scientific, USA) with gene-specific primers. The quantification of the output signal was normalized in comparison to the output signal of the housekeeping gene glyceraldehyde 3-phosphate dehydrogenase (GAPDH) by the 2 − ΔΔCt method.
Confocal microscopy
Fixed embryos/larvae were imaged using a Confocal Scanning Laser Microscope (Leica TCS SP8). The slides were imaged using 10× and 20× objectives and the pinhole was kept 1 Airy unit. The image quantification and analysis were done using the Fiji ImageJ software. The autofluorescence of the embryos/larvae were subtracted using the Fiji ImageJ software (NIH). A total of 10–12 embryos/larvae from each sample were quantified and 4–5 z-stack were taken from each sample. For comparison of the cellular uptake of various DNA nanocages, the fluorescence intensity from embryos/larvae was normalized with respect to the blank control, where the signal from the nontreated embryos/larvae was considered as 100. However, for the different numbers of fluorophores per cage in the case of cube and BB, the whole embryo/larvae intensity was divided by the number of fluorophores.Statistical analysis
All the experiments were performed in triplicates, and for the statistical analysis, the results from the experiments were compared with the corresponding control. The results are expressed as mean ± standard error (SE). The statistical analysis was performed using Sigma plot® 10.0 and GraphPad prism 9.0. The image quantification was done using the Fiji ImageJ software (NIH).Results and discussion
Synthesis and characterization of DNA TdN
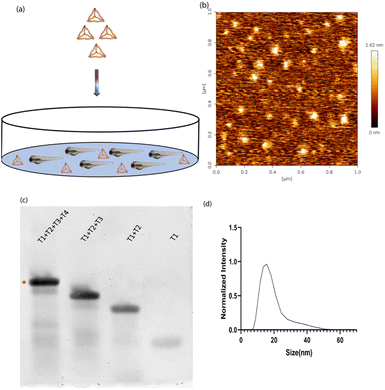
DNA tetrahedron was synthesized using a previously established protocol.20 Briefly, the four complementary single strands of the DNA tetrahedron were mixed in an equimolar ratio with 2 mM MgCl2via a one-pot assembly approach. It was subjected to a thermocycler from 95 °C to 4 °C with a gap of 5 °C for 15 minutes at each step. One strand was labelled with Cyanine5 dye to help in the identification of DNA tetrahedron inside the zebrafish (Fig. 1a). The characterization of DNA tetrahedron was done using three different methods. Atomic force microscopy was performed to check the morphology of the formed DNA tetrahedron (Fig. 1b). An electrophoretic mobility shift assay (EMSA) was used to study the higher-order structure formation. The primers were added in order T1, T1 + T2, T1 + T2 + T3, and T1 + T2 + T3 + T4, and the shift in the band confirms the formation of higher order structures (Fig. 1c). Dynamic light scattering was performed to check the hydrodynamic size of the DNA tetrahedron, which came to 14.97 ∓ 1.27 nm (Fig. 1d).Time-dependent uptake of the DNA TdN
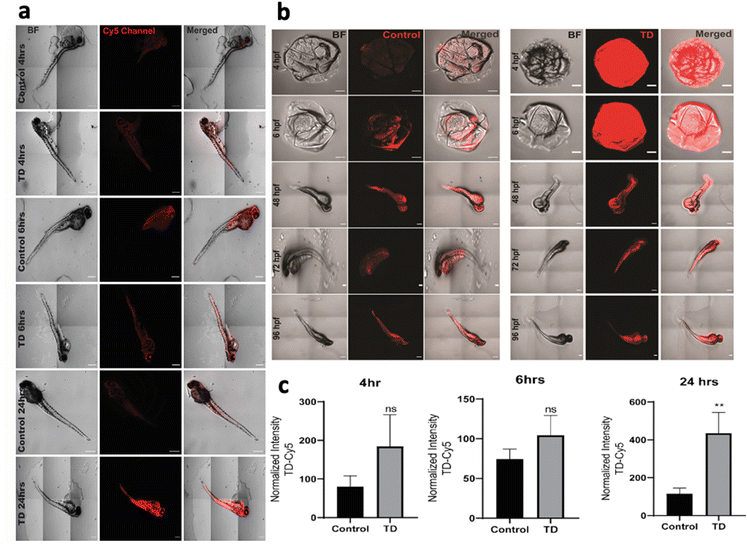
To understand the uptake potential of TdNs in zebrafish embryos and larvae, the 4 hpf to 96 hpf larvae were exposed to 300 nM of tetrahedron tagged with Cy5 dye (Fig. 2b). The cellular uptake of any nanomaterials depends on the transfection agents that help nanomaterials transport through the plasma membrane. However, DNA nanocages have been shown to be uptaken via endocytic pathways without any transfection agents.21 Our earlier cellular-based study has provided the optimum concentration, i.e. 300 nM of the tetrahedron for this zebrafish study.21 A total of 15 embryos per well were put in an E3 media and co-incubated with Cy5-labeled TdN for 4, 6, 24, 48, 72 and 96 h. The concentration of tetrahedron, i.e., 300 nM was kept constant in a time-dependent uptake experiment. The untreated embryos and larvae served as a control for the authentication of the uptake efficiency of tetrahedrons.The uptake of TdN was quantified using a laser-scanning confocal microscope. The TdN uptake by the chorion of zebrafish embryos can be detected during the early hours such as 4 and 6 h. The signal of TdN increases with time, and we conducted the larvae-specific time-dependent studies in parallel. Initially, the 72 hpf larvae were used to conduct the uptake studies and the 72 hpf larvae were incubated with Cy5-labelled TdNs for 4, 6 and 24 h (Fig. 2a). The highest intensity of tetrahedron was recorded post 24 h treatment (Fig. 2c). The uptake intensity of the Cy5-labelled tetrahedron can be false positive if proper controls are not implemented during the experiments. To cancel the false fluorescent signals from free dye or ssDNA, we compared the uptake intensity from free dye or ssDNA and signals that were negligible (Fig. 2).
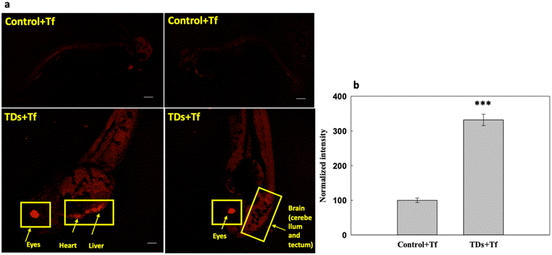
We studied the uptake of Cy5-labelled TdNs with Alexa647-labelled transferrin (Tf-A647) for 6 h (Fig. 3). Tf-A647 is an endocytic marker of clathrin-mediated endocytosis that served as an internal control. The concentration of Tf-A647 used was 5 μg mL−1. The nontreated larva was considered as a negative control for validating the internalization efficiency of TdN. The internalization of TdN was tracked using Cy5-conjugated TdN, and we found that TdN uptake was significantly higher in the eye, heart and brain regions (Fig. 3a and b).
Geometry-dependent uptake of DNA nanocages
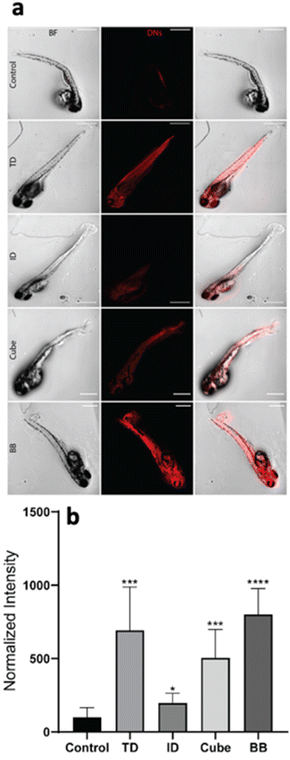
The geometry-dependent uptake of DNA nanocages was characterized both quantitatively and qualitatively using a laser scanning confocal microscope. To understand the uptake potential of various geometry-based nanocages in zebrafish larvae, the 72 hpf larvae were exposed to 300 nM of the tetrahedron, icosahedron, cube and buckyball for 12 h. The Cy5-DNA concentration was constant in TdN and ID; however, the copies of Cy5-DNA in BB and cube were more, which was later normalized by dividing the total intensity by the number of fluorophores. The greater number of fluorophores in BB and cube is due to their structure, as their constructs are made up of repeating units and each unit contains one fluorophore-modified oligo. The untreated larvae have minimum signals in the red channel compared to the treated ones, which further validates the higher uptake of various nanocages through strong signals. The ID and cube showed minimum signals at 300 nM of concentration, whereas the TdN and BB showed a significant increase in signal intensity. The images were quantified and processed using the ImageJ software (Fig. 4).Genetic expression analysis
DNA TdNs showed the maximum uptake but simultaneously biocompatible effects on zebrafish embryos and larvae. To assess if the uptake of DNA nanocages also modulate any tissue-specific gene expression and thus affect the overall development of zebrafish, we assessed the expression of eleven different essential genes that are responsible for heart morphology, floorplate development, ventralized body axis formation, dorsoventral axis development, curly tail, BMP pathway, and paracardial development. The 72 hpf larvae were exposed to 300 nM of TdN for 12 h (Fig. 5).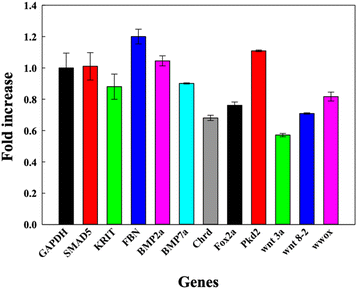 | ||
| Fig. 5 Bar graph depicting the fold change in relative gene expression of 72 hpf zebrafish larva exposed to DNA TdNs for 12 h of treatments. | ||
We quantified and analyzed the expression of foxa2, chrd, and smad5 genes, which are mainly responsible for the early development of zebrafish larvae. The foxa2 gene is associated with the floorplate development of the zebrafish,22 while the chrd gene plays a vital role in the dorsal–ventral patterning of larva with the help of TGF-β protein.18
Smad5 gene expression after the treatment was 1.0 folds, which is similar to GAPDH expression. The expression profiles of foxa2 and chrd were 0.73 and 0.89 respectively. There were no significant changes in the expression profiles of smad5, foxa2 and chrd, which can be correlated with the proper functioning of zebrafish larvae after the exposure to TdNs for 12 h. The smad5 gene is also associated with the bone morphogenetic protein (BMP) signalling pathway.23–26
Bmp7a gene is one of the essential genes of the BMP pathway, and it is responsible for the normal dorsoventral development of the zebrafish embryo and larva, leading to average growth. It generally binds to type 1 and type 2 BMP receptors on the cell surface to activate SMADs.18,22,27–29 The results indicated that the exposure of tetrahedron did not change significantly compared to the control. The genes involved in the organ development of zebrafish larvae such as krit 1, fbn2, and wwox were quantified. Krit 1 stabilizes the cardiovascular junctions by interacting with other proteins; this gene's reduced expression or upregulation can lead to severe cardiovascular defects in the zebrafish larva.19,22,30 The Fbn-2 gene is also known as the fibrillin-2 gene and plays an important role in the heart morphology and notochord morphogenesis.18,31 Wwox gene is a tumour suppressor gene, and its reduced expression can lead to paracardial edema, which leads to larval death within a week.32 The gene expression profiles of krit 1, fbn2 and wwox were 1.2, 0.8 and 0.7 folds respectively compared to the control, which directly showed the biocompatible potential of TdNs on developing zebrafish larvae. Pkd2 gene is responsible for the typical tail curvature of zebrafish larvae and mesendoderm patterning.33 The proper pkd2 gene expression profile indicates the proper tail curvature formation in tetrahedron-exposed larvae. The Wnt signalling pathway plays an important role in the body patterning of zebrafish in early developmental stages.34 Wnt3a and wnt8 are expressed in the margins of the blastoderm and, in the later stages of development, in the tail bud.34 Wnt3 and ant 8 gene expressions were 0.82 and 0.71 compared to the control, which showed the proper tail formation in developing larvae. The gene expression profiles in tetrahedron-exposed larvae showed the proper formation of organs without any hindrance, which can be correlated with the normal activity of larvae after exposure to tetrahedrons for 12 h.
Conclusions
We demonstrate herein that the exposure of DNA TdNs to developing zebrafish embryos and larvae showed excellent internalization as well as tissue-specific uptake. It was also observed that DNA TdNs did not induce any transcriptional alterations in the developing genes of zebrafish larvae. The expression of the genes related to cardiovascular development, dorsoventral axis development, tail formation, and floorplate development was not significantly altered under DNA TdN exposure. From the results, it can be concluded that TdN has the highest internalization compared to the other three nanocages used in this study. Our results strongly indicated that the DNA tetrahedron geometry strongly influences its internalization in zebrafish embryos and larvae. Such results will play important roles in the futuristic design and development of ligand-functionalized DNA nanocages with unique target probes for various biomedical applications such as biosensing, bioimaging and drug/cargo deliveries.Ethical statement
The study was performed in strict accordance with the CPCSEA guidelines for the care and use of laboratory animals (Experimentation on Fishes 2021) as per the regulations and was approved by the institutional Ethics and Biosafety Committee, Ahmedabad University, India.Author contributions
Krupa Kansara: experiments execution, writing–original draft, methodology, design, data collection, revised draft preparation. Abdulkhalik Mansuri: realtime data collection. Anjali Rajwar: confocal image analysis. Payal Vaswani: synthesis and characterization of the DNA TdN. Ramesh Singh: AFM imaging of DNA cages Ashutosh Kumar: provided zebrafish facility. Dhiraj Bhatia: conceptualization, methodology, design, writing and editing.Conflicts of interest
There are no conflicts to declare.Acknowledgements
The authors sincerely thank all the members of DB group for critically reading the manuscript and for their valuable feedback. KK thanks SERB-DST GoI for the National postdoctoral fellowship (NPDF). DB thanks SERB, GoI for Ramanujan Fellowship, IITGN, for the startup grant, and DBT-EMR, Gujcost-DST, GSBTM and BRNS-BARC for research grants. AK wish to sincerely thank the financial support provided by The Gujarat Institute for Chemical Technology (GICT). Abdulkhalik would like to acknowledge the Indian Council of Medical Research (ICMR) and Ahmedabad University for providing the fellowship and infrastructure to assist for the research work. AR and PV thank IITGN and UGC for PhD fellowship. RS thank Gujcost and IITGN for postdoctoral fellowship. The central imaging facilities at IITGN are sincerely acknowledged.References
- N. Michelotti, A. Johnson-Buck, A. J. Manzo and N. G. Walter, Wiley Interdiscip. Rev. Nanomed. Nanobiotechnol., 2012, 4, 139–152 CrossRef CAS PubMed.
- N. C. Seeman, J. Theor. Biol., 1982, 99, 237–247 CrossRef CAS PubMed.
- N. C. Seeman, Nature, 2003, 421, 427–431 CrossRef PubMed.
- H. Yan, Science, 2004, 306, 2048–2049 CrossRef CAS.
- M. A. Boles, M. Engel and D. V. Talapin, Chem. Rev., 2016, 116, 11220–11289 CrossRef CAS PubMed.
- N. Chen, J. Li, H. Song, J. Chao, Q. Huang and C. Fan, Acc. Chem. Res., 2014, 47, 1720–1730 CrossRef CAS.
- K. Kansara, A. Kumar and D. Bhatia, Appl. Nanomed., 2022, 22, 337 Search PubMed.
- J. Yan, C. Hu, P. Wang, B. Zhao, X. Ouyang, J. Zhou, R. Liu, D. He, C. Fan and S. Song, Angew. Chem., Int. Ed., 2015, 54, 2431–2435 CrossRef CAS PubMed.
- J. Liu, L. Song, S. Liu, S. Zhao, Q. Jiang and B. Ding, Angew. Chem., Int. Ed., 2018, 57, 15486–15490 CrossRef CAS PubMed.
- A. Rajwar, S. Kharbanda, A. R. Chandrasekaran, S. Gupta and D. Bhatia, ACS Appl. Bio Mater., 2020, 3, 7265–7277 CrossRef CAS PubMed.
- K. Chang and W. Chen, ACS Nano, 2011, 5, 4720–4728 CrossRef CAS PubMed.
- A. Banerjee, D. Bhatia, A. Saminathan, S. Chakraborty, S. Kar and Y. Krishnan, Angew. Chem., 2013, 125, 6992–6995 CrossRef.
- S. M. Douglas, I. Bachelet and G. M. Church, Science, 2012, 335, 831–834 CrossRef CAS PubMed.
- X. Xie, X. Shao, W. Ma, D. Zhao, S. Shi, Q. Li and Y. Lin, Nanoscale, 2018, 10, 5457–5465 RSC.
- Y. Hu, Z. Chen, H. Zhang, M. Li, Z. Hou, X. Luo and X. Xue, Drug Delivery, 2017, 24, 1295–1301 CrossRef CAS PubMed.
- K.-R. Kim, D. Bang and D.-R. Ahn, Biomater. Sci., 2016, 4, 605–609 RSC.
- M. I. Setyawati, R. V. Kutty, C. Y. Tay, X. Yuan, J. Xie and D. T. Leong, ACS Appl. Mater. Interfaces, 2014, 6, 21822–21831 CrossRef CAS PubMed.
- K. Kansara, A. Paruthi, S. K. Misra, A. S. Karakoti and A. Kumar, Environ. Pollut., 2019, 255, 113313 CrossRef CAS PubMed.
- K. Kansara, A. Kumar and A. S. Karakoti, Sci. Total Environ., 2020, 698, 134133 CrossRef CAS PubMed.
- R. P. Goodman, R. M. Berry and A. J. Turberfield, Chem. Commun., 2004, 1372–1373 RSC.
- A. Rajwar, S. R. Shetty, P. Vaswani, V. Morya, A. Barai, S. Sen, M. Sonawane and D. Bhatia, ACS Nano, 2022, 16, 10496–10508 CrossRef CAS PubMed.
- S.-I. Higashijima, A. Nose, G. Eguchi, Y. Hotta and H. Okamoto, Dev. Biol., 1997, 192, 211–227 CrossRef CAS PubMed.
- D. Zhang, E. M. Schwarz, R. N. Rosier, M. J. Zuscik, J. E. Puzas and R. J. O'Keefe, J. Bone Miner. Res., 2003, 18, 1593–1604 CrossRef CAS.
- P. Tylzanowski, K. Verschueren, D. Huylebroeck and F. P. Luyten, Journal of, Biol. Chem., 2001, 276, 40001–40007 CrossRef CAS PubMed.
- T. Fukuda, M. Kohda, K. Kanomata, J. Nojima, A. Nakamura, J. Kamizono, Y. Noguchi, K. Iwakiri, T. Kondo and J. Kurose, Journal of, Biol. Chem., 2009, 284, 7149–7156 CrossRef CAS PubMed.
- T. Yabe, T. Shimizu, O. Muraoka, Y.-K. Bae, T. Hirata, H. Nojima, A. Kawakami, T. Hirano and M. Hibi, Science, 2003, 130(12), 2705–2716 CAS.
- H. Xiao, Z. Zhang, D. Peng, C. Wei and B. Ma, Anim. Cells Syst., 2021, 25, 211–218 CrossRef CAS PubMed.
- B. Bragdon, O. Moseychuk, S. Saldanha, D. King, J. Julian and A. Nohe, Cell. Signalling, 2011, 23, 609–620 CrossRef CAS PubMed.
- X. Dong, S. Wan, J. Zhou, C. Nie, Y. Chen, J. Diao and Z. Gao, Front. Cell Dev. Biol., 2022, 541 DOI:10.3389/fcell.2022.997633.
- B. Kleaveland, X. Zheng, J. J. Liu, Y. Blum, J. J. Tung, Z. Zou, S. M. Sweeney, M. Chen, L. Guo and M.-M. Lu, Nat. Med., 2009, 15, 169–176 CrossRef CAS PubMed.
- F. B. Pichler, S. Laurenson, L. C. Williams, A. Dodd, B. R. Copp and D. R. Love, Nat. Biotechnol., 2003, 21, 879–883 CrossRef CAS.
- Y. Tsuruwaka, M. Konishi and E. Shimada, PeerJ, 2015, 3, e727 CrossRef.
- J. Schottenfeld, J. Sullivan-Brown and R. D. Burdine, Dev. Biol., 2008, 314(2), 261–275 CrossRef.
- T. Shimizu, Y.-K. Bae, O. Muraoka and M. Hibi, Dev. Biol., 2005, 279, 125–141 CrossRef CAS PubMed.
Footnote |
| † Electronic supplementary information (ESI) available. See DOI: https://doi.org/10.1039/d2na00905f |
| This journal is © The Royal Society of Chemistry 2023 |

