 Open Access Article
Multi-functional O2–H2 electrochemistry by an abundant mineral: a novel and sustainable alternative for noble metals in electrolyzers and metal–air batteries†
Zinoy
Manappadan
ab and
Kaliaperumal
Selvaraj
 *abc
*abc
aNano and Computational Materials Lab., Catalysis and Inorganic Chemistry Division, CSIR-National Chemical Laboratory, Pune 411008, India. E-mail: k.selvaraj@ncl.res.in; kselva@gmail.com
bAcademy of Scientific and Innovative Research (AcSIR), CSIR-Human Resource Development Centre (CSIR-HRDC) Campus, Postal Staff College area, Ghaziabad 201 002, Uttar Pradesh, India
cCentral Microscopy Facility, CSIR-National Chemical Laboratory, Pune 411008, India
First published on 24th September 2022
Abstract
Developing sustainable and efficient electrocatalysts for clean energy-based technologies would hasten the commercialization of high-power devices such as metal–air batteries, electrolyzers, and fuel cells. With immense potential to root out the increasingly startling carbon emission, a disruptive invention with an alternate catalyst of abundance and comparable performance as that of the existing benchmarked noble metal catalysts is awaited. Herein, we report the identification of such a novel biomineral-based catalytic composite with exceptionally durable hydrogen and oxygen electrochemistry. Hydroxyapatite on reduced graphene oxide (HAG), though metal-free, surpasses the best-known noble metal catalysts in the OER–HER and OER–ORR bifunctional performances. Its high abundance and elevated methanol tolerance compared to the benchmark catalysts make HAG an industry favorite as well.
1. Introduction
Hydrogen evolution reaction (HER), oxygen evolution reaction (OER), and oxygen reduction reaction (ORR) are vital electrocatalytic processes that contribute to the clean energy project. OER and HER are the two integral reactions that occur inside a water electrolyzer, whereas ORR is one of the two critical reactions occurring in a fuel cell along with the hydrogen oxidation reaction (HOR).1–3 The water splitting reaction in the electric field remains one the cleanest approaches ever known for centuries to produce oxygen and hydrogen in the electrolyzers.4–8 A fuel cell and an electrolyzer are complementary in their functions where the former produces H2 and O2, and the latter uses them to produce power. Likewise, promising power sources with higher theoretical energy densities such as rechargeable metal–air batteries depend heavily on ORR and OER.9–11 Currently, most of these devices use carbon–supported platinum (Pt) based materials for ORR and HER and ruthenium (Ru) based materials for the OER. Recently, nickel (Ni) was promoted for industrial HER as a cheaper alternative. However, there is no effective inexpensive alternative to the ORR or OER. To realize the wide distribution and use of renewable and clean energy, the invention of highly active yet cost-effective materials that accelerate the otherwise sluggish ORR and OER is essential.12–14 Such an invention would economically boost the metal–air batteries, electrolyzers, and fuel cell technologies.The fabrication of working electrodes using two different materials for individual applications raises cost concerns and manufacturing difficulties.15 Therefore, to simplify the design and to enhance the mobility and power-to-weight ratio, it is a must to combine the multiple functionalities, viz., OER, HER, and ORR, constituting a simple catalytic system.16,17 A striking property of a multifunctional material that makes them unique from the traditional catalysts is that numerous active sites can exceptionally expedite the adsorption or desorption of reactants, intermediates, and products of two or more reactions concurrently.18 For example, if Pt was a multifunctional catalyst toward OER, ORR, and HER, an electrolyzer (OER/HER) and a metal–air battery (OER/ORR) could operate using a single catalyst. However, this is not possible as Pt is just bifunctional and does not catalyze the OER well. This example, explicitly, indicates how important it is to have efficient multifunctional catalysts to expedite the commercialization of electrochemical energy conversion devices.
The judicious design of such highly active and robust multifunctional catalysts is key to the promising future of clean energy production. Unfortunately, the choice of such materials is narrowed down because of the difference in the onset electric potentials of individual reactions. Among most electrocatalysts reported thus far, two distinctive approaches are followed to surmount the hurdles of high performance and cost-effectiveness in a multifunctional design: (i) alloying 3d transition metals along with noble metals to reduce the extent of noble metal active sites and (ii) manufacturing highly performing noble metal-free catalysts with excessive active site density and durability. In literature, multifunctional electrocatalysts are vaguely grouped into three classes based on the composition: (i) electrocatalysts based on noble metals, (ii) electrocatalysts based on transition–metal composites, and (iii) heteroatom (N, O, P, and S)-doped carbon systems.19 However, an important category that is absent in the literature is the earth abundant, non-transition metal inorganic compounds. Such an electrocatalyst when made multifunctional would solve the economic constraints due to its global accessibility.
The only category that is devoid of transition metals that shows multifunctionality is the doped carbon as described earlier. Mostly, incorporating heteroatoms such as N, O, P, and S is a highly energy-consuming process and involves multistep treatments. Moreover, doping is often followed by post-enrichment procedures to modify the electronic structure and defects.20,21 Such treatments are not only sensitive22,23 but also involve the risk of inhomogeneity.24 In the context of all of the above complexities, doping cannot be regarded as a favourite synthesis strategy for the economical and scalable industrial production of catalysts. Thus, a material does not become an ideal electrocatalyst by merely being multifunctional and transition metal-free but essentially when produced through low energy consumption and facile routes.
We report, hydroxyapatite nanorods supported on reduced graphene oxide (HAG), a highly active and exceptionally durable novel multifunctional electrocatalyst for OER, HER, and ORR, for the first time. Hydrothermally synthesized hydroxyapatite (HA) crystals were confirmed to be existing in the hexagonal polymorph falling in the P63/m space group. HA has been considered a poor conductor of electricity as it is non-polar due to the presence of a centre of symmetry.25 However, HA is a well-known proton conductor, owing to the hydroxyl (OH−) channels located along its c-axis that make HA a potential material in chemical sensors and proton-conducting fuel cells.26 Interestingly and most importantly, the proton conduction is reportedly responsible for the very polarization of the material due to the accompanied reorientation and proton-stimulated diffusion of the OH− ions inside the diffusion channel.26 The high surface ion transportation, initiated mainly from this hydroxyl diffusion along the c-axis passage and the strong local hydration that it causes, is also believed to be accountable for the higher electrical conductivity demonstrated by HA than that theoretically anticipated by presuming the mobility of charges across a fixed lattice.27 In spite of a thorough review of the conductivity of HA, to the best of our knowledge, a conclusive explanation of the issue is not e found in the literature. Various reports lack consensus on deciding possible species viz. protons, oxide anions, or lattice hydroxyl groups28 that bring about conduction. We assume that it might be due to the very elusive understanding of the conducting mechanism of HA, that it has never been thought to be a plausible electrocatalyst. Anyhow, the net current density does not merely depend upon the conducting nature of HA. A highly conductive reduced graphene oxide (rGO) support29 is exclusively designed toward that end. Moreover, rGO helps the HA rods to distribute evenly on its surface, thanks to its high specific surface area.30 This helps the HA surface to be available for electrocatalysis in its maximum possible capacity that in turn would be reflected in the catalytic performance. The innate structural defects present on rGO generate new surface functionalities31 that could reportedly enhance the interaction between the support and its surface nanoparticles. This property of rGO has been utilized to build a stable catalytic composite containing HA and rGO. The said functionalities contribute to a higher dispersion of the catalytic composite.32 In addition, exceptional mechanical properties of rGO have been reportedly responsible for a longer lifetime of the catalyst and performance stability.33
2. Experimental methods
2.1 Materials
Graphite (500 mesh) was purchased from Sigma-Aldrich. KMnO4, NaNO3, H2O2 (30%), KOH, calcium sulphate, and ammonium nitrogen phosphate were purchased from M/S Merck. All the chemicals were used as purchased, without undergoing any purification process. Millipore (Milli-Q) grade DI water was used in all the experiments having a resistivity of 18 MΩ cm−1.2.2 Preparation of graphene oxide (GO)
Graphene oxide (GO) was synthesized from graphite powder according to the modified Hummers’ method.34,35 Graphite and sodium nitrate were mixed in a 250 mL flask at 0 °C. Concentrated H2SO4 was added dropwise along with stirring below 5 °C. The mixture was stirred for 30 min and KMnO4 was added in slowly below 10 °C. The mixture was stirred for 30 min and again KMnO4 was added slowly in the reaction over 1 h below 20 °C. Once the reaction temperature reached 35 °C and the mixture was stirred for 2 h, DI water was cautiously added to the reaction mixture, leading to a rise in the temperature up to 70 °C. The dilute solution was stirred for another 15 min. Then, H2O2 (30%) and water mixture were added to the suspension. Due to the addition of H2O2, the suspension becomes bright yellow, and a yellow-brown filter cake was collected by filtering the suspension. The paste was washed many times with a 3% aqueous HCl solution. Finally, the GO was exfoliated to generate GO nanosheets by sonication in water. Further, the GO was separated by centrifugation and dried in a vacuum oven at 40 °C for 24 h.2.3 Preparation of hydroxyapatite rods on reduced graphene oxide (HAG)
The as-synthesized GO was used after drying without further treatments on which the rods of hydroxyapatite were deposited. Calcium sulphate and ammonium nitrogen phosphate (0.1 M each) were mixed in water and stirred well for 30 minutes to prepare a uniform dispersion. Separately, GO was dispersed in water (1 mg mL−1) by ultra-sonication. Later, the two dispersions were mixed to perform a hydrothermal treatment at 200 °C for 24 hours. The grey powder product was separated by centrifugation and washed with Millipore water (MPW) and ethanol. The powder was then dried in a vacuum, before proceeding to the basic characterization and electrochemical applications. Control samples of hydroxyapatite (HA) and reduced graphene oxide (rGO) were prepared using a similar method without adding GO and calcium/phosphate salts, respectively.2.4 Characterizations
Powder X-ray diffraction (PXRD) experiments were performed using a PAN analytical X’pert Pro dual goniometer diffractometer. The samples were scanned with a step size of 0.0081 and a scan rate of 0.51 per min. The Cu Kα (1.54 Å) radiation was used with a Ni filter. The X-ray photoelectron spectroscopy (XPS) experiments were performed using the Thermo Fisher Scientific and VG Microtech Multilab ESCA 3000 spectrometer, having an Mg Kα X-ray source (hν = 1.2356 keV). The microstructure and morphology of the materials were investigated by High-Resolution Transmission Electron Microscopy (HRTEM, JEOL JEM F200) and Field Emission Scanning Electron Microscopy (FEI, NOVA NANOSEM 450). For FESEM, the samples were prepared by preparing a methanol dispersion of the material, which was drop cast onto the silicon wafer. For HRTEM, the same dispersion was diluted accordingly and deposited on a carbon-coated copper grid. The chemical composition of the materials was quantified by Energy-dispersive X-ray spectroscopy (EDX). Raman experiments were performed in the range of 800 to 3000 cm−1 on a LabRAM Horiba JY HR-800 micro-Raman spectrometer equipped with a microscope in a reflectance mode with a 632.8 nm excitation He–Ne laser source. The electrochemical properties of the catalysts were analyzed using a conventional three-electrode cell controlled by a multichannel electrochemical workstation (Bio-Logic VSP-300), at room temperature.2.5 Electrochemical measurements
To evaluate the electrochemical activities of the OER and HER, Nickel Foam (NF) was used as the substrate. To remove the oxide impurities, NF was activated before the electrochemical evaluation. Firstly, NF was dipped into Milli-Q water for 10 minutes followed by 3 M hydrochloric acid. After washing carefully with ethanol, NF was allowed to dry in a vacuum oven for 8 hours at 80 °C. To test the OER and HER performance, the material was slurry-coated on the nickel foam on a 1 cm × 1 cm area. The slurry was made according to the standard protocol. 80% of the active material (HAG/HA/Pt–C/Ru–C/rGO/GO) was mixed with 15% conductive carbon black and 5% of PVDF binder and ground thoroughly in an agate mortar and pestle. 2 or 3 drops of NMP (N-methyl pyrrolidinone) solvent were added while the grinding was continued. The resulting slurry was then spread onto nickel foam and allowed to dry in a vacuum oven at 80 °C for 8 hours. All linear sweep voltammetry (LSV) and cyclic voltammetry (CV) measurements for OER and HER were carried out in 1 M KOH. The standard calomel electrode (SCE) and the graphite rod were used in both cases as the reference and counter electrodes, respectively. For ORR experiments, polished glassy carbon (GC) electrode of 3 mm diameter was used as the working electrode. 5 mg of the material was well dispersed in 450 μL Millipore water and 50 μL Nafion binder. The resulting ink was then drop cast onto GC and dried in a vacuum oven at 40 °C for 12 hours. O2-saturated 1 M KOH was used as the electrolyte in all the ORR experiments.For evaluating the redox activity of HER and OER, nickel foam coated with active material was initially stabilized by performing cyclic voltammetry for 50–100 cycles. Once the stable performance was observed, the polarograms were recorded at a standard scan rate of 2 mV s−1. The higher the scan rate, the higher the deviation from the equilibrium conditions, as the products do not have enough time to reverse back to the reactants. Moreover, every polarogram was recorded, with and without iR compensation. All data reported here are without iR compensation, while the iR-compensated data are provided in the ESI.† Further, in many cases, complete removal of the uncompensated resistance (100% iR correction) is not possible as indicated by the non-ideal shapes of polarograms. In such cases, a maximum value for the percentage of iR correction was investigated, when the deflection of polarograms from the standard shape was the least. The same methodology was followed for every material in the OER and HER. In this study, the iR correction value was estimated to be 85% and was used throughout. Tafel slopes are estimated from both compensated and non-compensated polarograms. Like Tafel slopes, H2 and O2 evolution at elevated current densities were estimated to understand the trend of activities among the set of catalysts. Another important parameter is the electrochemical stability of the catalytic system. Two different aspects of catalytic stability were tested. Chronoamperometric tests were performed by soaking the catalyst at higher current densities for a longer duration. The percentage of the retention of activity was then estimated to understand how long a catalyst can sustain a particular current. In a more vigorous test of stability, at every 10 minutes of the interval, a certain increment of the electric input was given to the catalyst. This is a real test of the robustness of the catalyst.
In the case of ORR, the polarograms were initially recorded on a GC. To perform the steady-state studies, a Rotating Disc Electrode (RDE) was used to run the polarograms at various rotation rates, starting from 400 to 3200 rpm. To test the stability, an Activity Durability Test (ADT) was conducted using the RDE. All the ORR experiments were carried out during the continuous bubbling of O2 gas. To prove the methanol resistance of HAG, a poisoning test was conducted with the addition of 3 M methanol.
3. Results and discussion
The hydrothermal synthesis of HAG is explained in detail in the experimental section. The relative ratio by weight of calcium and phosphorus at the pre-hydrothermal stage was about 2.15. The ratio of the atomic percentage of the two elements calculated from their atomic weights was estimated to be approximately 1.67. But the post hydrothermal ratio calculated from the XPS analysis indicates (Table ST1 in the ESI†) a ‘not-so-negligible’ loss in the atomic percentage of calcium, at a ratio of 1.3 instead of 1.67. Anyhow, the extraordinary stoichiometric flexibility of the compound could adapt to these defects without breaking its crystallographic symmetry.24 Hence, it can be inferred that the degree of crystallinity of the formed HA phase would be less than 58.08%.25HA is explained to have a hexagonal symmetry group P63/m. The unit cell of HA consists of Ca2+, PO42−, and OH− groups compactly arranged together in a hexagonal arrangement. The OH− group functions as the pillar for the HA structure. The six phosphates, PO42−, are present in a helical arrangement across the c-axis. The phosphate tetrahedra are linked together with Ca2+. These phosphate tetrahedra form a skeletal framework, which provides stability to the HA structure. In literature, many reports describe the presence of two different structural cations (Ca2+), namely, Ca(I) and Ca(II) creating variations in their electronic structure, which leads to different atomic binding energies. Seeing the non-equivalent O and Ca sites, the formula can be presented as Ca(I)4Ca(II)6[PO(I)O(II)O(III)2]6(OHH)2. These two types of Ca sites are regarded as six-fold coordinated to oxygen, resulting in two different geometries: a metaprism and a distorted octahedron.36 To study the structure of the prepared HAG composite in this study, different analytical tools are used i.e., XRD, RAMAN, and XPS.
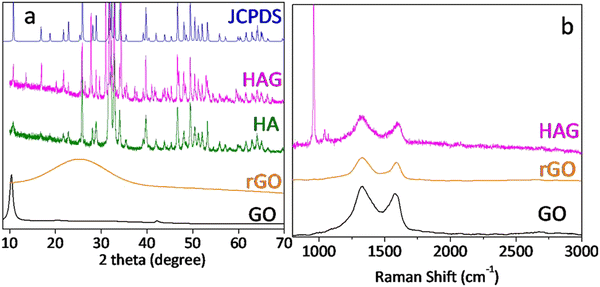
XRD patterns of GO, rGO, HA, and HAG along with HA JCPDS are shown in Fig. 1(a). GO shows the characteristic (002) peak at 10.8°, which was shifted to around 25° in rGO, which proved the reduction of GO during the hydrothermal treatment. Further, the XRD patterns for HA and HAG (Fig. 1(a)) show that the HA formed by the hydrothermal route is monophase, i.e., there are no diffraction maxima except the maxima that correspond to the HA. The phase was formed into a hexagonal crystal lattice of the P63/m space group and matches the peaks in JCPDS 73-0294 pattern, peak by peak. Furthermore, the (002) plane is highly significant for HA. In HA, the crystallite size can be inferred from the diffracting plane (002), which appears at 2θ = 25.50°. The reason behind this is that this particular miller index relates to the c-axis length.25 The crystallite size along the c-axis length is inversely proportional to the full width at half maximum (FWHM) of the (002) plane. The extent of HA crystallinity could be deduced by increasing the sharpness of the (002) diffraction peak. In this study, the crystallite size of HA in HAG was found to be 15 nm as calculated using the Scherrer equation.37 Furthermore, in HAG, rGO peak was not observed, this could be justified by two contributing factors viz. the high crystallinity of HA compared to rGO and its relative presence.
Fig. 1(b) shows the Raman spectra of GO, rGO, and HAG. GO and rGO show the characteristic D and G bands for carbon materials with an ID/IG ratio above 1. The reason for the more intense D band in both the samples is that GO has oxygen functional groups and in rGO, although oxygen functionalities are reduced, it forms defects during the reduction process.38 Further, in the Raman spectrum of HAG, the symmetrical valence vibration line (PO4)3− is the most intense peak. The characteristic Raman peak of HA at 960 cm−1 along with the D and G bands of rGO further confirm the formation of the HAG composite (Fig. 1(b)). The phosphate line ν1 appears is in the range of 955–959 cm−1 for the substituted B-type carbonate apatite. While it shifts to the region of 962–964 cm−1 for the unsubstituted highly crystalline HA. A line in the frequency range of 945–950 cm−1 corresponds to the existence of a disordered phosphate lattice of apatite. In the general case, the phosphate band ν1 is a superposition of all three factors.39
The elemental compositions and oxidation states of the catalysts were studied by X-ray photoelectron spectroscopy (XPS) as displayed in Fig. 2. The C 1s peak at 284.8 eV was employed to calibrate the spectral energies. The XPS spectra of HA and HAG are shown in Fig. 2. The data were collected for core-level spectra of Ca 2p, P 2p, O 1s, and C 1s for HAG and HA (Fig. 2(a)–(c), S1). In HA and HAG, the difference between 2p3/2 and 2p1/2 levels of calcium (ΔCa) was 3.5 eV, and that for the phosphorus (ΔP) was ∼1 eV.40 Further, the shift in HAG towards higher binding energy for all core-level spectra compared to that of HA was attributed to the interactions between Ca2+ and the COO− groups on rGO.41 In HAG, the graphitic carbon that has a higher electronegativity than Ca and P shifts all the core levels toward higher binding energy.42
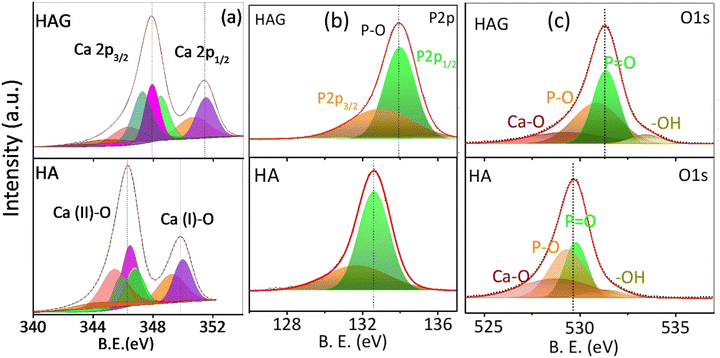 | ||
| Fig. 2 X-ray photoelectron spectra of HAG. Core levels of (a) calcium (b) phosphorus and (c) oxygen on HAG and HA. | ||
As explained earlier, HA has two different kinds of Ca sites, which were further observed in Ca core-level spectra shown in Fig. 2(a). The peaks at 346.4 eV and 131.7 eV are of Ca 2p3/2 and P 2p3/2, respectively, in HA; while for HAG, these peaks were detected with a slight shift toward high binding energies, i.e., at 347.8 eV and 132.9 eV, respectively. Similarly, the peaks at 349.8 eV and 132.8 eV belonging to Ca 2p1/2 and P 2p1/2 of HA were shifted to 351.3 eV and 133.9 eV, respectively, in HAG. The low-intensity peaks in Ca 2p for HA and HAG at 343.7 eV and 347.1 eV, respectively, can be ascribed to the interactions between Ca and surface impurities.40 O1 s core-level spectra of HA and HAG show the binding of oxygen in different confirmations. In HA, peaks at 528.7 eV, 529.3 eV, 529.8 eV, and 531.2 eV could be attributed to the Ca–O, P–O, P![[double bond, length as m-dash]](https://www.rsc.org/images/entities/char_e001.gif) O, and –OH bonds, respectively; similarly, these groups can be seen in HAG with binding energies at 529.2 eV, 530.8 eV, 531.3 eV, and 533.4 eV, respectively.43 Fig. S1 (ESI†) shows the C1 s core-level spectra of HAG from reduced graphene oxide. The main peak at 284.8 eV is attributed to the sp2 carbons in C
O, and –OH bonds, respectively; similarly, these groups can be seen in HAG with binding energies at 529.2 eV, 530.8 eV, 531.3 eV, and 533.4 eV, respectively.43 Fig. S1 (ESI†) shows the C1 s core-level spectra of HAG from reduced graphene oxide. The main peak at 284.8 eV is attributed to the sp2 carbons in C![[double bond, length as m-dash]](https://www.rsc.org/images/entities/char_e001.gif) C bonds, the main framework of graphene, while low-intensity peaks at higher binding energies represent the remaining oxygen groups i.e., C–O, C
C bonds, the main framework of graphene, while low-intensity peaks at higher binding energies represent the remaining oxygen groups i.e., C–O, C![[double bond, length as m-dash]](https://www.rsc.org/images/entities/char_e001.gif) O, and –COOH, after the hydrothermal process.44
O, and –COOH, after the hydrothermal process.44
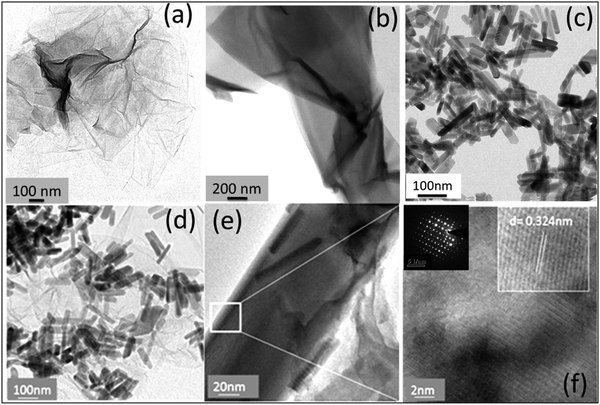
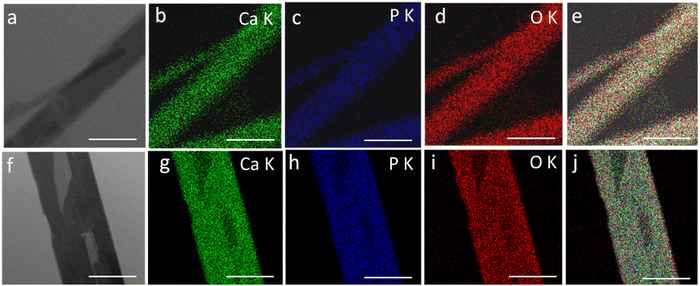
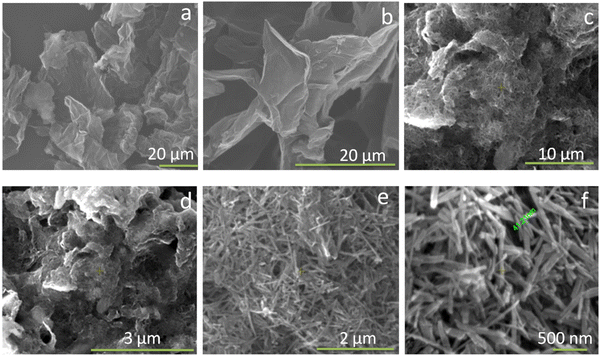
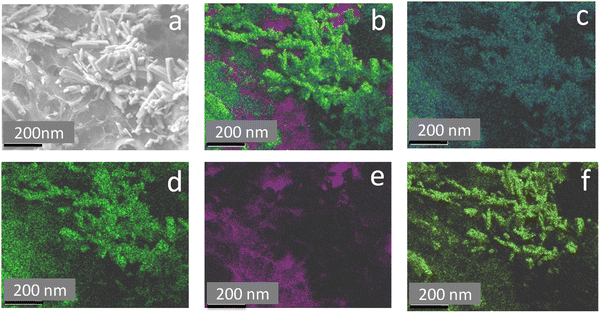
Fig. 3 shows the transmission electron microscopy (TEM) images of GO, rGO, HA, and HAG composite. As seen in Fig. 3(a) and (b), both GO and rGO show characteristics of sheet structures with wrinkles. Further, Fig. 3(c) and (d) reveal the microfeatures and distribution of HA nanorods and HA rods on rGO sheets in HA and HAG, respectively. As seen, the rGO sheets constitute the support for HA rods. The average length and thickness of the HA rods are estimated to be ∼100 nm and ∼30–40 nm, respectively, as can be estimated from the TEM images. Fig. 3(e) and (f) show a high-resolution image of a HA rod. The inset in Fig. 3(f) showcases the (002) plane and its corresponding d-spacing of 0.324 nm. Moreover, the selected area electron diffraction (SAED) pattern, as shown in the inset of Fig. 3(f) depicts that the HA crystals, which show high crystallinity in the XRD pattern also have short-range orders and hence are crystalline to the electrons as well. Fig. 4 displays the elemental mapping of the HA rods. The images vividly explain the location of the constituents of HA. Ca, P, and O are found to be homogeneously distributed along the surface of the HA rods. The element carbon could not be imaged as the analysis was performed on a carbon-coated copper grid, which is further shown in the FESEM mapping. Fig. 5 shows the FESEM images of GO, rGO, and HAG. The HAG composite (Fig. 5(c)–(f)) shows the deposition of HA rods over graphene sheets. Unlike the TEM-based mapping, the one under FESEM displays the carbon-containing rGO background, as displayed in Fig. 6. Here, HA rods look distinctively green against the violet carbon background.
Electrochemical performance
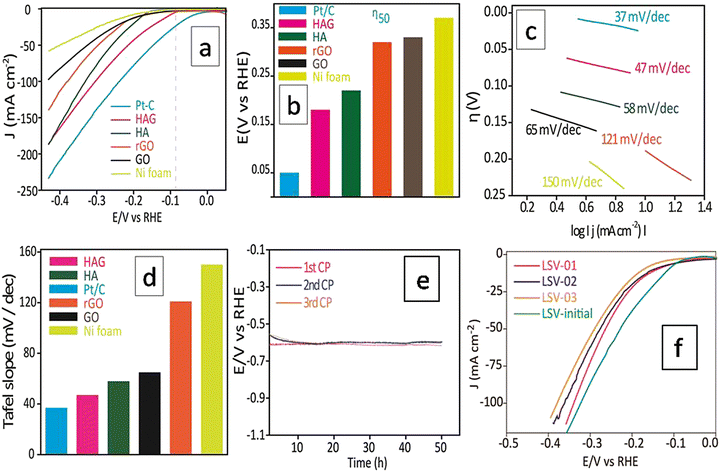
The HER electrocatalytic activity of the prepared catalysts was examined using a three-electrode cell setup using 1.0 M KOH as an electrolyte, at RT. Initial stabilization of the working electrode was performed by employing cyclic voltammetry (CV). The current density reaches a stable value within 50 CV cycles. The reported LSVs were recorded only after this stabilization treatment. Polarograms of all samples were recorded at a scan rate of 2 mV s−1 and the overpotential at 50 mA (η50) was adopted as a standard value to compare the HER performances. Fig. 7(a) shows the polarograms recorded without iR drop correction. Though the Pt/C standard showed the best performance at all current densities, the activity of HAG at 50 mA was just 100 mV behind the Pt/C (Fig. 7(a) and (b)). Tafel slope (Fig. 7(c)) was used to determine the electrochemical kinetics and deduce the rate-determining step. The Tafel slope was calculated via the Tafel equation (eqn (1)).45,46H = a + b (log![[thin space (1/6-em)]](https://www.rsc.org/images/entities/char_2009.gif) j) j) | (1) |
![[thin space (1/6-em)]](https://www.rsc.org/images/entities/char_2009.gif) j) and overpotential (η) gives the Tafel slope (b) and constant (a). The Tafel slope values correspond to the HER kinetic process in alkaline electrolytes (eqn (2)–(4)).
j) and overpotential (η) gives the Tafel slope (b) and constant (a). The Tafel slope values correspond to the HER kinetic process in alkaline electrolytes (eqn (2)–(4)).
(1) Discharge step:
| H2O + e− → Hads + OH− (slope: 120 mV dec−1, Volmer reaction,) | (2) |
(2) Desorption step:
| Hads + H2O + e− → OH− + H2 (slope: 40 mV dec−1, Heyrovsky reaction) | (3) |
(3) Recombination step:
| Hads + Hads → H2 (slope: 30 mV dec−1, Tafel reaction) | (4) |
Fig. 7(d) compares the Tafel plots of different electrocatalysts. The HAG possessed a value of 47 mV dec−1 for the slope. Clearly, the Volmer reaction (the discharge step) limits the HER kinetics. Besides, HAG exhibits excellent durability by performing 150 hours of prolonged HER via the chronopotentiometry (CP) test (Fig. 7(e)). The same experiment was also used as a test for reproducibility as well. After each 50 hour CP, one polarogram was recorded and then the working electrode was collected, washed, and dried at room temperature for 12 hours (Fig. 7(f)). The activity retention after each 50 hour CP run is shown in Fig. S2 (ESI†). This shows that the catalytic performance was exceptionally intact when all the CP runs showed activity retention of 99.3%. Fig. S3 (ESI†) shows the comparison of η50 for the polarograms taken after each CP run. At each time, the shift in η50 values was negligible (1%). Lastly, polarograms were also recorded by eliminating 85% of the uncompensated resistance to compare the HER performance among the catalysts (see the ESI,† Fig. S4).
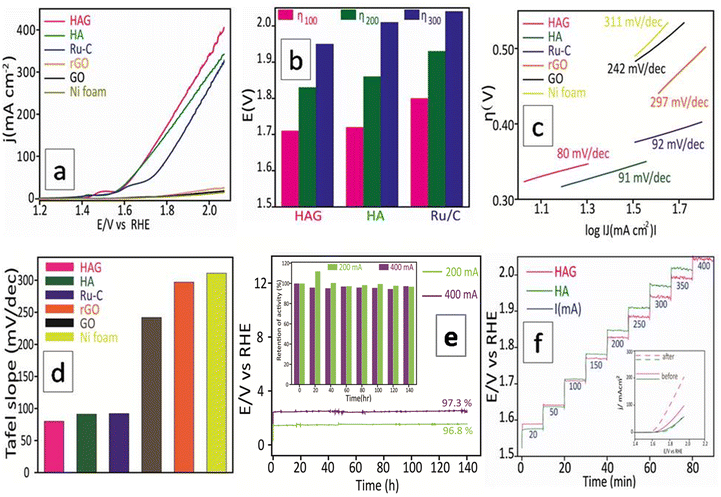
The OER performance of the catalysts was studied in all three aspects discussed above viz. activity, durability, and reproducibility. As seen in Fig. 8(a), polarograms were recorded without correcting for the uncompensated resistance. HAG and HA show enormous activity and completely outperformed the standard benchmark Ru catalyst. Activity comparisons of HAG, HA, and Ru standard catalysts were performed at 100, 200, and 300 mA current densities, as shown in Fig. 8(b). The domination of HAG was obvious at all current densities. Moreover, HAG possesses the lowest Tafel slope (80 mV dec−1); suggesting the faster OER kinetics (Fig. 8(c)). To comprehend the OER mechanism of HAG, a model via Krasil's shchikov path (eqn (5)–(8)) was followed to determine the discharge step of OH− on the catalyst surface.47,48
| M* + OH− ↔ M*OH + e− (slope: 120 mV dec−1) | (5) |
| M*OH + OH− ↔ M*O + H2O (slope: 60 mV dec−1) | (6) |
| M*O → M*O + e− (slope: 45 mV dec−1) | (7) |
| 2 M*O → M* + O2 (slope: 19 mV dec−1) | (8) |
From the Tafel values, as shown in Fig. 8(d), it can be deduced that the adsorption of intermediates on the HAG catalyst is the rate-limiting step for the OER, not charge transfer. That means that HAG has a high electron transfer ability.
The second aspect, i.e., the stability of HAG was evaluated by the CP measurement. HAG showed its robustness by displaying an exceptional O2 evolution for 140 continuous hours at a very high current, 400 mA (Fig. 8(e)). The durability of HAG was also proven by the staircase CP experiment. The input current value was altered from 20 mA to 400 mA at a time interval of 10 minutes. As shown in Fig. 8(f), at all current values, HAG exhibits excellent stability by giving constant voltage outputs. The polarograms displayed in the inset prove that the performance of HAG was considerably increased after the experiment. Such an enhancement in performance happens generally when a catalyst is activated. Hence, it can be undoubtedly explained that even by a rigorous stability test such as the staircase CP, HAG was neither destabilized nor deactivated. To further explore the stability, a third aspect, i.e., the reproducibility aspect was introduced. The working electrode used to study the CP experiment at 400 mA for 140 hours was taken out of the three-electrode cell, washed, and dried for 12 hours at room temperature. The same electrode was reintroduced into the cell assembly to perform a second CP experiment at 200 mA for 140 hours. As seen in Fig. 8(e), the retention in the activity of the second CP run was 96.8% against that of the first CP run, which was 97.3%. HAG attractively excelled in all three aspects of OER performance. The iR compensated OER polarograms were recorded and the activity was compared at very high current densities (see the ESI,† Fig. S5). HAG possessed the lowest overpotential at low (100 mA), high (400 mA), and elevated (800 mA) current densities.
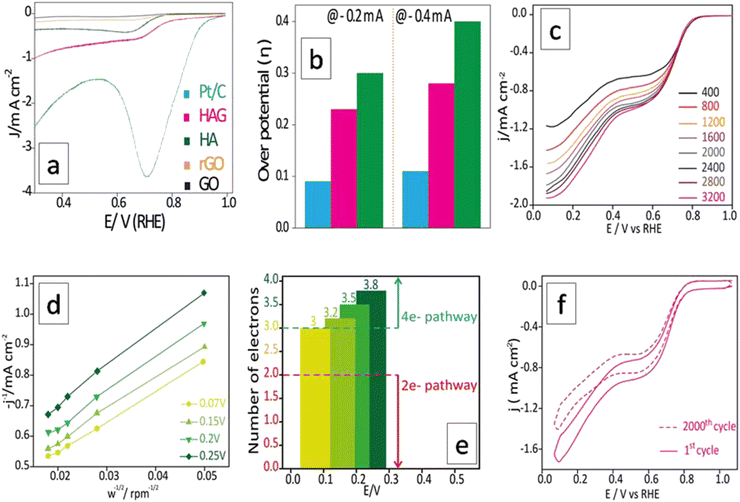
The ORR performance was evaluated over a GC surface, unlike for OER and HER. Fig. 9(a) displays the polarograms showing the ORR performance of the catalysts compared to the Pt–C benchmark. HAG, though much inferior to platinum, performed equally well or better than many of the reported non-noble metal catalysts. Fig. 9(b) represents the bar diagram comparing the ORR activities of Pt–C, HAG, and HA at two different current densities (−0.2 mA and −0.4 mA) at a scan rate of 2 mV s−1. At all current densities, HAG shows its dominating performance over its constituents, HA, rGO, and GO. To study the steady-state behavior, HAG was tested on an RDE. Polarograms were recorded at various rotation rates viz. 400, 800, 1200, 1600, 2000, 2400, 2800, and 3200 rpm (Fig. 9(c)). Further, the mechanistic aspects were explored using RDE-based polarograms. In ORR, usually, the reaction is believed to follow two main pathways: 4-e− pathway leading to “hydroxyl ion” and 2-e− pathway directing to “peroxide” as the product. Based on Koutechy–Levich's (K–L) theory, the following eqn (9) and (10) can provide the number of electrons transferred during ORR.49,50
 | (9) |
| B = 0.62nFC0D02/3υ−1/6 | (10) |
In the above equations, J is the measured current density, JL and JK are the diffusion and kinetic-limiting current densities, B is the slope of the K–L plot, F = Faraday constant (96![[thin space (1/6-em)]](https://www.rsc.org/images/entities/char_2009.gif) 485 C), n = number of electrons transferred during ORR, C0 = bulk concentration of oxygen (1.2 × 10⁻⁶ mol cm−3), D0 = diffusion coefficient of oxygen (1.8 × 10⁻⁵ cm2 s−1), υ = kinetic viscosity of the electrolyte (0.001 cm2 s−1) in 1 M KOH and ω = angular rotation of the electrode in radians s−1 (ω = 2πf = [2π × rpm value]/60).
485 C), n = number of electrons transferred during ORR, C0 = bulk concentration of oxygen (1.2 × 10⁻⁶ mol cm−3), D0 = diffusion coefficient of oxygen (1.8 × 10⁻⁵ cm2 s−1), υ = kinetic viscosity of the electrolyte (0.001 cm2 s−1) in 1 M KOH and ω = angular rotation of the electrode in radians s−1 (ω = 2πf = [2π × rpm value]/60).
For a better understanding of the reaction kinetics, the polarograms recorded at several rotations in RDE are used for deriving K–L plots (Fig. 9(d)). K–L plot analysis was performed at 0.07 V, 0.15 V, 0.2 V, and 0.25 V vs. RHE and showed good linearity. The respective electron transfer numbers are, 3, 3.2, 3.5, and 3.8, as shown in Fig. 9(e), which indicate that the 4e− process is the preferred pathway. To test the stability aspect, ADT was performed at a rotation rate of 1600 rpm (Fig. 9(f)). 2000 polarograms were recorded at a scan rate of 100 mV s−1. The first and 2000th polarograms were compared to evaluate the stability.
As discussed in the introduction, ORR becomes an integral part of the fuel cells along the HOR or methanol oxidation reaction (MOR). In the latter case, methanol crossover is a well-known risk factor as it poisons the platinum surface.51 This happens due to the least reactivity of methanol on the platinum surface as it generates surface-bound impurities, out of which, carbon monoxide is the most tenacious.52 Hence, to qualify for an industrially favorable ORR catalyst, methanol resistance is a mandatory property. Therefore, a chronoamperometric set-up was built for the same, and 3 M methanol was added to the KOH electrolyte in two batches. The first time, 2 mL methanol was introduced immediately after the commencement of the experiment. Pt–C showed an overt dip in the activity curve, whereas HAG was nearly unaffected. For the second time, 2 mL methanol was introduced after 30 minutes. As seen in Fig. S6 (ESI†), Pt–C completely collapsed, while HAG continues to perform well. HAG ended with more than 85% retention in its activity. This proved that the HAG is by far more methanol resistant than the benchmark Pt-based catalyst. The experimental data suggest that HAG is a viable candidate for methanol fuel cells.
Bifunctional performances
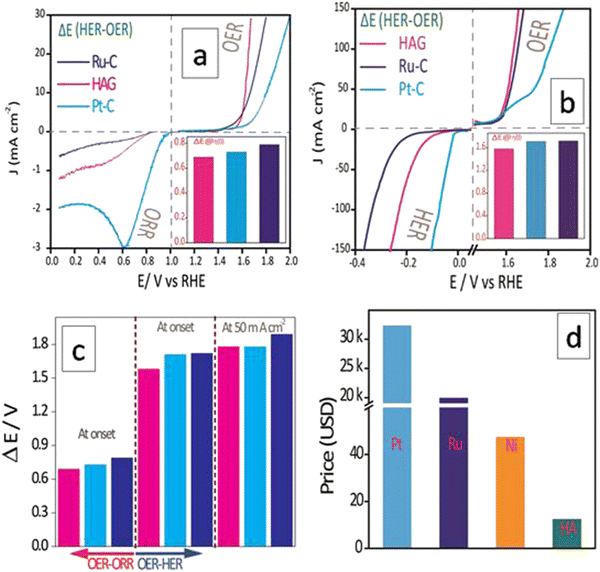
The electrocatalytic performances of HAG in catalyzing individual reactions have been discussed so far. However, as described in the introduction, an ideal catalyst must be multifunctional and cost-effective altogether for commercializing clean energy-based devices, such as electrolyzers, metal–air batteries, and fuel cells. Hence, it is essential to evaluate HAG in terms of its ability to catalyze more than one reaction effectively. In general, the difference in the onset potential of two independent reactions (ΔE, which would be referred to as the bifunctional parameter, hereafter) is one of the effective parameters used to understand bifunctional performance.2 As shown in Fig. 10, the multifunctional evaluation of HAG was performed in two parts, viz., by deducing ΔE of (1) the OER–ORR reaction pair (Fig. 10(a)) and that of (2) the OER–HER reaction pair (Fig. 10(b)). The intention behind such disintegration is purely based on the device-level utility of HAG. OER–ORR bifunctionality of HAG qualifies it to be used in a commercial metal–air battery, whereas that of the OER–HER makes HAG a favorite in alkaline electrolyzers.Fig. 10(a) explicitly shows the comparative OER–ORR bifunctional performances of HAG along with the benchmark electrocatalysts Ru–C and Pt–C. On an individual evaluation, although HAG falls behind Pt–C in the case of ORR, the bifunctional evaluation suggests another aspect. The ΔE parameter was evaluated at the onset of OER and ORR, proving that the bifunctional performance of HAG was energetically more favourable than that of platinum, as shown in the first trisect of Fig. 10(c). Though excelled in OER (yet inferior to HAG), Ru–C was shown to be poorer in terms of the OER–ORR bifunctional parameter and fell behind Pt–C due to its deprived performance toward the ORR. Likewise, a comparative bifunctional evaluation was performed between OER and HER as well (Fig. 10(b)). This time, the bifunctional parameter, ΔE, was evaluated at a higher current density at 50 mA cm−2 as well, along with that at the onset potential (at the third trisect of Fig. 10(c)). In both cases, HAG showed exceptional bifunctional behavior by surmounting the best Pt and Ru-based benchmark catalysts. The cost comparison between the three reinforces the fact that HAG stands the best chance for replacing the noble (Ru, Pt) and even non-noble (Ni, the current industrial catalyst for HER) metal-based catalysts to accelerate the commercial production of high-power, renewable energy-based devices (Fig. 10(d)). The data on the bifunctional behavior of all the catalysts HAG, HA, Ru–C, Pt–C, rGO and GO are given in the ESI† (Fig. S7). A comparison of the bifunctional activities of recently reported electrocatalysts between OER–HER and OER–ORR in terms of ΔE is given in the ESI† (Tables ST2 and ST3, respectively). The same has been illustrated in the form of bar diagrams as well (Fig. S8 and S9, ESI† respectively). Apart from the bifunctional parameters, Turn Over Frequency (TOF) and Mass Activity (MA) are important terminologies. TOF has been calculated for the OER and HER separately. The detailed calculation is given in the ESI.† Similarly, MA was calculated for OER, HER, and ORR separately.
4. Conclusions
A novel multi-functional sustainable electrocatalyst, HAG was proved to be highly active and exceptionally durable toward OER, ORR, and HER. HAG surpasses the benchmark catalysts Pt and Ru in their bifunctional activity. Promoting HAG as a novel electrocatalyst is very important in many senses. The most demanding and ideal criteria like economic viability, abundance, sustainability, ease of synthesizability, and multifunctionality are met in the case of the HAG electrocatalyst.To conclude, an unforeseen biomineral-reduced graphene oxide nanocomposite has been designed for enhanced hydrogen-oxygen electrochemistry. The catalytic performance and stability displayed were unprecedented in comparison to many of the reported non-metallic catalysts. HAG outperformed the Ru–C benchmark catalyst toward OER and follows a highly energy-efficient 4-electron pathway as understood using the K–L plots in the case of ORR. Although a bit inferior to Pt in the individual ORR and HER performances, HAG is proven to be unbeatable in its bifunctional/multifunctional role. Besides its catalytic brilliance, HAG is proven to be the right choice economically as well. The possible active sites, Phosphorus and calcium are yet to be verified for their roles in OER, ORR, and HER, which has not been attempted in this study. A follow-up article on the study of the mechanistic aspects of this work is forthcoming. Coincidentally, black phosphorus (BP) with a puckered 2D layer structure is reported to exhibit an interesting tunable electrical conductivity.53,54 A BP thin film is reported to show a current density of 10 mA cm−2 for OER at an applied voltage of ∼1.6 V,55 which is close to the performance of RuO2.56 However, this is inferior to that of HAG. Moreover, the role of P in catalyzing HER and ORR has also been concussively studied theoretically.57,58 Meanwhile, we assume that calcium in HAG plays a bifunctional role in water splitting based on its well-known participation in natural water splitting in green leaves.59,60 Though scarce, calcium has also been reported to promote ORR.61 Nevertheless, a dedicated theoretical study can only reveal the true role of the active sites in the HAG toward its remarkable multifunctionality.
Data availability statement
The raw/processed data required to reproduce these findings cannot be shared at this time as the data also forms part of an ongoing study.Author contributions
Zinoy Manappadan: data curation, writing-original draft, and conceptualization. Kaliaperumal Selvaraj: conceptualization, review and editing.Conflicts of interest
The authors declare no competing financial interests.Acknowledgements
This research work is supported by the grant under the CSIR-FTT project (MLP 034026 and HCP44-08). ZM acknowledges the research fellowship from UGC.References
- J. M. Anderson, J. L. Patterson, J. B. Vines, A. Javed, S. R. Gilbert and H.-W. Jun, Biphasic peptide amphiphile nanomatrix embedded with hydroxyapatite nanoparticles for stimulated osteoinductive response, ACS Nano, 2011, 5, 9463–9479, DOI:10.1021/nn203247m.
- Z. Liang, H. Guo, G. Zhou, K. Guo, B. Wang, H. Lei, W. Zhang, H. Zheng, U. P. Apfel and R. Cao, Metal–organic-framework-supported molecular electrocatalysis for the oxygen reduction reaction, Angew. Chem., Int. Ed., 2021, 60, 8472–8476, DOI:10.1002/anie.202016024.
- L. Xie, X. P. Zhang, B. Zhao, P. Li, J. Qi, X. Guo, B. Wang, H. Lei, W. Zhang, U. P. Apfel and R. Cao, Enzyme-inspired iron porphyrins for improved electrocatalytic oxygen reduction and evolution reactions, Angew. Chem., Int. Ed., 2021, 60, 7576–7581, DOI:10.1002/anie.202015478.
- S. Chu and A. Majumdar, Opportunities and challenges for a sustainable energy future, Nature, 2012, 488, 294–303, DOI:10.1038/nature11475.
- A. Morozan, B. Jousselme and S. Palacin, Low-platinum and platinum-free catalysts for the oxygen reduction reaction at fuel cell cathodes, Energy Environ. Sci., 2011, 4, 1238, 10.1039/c0ee00601g.
- K. Shimizu, L. Sepunaru and R. G. Compton, Innovative catalyst design for the oxygen reduction reaction for fuel cells, Chem. Sci., 2016, 7, 3364–3369, 10.1039/C6SC00139D.
- L. Wang, F. Song, G. Ozouf, D. Geiger, T. Morawietz, M. Handl, P. Gazdzicki, C. Beauger, U. Kaiser, R. Hiesgen, A. S. Gago and K. A. Friedrich, Improving the activity and stability of Ir catalysts for PEM electrolyzer anodes by SnO2:Sb aerogel supports: Does V addition play an active role in electrocatalysis?, J. Mater. Chem. A, 2017, 5, 3172–3178, 10.1039/C7TA00679A.
- H. N. Nong, H. Oh, T. Reier, E. Willinger, M. Willinger, V. Petkov, D. Teschner and P. Strasser, Oxide-supported IrNiOx core–shell particles as efficient, cost-effective, and stable catalysts for electrochemical water splitting, Angew. Chem., Int. Ed., 2015, 54, 2975–2979, DOI:10.1002/anie.201411072.
- R. Forgie, G. Bugosh, K. C. Neyerlin, Z. Liu and P. Strasser, Bimetallic Ru electrocatalysts for the OER and electrolytic water splitting in acidic media, Electrochem. Solid-State Lett., 2010, 13, B36, DOI:10.1149/1.3290735.
- T. Reier, M. Oezaslan and P. Strasser, Electrocatalytic oxygen evolution reaction (OER) on Ru, Ir, and Pt catalysts: A comparative study of nanoparticles and bulk materials, ACS Catal., 2012, 2, 1765–1772, DOI:10.1021/cs3003098.
- A. Bergmann, I. Zaharieva, H. Dau and P. Strasser, Electrochemical water splitting by layered and 3D cross-linked manganese oxides: Correlating structural motifs and catalytic activity, Energy Environ. Sci., 2013, 6, 2745, 10.1039/c3ee41194j.
- W. T. Hong, M. Risch, K. A. Stoerzinger, A. Grimaud, J. Suntivich and Y. Shao-Horn, Toward the rational design of non-precious transition metal oxides for oxygen electrocatalysis, Energy Environ. Sci., 2015, 8, 1404–1427, 10.1039/C4EE03869J.
- S. Dresp, F. Luo, R. Schmack, S. Kühl, M. Gliech and P. Strasser, An efficient bifunctional two-component catalyst for oxygen reduction and oxygen evolution in reversible fuel cells, electrolyzers and rechargeable air electrodes, Energy Environ. Sci., 2016, 9, 2020–2024, 10.1039/C6EE01046F.
- X. Ge, A. Sumboja, D. Wuu, T. An, B. Li, F. W. T. Goh, T. S. A. Hor, Y. Zong and Z. Liu, Oxygen reduction in alkaline media: From mechanisms to recent advances of catalysts, ACS Catal., 2015, 5, 4643–4667, DOI:10.1021/acscatal.5b00524.
- Y. Gorlin and T. F. Jaramillo, A bifunctional nonprecious metal catalyst for oxygen reduction and water oxidation, J. Am. Chem. Soc., 2010, 132, 13612–13614, DOI:10.1021/ja104587v.
- C. Hu and L. Dai, Carbon-based metal-free catalysts for electrocatalysis beyond the ORR, Angew. Chem., Int. Ed., 2016, 55, 11736–11758, DOI:10.1002/anie.201509982.
- X. Li, H. Lei, L. Xie, N. Wang, W. Zhang and R. Cao, Metalloporphyrins as catalytic models for studying hydrogen and oxygen evolution and oxygen reduction reactions, Acc. Chem. Res., 2022, 55, 878–892, DOI:10.1021/acs.accounts.1c00753.
- Y. Zhang, M. Luo, Y. Yang, Y. Li and S. Guo, Advanced Multifunctional Electrocatalysts for Energy Conversion, ACS Energy Lett., 2019, 4, 1672–1680, DOI:10.1021/acsenergylett.9b01045.
- S. Ghosh and R. N. Basu, Multifunctional nanostructured electrocatalysts for energy conversion and storage: Current status and perspectives, Nanoscale, 2018, 10, 11241–11280, 10.1039/C8NR01032C.
- G. Wu, A. Santandreu, W. Kellogg, S. Gupta, O. Ogoke, H. Zhang, H.-L. Wang and L. Dai, Carbon nanocomposite catalysts for oxygen reduction and evolution reactions: From nitrogen doping to transition-metal addition, Nano Energy, 2016, 29, 83–110, DOI:10.1016/j.nanoen.2015.12.032.
- L. Zhang, J. Xiao, H. Wang and M. Shao, Carbon-based electrocatalysts for hydrogen and oxygen evolution reactions, ACS Catal., 2017, 7, 7855–7865, DOI:10.1021/acscatal.7b02718.
- Z. Wu, P. A. Webley and D. Zhao, Post-enrichment of nitrogen in soft-templated ordered mesoporous carbon materials for highly efficient phenol removal and CO2 capture, J. Mater. Chem., 2012, 22, 11379, 10.1039/c2jm16183d.
- G. A. Ferrero, A. B. Fuertes and M. Sevilla, N-doped porous carbon capsules with tunable porosity for high-performance supercapacitors, J. Mater. Chem. A, 2015, 3, 2914–2923, 10.1039/C4TA06022A.
- Y. Gao, Q. Wang, G. Ji, A. Li and J. Niu, Doping strategy, properties and application of heteroatom-doped ordered mesoporous carbon, RSC Adv., 2021, 11, 5361–5383, 10.1039/D0RA08993A.
- S. A. M. Tofail, A. A. Gandhi, M. Gregor and J. Bauer, Electrical properties of hydroxyapatite, Pure Appl. Chem., 2015, 87, 221–229, DOI:10.1515/pac-2014-0936.
- D. Liu, K. Savino and M. Z. Yates, Microstructural engineering of hydroxyapatite membranes to enhance proton conductivity, Adv. Funct. Mater., 2009, 19, 3941–3947, DOI:10.1002/adfm.200900318.
- V. Uskoković, The role of hydroxyl channel in defining selected physicochemical peculiarities exhibited by hydroxyapatite, RSC Adv., 2015, 5, 36614–36633, 10.1039/C4RA17180B.
- G. M. Poralan, J. E. Gambe, E. M. Alcantara and R. M. Vequizo, X-ray diffraction and infrared spectroscopy analyses on the crystallinity of engineered biological hydroxyapatite for medical application, IOP Conf. Ser.: Mater. Sci. Eng., 2015, 79, 012028, DOI:10.1088/1757-899X/79/1/012028.
- A. T. Smith, A. M. LaChance, S. Zeng, B. Liu and L. Sun, Synthesis, properties, and applications of graphene oxide/reduced graphene oxide and their nanocomposites, Nano Mater. Sci., 2019, 1, 31–47, DOI:10.1016/j.nanoms.2019.02.004.
- J. R. do Nascimento, M. R. D’Oliveira, A. G. Veiga, C. A. Chagas and M. Schmal, Synthesis of reduced graphene oxide as a support for nano copper and palladium/copper catalysts for selective NO reduction by CO, ACS Omega, 2020, 5, 25568–25581 CrossRef CAS PubMed.
- N. M. Julkapli and S. Bagheri, Graphene supported heterogeneous catalysts: An overview, Int. J. Hydrogen Energy, 2015, 40, 948–979 CrossRef CAS.
- B. F. Machado and P. Serp, Graphene-based materials for catalysis, Catal. Sci. Technol., 2012, 2, 54–75 RSC.
- D. Deng, K. S. Novoselov, Q. Fu, N. Zheng, Z. Tian and X. Bao, Catalysis with two-dimensional materials and their heterostructures, Nat. Nanotechnol., 2016, 11, 218–230 CrossRef CAS PubMed.
- W. S. Hummers and R. E. Offeman, Preparation of graphitic oxide, J. Am. Chem. Soc., 1958, 80, 1339, DOI:10.1021/ja01539a017.
- S. K. Jhajharia and K. Selvaraj, Non-templated ambient nanoperforation of graphene: A novel scalable process and its exploitation for energy and environmental applications, Nanoscale, 2015, 7, 19705–19713, 10.1039/C5NR05715A.
- E. O. López, P. L. Bernardo, N. R. Checca, A. L. Rossi, A. Mello, D. E. Ellis, A. M. Rossi and J. Terra, Hydroxyapatite and lead-substituted hydroxyapatite near-surface structures: Novel modelling of photoemission lines from X-ray photoelectron spectra, Appl. Surf. Sci., 2022, 571, 151310, DOI:10.1016/j.apsusc.2021.151310.
- J. I. Langford and A. J. C. Wilson, Scherrer after sixty years: A survey and some new results in the determination of crystallite size, J. Appl. Crystallogr., 1978, 11, 102–113, DOI:10.1107/S0021889878012844.
- S. K. Jhajharia, Z. Manappadan and K. Selvaraj, Exploring battery-type ZnO/ZnFe2O4 spheres-3D graphene electrodes for supercapacitor applications: Advantage of yolk–shell over solid structures, ChemElectroChem, 2019, 6, 5819–5828, DOI:10.1002/celc.201901269.
- P. E. Timchenko, E. V. Timchenko, E. V. Pisareva, M. Y. Vlasov, L. T. Volova, O. O. Frolov and A. R. Kalimullina, Experimental studies of hydroxyapatite by Raman spectroscopy, J. Opt. Technol., 2018, 85, 130, DOI:10.1364/JOT.85.000130.
- E. O. López, A. L. Rossi, B. S. Archanjo, R. O. Ospina, A. Mello and A. M. Rossi, Crystalline nano-coatings of fluorine-substituted hydroxyapatite produced by magnetron sputtering with high plasma confinement, Surf. Coatings Technol., 2015, 264, 163–174, DOI:10.1016/j.surfcoat.2014.12.055.
- Z. Yang, J. Liu, J. Liu, X. Chen, T. Yan and Q. Chen, Investigation on physicochemical properties of graphene oxide/nano-hydroxyapatite composites and its biomedical applications, J. Aust. Ceram. Soc., 2021, 57, 625–633 CrossRef CAS.
- A. P. Grosvenor, B. A. Kobe, M. C. Biesinger and N. S. McIntyre, Investigation of multiplet splitting of Fe 2p XPS spectra and bonding in iron compounds, Surf. Interface Anal., 2004, 36, 1564–1574 CrossRef CAS.
- Y. Xin and T. Shirai, Noble-metal-free hydroxyapatite activated by facile mechanochemical treatment towards highly-efficient catalytic oxidation of volatile organic compound, Sci. Rep., 2021, 11, 1–13, DOI:10.1038/s41598-021-86992-8.
- B. Bhangare, S. Jagtap, N. Ramgir, R. Waichal, K. P. Muthe, S. K. Gupta, S. C. Gadkari, D. K. Aswal and S. Gosavi, Evaluation of humidity sensor based on PVP-RGO nanocomposites, IEEE Sens. J., 2018, 18, 9097–9104, DOI:10.1109/JSEN.2018.2870324.
- Y. Li, L. A. Zhang, Y. Qin, F. Chu, Y. Kong, Y. Tao, Y. Li, Y. Bu, D. Ding and M. Liu, Crystallinity dependence of ruthenium nanocatalyst toward hydrogen evolution reaction, ACS Catal., 2018, 8, 5714–5720, DOI:10.1021/acscatal.8b01609.
- G. Li, L. Anderson, Y. Chen, M. Pan and P.-Y. Abel Chuang, New insights into evaluating catalyst activity and stability for oxygen evolution reactions in alkaline media, Sustainable Energy Fuels, 2018, 2, 237–251, 10.1039/C7SE00337D.
- E. Fabbri, A. Habereder, K. Waltar, R. Kötz and T. J. Schmidt, Developments and perspectives of oxide-based catalysts for the oxygen evolution reaction, Catal. Sci. Technol., 2014, 4, 3800–3821, 10.1039/C4CY00669K.
- K. Huang, K. Bi, C. Liang, S. Lin, R. Zhang, W. J. Wang, H. L. Tang and M. Lei, Novel VN/C nanocomposites as methanol–tolerant oxygen reduction electrocatalyst in alkaline electrolyte, Sci. Rep., 2015, 5, 11351, DOI:10.1038/srep11351.
- E. Antolini, T. Lopes and E. R. Gonzalez, An overview of platinum-based catalysts as methanol-resistant oxygen reduction materials for direct methanol fuel cells, J. Alloys Compd., 2008, 461, 253–262, DOI:10.1016/j.jallcom.2007.06.077.
- G.-Q. Lu, W. Chrzanowski and A. Wieckowski, Catalytic methanol decomposition pathways on a platinum electrode, J. Phys. Chem. B, 2000, 104, 5566–5572, DOI:10.1021/jp000193c.
- X. Li,B. Lv, X.-P. Zhang, X. Jin, K. Guo, D. Zhou, H. Bian, W. Zhang, U.-P. Apfel and R. Cao, Introducing water-network-assisted proton transfer for boosted electrocatalytic hydrogen evolution with cobalt corrole, Angew. Chem., Int. Ed., 2022, 61, e202114310, DOI:10.1002/anie.202114310.
- L. Li, Y. Yu, G. J. Ye, Q. Ge, X. Ou, H. Wu, D. Feng, X. H. Chen and Y. Zhang, Black phosphorus field-effect transistors, Nat. Nanotechnol., 2014, 9, 372–377, DOI:10.1038/nnano.2014.35.
- H. O. H. Churchill and P. Jarillo-Herrero, Phosphorus joins the family, Nat. Nanotechnol., 2014, 9, 330–331, DOI:10.1038/nnano.2014.85.
- Q. Jiang, L. Xu, N. Chen, H. Zhang, L. Dai and S. Wang, Facile synthesis of black phosphorus: An efficient electrocatalyst for the oxygen evolving reaction, Angew. Chem., Int. Ed., 2016, 55, 13849–13853, DOI:10.1002/anie.201607393.
- H. Lei, Q. Zhang, Z. Liang, H. Guo, Y. Wang, H. Lv, X. Li, W. Zhang, U.-P. Apfel and R. Cao, Metal-corrole-based porous organic polymers for electrocatalytic oxygen reduction and evolution reactions, Angew. Chem., Int. Ed., 2022, 61, e202201104, DOI:10.1002/anie.202201104.
- N.-T. Suen, S.-F. Hung, Q. Quan, N. Zhang, Y.-J. Xu and H. M. Chen, Electrocatalysis for the oxygen evolution reaction: Recent development and future perspectives, Chem. Soc. Rev., 2017, 46, 337–365, 10.1039/C6CS00328A.
- R. B. Wexler, J. M. P. Martirez and A. M. Rappe, Active role of phosphorus in the hydrogen evolving activity of nickel phosphide (0001) surfaces, ACS Catal., 2017, 7, 7718–7725, DOI:10.1021/acscatal.7b02761.
- X. Zhang, Z. Lu, Z. Fu, Y. Tang, D. Ma and Z. Yang, The mechanism of oxygen reduction reaction on phosphorus doped graphene: A first-principle study, J. Power Sources, 2015, 276, 222–229, DOI:10.1016/j.jpowsour.2014.11.105.
- V. K. Yachandra and J. Yano, Calcium in the oxygen-evolving complex: Structural and mechanistic role determined by X-ray spectroscopy, J. Photochem. Photobiol., B, 2011, 104, 51–59, DOI:10.1016/j.jphotobiol.2011.02.019.
- J. Sun, S. Li, Q. Zhao, C. Huang, Q. Wu, W. Chen, Q. Xu and W. Yao, Atomically confined calcium in nitrogen-doped graphene as an efficient heterogeneous catalyst for hydrogen evolution, iScience, 2021, 24, 102728 CrossRef CAS PubMed.
- N. N. Tham, X. Ge, A. Yu, B. Li and Y. Z. Z. Liu, Porous calcium–manganese oxide/carbon nanotube microspheres as efficient oxygen reduction catalysts for rechargeable zinc–air batteries, Inorg. Chem. Front., 2021, 8, 2052–2060 RSC.
Footnote |
| † Electronic supplementary information (ESI) available. See DOI: https://doi.org/10.1039/d2ya00153e |
| This journal is © The Royal Society of Chemistry 2022 |

