 Open Access Article
Creative Commons Attribution 3.0 Unported Licence
Influence of pH-neutral lithium polystyrenesulfonate polyelectrolyte on the energy band structure and performance of organic solar cells†
Merve Nur
Ekmekci
a,
Ju Hwan
Kang
 a,
Yeasin
Khan
ab,
Jung Hwa
Seo
 *a and
Bright
Walker
 *b
*b
aDepartment of Semiconductors and Chemical Engineering (BK21 FOUR), Dong-A University, Busan, 49315, Republic of Korea. E-mail: seojh@dau.ac.kr
bDepartment of Chemistry, Kyung Hee University, Seoul, 02453, Republic of Korea. E-mail: walker@khu.ac.kr
First published on 7th January 2022
Abstract
Poly(3,4-ethylenedioxythiophene):polystyrene sulfonate (PEDOT:PSS) is used ubiquitously in organic solar cell (OSC) devices, however, it is not clear how the anionic PSS component by itself affects the band structure of OSCs. In this contribution, we’ve conducted a detailed investigation of the pH-neutral lithium salt of PSS (Li:PSS) and mixtures of Li:PSS with PEDOT:PSS and their effect on the energy band structure and performance of OSCs. There is currently a need for transparent and pH neutral hole transport layer (HTL) materials in the context of OSCs, and Li:PSS itself is a solution-processable, transparent and pH-neutral polyelectrolyte that was found to function as an HTL in OSCs as a thin interfacial layer. Atomic force microscopy measurements reveal smooth films with reduced root-mean-square roughness compared to PEDOT:PSS. Electronic band structures at the interface between Li:PSS based HTLs and the active layer were determined and compared to PEDOT:PSS, revealing low hole injection barriers and a p-type band in the active layer at the HTL interface. These effects are consistent with the improved current density and high efficiency (up to 8.33%) observed in devices using mixtures of Li:PSS and PEDOT:PSS.
Introduction
Solar cells are one of the most environmentally conscientious methods of producing electricity due to the practically limitless energy produced by the sun along with their low maintenance and lack of pollution after being installed. In the context of renewable energy sources, organic solar cells (OSCs) are an emerging technology with comparatively easy device fabrication requirements and excellent potential for mass-production.1,2 Like other solar cells, OSCs generate electrical energy via absorption of sunlight in their active layers,3–5 and efficient devices incorporate interfacial layers such as electron transport layers (ETLs) or a hole transport layer (HTL) adjacent to the active layer to extract negative and positive charges, respectively, with minimal losses. Like the active layers in OSCs, it is desirable for HTLs and ETLs to be based on economical and solution-processable materials and new materials and architectures are constantly being developed.6Increasing interest in organic solar cells has driven remarkable advances in the discovery of new materials and devices with high-performance architectures; a wide array of new HTL and ETL materials have emerged in the past few years and contributed to improvements in device efficiency.7,8 Compared to the wide variety of ETLs that have been reported, a comparatively limited number of HTL types are known to be effective in conventional structure OSCs.9
Poly(3,4-ethylenedioxythiophene):polystyrene sulfonate (PEDOT:PSS) is most often used as an HTL in conventional structure OSCs.10–12 It has several advantages including water solubility, facile solution processability and low-temperature fabrication.13 However, the material possesses both advantages and disadvantages. Its work function (WF) is not high enough for many active layers14–16 and may lead to recombination losses at the anode. Additionally, it has an acidic nature17 and low transparency which leads to decreased light absorption in the active layer and reduced current density. The acidic surface can damage the active layer surface in contact with PEDOT:PSS18,19 and also may corrode the transparent, indium tin oxide (ITO) electrode.20
These disadvantages highlight the need for an improved alternative.21 Several alternative HTL materials have been investigated, however, the performance of alternative HTLs has generally lagged behind PEDOT:PSS. For instance, one of the most successful HTLs called “CPE-K” has yielded up to 8.0% PCE in poly [[4,8-bis[(2-ethylhexyl)oxy]benzo[1,2-b:4,5-b′]dithiophene-2,6-diyl][3-fluoro-2-[(2-ethylhexyl) carbonyl] thieno[3,4-b]thiophenediyl]] (PTB7) based devices using MeOH/Ca/Al as a cathode. Due to its homogeneous conductivity and pH neutrality, it showed a better performance than PEDOT:PSS.22 Besides conjugated polyelectrolytes, metal oxides such as NiOx, MoO3 and V2O5 have been used successfully as HTLs.23–27 However, only the power conversion efficiencies (PCEs) of MoO3 devices have been consistently greater than PEDOT:PSS. Graphene oxides (GOs) used below PEDOT:PSS have been reported.28–31 These devices together with PEDOT:PSS have yielded efficiencies of up to 7.1% over the years with different active layer compositions. Additionally, copper sulfide (CuS), copper bromide (CuBr) and nickel sulphide (NiS) have been studied as solution-processable HTLs in conventional device architectures.32–34 Efficiencies of these inorganic HTLs were reported as 4.32% and 5.07%, respectively.
Recently, there have been reports of solution-processable anodic buffer layers, alone and in combination with PEDOT:PSS.35 Even though these materials were able to exhibit higher WFs than PEDOT:PSS, they have not often been able to produce higher efficiencies.
In this work, we investigate the role of the anionic polyelectrolyte, PSS, in OSC HTLs using the relatively inert Li+ salt of PSS (Li:PSS) and mixtures of this pH-neutral polyelectrolyte with PEDOT:PSS. This study explores the effect of Li:PSS on the characteristics of HTLs comprising Li:PSS and Li:PSS/PEDOT:PSS mixtures, their effect on the electronic band structure of OSC devices at the Li:PSS/PTB7 interface and ultimately, on OSC performance and stability. From the measured energy level alignment, critical parameters of OSCs such as hole injection barrier, electron injection barrier, and the presence or absence of p-type doping and band-bending were quantified to achieve a detailed understanding of OSC behavior with these interlayers.
Experimental details
Li:PSS synthesis
Li:PSS was prepared by the reaction between Li2CO3 (0.60 g, 3.25 mmol) and a commercial solution of polystyrene sulfonic acid (HPSS, Aldrich, 75 kD molecular weight (MW), 3 mmol based on the monomer MW). Briefly, Li2CO3 was dispersed in 2 ml H2O in a 10 ml vial with a magnetic stir bar and HPSS was slowly added, causing the mixture to bubble vigorously consistent with the release of CO2. After the bubbles stopped, the mixture was shaken vigorously and allowed to stand overnight. The solution was filtered through a 0.45 μm cellulose acetate syringe filter and precipitated into isopropanol (IPA). Several drops of hexane were added to help break the milky colloid which formed. The mixture was centrifuged, and the supernatant liquid discarded. The polymer was re-dissolved in 10 ml of methanol and filtered through a 0.45 μm PTFE filter to remove excess unreacted Li2CO3. The clear solution was precipitated into ethyl acetate, hexane was added to help break the milky colloid, and a small amount of solid polymer separated upon centrifuging the colloid. The precipitated polymer was washed with IPA and hexane, then dried in a nitrogen glove box. The pH of a solution (2.1 mg/5 ml H2O) was 7.2. 75 mg was recovered.Device fabrication (conventional structure)
ITO substrates were cleaned in deionized water, acetone, and IPA respectively by ultra-sonication for 20 minutes each. The ITO substrates were further cleaned by UV-ozone treatment for 10 minutes to remove trace organic residue and dried in an oven at 80 °C overnight. Conventional OSCs were fabricated on the ITO substrates by sequentially depositing an HTL, active layer and ETL respectively and the Al electrodes. HTLs were deposited by spin coating different HTL solutions for 30 seconds at 2000 rpm. For single-layer solutions, Li:PSS was prepared in methanol with different concentrations (0.005–0.035 wt%), spin-coated and dried on a hot plate for 10 minutes at 80 °C. Li:PSS mixtures with PEDOT:PSS were also investigated. Table S1 in the ESI† describes the composition of each HTL used in this study. In all cases, solutions were prepared by diluting with deionized water as PEDOT:PSS is a water-based solution. Mixed Li:PSS/PEDOT:PSS HTLs were spin cast using mixed solutions as described and dried on a hot plate in air at 120 °C. After HTL deposition, samples were brought inside a nitrogen-filled glove box and all subsequent fabrication steps were carried out in the absence of air. Bulk heterojunction active layer solutions were prepared one night before and allowed to stir at 45 °C on a hot plate over-night. PTB7![[thin space (1/6-em)]](https://www.rsc.org/images/entities/char_2009.gif) :
:![[thin space (1/6-em)]](https://www.rsc.org/images/entities/char_2009.gif) [6,6]-phenyl-C71-butyric acid methyl ester (PC71BM) solutions (1
[6,6]-phenyl-C71-butyric acid methyl ester (PC71BM) solutions (1![[thin space (1/6-em)]](https://www.rsc.org/images/entities/char_2009.gif) :
:![[thin space (1/6-em)]](https://www.rsc.org/images/entities/char_2009.gif) 1.5 ratio) were prepared in chlorobenzene solvent with a 3% DIO additive.36 These were spin-coated on top of the HTLs at 1300 rpm for 45 seconds and dried for 10 minutes on a hot plate at 80 °C. Then, ETLs comprising poly(9,9-bis(3′-(N,N-dimethyl)-N-ethylammonium-propyl-2,7-fluorene)-alt-2,7-(9,9-dioctylfluorene))dibromide (PFN+Br−) (Sigma, 0.1 wt%) were deposited using solutions in methanol solvent and spin-coated at 2000 rpm for 40 seconds. The films were dried for 10 minutes on a hot plate at 60 °C.37,38 Finally, the devices were transferred to a vacuum chamber and Al cathodes (100 nm) were deposited by thermal evaporation under vacuum (about 10−6 Torr).
1.5 ratio) were prepared in chlorobenzene solvent with a 3% DIO additive.36 These were spin-coated on top of the HTLs at 1300 rpm for 45 seconds and dried for 10 minutes on a hot plate at 80 °C. Then, ETLs comprising poly(9,9-bis(3′-(N,N-dimethyl)-N-ethylammonium-propyl-2,7-fluorene)-alt-2,7-(9,9-dioctylfluorene))dibromide (PFN+Br−) (Sigma, 0.1 wt%) were deposited using solutions in methanol solvent and spin-coated at 2000 rpm for 40 seconds. The films were dried for 10 minutes on a hot plate at 60 °C.37,38 Finally, the devices were transferred to a vacuum chamber and Al cathodes (100 nm) were deposited by thermal evaporation under vacuum (about 10−6 Torr).
Characterization
Current density–voltage (J–V) measurements were collected using a Keithley 2635 source measure unit inside a nitrogen-filled glove-box using a high-quality optical fiber to guide the light from a xenon arc lamp to the solar cell devices. The solar cell devices were illuminated with a light intensity of 100 mW cm−2 calibrated using a standard silicon reference cell immediately prior to testing. External quantum efficiency (EQE) measurements were carried out using a QEX7 system manufactured by PV Measurements, Inc. Atomic force microscopy (AFM) images were obtained using an INOVA Multimode microscope operating in tapping mode. Ultraviolet and X-ray photoelectron spectroscopy (UPS and XPS, respectively) spectra were obtained using a Thermo Fischer Scientific ESCALB 250XI.Results and discussion
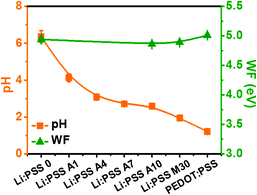
One of the motivations to explore Li:PSS as an HTL material is due to its reduced acidity compared to PEDOT:PSS, which is ubiquitously used in conventional structure OSCs. We anticipated that the reduced acidity of Li:PSS would prolong the stability of OSCs by eliminating acid-mediated degradation mechanisms which are known to occur at the interface between an HTL and active layer in typical OSCs. Fig. S1a of the ESI† illustrates the results of pH paper tests for all of the different types of HTL solutions used in this study. The pH of PEDOT:PSS was measured to be 1.21, which is sufficiently acidic to damage ITO over time, whereas the pH of a 0.005 wt% Li:PSS solution was 6.36, close to the pH of the de-ionized water used to make it (6.80) and very close to neutral. The pH of Li:PSS mixtures ranged from 1.50 (for “Li:PSS M70”; 70% PEDOT:PSS) to 2.53 (“Li:PSS M10”; 10% PEDOT:PSS). Using small amounts of PEDOT:PSS as an additive in Li:PSS resulted in pH values ranging from 2.39 (for “Li:PSS A16”; 13.8% PEDOT:PSS) to 4.13 (for “Li:PSS A1”; lower than 1% PEDOT:PSS). Thus, the pH became more neutral as the proportion of Li:PSS increased and as the proportion of PEDOT:PSS decreased. A summary of pH values and WFs (taken from UPS data, discussed in detail later) is seen in Fig. 1, and a table of compositions and their measured pH values, as well as pictures of the pH test strips used for each solution, are included in the ESI† (Table S1 and Fig. S1(a), respectively, ESI†). It has been reported in the literature39 that acidic HTLs have a higher WF at their surfaces than non-acidic HTLs, however, we observed that the WF values for Li:PSS and all combinations of Li:PSS and PEDOT mixtures were in the range of 4.86 to 4.94 eV, similar, or slightly lower than the value measured for PEDOT:PSS (5.01).To investigate the effect of acidity on the stability of PTB7 films, we monitored the absorption of PTB7 films in different environments with variable acidity. PTB7 films become bleached and transparent as they degrade over time. The relationship between pH values and time-dependent degradation of PTB7 thin films was investigated by UV-visible absorbance spectroscopy (Fig. S1(b)–(e), ESI†). We observed that the visible absorbance of PTB7 decreased with decreasing pH values due to chemical degradation of the conjugated π-system in the polymer. To quantify the degradation, the intensity of the maximum absorption band at 705 nm was monitored over time. PTB7 films on glass substrates exposed to ambient air lost 23.3% of their original optical density after 4 weeks (27 days). When the PTB7 films were immersed in 2 M HCl, they completely degraded (0% of their original absorption) within only 3 days illustrating the instability of PTB7 to acid. Commercial PEDOT:PSS contains a significant proportion of styrene sulfonic acid groups. We compared the degradation of PTB7 exposed to dilute polystyrene sulfonic acid (H:PSS) and Li:PSS solutions with the same concentration; exposure to a 0.1 wt% HPSS solution (5.4 mM) caused the films to lose 84.0% of their original optical density over 27 days, while exposure to 0.1 wt% Li:PSS resulted in only a 54.4% decrease in optical density, showing that Li:PSS solutions are much less deleterious to PTB7 films than HCl or HPSS, which is present in PEDOT:PSS.
Similar experiments were carried out with PTB7 films deposited on solid films of ITO, PEDOT:PSS, H:PSS and Li:PSS. After 24 days, the PTB7 film on Li:PSS showed the smallest decrease in optical density (24.9% decrease), while films on ITO, H:PSS and PEDOT:PSS showed 32.7, 29.6 and 38.2% decreases in optical density over the same period. These results illustrate that PTB7 films deposited on pH-neutral, Li:PSS polyelectrolyte films are relatively stable compared to PTB7 films on ITO, HPSS or PEDOT:PSS substrates.
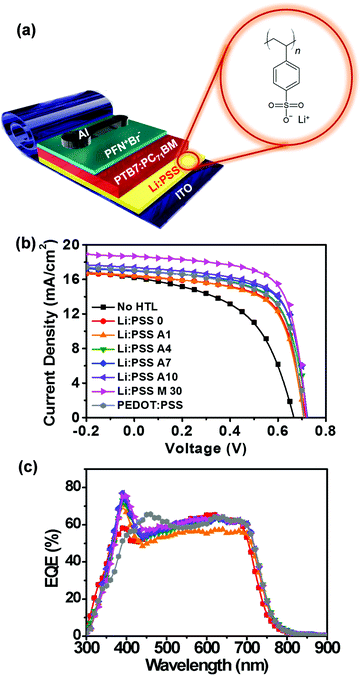
Fig. 2a shows a schematic diagram representing the architecture of the solar cell devices used in this study (ITO/Li:PSS/PTB7:PC71BM/PFN+Br−/Al) along with the chemical structure of Li:PSS. In this architecture, the active layer (PTB7:PC71BM) absorbs sunlight to generate excitons, which separate into mobile electrons and holes via photoinduced electron transfer between PTB7 and PC71BM.3 The PFN+Br− ETL facilitates electron migration to the cathode (Al), while the HTL facilitates hole migration to the anode (ITO).
The J–V curves for the best performing devices are shown in Fig. 2(b), and the average parameters, including standard deviations, are summarized in Table 1. In addition, detailed photovoltaic performance both under simulated solar light and in the dark, and EQE spectra can be found in the ESI† (Fig. S2 and S3, respectively, ESI†). Reference devices without any HTL exhibited 5.01% efficiency with a short-circuit current density (JSC) of 15.00 mA cm−2, an open-circuit voltage (VOC) of 0.68 V, and a fill factor (FF) of 48.71%. In contrast, a single layer Li:PSS layer showed an average PCE of 5.93% efficiency, including a JSC of 16.84 mA cm−2, VOC of 0.63 and FF of 55.63%. The champion device was found to be the device using the Li:PSS M30 HTL; this device yielded a PCE of 8.33%, a JSC of 17.17 mA cm−2, a VOC of 0.73, and a FF of 65.60%, as shown in Table 1. The device with Li:PSS A10 showed a similar efficiency of 8.32%, including a JSC of 17.17 mA cm−2, VOC of 0.74, and a FF of 65.17%. The composition of Li:PSS A10 is a very close to that of Li:PSS M10, thus, it is not surprising that the Li:PSS M10 devices showed a similar performance including a PCE of 8.17%, as summarized in Table S2 of the ESI.†
| HTL | J SC (mA cm−2) | Spectral JSC (mA cm−2) | V OC (V) | FF (%) | PCE (%) | Champion PCE (%) |
|---|---|---|---|---|---|---|
| No HTL | 15.00 ± 2.00 | 12.57 | 0.68 ± 0.02 | 48.72 ± 7.23 | 5.01 ± 1.26 | 5.23 |
| Li:PSS 0 | 16.84 ± 0.62 | 13.67 | 0.63 ± 0.05 | 55.63 ± 1.73 | 5.93 ± 0.55 | 6.87 |
| Li:PSS A1 | 16.37 ± 0.57 | 16.50 | 0.61 ± 0.08 | 55.21 ± 8.41 | 5.50 ± 1.48 | 7.21 |
| Li:PSS A4 | 16.79 ± 0.72 | 17.35 | 0.66 ± 0.06 | 57.15 ± 5.54 | 6.43 ± 1.13 | 7.96 |
| Li:PSS A7 | 16.83 ± 0.78 | 17.46 | 0.73 ± 0.03 | 62.85 ± 4.91 | 7.73 ± 0.84 | 8.57 |
| Li:PSS A10 | 17.17 ± 0.76 | 17.72 | 0.74 ± 0.01 | 65.17 ± 2.27 | 8.32 ± 0.44 | 8.99 |
| Li:PSS M30 | 17.17 ± 0.82 | 17.87 | 0.73 ± 0.01 | 65.60 ± 2.27 | 8.33 ± 0.53 | 9.23 |
| PEDOT:PSS | 16.99 ± 0.76 | 14.47 | 0.73 ± 0.02 | 64.51 ± 2.85 | 8.09 ± 0.61 | 8.63 |
EQE spectra corresponding to these devices are presented in Fig. 2c. The spectral JSC values were calculated by integrating the area under the EQE curves and are also summarized in Table 1, with additional details in Table S2 and Fig S3 of the ESI.† The JSC values of the devices with Li:PSS A10 and Li:PSS M30 HTLs were consistent with the spectral JSC from EQE. However, the reference devices without HTLs and devices with ultra-thin neat Li:PSS films showed lower spectral JSC values, which appears to have been due to sample degradation during EQE spectra acquisition. As checked in Table 1, even the devices with the pristine PEDOT:PSS decreased in spectral JSC from 17.31 mA cm−2 to 14.47 mA cm−2. Devices with Li:PSS 0, Li:PSS A10 and Li:PSS M30 HTLs had a peak at 390 nm, especially for the device with Li:PSS M30 reaching almost 80% as shown in Fig. S3 in the ESI.† The devices with Li:PSS A10 and Li:PSS M30 have an intermediate response in the range of 500 to 700 nm, with an average value of 64%. On the other hand, Li:PSS alone has a lower response with an average value of 60%.
In order to understand the influence of film morphology on the film properties, AFM was conducted. Surface topography images of the polyelectrolyte films are presented in Fig. 3 and more detailed topographic images including different scan sizes can be found in Fig. S4–S5 of the ESI.† All of the films showed relatively amorphous surface morphologies with no prominent structural features. These very thin Li:PSS films and Li:PSS A4 films have a surface structure similar to ITO itself.40 The root mean square (RMS) of the surface roughness of all the films was in the range of 0.72 to 1.76 nm, which may be considered smooth enough for use as an HTL in solar cell devices. The neat Li:PSS films had an RMS roughness of 0.74 nm, while PEDOT:PSS alone had an RMS roughness of 1.06 nm and the roughness of the mixed films generally tended to be rougher with increasing PEDOT:PSS content.
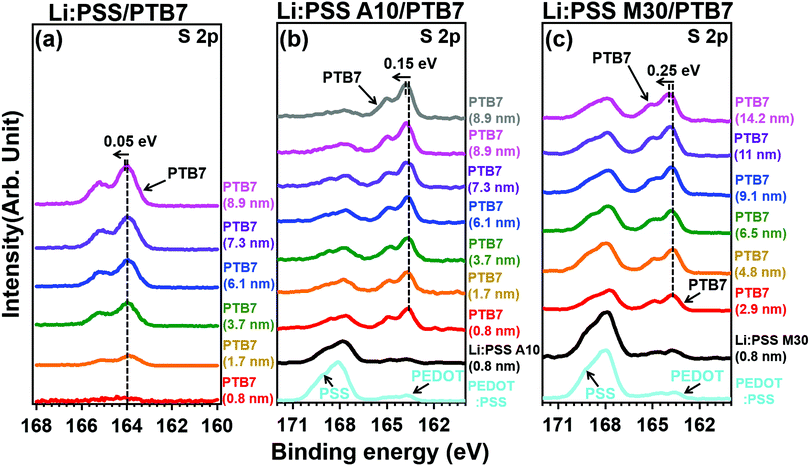 | ||
| Fig. 3 XPS of S 2p spectra of PTB7 films with a different thickness deposited on top of (a) Li:PSS, (b) Li:PSS 10 and (c) Li:PSS 70 substrates. | ||
Photoelectron spectroscopy including XPS and UPS were used to probe the chemical bonding states and electronic band structure of the films. Fig. 4 shows the sulfur 2p peaks in XPS for representative single layer Li:PSS, additive and mixture type HTLs. Carbon peaks are shown in the ESI† (Fig. S6, ESI†) while changes in the secondary edge of the UPS spectra and the sulfur 2p peaks (XPS) can be seen in greater detail in Fig. S7(a) and (b), respectively (ESI†). The sulfur atom in the thiophene ring of PEDOT gives characteristic S 2p features between 162 and 166 eV while the sulfur atom in PSS occurs at 167.95 eV. Li:PSS alone shows only a strong peak at 168.75 (Fig. S7(b), ESI†). PEDOT:PSS shows both of these features, while representative Li:PSS, Li:PSS A10 and Li:PSS M30 films show relatively stronger PSS features. PTB7 was deposited on top of the HTLs with incrementally increasing thickness to observe how the photoelectron spectra of PTB7 change going away from the HTL interface. As the PTB7 thickness increases from 2.9 to ∼10 nm, the signals for the HTL become attenuated and the spectra become dominated by the strong thiophene signal generated by PTB7. Around 164 eV, corresponding to sulfur in thiophene rings, there are shifts in all devices as the PTB7 thickness increases. The neat Li:PSS devices showed only a 0.05 eV shift. Additionally, the additive and PEDOT:PSS rich mixtures exhibited 0.15 and 0.25 eV shifts to higher binding energy. These shifts also occurred in the C1s spectra (Fig. S6, ESI†) and indicate band-bending in the PTB7 phase at the HTL interface.
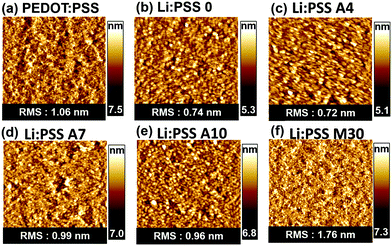 | ||
| Fig. 4 Surface topographic AFM images (size: 5 μm x 5 μm) for (a) PEDOT:PSS, (b) Li:PSS, (c) Li:PSS 4, (d) Li:PSS 7, (e) Li:PSS 10, and (f) Li:PSS 70 films. | ||
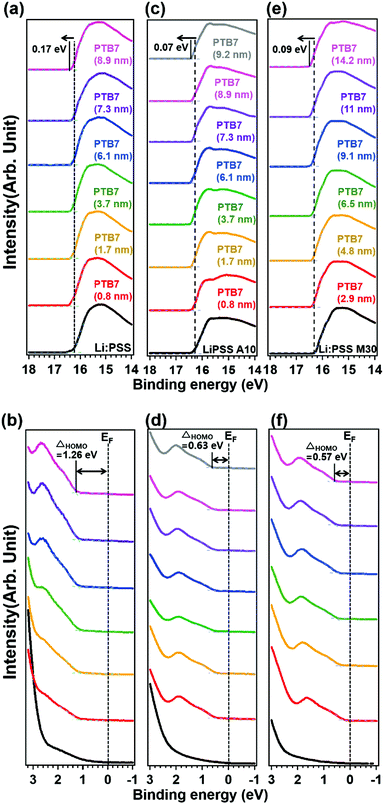
In Fig. 5, UPS spectra of the PTB7, Li:PSS, Li:PSS A10 and Li:PSS M30 samples are shown. The WF is the minimum energy required to extract an electron completely from the surface and is calculated by subtracting the secondary edge position (ESE) from the incident photon energy (WF = hv − ESE). The WFs of these devices assessed by UPS are 4.94, 4.86 and 4.81 eV, respectively. Also, by adding the WF and the highest occupied molecular orbital (HOMO) onset values, ionization potentials (IP) were calculated22,41 and found to be 6.02, 5.42 and 5.20 eV, for Li:PSS, Li:PSS A10 and Li:PSS M30, respectively. IP can be thought of as the distance between the vacuum level (Evac) and the HOMO of the donor.2
The electron affinity (EA) is the energy released when an electron is added, and is located between the band edge of the lowest unoccupied molecular orbital (LUMO) level and Evac. EAs for Li:PSS, Li:PSS A10 and Li:PSS M30 were found to be 4.34, 3.74 and 3.52 eV, respectively. The WFs of the HTLs were extracted from UPS analysis and calculated as 4.94, 4.86, and 4.81 eV for Li:PSS, Li:PSS A10, and Li:PSS M30, respectively. HTLs that have high WFs are able to extract the electrons from the active layer effectively.42
Energy band diagrams showing the band bending effect at Li:PSS/PTB7 interfaces were prepared using values extracted from XPS and UPS data as described above. These diagrams are shown in Fig. 6. The band-bending represents a decrease in the Fermi energy (EF), and relative decrease (increase) in the equilibrium concentration of electrons (holes) in the PTB7 layer, which is representative of p-type doping.22
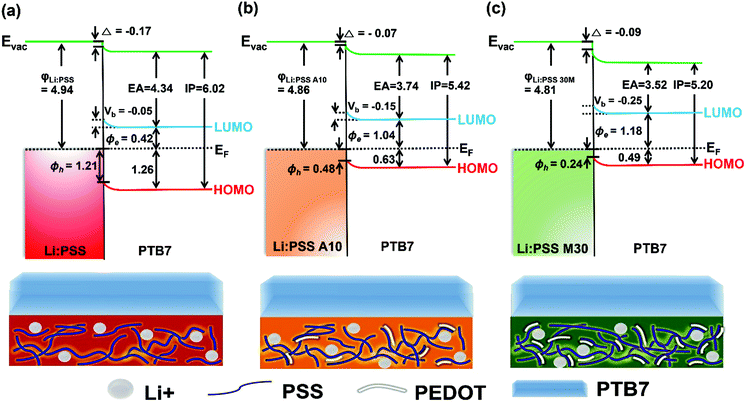 | ||
| Fig. 6 Energy band diagrams for the anode interface with (a) Li:PSS, (b) Li:PSS A10, and (c) Li:PSS M30/PTB7. | ||
Band-bending shifts (Vb) were confirmed by the shifts in the S 2p and C 1s XPS peaks at 164 eV and 284 eV, respectively (Fig. 4 and Fig. S6, ESI†). Fig. 4(a) shows that the Li:PSS S 2p peaks shifted by 0.05 eV to a higher binding energy, while in Fig. 4(b) and (c) Li:PSS A10 and Li:PSS M30 shifted by 0.15 and 0.25 eV, respectively. These increasing shifts in XPS spectra correlate with Vb. The interfacial dipole (Δ) value, which is calculated by the difference between WFs, increases with increasing Vb in devices. These features make a continuous transition between Li:PSS surfaces and the active layer, creating a permanent electric field near the anode which attracts holes while repelling electrons, the same type of band-bending that was expected using an anionic polyelectrolyte.43 In addition to the band bending effect, hole injection barriers (Φh) also determine the behavior of holes at the anode;44–46 where lower Φh values are equivalent to lower energetic barriers to hole extraction and correlate to a higher current density in OSCs. The Φh is the difference between the EF and HOMO level. A minimum value of 0.24 eV was observed for the Li:PSS M30 HTL, as shown in Fig. 6(c). The Φh of Li:PSS was found to be 1.21 eV and for Li:PSS A10 was 0.48 eV. Thus, as expected, Li:PSS M30 devices exhibited the lowest Φh, and the strongest band bending effect, consistent with this HTL yielding the highest OSC performance.
The energy change with respect to EF and Vb can clearly be seen in Fig. 7 as the PTB7 film thickness increases away from the HTL interface. In this diagram, EF is fixed at a value of 0 eV and the IP and EA (equivalent to valence and conduction band energies) are plotted relative to this at increasing distance from the HTL interface. The EA and IP for all HTLs slope downward away from the HTL interface, driving electrons to the right and holes to the left, equivalent to a p-doped junction. As the thickness of PTB7 increases, the Li:PSS electron injection barrier (Φe) drops to 0.42 eV, but the Φh increases, moving away from the EF, to a value of 1.21 eV. Li:PSS A10 and Li:PSS M30, however, show a much larger Φe and much smaller Φh, together with greater slopes in the EA and IP. The values of Φe were determined to be 1.04 eV for Li:PSS A10 and 1.18 eV for Li:PSS M30, while the Φh remained low which was 0.48 eV for Li:PSS A10 and 0.24 eV for Li:PSS M30. In summary, the increased slope in IP, decreased Φh and increased Φe facilitate the drift of holes toward the anode, a small hole extraction barrier and an increased electron blocking effect, consistent with the highest device performance being observed in the Li:PSS A10 and Li:PSS M30 HTLs.
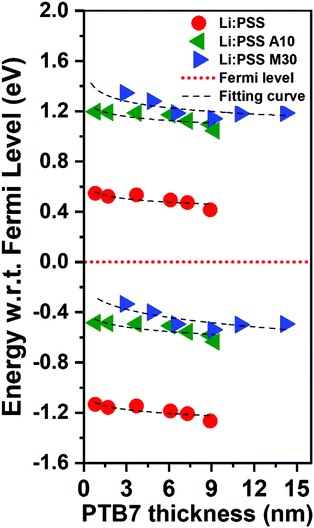 | ||
| Fig. 7 Energy band structure relative to the Fermi level based on the changes in EA (top half) and IP (bottom half). | ||
Conclusions
PEDOT:PSS is among the most widely used HTLs in the context of OSCs due to its relatively good performance as an HTL. However, it's not clear how much the anionic polyelectrolyte component (PSS) contributes to its effect on the electronic band structure. This study sheds light on the relative role of the anionic PSS component through the investigation of the neutral polyelectrolyte Li:PSS and mixtures of Li:PSS with PEDOT:PSS as HTLs when used in combination with the benchmark organic active layer PTB7:PC71BM.We show that the anionic polyelectrolyte Li:PSS has an appreciable effect on the electronic band structure of PTB7 relative to no HTL. It causes a p-type band bending effect at the anode interface even without PEDOT, and moreover, can be mixed in various proportions with PEDOT:PSS, allowing the pH of mixtures to be adjusted from 1.2 for pure PEDOT:PSS through the range of 1.5 to 4.1 for mixtures of Li:PSS and PEDOT:PSS that show comparable or slightly improved performance compared to PEDOT:PSS alone. Using 2 nm thickness Li:PSS as a single layer HTL resulted in a PCE of 5.93%, while the performance in Li:PSS M30 and Li:PSS A10 mixtures was found to be 8.33% and 8.32%, respectively. Over time, we observed that the efficiency with these mixed HTLs did not decrease as much as PEDOT:PSS. Higher transparency is a desirable feature in the HTLs of OSCs,48,49 benefiting light transmission to the active layer.47 Li:PSS has no visible absorption features (ESI,† Fig. S8), giving it ∼3% higher transparency throughout the visible spectrum (250–800 nm) and less parasitic absorption than PEDOT:PSS. Additionally, Li+ has a lower ionic conductivity compared to H+, thus it may reduce instability due to ionic motion compared to PEDOT:PSS.50 Furthermore, UPS and XPS studies revealed a reduction of Φh and p-type band bending effect which correlated with an increase in JSC.37,44 These data shed light on the role that the anionic PSS polyelectrolyte plays in determining the electronic band structure of OSC devices and provides a route to decrease the acidity and improve the stability of HTLs.
Conflicts of interest
There are no conflicts to declare.Acknowledgements
This research was supported by the National Research Foundation (NRF) of Korea (2017R1A2B2012971, 2019K1A3A7A09101449, 2020R1F1A1075539, 2021R1C1C2011757 and 2020H1D3A1A02081526).Notes and references
- J. H. Seo, A. Gutacker, Y. Sun, H. Wu, F. Huang, Y. Cao, U. Scherf, A. J. Heeger and G. C. Bazan, J. Am. Chem. Soc., 2011, 133, 8416–8419 CrossRef CAS PubMed.
- S. Günes, H. Neugebauer and N. S. Sariciftci, Chem. Rev., 2007, 107, 1324–1338 CrossRef PubMed.
- J. D. Servaites, M. A. Ratner and T. J. Marks, Energy Environ. Sci., 2011, 4, 4410 RSC.
- G. Dennler, M. C. Scharber and C. J. Brabec, Adv. Mater., 2009, 21, 1323–1338 CrossRef CAS.
- M. C. Scharber and N. S. Sariciftci, Prog. Polym. Sci., 2013, 38, 1929–1940 CrossRef CAS PubMed.
- B. Walker, H. Choi and J. Y. Kim, Curr. Appl. Phys., 2017, 17, 370–391 CrossRef.
- O. O. Amusan, H. Louis, S. Zafar, A. T. Hamzat and D. M. Peter, Chem. Method., 2019, 3, 425–441 CAS.
- R. Bhargav, S. P. Gairola, A. Patra, S. Naqvi and S. K. Dhawan, Opt. Mater., 2018, 80, 138–142 CrossRef CAS.
- H. Xu, X. Fu, X. Cheng, L. Huang, D. Zhou, L. Chen and Y. Chen, J. Mater. Chem. A, 2017, 5, 14689–14696 RSC.
- H. Shi, C. Liu, Q. Jiang and J. Xu, Adv. Electron. Mater., 2015, 1, 1–16 Search PubMed.
- Y. Wen and J. Xu, J. Polym. Sci., Part A: Polym. Chem., 2017, 55, 1121–1150 CrossRef CAS.
- X. Fan, W. Nie, H. Tsai, N. Wang, H. Huang, Y. Cheng, R. Wen, L. Ma, F. Yan and Y. Xia, Adv. Sci., 2019, 6, 1900813 CrossRef CAS PubMed.
- X. Bao, J. Wang, Y. Li, D. Zhu, Y. Wu, P. Guo, X. Wang, Y. Zhang, J. Wang, H. L. Yip and R. Yang, Adv. Mater. Interfaces, 2017, 4, 1–9 Search PubMed.
- Z. Li, Y. Liang, Z. Zhong, J. Qian, G. Liang, K. Zhao, H. Shi, S. Zhong, Y. Yin and W. Tian, Synth. Met., 2015, 210, 363–366 CrossRef CAS.
- Q. Wang, C. C. Chueh, M. Eslamian and A. K. Y. Jen, ACS Appl. Mater. Interfaces, 2016, 8, 32068–32076 CrossRef CAS PubMed.
- K. M. Kim, S. Ahn, W. Jang, S. Park, O. O. Park and D. H. Wang, Sol. Energy Mater. Sol. Cells, 2018, 176, 435–440 CrossRef CAS.
- B. Y. Kadem, M. Al-Hashimi, A. S. Hasan, R. G. Kadhim, Y. Rahaq and A. K. Hassan, J. Mater. Sci.: Mater. Electron., 2018, 29, 19287–19295 CrossRef CAS.
- L. Yin, Z. Zhao, F. Jiang, Z. Li, S. Xiong and Y. Zhou, Org. Electron., 2014, 15, 2593–2598 CrossRef CAS.
- L. M. Chen, Z. Hong, G. Li and Y. Yang, Adv. Mater., 2009, 21, 1434–1449 CrossRef CAS.
- T. Yang, M. Wang, C. Duan, X. Hu, L. Huang, J. Peng, F. Huang and X. Gong, Energy Environ. Sci., 2012, 5, 8208–8214 RSC.
- L. Hu, M. Li, K. Yang, Z. Xiong, B. Yang, M. Wang, X. Tang, Z. Zang, X. Liu, B. Li, Z. Xiao, S. Lu, H. Gong, J. Ouyang and K. Sun, J. Mater. Chem. A, 2018, 6, 16583–16589 RSC.
- H. Zhou, Y. Zhang, C. K. Mai, S. D. Collins, T. Q. Nguyen, G. C. Bazan and A. J. Heeger, Adv. Mater., 2014, 26, 780–785 CrossRef CAS PubMed.
- A. Garcia, G. C. Welch, E. L. Ratcliff, D. S. Ginley, G. C. Bazan and D. C. Olson, Adv. Mater., 2012, 24, 5368–5373 CrossRef CAS PubMed.
- F. Xie, W. C. H. Choy, C. Wang, X. Li, S. Zhang and J. Hou, Adv. Mater., 2013, 25, 2051–2055 CrossRef CAS PubMed.
- K.-C. Wang, J.-Y. Jeng, P.-S. Shen, Y.-C. Chang, E. W.-G. Diau, C.-H. Tsai, T.-Y. Chao, H.-C. Hsu, P.-Y. Lin, P. Chen, T.-F. Guo and T.-C. Wen, Sci. Rep., 2014, 4, 4756 CrossRef PubMed.
- C. Xia, W. T. Hong, Y. E. Kim, W.-S. Choe, D.-H. Kim and J. K. Kim, Polymers, 2020, 12, 1791 CrossRef CAS PubMed.
- M. Ruscello, T. Sarkar, A. Levitsky, G. M. Matrone, N. Droseros, S. Schlisske, E. Sachs, P. Reiser, E. Mankel, W. Kowalsky, N. Banerji, N. Stingelin, G. L. Frey and G. Hernandez-Sosa, Sustainable Energy Fuels, 2019, 3, 1418–1426 RSC.
- S. Rafique, S. M. Abdullah, M. M. Shahid, M. O. Ansari and K. Sulaiman, Sci. Rep., 2017, 7, 1–10 CrossRef PubMed.
- D. Romero-Borja, J. L. Maldonado, O. Barbosa-García, M. Rodríguez, A. de León, S. Fernández and E. Pérez-Gutiérrez, Carbon, 2018, 134, 301–309 CrossRef CAS.
- S. Rafique, N. A. Roslan, S. M. Abdullah, L. Li, A. Supangat, A. Jilani and M. Iwamoto, Org. Electron., 2019, 66, 32–42 CrossRef CAS.
- L. Guguloth, K. Singh, V. S. Reddy Channu and K. Kumari, Appl. Surf. Sci., 2021, 540, 148266 CrossRef CAS.
- R. Bhargav, A. Patra, S. K. Dhawan and S. P. Gairola, Sol. Energy, 2018, 165, 131–135 CrossRef CAS.
- R. Bhargav, N. Chaudhary, S. Rathi, Shahjad, D. Bhardwaj, S. Gupta and A. Patra, ACS Omega, 2019, 4, 6028–6034 CrossRef CAS PubMed.
- M. S. G. Hamed, S. O. Oseni, A. Kumar, G. Sharma and G. T. Mola, Sol. Energy, 2020, 195, 310–317 CrossRef CAS.
- A. Cominetti, G. Serrano, A. Savoini, C. Carbonera, F. Melchiorre, S. Perucchini, A. Congiu, G. Corso, R. Barbieri, E. Trippodo, A. Caneschi and R. Po, Phys. Status Solidi A, 2020, 217, 1901023 CrossRef CAS.
- L. Wang, S. Zhao, Z. Xu, J. Zhao, D. Huang and L. Zhao, Materials, 2016, 9, 1–9 CrossRef PubMed.
- H. S. Jung and T. Q. Nguyen, J. Am. Chem. Soc., 2008, 130, 10042–10043 CrossRef PubMed.
- J. H. Seo, R. Yang, J. Z. Brzezinski, B. Walker, G. C. Bazan and T. Q. Nguyen, Adv. Mater., 2009, 21, 1006–1011 CrossRef CAS.
- C. Nicollet, C. Toparli, G. F. Harrington, T. Defferriere, B. Yildiz and H. L. Tuller, Nat. Catal., 2020, 3, 913–920 CrossRef CAS.
- Y. J. Park, J. H. Seo, W. Elsawy, B. Walker, S. Cho and J. S. Lee, J. Mater. Chem. C, 2015, 3, 5951–5957 RSC.
- D. Shin, D. Kang, J. Jeong, S. Park, M. Kim, H. Lee and Y. Yi, J. Phys. Chem. Lett., 2017, 8, 5423–5429 CrossRef CAS PubMed.
- S. Park, J. Jeong, G. Hyun, M. Kim, H. Lee and Y. Yi, Sci. Rep., 2016, 6, 1–11 CrossRef PubMed.
- J. H. Lee, J. H. Shin, J. Y. Song, W. Wang, R. Schlaf, K. J. Kim and Y. Yi, J. Phys. Chem. C, 2012, 116, 26342–26348 CrossRef CAS.
- E. Knapp, R. Häusermann, H. U. Schwarzenbach and B. Ruhstaller, J. Appl. Phys., 2010, 108, 054504 CrossRef.
- W. Yang, Y. Yao and C. Q. Wu, Org. Electron., 2013, 14, 1992–2000 CrossRef CAS.
- D. H. Wang, K. H. Park, J. H. Seo, J. Seifter, J. H. Jeon, J. K. Kim, J. H. Park, O. O. Park and A. J. Heeger, Adv. Energy Mater., 2011, 1, 766–770 CrossRef CAS.
- A. A. F. Husain, W. Z. W. Hasan, S. Shafie, M. N. Hamidon and S. S. Pandey, Renewable Sustainable Energy Rev., 2018, 94, 779–791 CrossRef CAS.
- D. H. Shin and S. H. Choi, Coatings, 2018, 8, 329 CrossRef.
- Y. Li, G. Xu, C. Cui and Y. Li, Adv. Energy Mater., 2018, 8, 1–28 Search PubMed.
- V. I. Volkov, A. V. Chernyak, D. V. Golubenko, V. A. Tverskoy, G. A. Lochin, E. S. Odjigaeva and A. B. Yaroslavtsev, Membranes, 2020, 10, 272 CrossRef CAS PubMed.
Footnote |
| † Electronic supplementary information (ESI) available. See DOI: 10.1039/d1ma00913c |
| This journal is © The Royal Society of Chemistry 2022 |

