Multi-technique structural characterization of glass foams with complex pore structures obtained through phase separation†
Cristine S.
de Oliveira
a,
Richard
Kohns
b,
Felix
Meyerhöfer
 b,
Simon
Carstens
 b,
Dirk
Enke
b,
Ralf B.
Wehrspohn
a and
Juliana
Martins de Souza e Silva
b,
Dirk
Enke
b,
Ralf B.
Wehrspohn
a and
Juliana
Martins de Souza e Silva
 *ac
*ac
aInstitute of Physics, Martin Luther University Halle-Wittenberg, Halle, Germany. E-mail: juliana.martins@physik.uni-halle.de
bInstitute of Chemical Technology, Universität Leipzig, Leipzig, Germany
cFraunhofer Institute for Microstructure of Materials and Systems IMWS, Halle (Saale), Germany. E-mail: juliana.martins@imws.fraunhofer.de
First published on 28th April 2021
Abstract
Glass foams (GF) are materials with a porous framework characterized by pore sizes spanning different orders of magnitude. In this study, we report for the first time the synthesis and characterization of GF with cavities ranging from macro- to mesopore size obtained via the combination of a foaming process with phase separation and followed by selective leaching. A combination of techniques, namely N2 sorption, Hg intrusion, scanning electron microscopy, and high-resolution X-ray computed tomography, enabled us to characterize the pores within different size ranges, showing that the GF produced have a complex multimodal pore structure. Computed tomography provided a visual and detailed quantitative description of the pores of hundreds of nanometers to several hundred micrometers and confirmed the presence of residues of the foaming agents still present in the GF walls. We present a comparison of the techniques used for characterizing the produced foams with a discussion of their advantages and limitations. Our results reveal that our multi-technique approach to characterize pores is valuable for developing novel porous materials with features in the nanometric range since it enables building a complete overview of the porous architecture in different size ranges, as no single technique alone would provide.
1. Introduction
Glass foams are porous materials with a wide range of applications. They combine the high chemical, compressive and thermal resistances of glass with the advantages of a lightweight non-flammable porous frame, resulting in a durable, acoustically and thermally insulating low-cost material.1–3 The properties of their porous structure are of great interest for bio-scaffolds and bone healing applications,4,5 while their mechanical strength and their thermal and acoustic insulation capabilities find use in civil engineering.1,6 The porous framework of a glass foam is characterized by a wide range of pore sizes with similar shape and distribution throughout the entire sample.2 Glass foam synthesis generally combines a glass powder and a foaming agent, and a wide range of source materials and compositions have been explored, including the use of waste glass and other waste residues7–10 as an alternative to recycle, reduce costs, and preserve the environment. As their properties strongly depend on their composition and their porous framework, considerable effort has been made to tune the pore width distribution of glass foams by controlling the foaming process.One strategy to tailor the porous architecture in the glass foams that opens new perspectives in their typical applications is to integrate a multimodal pore structure to them, such as the creation, for example, of additional degrees of meso- and/or microporosity.11–13 An additional macropore system in micro/mesoporous glasses can improve the mass transfer in catalysis, for example.14 On the other hand, the integration of an additional micro/mesopore structure in the walls of macroporous glass foams increases the porosity of the material. The low conductivity of glass and the presence of pores decrease the thermal conductivity of the resulting monoliths and is expected to improve the performance of the glass foams in thermal insulation applications.3 The traditional synthesis of glass foams combined with a thermally induced phase separation and selective leaching to generate an additional mesopore system in the foam glass walls has, to our knowledge, not yet been explored. This new synthesis route unifies the favourable properties of classical glass foams and porous glasses in one material with a multimodal pore structure, and an alkali borosilicate glass of a suitable composition and several foaming agents can be used. The pore size of the glass foams can be varied in the micro- and millimeter size range, while the pore size of porous glass can be controlled in the nanometer range via the following parameters: (i) composition of the initial glass, and conditions (temperature, time) of (ii) the thermal treatment to initiate the phase separation, and (iii) the selective leaching process of the soluble phase formed during the phase separation process.15,16
In our work, we synthesized three silica glass foams by combining a classical foaming process of an initial sodium borosilicate glass powder with thermally induced phase separation followed by selective leaching of the soluble phase generated by this process. As a result, additional mesopores were generated in the glass walls of the original macroporous glass foam. Through N2 sorption, Hg intrusion porosimetry, scanning electron microscopy and X-ray computed tomography we observed that variations of the synthesis parameters allowed to obtain distinct pore systems in the glass foams. With high-resolution X-ray computed tomography, we visualized the distribution of pores in the walls, studied their morphology and shape, and estimated their width distribution, ranging from a few tens of nanometers to hundreds of micrometers. With X-ray computed tomography we identified residues of the foaming agents still present in the walls of the glass foams synthesized. Using machine learning assisted segmentation, we observed the distribution of these residues in the space. We compare the techniques used for characterizing the foams produced, which have a multimodal pore structure, and discuss their advantages and limitations. Overall, the techniques are complementary and give an overview of the porous architecture in different ranges of size as no single technique alone would provide.
2. Experimental
2.1 Synthesis of the glass foams (GF1, GF2 and GF3)
The composition of the initial sodium borosilicate glass (SBS) used was 62 mol% SiO2; 1 mol% Al2O3; 30 mol% B2O3 and 7 mol% Na2O. The educts were mixed and homogenized by ball-milling (450 rpm/5 min). The homogeneous mixture was placed stepwise in a Pt/Rh-crucible at 1200 °C and then heated to 1400 °C, with a dwell time of 4 h. The molten glass was cast onto a cold metal mould (room temperature). The glass was left to cool down to RT and subsequently crushed prior to mixing with the foaming agents. The self-melted initial glass, MnO2 (Alfa Aesar) or Mn2O3 (Merck) and carbon (Alfa Aesar – L16334 Carbon, steam activated, Norit ROW 0.8 mm pellets) were ground in a planetary mill at 450 rpm for 1 h using the specified mass ratios (Table 1). The powder composite was transferred to a metal frame case and heated for foaming in an oven under N2 flow. For phase separation, the N2 flow was stopped and the oven was left to cool down to the phase separation temperature (540 or 560 °C) and kept at this temperature for 24 h or 30 h (Table 1), and then left to cool down to room temperature. After cutting a block of foam in the desired geometry, the acid leaching of the soluble phase formed inside the glass walls was performed with 0.6 mol L−1 HCl for 48 h at 70 °C (msample![[thin space (1/6-em)]](https://www.rsc.org/images/entities/char_2009.gif) :
:![[thin space (1/6-em)]](https://www.rsc.org/images/entities/char_2009.gif) msolution = 1
msolution = 1![[thin space (1/6-em)]](https://www.rsc.org/images/entities/char_2009.gif) :
:![[thin space (1/6-em)]](https://www.rsc.org/images/entities/char_2009.gif) 20), then the foams were washed with distilled water for 3 h and dried in oven at 90 °C for 24 h. In this study, the glass foams were investigated after the acid leaching of the soluble phase, thus, the nanopores in the glass walls still contain colloidal silica inside. The different foams were named as shown in Table 1.
20), then the foams were washed with distilled water for 3 h and dried in oven at 90 °C for 24 h. In this study, the glass foams were investigated after the acid leaching of the soluble phase, thus, the nanopores in the glass walls still contain colloidal silica inside. The different foams were named as shown in Table 1.
| Sample | GF1 | GF2 | GF3 |
|---|---|---|---|
| Foaming composition [wt%] | SBS: 92.31 | SBS: 92.31 | SBS: 87.46 |
| MnO2: 6.76 | MnO2: 6.76 | Mn2O3: 11.66 | |
| C: 0.93 | C: 0.93 | C: 0.90 | |
| Milling | Grain size: 20 μm | Grain size: 20 μm | (1) (Mn2O3 + C) |
| ν: 450 rpm, t: 60 min | ν: 450 rpm, t: 60 min | Grain size: 20 μm | |
| ν: 450 rpm, t: 60 min | |||
| (2) (+SBS) | |||
| Grain size: 90 μm | |||
| ν: 450 rpm, t: 60 min | |||
| Foaming | Metal frame case (80 × 80 × 40 mm) | Metal frame case (80 × 80 × 40 mm) | Metal frame case (245 × 85 × 40 mm) |
| T: 815 °C, k: 10 °C min−1 | T: 815 °C, k: 10 °C min−1 | T: 810 °C, k: 1 °C min−1 to 650 °C; 10 °C min−1 to 810 °C | |
| t: 5 min, N2 flow | t: 5 min, N2 flow | t: 5 min, N2 flow | |
| Phase separation | T: 540 °C, t: 24 h | T: 560 °C, t: 24 h | T: 560 °C, t: 30 h |
2.2 Characterization
Nitrogen sorption measurements were performed on a Surfer Gas Adsorption Porosimeter (Thermo Fisher Scientific, Waltham, MA, USA). Prior to examination, the samples were dried and activated at 250 °C under ultra-high vacuum for 10 h. The pore width distributions were calculated using the DFT method (kernel “cylindrical pores, NLDFT equilibrium model, nitrogen −196 °C on silica”), and the specific surface areas were obtained using the BET model.Mercury intrusion porosimetry (MIP) was performed on a Poremaster 33/60 (3P instruments, Odelzhausen, Germany) in the pressure range from 14 mbar to 4140 bar. The covered pore size range thus was 1.1 mm to 3.6 nm. Samples were outgassed prior to analysis at 0.07 mbar. The surface tension of mercury was assumed to be 0.48 N m−2 and its contact angle was set to 140°.
Powder X-ray diffraction measurements (XRD) were carried out in transmission mode on a STADI P device with a Mythen1K detector (both by STOE & Cie GmbH, Darmstadt, Germany), using Cu Kα radiation at 40 kV and 40 mA.
Scanning electron microscopy (SEM) images were recorded on a Nova Nanolab 200 with a TLD Elstar detector (both by FEI, Hillsboro, OR, USA) for collecting secondary electrons. Samples were fixated on a carbon tape and vapor coated with a gold film. The accelerating voltage was 30 kV.
Absorption-contrast X-ray micro-computed tomography (micro-CT) was performed in a GE phoenix nanome|x equipped with a tungsten source working at 120 kV and 35 mA with variable source-sample and sample-detector distances. Each sample (∼1–2 cm3) was scanned using a field-of-view (FOV) enough to fit the entire sample with pixel sizes that slightly varied among samples: for GF1 it was 31.54 μm, for GF2 it was 24.44 μm and for GF3 was 23.06 μm. A total of 1001 projection images with an exposure time of 800 ms each was acquired by rotating the sample over 360°. Image reconstruction was performed by filtered back-projection algorithm using the GE phoenix datos|x software integrated into the device. The tomograms obtained were exported as a stack of 16-bit TIFF images of 1000 × 1000 pixels for further processing. For higher-resolution CT images (nano-CT), a Carl Zeiss Xradia 810 ultra X-ray microscope equipped with a chromium X-ray source (5.4 keV) was used. A small piece of each sample (<100 μm thickness) was manually cut and glued atop a metallic pin, which was then placed on the sample holder. Imaging experiments were performed using Zernike phase-contrast imaging, a field-of-view mode of 64 × 64 μm2, and a total of 901 projections with exposure time of 70 s were collected over 180°. Image reconstruction was performed by filtered back-projection algorithm using the software XMReconstructor integrated into the device, and the tomograms obtained were exported as a stack of 16-bit TIFF images of approximately 1024 × 1024 pixels, with an isometric pixel size of 64 nm. Datasets obtained in lower magnification using the GE Phoenix nanome|x are referred further in the text as micro-CT datasets, and those obtained with the Carl Zeiss Xradia 810 Ultra are referred to as nano-CT datasets.
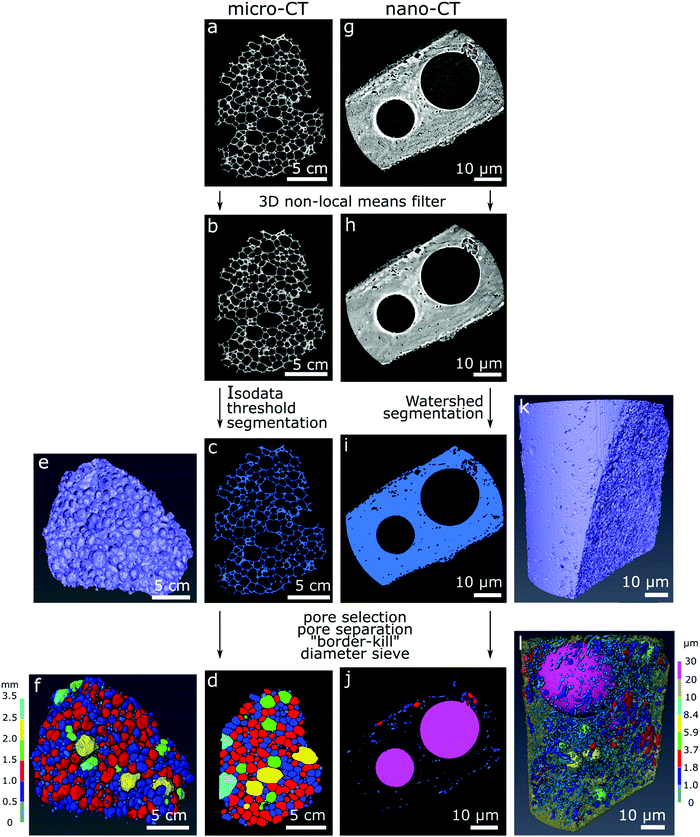
Commercial software Avizo (Thermo Fisher Scientific version 9.4.0) was used for image correction, segmentation, rendering of the 3D models and estimation of material properties according to the image processing workflow in Fig. 1. For image correction and de-noising of the reconstructed slices (Fig. 1a and g), the 3D non-local means filter was applied for all datasets using a search window of 21 voxels, voxel comparison neighborhood set to 5 voxels, and similarity value set for 0.8 for the micro-CT datasets and 2 for the nano-CT datasets (Fig. 1b and h). The glass foams were then segmented from the empty space automatically using IsoData criterion for the micro-CT datasets (Fig. 1c), and using watershed-assisted region growing starting from top-hat selections (local grey level valleys or peaks) for the pore space and simple grey level threshold for the foam itself for the nano-CT datasets (Fig. 1i). A volumetric representation of the samples was then obtained (Fig. 1e and k). For each of the micro-CT datasets, five smaller regions of interest of 200 × 200 × 200 voxels were extracted to calculate the porosity and specific surface area with an attributed standard deviation. For nano-CT, only the porosity was estimated, extracting seven smaller volumes of interest of 200 × 200 × 200 voxels from the foam walls (ESI,† Fig. S1–S3). The pores can be visualized in two- (Fig. 1d and j) and in three-dimensions images (Fig. 1f and l).
The porosity was estimated as the ratio of the volume occupied by voxels related to the pores over the total number of voxels in the selected region. The specific surface area was estimated using the “object specific surface” module in Avizo. In this module, the surface area of the specimen is estimated via an approximation of the Crofton perimeter calculation for 3D in a first step. This estimated area is then divided by the glass foam volume. The pores were segmented through distance transform watershed marker-based separation, using the smallest size of starting seeds (markers) for region growing. A Chamfer distance map served as a source for the starting seed markers (according to grey level distribution), which are then virtually grown using a watershed algorithm and following the distance map until they meet. Those meeting points determine where pores are separated. This is done to ensure optimal evaluation of pores as well as separating larger and smaller pores in the sample, which may be connected. Subsequently, empty space outside of the sample and incomplete pores touching the borders of the dataset were eliminated using the “border-kill” module. The calculated pore diameter corresponds to the maximum Feret diameter calculated by Avizo, defined as the largest distance between two parallel planes touching the pore surface in a sampling of 31 angles. The pore anisotropy is a measure of the deviation of the pore shape from a sphere, based on an eigenvalue analysis of the mean intercept length at different angles. The distribution of the mean intercept length, as a function of the angle, is analysed and a minimum and a maximum eigenvalue are extracted. The degree of anisotropy is calculated as 1 minus (minimum eigenvalue/maximum eigenvalue). Thus, the degree of anisotropy is 0 for perfect isotropy (sphere) and 1 for complete anisotropy.
Commercial software Vision4D (arivis AG version 2.12.6) was used to visualize the bright regions in the foam walls, while a machine learning algorithm in the Vision4D software (arivis AG version 3.2) was used to segment these features observed inside the foams’ walls. Machine learning in Vision4D uses a random forest algorithm, and a combination of user-selected regions as initial input, the initial dataset, and datasets resulting of denoising or feature-enhancing filtering with different kernel sizes to segment the regions of interest.
3. Results and discussion
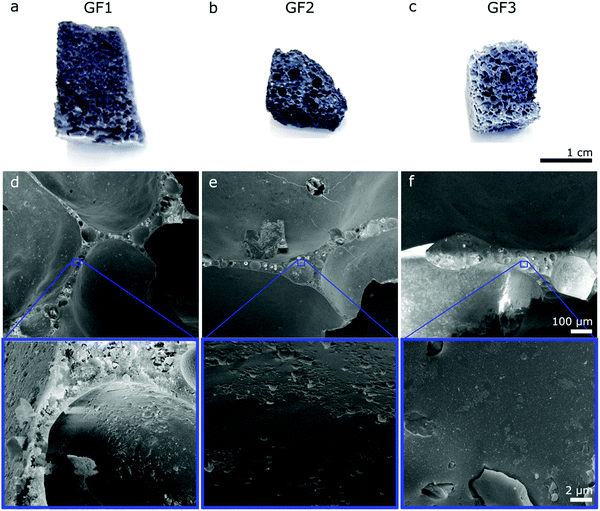
The porous character of the novel glass foams (GF) is already visible by the naked eye (Fig. 2a–c) and microscopically in SEM images (Fig. 2d–f). SEM images show the distribution of the approximately spherical pores of some tens of micrometer trapped in the foam walls, which result from the foaming process. Higher magnification SEM images (Fig. 2, detail) show additional detail of the surface of the walls.We investigated the novel glass foams with multimodal pore structures by mercury intrusion and N2 sorption (Fig. 3). With mercury intrusion, we identified pores as small as 4 nm up to 1 mm and samples GF1 and GF2 show a main population of pores of 1000 to 3000 nm formed by the foaming process (Fig. 3a and b). Pores in sample GF3 have more variable sizes, from a few nanometers to some tens of a micrometer, with roughly two main pore populations, one between 3000 to 6000 nm and another one, between 40 to 90 μm (Fig. 3c). Compared with the other two samples, there is an increase in ratio of the large-to-small pores in GF3. As the foam samples were leached only with an acidic solution and were not submitted to any additional alkaline treatment, they exhibit mesopores that are partially filled with colloidal silica species that are not detected by mercury intrusion, but are detected by nitrogen sorption analyses (Fig. 3d–f and ESI,† Fig. S4). Modal pore diameters for samples GF1 and GF2 are, respectively, 12.6 nm and 9.8 nm, while for sample GF3 the modal pore diameter is 36.2 nm. An additional alkaline treatment would be necessary to remove these deposits and clean the pore structure.15,17,18 In the case of the novel glass foams presented here, the established additional alkaline treatment, unfortunately, resulted in the destruction of the foam structure. The generation of the additional mesopores in the glass walls by phase separation and selective leaching, thus, still has to be optimized. First, a very high degree of open porosity must be achieved in the foams. That will enable the complete leaching of the soluble phase generated by the phase separation in the glass walls, generating additional mesopores. Further optimizations regarding the last preparation step and the synthesis of glass foams with a maximum proportion of open porosity19,20 are still necessary. Such studies are currently being carried out.
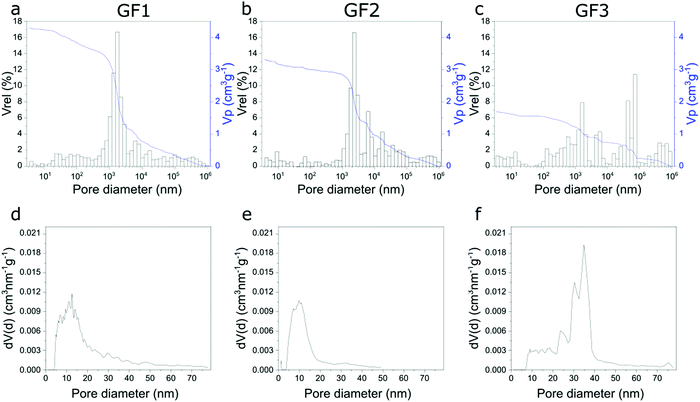 | ||
| Fig. 3 Pore width distributions of samples GF1, GF2 and GF3 obtained using Hg intrusion (a–c), and N2 sorption (d–f). | ||
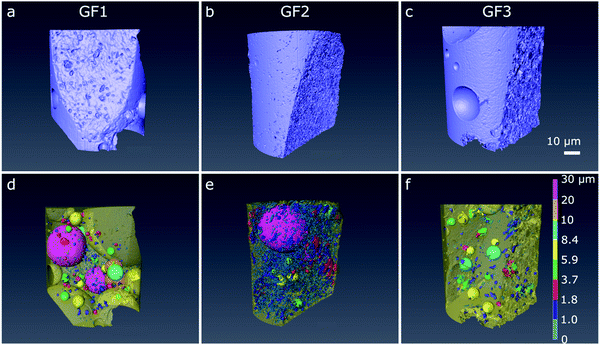
We further analysed the porous character of the samples by micro- and nano-CT imaging. From the raw CT data, we applied image processing to distinguish pore space (air) from the foam structure. In the micro-CT volumetric images, obtained after semi-automated three-dimensional analysis, we see the individual spherically shaped pores resulting from the foaming process and their distribution in space (Fig. 4a–c). In the images with the pores color-coded according to their size range, we see that the ratio of large-to-small foam pores varies among the samples, with GF1 (Fig. 4d) showing the larger number of small pores (pores pseudo-colored in dark blue and smaller ones in light blue in Fig. 4d). GF2 (Fig. 4e) have a higher percentage of larger pores when compared with GF1, and GF3 presents the largest pores when compared with GF1 and GF2 (Fig. 4f, pores pseudo-colored in bright tones of green, yellow, and blue). In the nano-CT images (Fig. 5), we see the pores located in the pore walls, with pore density varying among the samples. These are the smaller pores resulting from the foaming process and are heterogeneous in shape and size: there are large spherically shaped pores and smaller, more uneven ones (Fig. 5d–f).
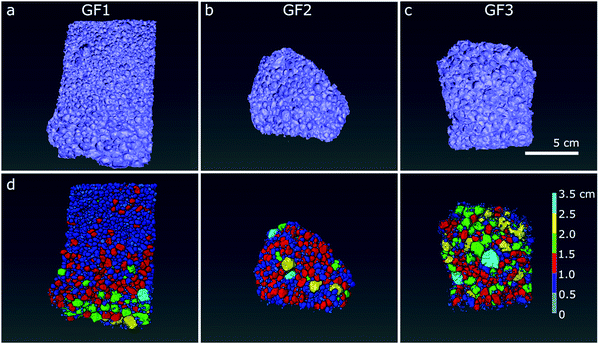 | ||
| Fig. 4 Reconstructed 3D micro-CT images of samples (a) GF1, (b) GF2 and (c) GF3, and segmented pores with color-coded diameter shown below, in (d–f). Scale bar: 5 μm. | ||
After identifying and measuring the size of the individual pores imaged, we organized them into a pore-width distribution. Here, the diameter of the pore is given by the largest Feret diameter orthogonal to the pore length (the latter is the longest distance between two parallel planes touching the surface of the pore). The pore-width distribution calculated for the GF samples using the micro-CT data shows three populations (Fig. 6a–c), one centered around 100 μm, another at 200–300 μm and a third one centered at 600 μm or more, with position depending on the sample and shifting towards larger numbers in the order GF1 < GF2 < GF3. While pore width distribution estimated by micro-CT is limited by the voxel size of the three-dimensional images obtained, Hg intrusion shows the population of smaller pores in the micrometer range and N2 sorption of even smaller pores in the nanometer range (Fig. 3). The differences observed in the micro-CT and Hg intrusion data, which on average gives smaller diameters, may be related to the accuracy limitation of Hg intrusion when measuring the pores of largest diameter in samples with interconnected pores of varying size.21 Micro-CT, on the other hand, detects closed pores non-detectable by Hg intrusion, but has limitations related to the resolution of the imaging experiments. Thus, the smaller the pores (below some tens of micrometer), the lower the accuracy for the estimation of pore diameter by micro-CT.
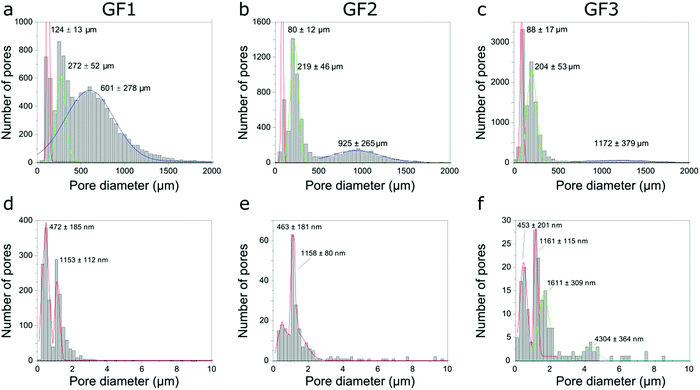 | ||
| Fig. 6 Pore width distributions of samples GF1, GF2 and GF3 obtained using micro-CT (a–c), and nano-CT (d–f). | ||
We also estimated pore width distributions by nano-CT (Fig. 6d–f) and identified different populations between the samples. However, these results must be treated with caution. The field-of-view (FOV) of nano-CT (64 μm × 64 μm) is smaller than the sample, therefore the results might not be representative, due to the heterogeneous character of the pores in the walls and the small size of the dataset available to be analysed. Of course, we can obtain a larger FOV by stitching together two or more datasets, thus assuring adequate sampling. However, this increases both the time spent in imaging experiments and the amount of data to post-process. The small field-of-view of nano-CT can explain the differences observed between the pore width distributions obtained with Hg intrusion and nano-CT data. Moreover, as micro-CT, nano-CT detects closed pores located in the walls, which are not detected by Hg intrusion. Most of these pores are not accessible by the Hg or N2 and, thus, not accounted for in the pore width distributions obtained by Hg intrusion and N2 sorption (Fig. 3).
We estimated the porosity of the glass foams using the micro-CT data (Table 2). Porosity here is given by the ratio of pore-related voxels over the total number of voxels in the selected volume of analysis. Due to the voxel size of the final images, we considered in this estimation only the contribution of pores of 40 μm size or larger. Porosity values obtained are similar among the samples, approximately 80% with small variations of about 5%. Micro-CT does not enable the visualization of the smaller pores that are detectable by Hg intrusion, while micro-CT considers in the porosity estimation also the contribution of closed pores, which are not accessible by mercury. These differences could explain the slightly different porosity values obtained by micro-CT and Hg intrusion. Due to the small size of the nano-CT datasets and, thus, the inaccuracy of the measurement that can result from it, we did not estimate the porosity by nano-CT.
| Sample | Porosity (%) | Specific surface area | Pore anisotropy | |||
|---|---|---|---|---|---|---|
| Micro-CT | Hg intrusion | Micro-CT (μm2 μm−3) | N2 sorption (BET) (m2 g−1) | Micro-CT | Nano-CT | |
| GF1 | 74 ± 4 | 90 ± 1 | 1.9 ± 0.1 × 10⁻⁴ | 60 | 0.6 ± 0.2 | 0.7 ± 0.2 |
| GF2 | 83 ± 1 | 88 ± 1 | 2.7 ± 0.0 × 10⁻⁴ | 53 | 0.5 ± 0.2 | 0.7 ± 0.3 |
| GF3 | 78 ± 2 | 79 ± 1 | 2.1 ± 0.2 × 10⁻³ | 31 | 0.6 ± 0.2 | 0.8 ± 0.1 |
Micro-CT enables the estimation of the specific surface area by dividing the estimated surface area of the glass foams by the glass foams volume, resulting in a value expressed in μm2 μm−3. The specific surface area estimated from micro-CT data corresponds only to the pores formed by the foaming process, which are the large macropores with small specific surface area. The knowledge of the GF density enables the estimation of the specific surface area related to macropores in terms of m2 g−1. It is complementary to the specific surface area obtained N2 sorption, which has high values resulting from the contribution of the smaller mesopores in the glass walls.
CT analysis also enables the estimation of the pore shape anisotropy, which is a measure of the deviation of the pore shape from a sphere and has values between 0 (perfect sphere) and 1 (maximum anisotropy). This value allows us to quantify the spherical nature of the pores within a sample and serves as an indication of the ability of a pore to be removed during sintering process.22 Our estimations show that the large foaming pores observed by micro-CT are not perfectly spherical, and that the pores observed by nano-CT are even less spherical (Fig. 5 and Table 2). The nano-CT images strongly depend on the region selected for imaging and the irregular distribution of pore size and shape inside the foam walls can result from it. It also suggests that the foaming process does not occur homogeneously throughout the entire sample.
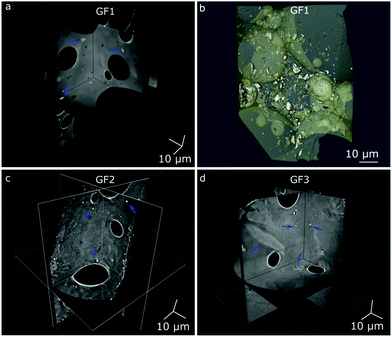
Nano-CT data were obtained by Zernike phase-contrast X-ray imaging, which is not purely phase-contrast imaging, but carries also absorption-contrast information. Thus, the pixel grey level and the electronic density of the chemical elements in the sample are related. We observe residual MnO2 in the X-ray diffraction patterns of samples GF1 and GF2 (ESI,† Fig. S5). Thus, the bright regions observed by nano-CT (Fig. 7a, c and d) can be attributed to manganese-containing phases originating from the foaming agents, as manganese is the heaviest element used in the syntheses. When moving through the nano-CT datasets in virtual cuts, we see the manganese-related spots in the foam's walls, with some of them occurring in the vicinity of pores (ESI,† Movies S1–S3 and Fig. 8 containing frames of these movies). Additionally, we show the results of the machine learning-assisted segmentation of the bright areas in sample GF1 as a proof-of-principle. We avoided the selection of the phase-contrast artifacts while selecting the bright areas (Fig. 7b). The particles are distributed in the foam wall imaged and show various shapes. When revisiting the SEM images of GF3 in Fig. 2f, we see some brighter patches that could be related to these residues. These results elucidate the importance of knowing reagents composition and sources, especially when considering using waste materials for GF synthesis, as it can interfere with the material's final properties.
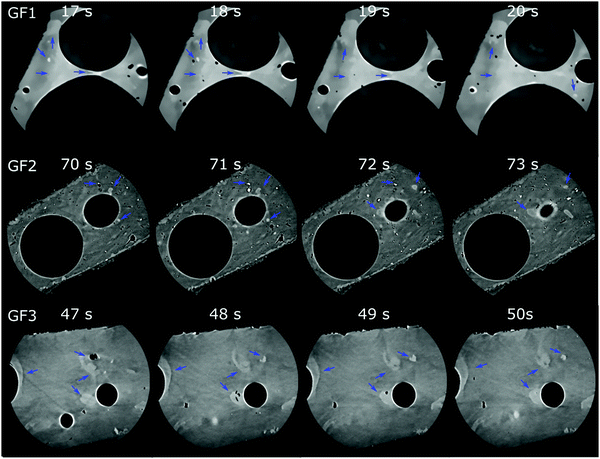 | ||
| Fig. 8 Micro-CT tomograms of samples GF1 (top), GF2 (middle), and GF3 (bottom) corresponding to frames of the Movies S1–S3 (ESI†), which show virtual slices of each sample when moving orthogonally to the sample's center of rotation. Blue arrows indicate some regions with bright spots attributed to manganese oxide residues occurring in the GF walls. | ||
Open- and closed-cell glass foams are used in the acoustic and thermal insulation of buildings, and their performance depends both on their porosity and the foam pore sizes.23 Extremely high porosity is opposed by reduced mechanical stability. Progress can be achieved by reducing the size of the foam pores with high total porosity, as in aerogel materials.24 Alternatively, it can be achieved by integrating an additional mesoporosity into the walls of porous foams, through the creation of a bimodal pore structure. In our work, we combined both effects for the first time to produce the novel glass foams. Systematic studies are still necessary for optimizing the GF to reach porosities above 90%, optimal foam pore size, and the ideal ratio of wall thickness and mesopores size. Furthermore, preliminary tests show a reduction in the thermal conductivity of the GF of more than 30% (values in the range of 40 mW m−1 K−1) due to the integration of additional mesopores into its walls.
For the characterization of these novel glass foams, we used a few different physicochemical analysis and imaging techniques, which cover different ranges of pore size detection (Fig. 9). Micro- and mesopores from the sub-nanometer range up to about 50 nm (or even macropores of up to 100 nm25) can be detected by N2 sorption, and the specific surface area can be calculated according to the BET method.26 Mercury intrusion often complements N2 sorption data, covering pore widths ranging from a few nanometers up to 1000 μm.25,27 However, as mercury intrusion assumes cylindrical pores, estimations may carry errors that can be quite large.21 Nonetheless, both methods are well-established for nanoporous materials characterization. In combination with nano- and micro-CT imaging, we covered a larger range of pore sizes and provided a more complete description of the porous character of the samples.
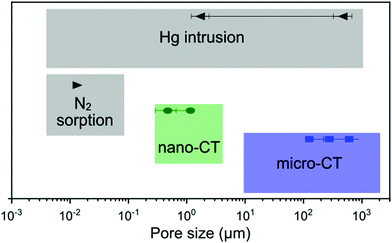 | ||
| Fig. 9 Comparison of the pore size detection range for the techniques used in this work, including the values obtained for GF1 as example. | ||
Among imaging techniques, either SEM2,9 or TEM12,28 are typically used for visualizing pores within the size range of our GF. Also, micro-CT is used occasionally.29–31 While in our study SEM enabled imaging of the foams’ surface roughness, CT provided a more complete morphological characterization of the GF. CT is a non-destructive three-dimensional characterization technique that we used here to analyse the complex GF porous architectures and allowed us visualising the larger foaming pores and their distribution in space. CT sample preparation was quick and uncomplicated without the requirement of using any special and time-demanding preparation procedure, and the three-dimensional images obtained preserved the integrity of the specimen within the range of the volume imaged. Micro- and nano-CT produced volumetric images of the GF specimens with an isotropic spatial resolution and covered two different pore size ranges, from some centimeters to some hundreds of nanometer, respectively, which have some overlap with Hg intrusion and N2 sorption (Fig. 9). The 3D images obtained by micro- and nano-CT allowed to visualize and screen the pores inside the walls along any direction without the need to break the sample and, thus, not adding artifacts from manipulating the sample. Furthermore, through the nano-CT images, we detected residues of the foaming agents distributed in the foam's walls, which no other technique could clearly show, and we produced a spatial map of those residues through machine learning-assisted segmentation (Fig. 7). When inspecting the samples vertically (Fig. 8 and ESI,† Movies), we visualized the foaming agents’ residues distribution in the GF walls, revealing that CT is a promising analysis technique for understanding the foaming process occurring during the synthesis of porous materials.
Micro- and nano-CT images obtained enabled the qualitative evaluation of the porous architecture of the GF samples. The pore size detection ranges by micro- and nano-CT (Fig. 9) depend, of course, on the imaging experiment conditions and the device used. Here, for the estimation of porosity, pore width distribution, specific surface area, and pore anisotropy from the CT data, we considered only the pores with a diameter larger than three times the voxel size of the volumetric image. As it is usual to any imaging technique, results from micro- and nano-CT analysis should be treated with caution, as the field-of-view and the imaging resolution are limitations that have a strong influence on the results obtained by morphologic analysis.32 Especially for nano-CT, the high-resolution comes with the disadvantage of a volume imaged that is not always representative of the entire sample. However, only with three-dimensional imaging techniques, such as micro- and nano-CT, we can show the distribution of the pores in space, their interconnectivity, shape and presence in the GF walls. With our study, we show the potential of high-resolution three-dimensional X-ray imaging as a complementary characterization technique for the complete, non-destructive, qualitative and quantitative characterization of materials with complex porous architecture.
4. Conclusion
We prepared glass foams with a multimodal pore structure ranging from macro- to mesopore size range via the combination of a foaming process with phase separation and selective leaching. We show that small changes in the experimental procedure enable the production of materials with different macropore size distributions as well as different mesopore size distributions obtained by thermally induced phase separation and selective acid leaching. An additional alkaline treatment would be necessary to remove colloidal silica species and clean the mesopores. However, this treatment causes the collapse of the foam structure and was, hence, omitted. A combination of Hg intrusion, N2 sorption, and 2D (SEM) and 3D imaging techniques (micro- and nano-CT) provided a thorough description of the porous character of the samples when comparing to only using the standard methods and enabled the characterization of the complex pore structure of the glass foams by detection of the smallest pores of nanometer size, the micrometer pores, up to the larger pores of some centimeters. The results obtained show that all samples have a combination of pores in the micrometre size or larger, resulting from the foaming process, and pores of nanometer size that result from the combined phase separation and acid leaching processes. Nano-CT was the only technique that enabled the three-dimensional visualisation of the pores inside intact glass foams walls, including the isolated ones that cannot be accessed by Hg intrusion or N2 adsorption, as well as the detection of residual foaming agents in the foams. These results reveal the potential of CT for contributing to the understanding process of glass foaming and the resulting distributions of the individual foam pores within the GF monoliths.Author contributions
RK fabricated the samples; CSO and JMSS carried out the imaging experiments; CSO processed the CT images; RK, FM, SK and DE analysed the samples by N2 sorption, Hg intrusion and SEM; JMSS, CSO, SK, DE, and RBW wrote the manuscript; RBW and JMSS supervised the project. DE and JMSS conceived the original idea. All authors provided critical feedback and helped shape the manuscript.Conflicts of interest
There are no conflicts of interest to declare.Acknowledgements
RBW acknowledges Deutsche Forschungsgemeinschaft (DFG) for the grants WE 4051/21-1 and WE 4051/22-1 and Carl Zeiss for the loan of the phase-ring.References
- G. K. O. D’Amore, M. Caniato, A. Travan, G. Turco, L. Marsich, A. Ferluga and C. Schmid, Innovative thermal and acoustic insulation foam from recycled waste glass powder, J. Cleaner Prod., 2017, 165, 1306–1315 CrossRef.
- S. Giovanni, G. Brusatin and E. Bernardo, Glass Foams, Wiley-VCH Verlag GmbH & Co. KGaA, Weinheim, 2005 Search PubMed.
- A. Moscicki, J. Pawlicki, D. Glowacki and K. Suprynowicz, Limit load and failure mechanisms of soda lime glass foam, J. Mater. Sci., 2018, 53, 16220–16231 CrossRef CAS.
- V. Maquet, A. R. Boccaccini, L. Pravata, I. Notingher and R. Jerome, Preparation, characterization, and in vitro degradation of bioresorbable and bioactive composites based on Bioglass (R)-filled polylactide foams, J. Biomed. Mater. Res., Part A, 2003, 66a, 335–346 CrossRef CAS PubMed.
- D. Nadeem, M. Kiamehr, X. B. Yang and B. Su, Fabrication and in vitro evaluation of a sponge-like bioactive-glass/gelatin composite scaffold for bone tissue engineering, Mater. Sci. Eng., C, 2013, 33, 2669–2678 CrossRef CAS PubMed.
- D. Hesky, C. G. Aneziris, U. Gross and A. Horn, Water and waterglass mixtures for foam glass production, Ceram. Int., 2015, 41, 12604–12613 CrossRef CAS.
- H. M. Deysel, K. Berluti, B. J. du Plessis and W. W. Focke, Glass foams from acid-leached phlogopite waste, J. Mater. Sci., 2020, 55, 8050–8060 CrossRef CAS.
- Y. X. Guo, Y. H. Zhang, H. W. Huang, X. H. Meng, Y. Y. Liu, S. C. Tu and B. Y. Li, Novel glass ceramic foams materials based on polishing porcelain waste using the carbon ash waste as foaming agent, Constr. Build. Mater., 2016, 125, 1093–1100 CrossRef CAS.
- A. Lejeune, A. Cabrol, R. Lebullenger, A. Denicourt-Nowicki, A. Roucoux, A. Szymczyk, A. Couvert and P. F. Biard, Development of a Sustainable Heterogeneous Catalyst Based on an Open-Cell Glass Foam Support: Application in Gas-Phase Ozone Decomposition, ACS Sustainable Chem. Eng., 2020, 8, 2854–2864 CrossRef CAS.
- M. T. Souza, B. G. O. Maia, L. B. Teixeira, K. G. de Oliveira, A. H. B. Teixeira and A. P. N. de Oliveira, Glass foams produced from glass bottles and eggshell wastes, Process Saf. Environ. Prot., 2017, 111, 60–64 CrossRef CAS.
- S. Fiorilli, F. Baino, V. Cauda, M. Crepaldi, C. Vitale-Brovarone, D. Demarchi and B. Onida, Electrophoretic deposition of mesoporous bioactive glass on glass-ceramic foam scaffolds for bone tissue engineering, J. Mater. Sci.: Mater. Med., 2015, 26, 21 CrossRef PubMed.
- J. Lacroix, J. Lao and E. Jallot, Simple Synthesis of Mesostructured Bioactive Glass Foams and Their Bioactivity Study by Micro-PIXE Method, J. Phys. Chem. C, 2013, 117, 23066–23071 CrossRef CAS.
- Y. F. Zhu, C. T. Wu, Y. Ramaswamy, E. Kockrick, P. Simon, S. Kaskel and H. Zrelqat, Preparation, characterization and in vitro bioactivity of mesoporous bioactive glasses (MBGs) scaffolds for bone tissue engineering, Microporous Mesoporous Mater., 2008, 112, 494–503 CrossRef CAS.
- D. Enke, R. Glaser and U. Tallarek, Sol-Gel and Porous Glass-Based Silica Monoliths with Hierarchical Pore Structure for Solid-Liquid Catalysis, Chem. Ing. Tech., 2016, 88, 1561–1585 CrossRef CAS.
- D. Enke, F. Janowski and W. Schwieger, Porous glasses in the 21st century - a short review, Microporous Mesoporous Mater., 2003, 60, 19–30 CrossRef CAS.
- A. Inayat, B. Reinhardt, H. Uhlig, W. D. Einicke and D. Enke, Silica monoliths with hierarchical porosity obtained from porous glasses, Chem. Soc. Rev., 2013, 42, 3753–3764 RSC.
- D. Enke, K. Otto, F. Janowski, W. Heyer, W. Schwieger and W. Gille, Two-phase porous silica: Mesopores inside controlled pore glasses, J. Mater. Sci., 2001, 36, 2349–2357 CrossRef CAS.
- F. Janowski and D. Enke, in Porous Glasses, ed. F. Schüth, K.S.W. Sing and J. Weitkamp, Wiley-VCH, Weinheim, 2002, vol. 3 Search PubMed.
- J. König, A. Lopez-Gil, P. Cimavilla-Roman, M. A. Rodriguez-Perez, R. R. Petersen, M. B. Ostergaard, N. Iversen, Y. Z. Yue and M. Spreitzer, Synthesis and properties of open- and closed-porous foamed glass with a low density, Constr. Build. Mater., 2020, 247, 118574 CrossRef.
- J. König, R. R. Petersen, N. Iversen and Y. Yue, Application of foaming agent–oxidizing agent couples to foamed-glass formation, J. Non-Cryst. Solids, 2021, 553, 120469 CrossRef.
- S. Diamond, Mercury porosimetry - An inappropriate method for the measurement of pore size distributions in cement-based materials, Cem. Concr. Res., 2000, 30, 1517–1525 CrossRef CAS.
- A. Nommeots-Nomm, C. Ligorio, A. J. Bodey, B. Cai, J. R. Jones, P. D. Lee and G. Poologasundarampillai, Four-dimensional imaging and quantification of viscous flow sintering within a 3D printed bioactive glass scaffold using synchrotron X-ray tomography, Mater. Today Adv., 2019, 2, 100011 CrossRef.
- B. S. M. Seeber, U. T. Gonzenbach and L. J. Gauckler, Mechanical properties of highly porous alumina foams, J. Mater. Res., 2013, 28, 2281–2287 CrossRef CAS.
- K. E. Parmenter and F. Milstein, Mechanical properties of silica aerogels, J. Non-Cryst. Solids, 1998, 223, 179–189 CrossRef CAS.
- S. Lowell and J. E. Shields, Equivalency of Mercury Porosimetry and Gas-Adsorption, Powder Technol., 1981, 29, 225–231 CrossRef CAS.
- S. Brunauer, P. H. Emmett and E. Teller, Adsorption of Gases in Multimolecular Layers, J. Am. Chem. Soc., 1938, 60, 309–319 CrossRef CAS.
- G. C. Wall and R. J. C. Brown, The Determination of Pore-Size Distributions from Sorption Isotherms and Mercury Penetration in Interconnected Pores - the Application of Percolation Theory, J. Colloid Interface Sci., 1981, 82, 141–149 CrossRef CAS.
- Y. C. Liao, S. M. Song, T. H. Li, J. B. Li, P. H. Tsai, J. S. C. Jang, C. H. Huang, J. C. Huang, Y. S. Huang, C. H. Lin, Y. S. Lin and C. H. Chen, Synthesis and characterization of an open-pore toxic-element-free Ti-based bulk metallic glass foam for bio-implant application, J. Mater. Res. Technol., 2020, 9, 4518–4526 CrossRef CAS.
- A. S. Choi, D. H. Miller, D. M. Immel and F. G. Smith, Investigation of high-level waste glass melting using X-ray computed tomography, Int. J. Appl. Glass Sci., 2017, 8, 165–176 CrossRef CAS.
- R. C. Atwood, J. R. Jones, P. D. Lee and L. L. Hench, Analysis of pore interconnectivity in bioactive glass foams using X-ray microtomography, Scr. Mater., 2004, 51, 1029–1033 CrossRef CAS.
- G. Poologasundarampillai, P. D. Lee, C. Lam, A. M. Kourkouta and J. R. Jones, Compressive Strength of Bioactive Sol-Gel Glass Foam Scaffolds, Int. J. Appl. Glass Sci., 2016, 7, 229–237 CrossRef CAS.
- S. Bertoldi, S. Fare and M. C. Tanzi, Assessment of scaffold porosity: the new route of micro-CT, J. Appl. Biomater. Biomech., 2011, 9, 165–175 Search PubMed.
Footnote |
| † Electronic supplementary information (ESI) available. See DOI: 10.1039/d1qm00383f |
| This journal is © the Partner Organisations 2021 |

 Open Access Article