 Open Access Article
Creative Commons Attribution 3.0 Unported Licence
The unexpected discovery of the ninth polymorph of tolfenamic acid†
Pietro
Sacchi
 a,
Susan M.
Reutzel-Edens
 bc and
Aurora J.
Cruz-Cabeza
 *a
*a
aDepartment of Chemical Engineering and Analytical Science, School of Engineering, University of Manchester, M13PL, UK. E-mail: aurora.cruzcabeza@manchester.ac.uk
bSynthetic Molecule Design & Development, Eli Lilly and Company, Indianapolis, IN, USA
cCambridge Crystallographic Data Centre, 12 Union Road, Cambridge, CB2 1EZ, UK
First published on 20th April 2021
Abstract
Tolfenamic acid (TFA) is a very well-studied polymorphic compound with eight polymorphs discovered to date. Here, we report on a new polymorph of TFA, form IX, which was unexpectedly crystallised from isopropanol at low temperatures. Crystals of form IX appeared concomitantly with the more common forms I and II, raising the question as to why this polymorph had never been reported before. With the aid of dispersion corrected DFT, paired with calculations of vibrational frequencies, we analysed the stability of this new polymorphic form of TFA. Thermal measurements, solubility measurements and solvent-mediated phase transformation experiments confirm that TFA form IX is a metastable polymorph, with a stability that is close to the well-known forms I and II.
1. Introduction
The control of polymorphism, the ability of a substance to exist in different crystalline forms of the same composition, is of crucial concern for various chemical industries including those focused on pharmaceuticals, paints and foods. A specific polymorph may be desirable for commercialisation because of its better physical stability, whilst a different polymorph may present some processability (i.e., better filterability or compressibility) or effectivity (i.e., improved solubility) advantages. Novel polymorphs may also afford intellectual property and commercial advantages, which places polymorph screening and discovery as a key step in product development.1From a fundamental scientific view, the discovery, structural analysis and characterisation of novel polymorphs of organic compounds helps us develop an improved understanding of the interplay between thermodynamic and kinetic factors during crystallisation. It also enables a better understanding of intermolecular interactions, so important to chemistry and biology. Additionally, well-characterised experimental polymorphic datasets provide excellent benchmark data against which to develop improved computational methods.
In theory, all molecular compounds can potentially display polymorphism.2 In practice, whilst some compounds display a plethora of polymorphs (e.g. ROY) others – despite being commonly crystallised over centuries – never show polymorphism (e.g. benzoic acid). The late-appearance of unexpected polymorphs3 at late stages of product development can bring burdensome consequences to chemical industries.4 Thus, extensive crystallisation screenings are usually performed to uncover the so-called solid form landscape of any molecular compound under development. Controversially, McCrone postulated in 1969 that “the number of polymorphs discovered for a specific compound is proportional to the time and money spent on their research”.5 Modern crystal structure prediction (CSP) calculations6,7 can assist this often cumbersome task and they are becoming increasingly popular in industry because they have the potential of minimising and guiding the experimental polymorph screening efforts as well as providing an additional characterisation technique for the identification of thermodynamically stable polymorphs.8–10 These methods, however, remain complementary tools to experimental polymorph screenings and their generated landscapes often raise difficult interpretations. For example, sometimes these landscapes can suggest the existence of an unknown more stable crystal polymorph that has never been crystallised before. These computations have no way of predicting a “recipe” for these polymorphs to be crystallised experimentally or whether or not they can be crystallised at all. Very often, these forms can only be obtained making use of complex, unpredictable and unconventional crystallisation methods involving, for example, crystallisation in the presence of additives11 or polymers,12 the use of isostructural templates,13 crystallisation from the melt14,15 or nanoconfinement crystallisation.16,17 The majority of these crystallisation pathways remain unpredictable and non-obvious even for expert practitioners.
Although polymorphism is common, there is only a limited number of compounds with over four characterised forms.18 Compounds with more than eight known polymorphs include ROY,19–22 aripiprazole,23–26 flufenamic acid18 and galunisertib.27 Matzger et al. proposed the concept of “polymorphophore”28 which is a chemical substructure likely to induce rich polymorphic behaviour in a compound. The fenamate group present in flufenamic acid (9 polymorphs) and tolfenamic acid (8 polymorphs) has been argued to be a polymorphophore.29
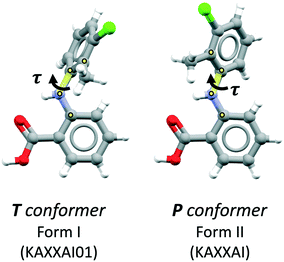
Here we study the anti-inflammatory drug tolfenamic acid (TFA), a well-studied model compound with eight known polymorphs to date. The molecule has a fenamate substructure with one main torsional degree of freedom represented by the angle τ in Fig. 1. The other plausible torsions of the molecule are “locked” by an intramolecular hydrogen bond between the central amine N–H group and the oxygen atom of the carboxylic group. The two stable conformers of TFA, also shown in Fig. 1, have a low energy barrier for their interconversion,30 and they are both present in the eight known polymorphs of TFA. Of its eight polymorphs, two are very common (forms I and II) and readily accessible from most organic solvents whilst the remaining six are very difficult to crystallise. Because of that, the white form I and the yellow form II31,32 of TFA have been the subject of numerous studies pertaining to their stabilities as well as their nucleation and interconversion.30,33–36 The other polymorphs (III–VIII), in contrast, have only been reported in a few studies, and their discovery was only possible by crystallisations performed on templating agents, either in solution or by sublimation.37–39
Despite the numerous studies and explorations on the polymorphism of TFA, to our surprise, we came across a new form which was readily crystallised from isopropanol (IPA) by simple fast cooling crystallisation. The new form, form IX, appears concomitantly with the stable form I and the metastable form II from pure TFA solutions in IPA. We report, in this contribution, on the structure and stability of form IX relative to the most common readily available forms I and II, providing a comprehensive characterisation of this form. We then discuss the polymorphism of TFA and analyse some of the factors that could be responsible for the late appearance of this polymorph.
2. Methods
Materials
Tolfenamic acid (in its form I) was purchased from Fluorochem Ltd. 2-Propanol (IPA, purity > 98%) was purchased from Fisher Scientific UK Ltd.Crystallisation of form IX for single-crystal X-ray diffraction
A suspension of TFA-I in 2-propanol (IPA) (approximately 0.04 g g−1) was heated to 50 °C. After all of the crystals had dissolved, 10 mL of the solution were filtered with a 0.2 μm Millipore filter in a crystallising dish of 6 cm in diameter, which was covered with parafilm and immediately put in a fridge at around 5 °C. After about 2 hours, analysis with an optical microscope revealed the presence of small crystals with three different morphologies: elongated clear crystals of form I, thin yellow needles of form II and a few clear blocky crystals which were later identified as form IX. Two of the form IX crystals were recovered for X-ray diffraction analysis.Crystallisations of TFA polymorphs for stability analysis and solubility measurements
In order to produce larger quantities of form IX TFA, seed crystals obtained with the procedure described above were first grown in IPA saturated solutions, ground and then used for seeded batch crystallisations in volumes of 100 ml IPA in the 25–20 °C range. TFA-II was crystallised by crash-cooling IPA supersaturated solutions to 5 or 10 °C. TFA-I was used as purchased. All powders were analysed by powder X-ray diffraction (PXRD) and by optical microscopy.Single crystal X-ray diffraction
Single crystal X-ray diffraction data were collected at 293 K on a four-circle Oxford Diffraction Xcalibur diffractometer equipped with an Atlas detector, using graphite-monochromated Mo Kα radiation (0.7107 Å) and a ω-scan collection strategy at 50s per frame. Data reduction and absorption correction, as well as face-indexing of the crystal sample, were performed with the CrysalisPro software.40 The crystal structure was solved by direct methods and refined with the least-squares procedure using SHELX.41,42 All non-hydrogen atoms were refined anisotropically. N–H and O–H hydrogen atom positions were assigned according to difference Fourier maps and refined applying distance restraints (0.87 ± 0.2 Å and 0.82 ± 0.2 Å, respectively). The remaining hydrogen atoms were placed at idealised positions and riding-motion restraints were applied.Powder X-ray diffraction (PXRD)
All PXRD patterns were collected on a Bruker D2-Phaser benchtop diffractometer using monochromated Cu Kα radiation (1.5406 Å) in the 2θ 4–50° range. Qualitative phase analysis of the powder patterns was performed against a custom user database using the Bruker DIFFRAC.EVA software.Thermal analysis and hot stage microscopy
Powder samples of TFA forms I, II and IX were analysed by differential scanning calorimetry (DSC) using a TA instruments DSC2500 with hermetically sealed TZero aluminium pans and a heating rate of 10 K min−1. Hot-stage microscopy analysis was performed with a Linkam THMS 600 microscope stage and a Linkam TMS 93 temperature controller.Slurry experiments
Solvent mediated phase transformation experiments (also known as slurries) of mixtures of TFA polymorphs in IPA at temperatures of 2 °C, 20 °C and 40 °C (275 K, 293 K and 313 K, respectively) were carried out using about 200 mg of a 50% weight mixture of TFA-II and IX (sometimes with minor impurities of TFA-I). Temperature control was achieved using a Julabo thermostat. A TFA-I suspension was stirred at the desired temperature for 2 hours and the resulting saturated solution was filtered in a jacketed vessel containing the TFA-II/IX mixture so that the powder was barely covered by the solution. The jacketed vessel containing the powders had been kept at the working temperature for at least one hour prior to the addition of the solution. Samples of the slurry were then collected at intervals of time and analysed by PXRD.Solubility measurement
The solubility curves of TFA forms I, II and IX in IPA were estimated by turbidity measurements using a Technobis Crystallization Systems Crystal16 multi-vial reactor, by detecting the clear point of suspensions of known composition after heating at 0.3 K min−1. The slurries were monitored to ensure that no transformation to a more stable polymorph had taken place before dissolution.DFT calculations
Periodic DFT simulations were performed with VASP version 5.4.4 (ref. 43–46) using the PBE functional47 with PAW pseudopotentials.48,49 For TFA-I and II, the structures with CSD50 refcodes KAXXAI01 and KAXXAI were used. All crystal structures were optimised with tight settings using the Tkatchenko–Scheffler (TS) dispersion correction,51 first relaxing both atomic positions and cell parameters, and then optimising atomic positions only. After the optimisation steps, single-point energy calculations were performed applying the many-body dispersion correction (MBD).52,53 All DFT calculations were performed using a 520 eV cut-off energy for the planewaves, while the Brillouin zone was sampled using the Monkhorst–Pack approximation, with k-points spacing of at least 0.03 Å−1. For the single-point MBD calculation step, the mesh was increased by doubling the number of k-points on each side of the cell. The calculation of vibrational phonon modes was performed at the Γ point using the finite-difference (FD) method with the TS correction as implemented in VASP (IBRION = 6), with a model built from the TS optimised structures using displacements of 0.005 Å on supercells of at least 10 × 10 × 10 Å as recommended in the literature.54 A couple of structures required the use of smaller supercell lengths to shorten the computational time needed for the calculations (see ESI†). In these instances, the results of the computations were carefully monitored to ensure the stability of the systems. All calculations resulted in no imaginary frequencies except for the three acoustic modes, which had frequency values of less than 0.2 cm−1 in all cases.The vibrational contribution to the free energy was estimated within the harmonic approximation from the phonon modes spectrum using eqn (1).55
 | (1) |
 | (2) |
| A(T) = EMBDlatt + Fvib(T) | (3) |
Normalised crystal rugosities
Smooth crystal surfaces have been recently linked to low surface energies and in turn to polymorphs that are easier to nucleate. A computational method has been developed by the Cruz-Cabeza's group using the CSD Python API50 to compute the “normalised crystal rugosities”.56 This method is based on the molecular rugosity model of Bryant, Maloney and Sykes (BMS).57 The BMS method uses topological analysis of the crystal surfaces to calculated a distance which represents the degree of interpenetration of (hkl) faces. A negative value refers to an interpenetrated layer with the reported distance referring to the depth of the ridges of the face. The normalised crystal rugosities are then constructed by computing the interpenetration parameter with the BMS model for each of the (hkl) faces, normalising them by their corresponding dhkl value and weighting them by the BFDH morphological importance of each of the (hkl) faces. The normalised crystal rugosity, thus, is an indication of how rough or smooth the overall crystallite of a crystal form is with the assumption of a BFDH morphology. Using this computational model, we were thus able to then derive the computed average normalised crystal rugosities.3. Results for TFA-IX
3.1 First observation of TFA-IX
Crystals of a new polymorph of tolfenamic acid were observed as the result of a crystallisation experiment performed in IPA at low temperature (about 5 °C). The intent of the crystallisation was to produce good quality single crystals of the yellow metastable polymorph form II. Unexpectedly, when the contents of the crystallising dish were inspected with an optical microscope, together with the common needle-like crystals of form I and form II, we observed a small number of crystals with a morphology that was noticeably different (Fig. 2 and ESI†). A couple of these small, colourless blocks were immediately recovered for X-ray diffraction analysis. The crystallisation procedure was repeated several times yielding the same results, allowing us to recover more of the well-formed crystals of form IX, which were then used as seeds for further crystallisations. Despite appearing colourless when small (0.2 mm), bigger crystals (about 1 mm) were pale yellow, while powders obtained by grinding appeared light pink.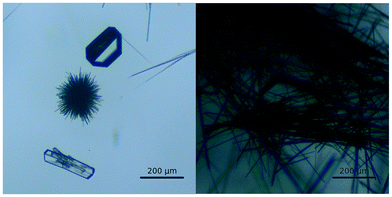 | ||
| Fig. 2 Micrograph images of concomitant crystals of TFA-I (left, laths), II (thin needles) and IX (blocks). | ||
3.2 Crystal structure of TFA-IX
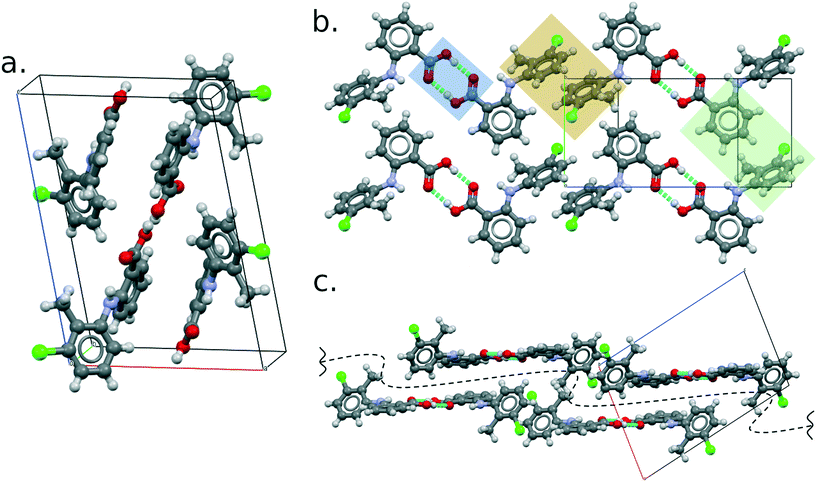
The crystal structure of TFA-IX was solved from diffraction data collected at room temperature and the relevant crystallographic parameters can be found in Table 1, while details of the data collection and structure refinement can be found in the ESI.† The structure is monoclinic (P21/c) with one molecule in the asymmetric unit, which has a conformation close to the near planar conformer (P, see Fig. 1) with a τ angle of 133°. A comparison of the simulated PXRD pattern (Fig. 3) and of the crystal packing of TFA-IX with the CSD structures of tolfenamic acid (refcode family KAXXAI) confirmed that this crystal structure represents a true polymorph.58 Detailed results of these comparisons can be found in the ESI.†| Temperature/K | 293.3(7) |
| Formula | C14H12ClNO2 |
| Z, Z′ | 4, 1 |
| Space group | P21/c |
| a/Å | 10.5841(11) |
| b/Å | 7.8503(6) |
| c/Å | 14.9718(13) |
| α/° | 90 |
| β/° | 101.399(9) |
| γ/° | 90 |
| Volume/Å3 | 1219.44(19) |
| ρ calc/g cm−3 | 1.425 |
| μ/mm−1 | 0.305 |
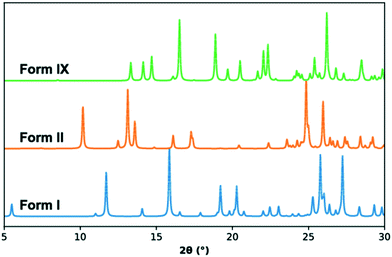 | ||
| Fig. 3 Simulated PXRD patterns for form I (KAXXAI01, blue), form II (KAXXAI, orange) and form IX (this study, green) TFA. | ||
Like all of the other eight polymorphs of this compound, the TFA molecules form R22(8) hydrogen-bonded dimers (Fig. 4b) which then pack making use of aromatic stacking and t-type interactions. These interactions form 2D layers parallel to the (10−1) plane (perpendicular view in Fig. 4b and side view in Fig. 4c), which then stack to form the 3D crystal structure thanks to weak C–H⋯Cl hydrogen bonds. The geometric parameters of the principal intermolecular interactions are reported in the ESI.†
3.3 Relative stability of TFA-IX from DFT calculations
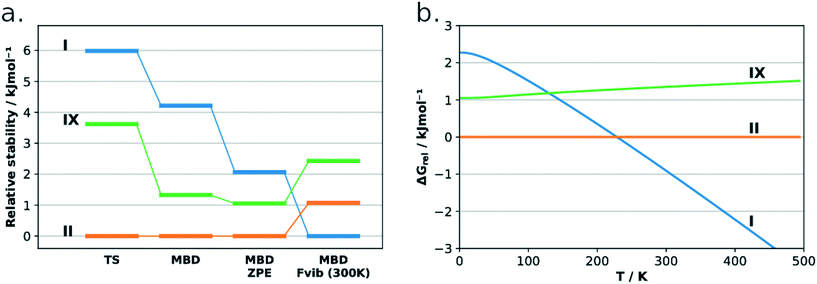
The lattice energies of the three concomitant tolfenamic acid polymorphs – forms I, II and IX – were calculated using dispersion-corrected periodic DFT. The vibrational contributions to the lattice free energies were also estimated from calculations of phonon modes at the Γ point using the harmonic approximation, as this approach can lead to considerable improvement in the energy ranking of polymorphs of molecular crystals.54Static calculations of lattice energies with the TS dispersion correction (Fig. 5a) find TFA-II as the stable polymorph at low temperature, followed by TFA-IX (+3.6 kJ mol−1) and TFA-I (+6.0 kJ mol−1). Although the same ranking is maintained when the MBD dispersion correction is applied (+1.3 kJ mol−1 and +4.2 kJ mol−1 for TFA-IX and I, respectively) and when the zero-point energy is included (+1.1 kJ mol−1 and +2.3 kJ mol−1), the energy differences between all polymorphs shrink from 6.0 kJ mol−1 (PBE-TS only) to just 2.3 kJ mol−1 (PBE-TS with MBD + ZPE). When the thermal vibrational energy is also considered, the calculated stabilities change drastically with form I eventually becoming the stable polymorph at higher temperatures, and its free energy curve (Fig. 5b) crossing the curve of form IX at 130 K and the curve of form II at 230 K. Thus, according to our DFT calculations, the polymorphic pairs I–II and I–IX are enantiotropically related, while the pair II–IX is monotropically related. Because we have ignored the contribution of thermal expansion to the vibrational energy, the calculated transition temperatures should not be considered the real thermodynamic transition points between these polymorphs. However, it was found that the impact of thermal expansion on the vibrational energy is generally small when free energy differences between polymorphs are considered.59 Moreover, the enantiotropic relationship for the I–II pair, with a transition temperature below 273 K, was already suggested by Du and co-workers.30
3.4 Thermal analysis
The DSC curves of TFA polymorphs I, II and IX are reported in Fig. 6. The curves of forms II and IX present a small endothermic peak at 417 K (144 °C) and 408 K (135 °C), respectively, corresponding to a solid–solid phase transformation to form I in both cases. The melting of form I at 485 K (212 °C) then produces the large endothermic peak observed in all three curves. The onset temperatures and the enthalpy values corresponding to these thermal events are presented in Table 2, each with its associated standard error. The data presented here for TFA-I and II agrees with previous observations.30,33 In the case of form IX, the transformation to form I was confirmed by PXRD analysis and hot-stage microscopy (see ESI† for more details). The enantiotropic relationship between the two pairs of polymorphs, I–II and I–IX, suggested by the results of our DFT calculations is supported by the heat of transition rule of Burger and Ramberger,60 as the presence of the endothermic transformation in the DSC curves indicates a transition point at some temperature below it. The effect of faster heating rates on the position of the endothermic peaks for the polymorphic transformation was also verified. In general, a faster heating rate resulted in the shift of the transformation of forms II and IX to higher temperatures, while the onset temperature of the melting endothermic peak was not affected (see ESI†).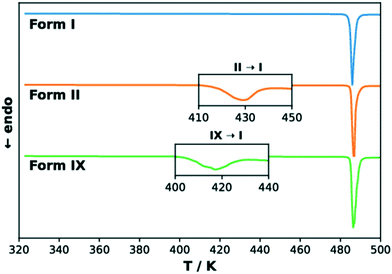 | ||
| Fig. 6 Normalised DSC thermograms for TFA forms I (blue), II (orange) and IX (green). The insets show magnifications of the endothermic peaks for the transformation to form I. | ||
The enthalpy differences measured by DSC are remarkably similar to the ab initio predicted energy differences obtained at 0 K including the zero-point energy correction (PBE-TS + MBD + ZPE), which further emphasises the importance of considering the contributions of vibrational frequencies when calculating the relative stability of polymorphs.
3.5 Slurry experiments
The stability ranking of TFA-IX with respect to the other two polymorphs of tolfenamic acid (I and II) was verified experimentally by means of solution-mediated phase transformation experiments in IPA (slurries). The slurries were carried out with the procedure described in the Methods section starting from 50%![[thin space (1/6-em)]](https://www.rsc.org/images/entities/char_2009.gif) :
:![[thin space (1/6-em)]](https://www.rsc.org/images/entities/char_2009.gif) 50% mixtures of the desired TFA polymorphs.
50% mixtures of the desired TFA polymorphs.
First, we carried out some preliminary slurry experiments of forms I and II mixtures in IPA which resulted in the complete transformation of form II (yellow polymorph) to form I (white polymorph). Analogous experiments had been carried out for TFA-I and TFA-II in ethyl acetate by Du and co-workers,30 who also demonstrated that form I is the stable polymorph at temperatures higher than 0 °C. Tang et al. reached the same conclusion using ethanol instead.36
Knowing that form I is more stable than form II, we proceeded then to establish the relationship between forms II and IX. For this, 50%![[thin space (1/6-em)]](https://www.rsc.org/images/entities/char_2009.gif) :
:![[thin space (1/6-em)]](https://www.rsc.org/images/entities/char_2009.gif) 50% mixtures of II
50% mixtures of II![[thin space (1/6-em)]](https://www.rsc.org/images/entities/char_2009.gif) :
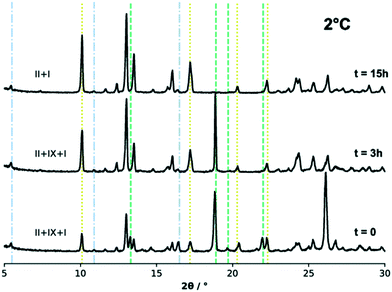
:![[thin space (1/6-em)]](https://www.rsc.org/images/entities/char_2009.gif) IX were slurried in IPA at three different temperatures. We note that in some batches, form IX powders contained a small amount of form I. Fig. 7 shows the powder patterns collected from the excess solids during the slurry experiments performed at 2 °C (275 K) and at three different time intervals, while the results for the experiments at 20 °C and 40 °C (293 K and 313 K) can be found in the ESI.†
IX were slurried in IPA at three different temperatures. We note that in some batches, form IX powders contained a small amount of form I. Fig. 7 shows the powder patterns collected from the excess solids during the slurry experiments performed at 2 °C (275 K) and at three different time intervals, while the results for the experiments at 20 °C and 40 °C (293 K and 313 K) can be found in the ESI.†
The phase analysis of the excess solids in the slurries was carried out qualitatively against a user database of the forms I, II and IX experimental and simulated patterns using the DIFFRAC.EVA software. For the sake of clarity, however, only a few of the characteristic diffraction peaks of each polymorphic phase are indicated in Fig. 7 with dashed lines. The initial solid mixture was composed of a 50%![[thin space (1/6-em)]](https://www.rsc.org/images/entities/char_2009.gif) :
:![[thin space (1/6-em)]](https://www.rsc.org/images/entities/char_2009.gif) 50% TFA-II (major peak at 2θ = 10°) and TFA-IX (major peak at 2θ = 19°) mixture. There was, however, a small amount of form I present in the TFA-IX powders (thus small peaks for form I diffraction are also observed).
50% TFA-II (major peak at 2θ = 10°) and TFA-IX (major peak at 2θ = 19°) mixture. There was, however, a small amount of form I present in the TFA-IX powders (thus small peaks for form I diffraction are also observed).
All slurry experiments at all temperatures resulted in the complete transformation of form IX into the more stable form II. At lower temperature, the transformation of form IX was slow and took place overnight (observed after 15 hours). Although a minor quantity of the stable TFA-I was also present in the starting mixture, it did not affect the overall result of the experiment. The transformation became noticeably faster with increasing temperature, and a complete phase transition to form II was observed within 1 hour for the experiment at 20 °C and 20 minutes at 40 °C. In the latter case, some of the stable form I nucleated after about 10 minutes and eventually became the only phase present (after about 1 hour from the start of the experiment).
In summary, these experiments also show that under the studied range of temperatures (2–40 °C), form I is the most stable form followed by form II and form IX.
3.6 Solubility measurements
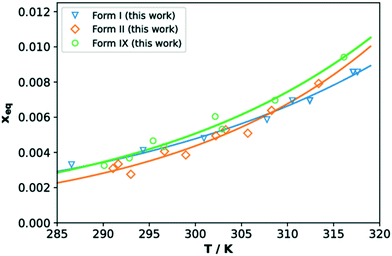
The solubilities of TFA forms IX, I and II in IPA (given as molar fraction) measured with the Crystal16 are reported in Fig. 8. Our data are comparable to those reported for forms I and II in previous works (see ESI†). The measured solubilities of all three forms are very close, thus in agreement with the small differences in crystal free energies computed with DFT. In the temperature range here considered, TFA-IX always has a higher solubility than the other two forms which explains the results of the solvent-mediated phase transformation experiments, where form IX transforms to the more stable forms II and I.61 The solubility curves of forms I and II were found to cross around 309 K which is above the expected value since form I is always more stable than form II in this range of temperatures. This may be a consequence of the inaccuracies of turbidity methods to assess solubility, which can in turn depend on many factors including particle aggregation and differences in dissolution rates.62 However, we have decided to use the Crystal16 methodology given the problematics normally related to the determination of solubility of metastable polymorphs63 and the small available quantities of TFA-IX.4. Discussions
We have characterised a new polymorph of TFA, form IX, with a number of complementary computational and experimental techniques. The stability of the form was then calculated and measured relative to the common form I and form II polymorphs of tolfenamic acid. All three polymorphs lie within 2 kJ mol−1 in relative stability from each other, typical of polymorphs.2,55,64 All techniques agree in establishing a relative order of stability for these forms which is summarised in the form of a graph in Fig. 9. At low temperature, the order of stability is II > IX > I. Due to the more favourable entropic contributions of form I, the stability order at room temperature reverses to I > II > IX. The calculated transition temperatures between forms I and IX and I and II were 130 K and 230 K, respectively.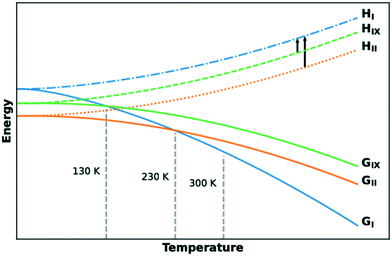 | ||
| Fig. 9 Free energy and enthalpy diagrams of forms I, II and IX as a function of temperature. The black arrows indicate quantities measured experimentally by DSC measurements. | ||
We were surprised to discover the new form IX from a simple fast cooling crystallisation in IPA to low temperature (5 °C). Despite the many studies on the polymorphism of TFA, this form had never been described until now. The discovery of the new form IX, however, was claimed in a recent patent (ESI†). The authors obtained the form from fast cooling crystallisations of TFA to ∼5 °C from several solvents, including 2-butanol![[thin space (1/6-em)]](https://www.rsc.org/images/entities/char_2009.gif) :
:![[thin space (1/6-em)]](https://www.rsc.org/images/entities/char_2009.gif) acetone (2.5
acetone (2.5![[thin space (1/6-em)]](https://www.rsc.org/images/entities/char_2009.gif) :
:![[thin space (1/6-em)]](https://www.rsc.org/images/entities/char_2009.gif) 1), acetone and ethanol
1), acetone and ethanol![[thin space (1/6-em)]](https://www.rsc.org/images/entities/char_2009.gif) :
:![[thin space (1/6-em)]](https://www.rsc.org/images/entities/char_2009.gif) acetone. Our attempts to repeat crystallisation of form IX under these conditions failed in all cases with either form I or II being crystallised. From IPA, however, we were able to obtain form IX repeatedly and consistently by fast cooling from saturated solutions at 50 °C.
acetone. Our attempts to repeat crystallisation of form IX under these conditions failed in all cases with either form I or II being crystallised. From IPA, however, we were able to obtain form IX repeatedly and consistently by fast cooling from saturated solutions at 50 °C.
Although this is the first time the structure of form IX is reported, it had indeed been predicted computationally by the group of Price and co-workers (Fig. 10a). The energy model used for the authors' refined CSP landscapes consisted of a rigid-body free-energy model to estimate the thermodynamic stability at room temperature.38 In their refined 298 K landscape, form IX was correctly predicted as being metastable with regards to forms I and II as well as a number of other of the known TFA polymorphs. As discussed in the introduction, the challenges of these landscapes are still many including: i) the close lattice energies of polymorphs and thus the high accuracies required in the computational methods, ii) in this case the importance of entropy contributions to achieve a correct ranking of structures and iii) the lack of links between these landscapes and the experimental conditions of crystallisation.
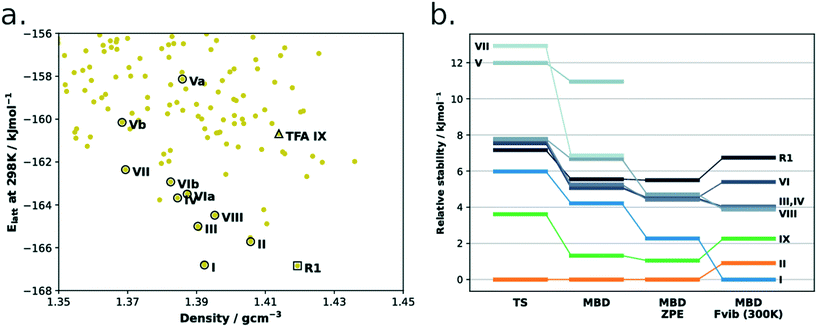 | ||
| Fig. 10 (a) CSP energy landscape of TFA. Original data from the work of Price et al. (ref. 38). Hollow circles represent experimental structures (or their disorder components), the rank 1 predicted structure (R1) is indicated by the hollow square, while the hollow triangle is the prediction corresponding to the new form IX. Two ideally perfect structures are predicted for forms V and VI (named as a and b). (b) DFT-d ranking of TFA polymorphs using different computational methods. The rank 1 structure is also present. | ||
Together with Fig. 10, to aid the discussion, we have summarised the CSD refcodes, conformer information (T for twisted, and P for nearly planar), crystallisation conditions and reported crystal morphologies of all nine polymorphs of TFA in Table 3. We also report the computed free energy differences (PBE-TS + MBD + Fvib at 300 K) and the average normalised crystal rugosities. We note that we found a high similarity between forms IV and VI; when these two structures were geometry optimised with the DFT-d(TS) method, both converged to extremely similar crystal structures at 0 K but still with ever so slightly different vibrational contributions at 300 K.
| Form | Refcode | Confa | Crystallisation conditions | Morphologies | ΔG (kJ mol−1)b | Normalised crystal rugosities |
|---|---|---|---|---|---|---|
| a T = twisted, P = nearly planar. b PBE-TS + MBD + Fvib at 300 K, this quantity was not calculated for TFA-V and TFA-VII. c Ref. 31. d Ref. 37. e Ref. 38. f Ref. 39. | ||||||
| I | KAXXAI01c | T | Most solvents, slow cooling, slow evaporation or slurries | White needles | 0.0 | −0.13 |
| II | KAXXAIc | P | Most solvents, fast cooling, fast evaporation | Yellow thin needles | 0.9 | −0.14 |
| III | KAXXAI02d | P | Slow evaporation in ethanol in the presence of the polymer DVB![[thin space (1/6-em)]](https://www.rsc.org/images/entities/char_2009.gif) : :![[thin space (1/6-em)]](https://www.rsc.org/images/entities/char_2009.gif) n-BuMA n-BuMA![[thin space (1/6-em)]](https://www.rsc.org/images/entities/char_2009.gif) : :![[thin space (1/6-em)]](https://www.rsc.org/images/entities/char_2009.gif) MMA (26 MMA (26![[thin space (1/6-em)]](https://www.rsc.org/images/entities/char_2009.gif) : :![[thin space (1/6-em)]](https://www.rsc.org/images/entities/char_2009.gif) 29 29![[thin space (1/6-em)]](https://www.rsc.org/images/entities/char_2009.gif) : :![[thin space (1/6-em)]](https://www.rsc.org/images/entities/char_2009.gif) 60) 60) |
Prisms | 4.0 | −0.18 |
| IV | KAXXAI03d | P | Slow evaporation in ethanol in the presence of the polymer DVB![[thin space (1/6-em)]](https://www.rsc.org/images/entities/char_2009.gif) : :![[thin space (1/6-em)]](https://www.rsc.org/images/entities/char_2009.gif) t-BuMA (26 t-BuMA (26![[thin space (1/6-em)]](https://www.rsc.org/images/entities/char_2009.gif) : :![[thin space (1/6-em)]](https://www.rsc.org/images/entities/char_2009.gif) 73) 73) |
Plates | 4.0 | −0.15 |
| V | KAXXAI04d | P | Slow evaporation in ethanol in the presence of the polymer DVB![[thin space (1/6-em)]](https://www.rsc.org/images/entities/char_2009.gif) : :![[thin space (1/6-em)]](https://www.rsc.org/images/entities/char_2009.gif) n-BuMA n-BuMA![[thin space (1/6-em)]](https://www.rsc.org/images/entities/char_2009.gif) : :![[thin space (1/6-em)]](https://www.rsc.org/images/entities/char_2009.gif) STY (26 STY (26![[thin space (1/6-em)]](https://www.rsc.org/images/entities/char_2009.gif) : :![[thin space (1/6-em)]](https://www.rsc.org/images/entities/char_2009.gif) 60 60![[thin space (1/6-em)]](https://www.rsc.org/images/entities/char_2009.gif) : :![[thin space (1/6-em)]](https://www.rsc.org/images/entities/char_2009.gif) 29) 29) |
Plates | — | −0.09 |
| VI | KAXXAI07e | P | By sublimation onto isomorphous mefenamic acid (form I) | Plates | 5.4 | −0.11 |
| KAXXAI08f | Slow evaporation from a 1![[thin space (1/6-em)]](https://www.rsc.org/images/entities/char_2009.gif) : :![[thin space (1/6-em)]](https://www.rsc.org/images/entities/char_2009.gif) 1 mixture of acetone and methanol with mefenamic acid I hetero-seeding 1 mixture of acetone and methanol with mefenamic acid I hetero-seeding |
|||||
| VII | KAXXAI05e | P | By sublimation onto a solid solution of TFA![[thin space (1/6-em)]](https://www.rsc.org/images/entities/char_2009.gif) : :![[thin space (1/6-em)]](https://www.rsc.org/images/entities/char_2009.gif) FFA FFA |
Laths | — | −0.15 |
| VIII | KAXXAI06e | T | By sublimation onto copper surfaces | Powders | 3.9 | −0.09 |
| IX | This study | P | Fast cooling to 2–5 °C in IPA | Regular blocks | 2.3 | −0.20 |
With regards to the ZPE and free energy calculations, we note that form I is considerably stabilised (relative to the other forms) when ZPE and Fvib contributions are taken into account (Fig. 10b and Table 3). An analysis of computed frequencies (ESI†) reveals that form I has overall lower frequencies than the other forms in the mid to low range of the spectrum (0–2500 cm−1) whilst the higher energy modes (2500–3500 cm−1) remain very similar across forms. This suggests, thus, that low-mid vibrational modes are responsible for the form I greater stability at higher temperatures.
Six of the nine polymorphs require templating agents in solution and/or sublimation for them to be crystallised (Table 3). Only two of the polymorphs crystallise with the twisted conformer (T) whilst the remaining seven do so with the nearly planar conformer (P). We also note that the two forms that can be easily crystallised from solution, I and II, are needles, whilst the remaining forms are either plates, laths, prisms or blocks.
The three polymorphs of TFA that can be crystallised from solution without templating agents have been studied in detail in this contribution (forms I, II and IX). These three forms – forms I, II and IX – were calculated to be the most stable amongst all of the known forms of this compound (Fig. 10, Table 3). Their thermodynamic stability offers a possible justification for their tendency to crystallise from solution, while more laborious crystallisation techniques are required to isolate the remaining more highly metastable polymorphs (ΔG[300 K] > 3 kJ mol−1). The small free energy difference between the three forms (ΔG[300 K] < 2.5 kJ mol−1), and consequently their similar solubilities in IPA, enabled us to identify an experimental domain (IPA low temperature) where the three polymorphs can be crystallised concomitantly.65
In recent work by Montis and co-workers, the concept of crystal rugosity was introduced as a plausible tool to link predicted polymorphic landscapes and kinetic accessibility of crystal forms.56 Their argument, based on an extensive comparison of several polymorphic systems, was that polymorphs possessing an overall higher particle rugosity might be “harder” to nucleate. To this end, we observe that the crystal rugosity of TFA-IX is greater (in absolute terms, rougher surfaces) than those of all TFA polymorphs, and specifically to those of forms I and II. Thus, despite form IX being very close in stability to forms I and II, the late appearance of this form may be justified because of its difficulty (less probable) to nucleate because of its rougher surfaces. Forms with rougher surfaces may require crossing higher energy barriers for nucleation and this is precisely what the rugosity calculations imply.
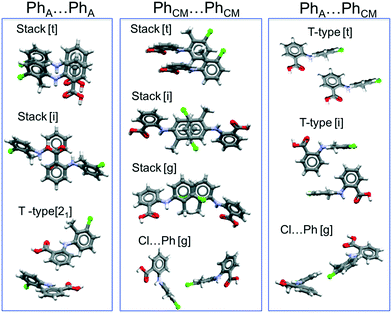
To extend these considerations, we have analysed the principal intermolecular interactions found in the crystal structures of the nine TFA polymorphs. Because TFA forms R22(8)hydrogen bonded dimers (∼−70 kJ mol−1, as estimated using the PIXEL method by Gavezzotti66) in all of the polymorphs, the differences between the forms must thus arise from the various ways those dimers pack in the solid state. Fig. 11 shows the principal packings of the aromatic rings (PhA = for the acid ring, PhCM = for the methyl and Cl substituted ring) of TFA as found in the polymorphs. A detailed analysis of these packings as well as their energies are presented in the ESI.† Of importance here is that interactions between TFA molecules that are related by translational symmetry (indicated by [t] in the figure) propagate continuously within the crystal structure, forming one-dimensional periodic bond chains. For benzoic acid derivatives, recent work has revealed the important role played by aromatic stacking in the kinetics of nucleation and growth for these compounds.67–69 In particular, the work by the Manchester crystallisation group67,68 concluded that continuous propagating aromatic stacking controls the kinetic outcome of both crystal nucleation and crystal growth (which were found to be correlated).
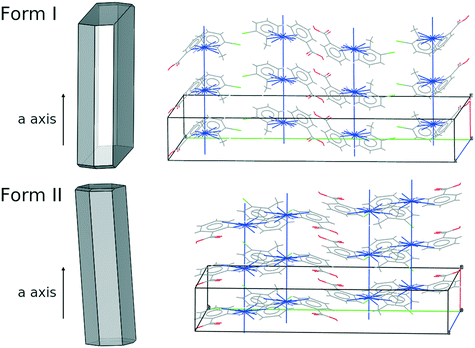
Of all of the TFA–TFA dimers, stacking of TFA molecules involving both aromatic rings (Stack[t] in Fig. 11) results in the strongest continuous TFA–TFA interaction. Such interaction is present exclusively in forms I (−41.6 kJ mol−1), II (−46.8 kJ mol−1) and VIII (−42.3 kJ mol−1). However, whilst forms I and II are low energy (favoured by thermodynamics), form VIII is metastable (+3.9 kJ mol−1 at 300 K) and has never been crystallised from solution. In the more stable forms I and II, these propagating interactions are parallel to the needle axis (Fig. 12), suggesting that growth along this direction is kinetically favoured. Similar continuous interactions are instead absent in the new TFA polymorph presented here, form IX, thus eventual nuclei of this form would not only possess a higher intrinsic rugosity (harder to nucleate), but their growth would also be slower compared to the competing polymorphs I and II. Hence, the question as to why this form IX had never been observed before may be answered in terms of nucleation and growth kinetics.
5. Conclusion
We have reported on a new polymorph of TFA, form IX, obtained from straight forward cooling crystallisation in IPA to low temperatures. The crystallisation method developed to produce this form is robust and reproducible and always affords form IX albeit concomitantly with forms I and II. The crystal structure of this new form was determined from single-crystal X-ray diffraction data and was shown to have carboxylic acid dimers packed with a number of non-continuous aromatic interactions. Form IX was further characterised with regards to the most common forms I and II using a combination of state-of-the art DFT-d calculations as well as a number of experiments including solubility measurements, thermal analysis and competitive solvent mediated transformations. All data revealed this form to be slightly metastable with regards to forms I and II at room temperature, with a free energy difference between these three forms of less than 2.5 kJ mol−1. Despite TFA being such a well-studied model polymorphic compound, this form (produced via a straightforward cooling crystallisation) had never been reported before. We found this very surprising and this experience reminds us once more just how unpredictable the appearance of some polymorphs can be and how screening of forms needs to be done not only in a variety of solvents but also at a variety of temperature and pressure conditions. Whilst this new form IX had been predicted computationally in the past, our work also shows how sensitive polymorph rankings of this system are to the energy model used. For this system in particular, accounting for lattice vibrations and crystal free energies with an excellent computational model was essential for the calculations to predict the correct free energy stability of the forms. These calculations remain computationally expensive, especially if their application is to be attempted on predicted landscapes with hundreds of plausible computer-generated forms. An analysis of the previously known forms of TFA and comparison with form IX revealed that kinetics of nucleation and growth most likely disfavour this form experimentally.Conflicts of interest
There are no conflicts to declare.Acknowledgements
PS thanks Eli Lilly and Company for funding. The authors thank Professor Roger Davey and Dr. Thomas Vetter for helpful discussions. The authors also thank Professor Sally Price and Dr. Louise Price for providing the CSP landscape for TFA. The authors would like to acknowledge the assistance given by Research IT and the use of the Computational Shared Facility at The University of Manchester.References
- J. Bernstein, Polymorphism in Molecular Crystals, 2010 Search PubMed.
- A. J. Cruz-Cabeza, S. M. Reutzel-Edens and J. Bernstein, Chem. Soc. Rev., 2015, 44(23), 8619–8635 RSC.
- L. Bofill, D. De Sande, R. Barbas, A. Frontera and R. Prohens, CrystEngComm, 2020, 22(28), 4680–4684 RSC.
- S. R. Chemburkar, J. Bauer, K. Deming, H. Spiwek, K. Patel, J. Morris, R. Henry, S. Spanton, W. Dziki, W. Porter, J. Quick, P. Bauer, J. Donaubauer, B. A. Narayanan, M. Soldani, D. Riley and K. McFarland, Org. Process Res. Dev., 2000, 4(5), 413–417 CrossRef CAS.
- J. Haleblian and W. McCrone, J. Pharm. Sci., 1969, 58(8), 911–929 CrossRef CAS PubMed.
- O. Egorova, R. Hafizi, D. C. Woods and G. M. Day, J. Phys. Chem. A, 2020, 124(39), 8065–8078 CrossRef CAS PubMed.
- S. Yang and G. M. Day, ChemRxiv, 2020.
- S. L. Price, Acc. Chem. Res., 2009, 42(1), 117–126 CrossRef CAS PubMed.
- A. M. Reilly, R. I. Cooper, C. S. Adjiman, S. Bhattacharya, A. D. Boese, J. G. Brandenburg, P. J. Bygrave, R. Bylsma, J. E. Campbell, R. Car, D. H. Case, R. Chadha, J. C. Cole, K. Cosburn, H. M. Cuppen, F. Curtis, G. M. Day, R. A. DiStasio, A. Dzyabchenko, B. P. Van Eijck, D. M. Elking, J. A. Van Den Ende, J. C. Facelli, M. B. Ferraro, L. Fusti-Molnar, C. A. Gatsiou, T. S. Gee, R. De Gelder, L. M. Ghiringhelli, H. Goto, S. Grimme, R. Guo, D. W. M. Hofmann, J. Hoja, R. K. Hylton, L. Iuzzolino, W. Jankiewicz, D. T. De Jong, J. Kendrick, N. J. J. De Klerk, H. Y. Ko, L. N. Kuleshova, X. Li, S. Lohani, F. J. J. Leusen, A. M. Lund, J. Lv, Y. Ma, N. Marom, A. E. Masunov, P. McCabe, D. P. McMahon, H. Meekes, M. P. Metz, A. J. Misquitta, S. Mohamed, B. Monserrat, R. J. Needs, M. A. Neumann, J. Nyman, S. Obata, H. Oberhofer, A. R. Oganov, A. M. Orendt, G. I. Pagola, C. C. Pantelides, C. J. Pickard, R. Podeszwa, L. S. Price, S. L. Price, A. Pulido, M. G. Read, K. Reuter, E. Schneider, C. Schober, G. P. Shields, P. Singh, I. J. Sugden, K. Szalewicz, C. R. Taylor, A. Tkatchenko, M. E. Tuckerman, F. Vacarro, M. Vasileiadis, A. Vazquez-Mayagoitia, L. Vogt, Y. Wang, R. E. Watson, G. A. De Wijs, J. Yang, Q. Zhu and C. R. Groom, Acta Crystallogr., Sect. B: Struct. Sci., Cryst. Eng. Mater., 2016, 72(4), 439–459 CrossRef CAS PubMed.
- C. R. Taylor, M. T. Mulvee, D. S. Perenyi, M. R. Probert, G. M. Day and J. W. Steed, J. Am. Chem. Soc., 2020, 142(39), 16668–16680 CrossRef CAS PubMed.
- A. G. Shtukenberg, S. S. Lee, B. Kahr and M. D. Ward, Annu. Rev. Chem. Biomol. Eng., 2014, 5, 77–96 CrossRef CAS PubMed.
- L. Y. Pfund, C. P. Price, J. J. Frick and A. J. Matzger, J. Am. Chem. Soc., 2015, 137(2), 871–875 CrossRef CAS PubMed.
- V. K. Srirambhatla, R. Guo, S. L. Price and A. J. Florence, Chem. Commun., 2016, 52(46), 7384–7386 RSC.
- A. G. Shtukenberg, M. Tan, L. Vogt-Maranto, E. J. Chan, W. Xu, J. Yang, M. E. Tuckerman, C. T. Hu and B. Kahr, Cryst. Growth Des., 2019, 19(7), 4070–4080 CrossRef CAS.
- X. Li, X. Ou, B. Wang, H. Rong, B. Wang, C. Chang, B. Shi, L. Yu and M. Lu, Commun. Chem., 2020, 3, 152 CrossRef CAS.
- J. M. Ha, B. D. Hamilton, M. A. Hillmyer and M. D. Ward, Cryst. Growth Des., 2009, 9(11), 4766–4777 CrossRef CAS.
- K. Zhang, N. Fellah, A. G. Shtukenberg, X. Fu, C. Hu and M. D. Ward, CrystEngComm, 2020, 22(16), 2705–2708 RSC.
- V. López-Mejías, J. W. Kampf and A. J. Matzger, J. Am. Chem. Soc., 2012, 134(24), 9872–9875 CrossRef PubMed.
- L. Yu, G. A. Stephenson, C. A. Mitchell, C. A. Bunnell, S. V. Snorek, J. J. Bowyer, T. B. Borchardt, J. G. Stowell and S. R. Byrn, J. Am. Chem. Soc., 2000, 122(4), 585–591 CrossRef CAS.
- L. Yu, Acc. Chem. Res., 2010, 43(9), 1257–1266 CrossRef CAS PubMed.
- A. Lévesque, T. Maris and J. D. Wuest, J. Am. Chem. Soc., 2020, 142(27), 11873–11883 CrossRef PubMed.
- X. Li, X. Ou, H. Rong, S. Huang, J. Nyman, L. Yu and M. Lu, Cryst. Growth Des., 2020, 20(11), 7093–7097 CrossRef CAS.
- L. Tessler and I. Goldberg, J. Inclusion Phenom. Macrocyclic Chem., 2006, 55(3–4), 255–261 CrossRef CAS.
- D. E. Braun, T. Gelbrich, V. Kahlenberg, R. Tessadri, J. Wieser and U. J. Griesser, J. Pharm. Sci., 2009, 98(6), 2010–2026 CrossRef CAS PubMed.
- J. B. Nanubolu, B. Sridhar, V. S. P. Babu, B. Jagadeesh and K. Ravikumar, CrystEngComm, 2012, 14(14), 4677–4685 RSC.
- T. A. Zeidan, J. T. Trotta, P. A. Tilak, M. A. Oliveira, R. A. Chiarella, B. M. Foxman, Ö. Almarsson and M. B. Hickey, CrystEngComm, 2016, 18(9), 1486–1488 RSC.
- R. M. Bhardwaj, J. A. McMahon, J. Nyman, L. S. Price, S. Konar, I. D. H. Oswald, C. R. Pulham, S. L. Price and S. M. Reutzel-Edens, J. Am. Chem. Soc., 2019, 141(35), 13887–13897 CrossRef CAS PubMed.
- V. López-Mejías and A. J. Matzger, Cryst. Growth Des., 2015, 15(8), 3955–3962 CrossRef.
- O. G. Uzoh, A. J. Cruz-Cabeza and S. L. Price, Cryst. Growth Des., 2012, 12(8), 4230–4239 CrossRef CAS.
- W. Du, A. J. Cruz-Cabeza, S. Woutersen, R. J. Davey and Q. Yin, Chem. Sci., 2015, 6(6), 3515–3524 RSC.
- K. V. Andersen, S. Larsen, B. Alhede, N. Gelting and O. Buchardt, J. Chem. Soc., Perkin Trans. 2, 1989, No. 10, 1443–1447 RSC.
- H. Blade, C. D. Blundell and I. J. Vitorica-Yrezabal, Acta Crystallogr., Sect. E: Crystallogr. Commun., 2020, 76, 1421–1426 CrossRef CAS PubMed.
- A. Mattei and T. Li, Pharm. Res., 2012, 29(2), 460–470 CrossRef CAS PubMed.
- A. Mattei, X. Mei, A. F. Miller and T. Li, Cryst. Growth Des., 2013, 13(8), 3303–3307 CrossRef CAS.
- Y. A. Abramov, P. Zhang, Q. Zeng, M. Yang, Y. Liu and S. Sekharan, Cryst. Growth Des., 2020, 20(3), 1512–1525 CrossRef CAS.
- W. Tang, A. D. Sima, J. Gong, J. Wang and T. Li, Cryst. Growth Des., 2020, 20(3), 1779–1788 CrossRef CAS.
- V. López-Mejías, J. W. Kampf and A. J. Matzger, J. Am. Chem. Soc., 2009, 131(13), 4554–4555 CrossRef PubMed.
- D. H. Case, V. K. Srirambhatla, R. Guo, R. E. Watson, L. S. Price, H. Polyzois, J. K. Cockcroft, A. J. Florence, D. A. Tocher and S. L. Price, Cryst. Growth Des., 2018, 18(9), 5322–5331 CrossRef CAS.
- S. Ranjan, R. Devarapalli, S. Kundu, S. Saha, S. Deolka, V. R. Vangala and C. M. Reddy, IUCrJ, 2020, 7, 173–183 CrossRef CAS PubMed.
- Oxford Diffraction Ltd., CrysAlisPro, Albington, UK, 2010 Search PubMed.
- G. M. Sheldrick, Acta Crystallogr., Sect. A: Found. Crystallogr., 2008, 112–122 CrossRef CAS PubMed.
- G. M. Sheldrick, Acta Crystallogr., Sect. C: Struct. Chem., 2015, 71, 3–8 Search PubMed.
- G. Kresse and J. Hafner, Phys. Rev. B, 1993, 48(17), 13115–13118 CrossRef CAS PubMed.
- G. Kresse and J. Hafner, Phys. Rev. B, 1994, 49(20), 14251–14269 CrossRef CAS PubMed.
- G. Kresse and J. Furthmüller, Comput. Mater. Sci., 1996, 6(1), 15–50 CrossRef CAS.
- G. Kresse and J. Furthmüller, Phys. Rev. B: Condens. Matter Mater. Phys., 1996, 54(16), 11169–11186 CrossRef CAS PubMed.
- J. P. Perdew, K. Burke and M. Ernzerhof, Phys. Rev. Lett., 1996, 77(18), 3865–3868 CrossRef CAS PubMed.
- P. E. Blöchl, Phys. Rev. B, 1994, 50(24), 17953–17979 CrossRef PubMed.
- D. Joubert, Phys. Rev. B: Condens. Matter Mater. Phys., 1999, 59(3), 1758–1775 CrossRef.
- C. R. Groom, I. J. Bruno, M. P. Lightfoot and S. C. Ward, Acta Crystallogr., Sect. B: Struct. Sci., Cryst. Eng. Mater., 2016, 72(2), 171–179 CrossRef CAS PubMed.
- A. Tkatchenko and M. Scheffler, Phys. Rev. Lett., 2009, 102(7), 073005 CrossRef PubMed.
- A. Tkatchenko, R. A. Distasio, R. Car and M. Scheffler, Phys. Rev. Lett., 2012, 108(23), 236402 CrossRef PubMed.
- A. Ambrosetti, A. M. Reilly, R. A. Distasio and A. Tkatchenko, J. Chem. Phys., 2014, 140(18), 18A508 CrossRef PubMed.
- J. Hoja, H. Y. Ko, M. A. Neumann, R. Car, R. A. DiStasio and A. Tkatchenko, Yuanyi Xuebao, 2019, 45(12), 1–10 Search PubMed.
- J. Nyman and G. M. Day, CrystEngComm, 2015, 17(28), 5154–5165 RSC.
- R. Montis, R. J. Davey, S. E. Wright, G. R. Woollam and A. J. Cruz-Cabeza, Angew. Chem., 2020, 132(46), 20537–20540 CrossRef.
- M. J. Bryant, A. G. P. Maloney and R. A. Sykes, CrystEngComm, 2018, 20(19), 2698–2704 RSC.
- P. Sacchi, M. Lusi, A. J. Cruz-Cabeza, E. Nauha and J. Bernstein, CrystEngComm, 2020, 22(43), 7170–7185 RSC.
- J. Nyman and G. M. Day, Phys. Chem. Chem. Phys., 2016, 18(45), 31132–31143 RSC.
- A. Burger and R. Ramberger, Microchim. Acta, 1979, 72(3–4), 259–271 CrossRef.
- P. T. Cardew and R. J. Davey, Proc. R. Soc. London, Ser. A, 1985, 398, 415–428 CAS.
- H. G. Brittain, Am. Pharm. Rev., 2014, 17, 10–15 Search PubMed.
- L. Nicoud, F. Licordari and A. S. Myerson, Cryst. Growth Des., 2018, 18(11), 7228–7237 CrossRef CAS.
- A. Gavezzotti, J. Pharm. Sci., 2007, 96(9), 2232–2241 CrossRef CAS PubMed.
- J. Bernstein, R. J. Davey and J. O. Henck, Angew. Chem., Int. Ed., 1999, 38(23), 3440–3461 CrossRef PubMed.
- A. Gavezzotti, Mol. Phys., 2008, 106(12–13), 1473–1485 CrossRef CAS.
- A. J. Cruz-Cabeza, R. J. Davey, S. S. Sachithananthan, R. Smith, S. K. Tang, T. Vetter and Y. Xiao, Chem. Commun., 2017, 53(56), 7905–7908 RSC.
- S. K. Tang, R. J. Davey, P. Sacchi and A. J. Cruz-Cabeza, Chem. Sci., 2021, 12(3), 993–1000 RSC.
- Y. Liu, S. Xu, X. Zhang, W. Tang and J. Gong, Cryst. Growth Des., 2019, 19(12), 7175–7184 CrossRef CAS.
Footnote |
| † Electronic supplementary information (ESI) available. CCDC 2069403. For ESI and crystallographic data in CIF or other electronic format see DOI: 10.1039/d1ce00343g |
| This journal is © The Royal Society of Chemistry 2021 |

