 Open Access Article
NiMoS on alumina-USY zeolites for hydrotreating lignin dimers: effect of support acidity and cleavage of C–C bonds†
Muhammad Abdus
Salam
ab,
Prakhar
Arora
a,
Houman
Ojagh
a,
You Wayne
Cheah
a,
Louise
Olsson
 *a and
Derek
Creaser
a
aCompetence Centre for Catalysis, Department of Chemistry and Chemical Engineering, Chalmers University of Technology, SE-41296, Gothenburg, Sweden. E-mail: louise.olsson@chalmers.se
bShahjalal University of Science and Technology, Sylhet-3114, Bangladesh
First published on 8th October 2019
Abstract
NiMoS on alumina, USY and mixed alumina-USY supports was studied in a batch reactor to assess the effect of support acidity in valorizing lignin dimers by hydrodeoxygenation (HDO). The reactivity of α-O-4 (benzyl phenyl ether), β-O-4 (2-phenethyl phenyl ether) and 5-5′ (2,2′-dihydroxybiphenyl) linkages was investigated in dodecane at 593 K and a H2 pressure of 5 MPa. A relatively fast rate of hydrogenolysis of the sp3 hybridized etheric bonds was observed for the catalyst supported on the mixed support. With the α-O-4 linkage, the USY supported catalyst selectively yielded deoxygenated aromatics including BTX products with fewer residual C–C dimers. For the β-O-4 linkage, analogous trends have been observed but with more aromatics. Interestingly, with 5-5′ linkages the catalyst on USY and mixed supports can break the C–C linkages without producing other intermediate C–C dimer byproducts. The results show high hydrocracking and isomerization activities of the catalyst supported on USY and mixed supports. This is consistent with XRD, Raman, XPS and TEM measurements, where enhanced dispersion of the active phase was observed. However, hydrogenation activity on the USY support is reduced to a significant degree which results in a large amount of benzene compared to NiMoS–Al2O3 that produces mostly cyclohexane. In addition, elemental analysis revealed that carbon deposition is higher on the USY-based catalyst compared to the alumina-based catalyst owing to its higher acidity. However, the potential for superior C–C bond cleavage on NiMoS-USY opens the possibility to valorize technical lignin in biorefinery processes.
Introduction
Lignin, an integral part of lignocellulosic materials, is a three-dimensional cross-linked bio-polymer consisting of three different phenylpropane units linked via ether and C–C bonds.1 Such heterogeneity makes it recalcitrant to depolymerization and further upgrading processes. Nonetheless, it is highly rich in aromatics with aliphatic moieties and offers huge potential for utilization as a renewable feedstock despite its current treatment that is largely as a waste or use for low value applications in existing biorefineries. In recent years, lignin and lignin derived feedstocks have received substantial research focus for producing green chemicals and fuels. Lignin derived bio-oil primarily contains alkyl or methoxy substituted phenols including phenolic dimers, trimers and oligomers with residual C–C and C–O–C linkages from the original lignin structure.2 The oxygenates thus present in bio-oil (40–45%) have detrimental properties (e.g. coke precursors) that impede its direct utilization.3,4 Hence an efficient upgrading process must achieve simultaneous breakdown of these linkages and subsequent processing with a robust catalyst to produce specialty chemicals and stable bio-fuels. Among many processes, catalytic hydrodeoxygenation (HDO) is unique because it offers the possibility to perform depolymerization and deoxygenation concurrently.Several catalysts (mono-bimetallic and bifunctional) containing noble metals (Pt, Pd, Rh, Ru, Re, and Ir), metal-sulfides, carbides, nitrides, and phosphides of various supports (carbon, Al2O3, ZrO2, TiO2, ZrO2–SiO2, SiO2–Al2O3, zeolites, mesoporous silicates, etc.) have been studied extensively for HDO of phenols,5–12 anisole,9,13–16 substituted phenols (cresols, guaiacols, syringols, eugenols, etc.)6,9,17–30 and lignin dimers.31–36 The product distribution exclusively depends on the physicochemical properties of the chosen catalyst-support system and the employed reaction conditions. The high hydrogenation (HYD) activity of the precious metals typically leads to aromatic ring HYD followed by acid catalyzed dehydration to cycloalkanes in the gasoline (C6–C9) range.6,37 Nevertheless, by tuning the intrinsic energy barriers for HYD versus direct deoxygenation (DDO) on different surfaces one can alter the selectivity to bio-arenes.14,21 But noble metals are not stable in the presence of sulfur which makes them less favorable for upgrading Kraft (1–3 wt% S) and lignosulfonate (4–8 wt% S) lignin.38 Also, the cost of such metals hinders scale up.35 Transition metals, e.g. Co or Ni promoted MoS2, commonly used for hydro-desulfurization (HDS) and hydro-denitrogenation (HDN) favor a consecutive DDO-HYD route during HDO to yield a mixture of alicyclics and aromatics, hence retaining the aromaticity partially or fully. Recently, Song et al.39 claimed that unsupported CoMoS nanosulfides are efficient in converting monophenols and diphenyl ether to aromatics.
For lignin dimers having α-O-4 or β-O-4 linkages, sp3 hybridized Caliphatic–O cleavage is rather fast compared to that of the resonance stabilized sp2 Caromatic–O linkages and this initially yields mono- and substituted phenols or monoaromatics in the presence of H2. Hydrocracking of lignin dimers on sulfided NiMo–Al2O3 by Koyama et al.32 showed the formation of substantial amounts of monoaromatics and dimers. However, lignin from the paper and pulp industry or other biorefineries, referred to as ‘technical lignin’, would also require cleavage of their condensed C–C linkages to catalyze their conversion to chemicals or fuels. Very few catalysts are reported to break these β-1, β-β, β-5, and 5-5′ bonds as they require a higher bond dissociation energy. Shuai et al.40 reported selective cleavage of a C–C bond in a lignin dimer (dimethylguaiacylmethane) to two phenolic monomers while DPM (diphenyl methane), an aromatic dimer, did not convert. Hence, a catalyst capable of efficiently cleaving both C–C and C–O–C linkages would be ideal for valorizing lignin to specialty chemicals and fuels.41 In this context, NiMoS on mixed alumina and ultra-stable Y zeolites was studied here with the aim to understand the physicochemical properties related to metal function and Brønsted acidity for cleavage of both C–O–C and C–C linkages present in lignin dimers.
It is well known that the support composition, type, acidity and support–metal interaction play a dynamic role in determining catalytic activity.42 The tangible challenges with zeolites are the textural properties of the support which include pore accessibility, diffusion barriers for the reactants and products, acidity of the catalyst and deactivation by coking.8,43 Compared to ZSM-5 and beta zeolites, USY zeolite has a large pore size (7.4 Å), and higher thermal and hydrothermal stability.44,45 Previous studies with NiMoS on modified or mesoporous USY have been explored for hydrogenation, hydrocracking, and ring opening reactions for heavy vacuum gas oil (HVGO)/light cycle oil (LCO).46–49 The morphologies of the MoS2 phase, as well as the vicinity and the strength of the acid sites are vital for such upgrading. Hydrogen spillover and better metal (Pd) dispersion on 20% HY (Si/Al = 2.3) and Al2O3 were reported to be beneficial for high phenol HDO.8 Hong et al.50 studied phenol HDO over Pt/HY and observed hydrogenation–hydrogenolysis ring coupling to yield mono- and bicyclic hydrocarbons. Lee et al.51 reported that higher acidity increases guaiacol conversion and enhances deoxygenation. Other studies include non-metallic USY for lignin depolymerization to phenolics/aromatics.52
However, there are to our knowledge no studies available where NiMoS on USY or alumina modified USY is used for hydrotreatment of lignin dimers, which is the objective of the current work. In more detail we have studied hydrotreating of three major lignin linkages, presented in Fig. 1. In addition, we have performed detailed characterization using Raman spectroscopy, XPS, TEM, XRD, TPD, BET and elemental analysis to correlate our results with the catalyst composition.
Experimental
Catalyst preparation
Ni and Mo containing catalysts were prepared by a wet impregnation process using pre-calcined γ-alumina and ultra-stable Y-zeolite (Si/Al = 15, Zeolyst International). Ammonium molybdate tetrahydrate (81–83% MoO3 basis, Sigma-Aldrich) and nickel(II) nitrate hexahydrate (98%, Sigma-Aldrich) were used as the metal precursors. Three different catalysts namely NiMo on γ-alumina (NiMoA), NiMo on USY-zeolite (NiMoY) and NiMo on a mixed support consisting of equal amounts of γ-alumina and USY-zeolite (NiMoAY) were synthesized. The details of the catalyst synthesis have been described elsewhere.53–55Catalytic activity measurements
The catalyst was sulfided using dimethyl disulfide (≥99.5%, Sigma-Aldrich) at 613 K and 2.5 MPa of hydrogen (99.9%, AGA) in a Parr autoclave reactor (300 ml, Parr Inc.) before each activity test. The feed consisted of lignin model compounds, namely 5 mol% benzyl phenyl ether (98%, Sigma Aldrich), 5 mol% 2-phenethyl phenyl ether (98%, Frinton Laboratories Inc.) or 1.8 mol% 2,2′-biphenol (99%, Sigma Aldrich) each in dodecane (≥99%, Sigma Aldrich).In each experiment, 0.5 g of the catalyst was used. After loading the reactor with the catalyst, solvent and reactant, it was flushed three times with N2 and H2 respectively. It was then pressurized to 1 MPa using H2 at room temperature and rapidly heated up to 593 K. The final pressure of the reactor was maintained at 5 MPa of H2 with a stirring rate of 1000 rpm. Samples were collected during the reaction at 35, 60, 120, 180, 240, 300 and 360 min to analyze the liquid composition. Each sample withdrawal caused a temporary pressure-drop of ca. 0.1–0.2 MPa in the reactor which was compensated for via adding H2 immediately to return to 5 MPa. After 6 h, the reaction was stopped by rapid cooling, and the catalyst was recovered and washed with diethyl ether to remove the adhering reactants, residual products, and intermediates. The catalyst was then dried and analyzed.
Product analysis
The reaction samples were centrifuged first to separate any residual catalyst particles and the liquid phases obtained were analyzed by GC-MS (Agilent 7890-5977A, Agilent). The GC was equipped with an HP-5 column (30 m × 250 μm × 0.25 μm), and a Flame Ionization Detector (set point was 608 K). The injector temperature was kept at 608 K. The initial oven temperature was 373 K for 1 min which was heated at 10 K min−1 to 463 K where ramping continued at 30 K min−1 to 673 K where it was held constant for 1.3 min. External calibrations were used for the quantification of the intermediates and products. Since 2,2′-biphenol is insoluble in dodecane at room temperature ethanol was added to the calibration and reaction samples prior to analysis to solubilize 2,2′-biphenol. The conversion of the reactant and selectivity for the products were calculated for each experiment using the following equations:Catalyst characterization
The textural properties of the synthesized and spent catalysts were determined by using nitrogen physisorption isotherms using a TriStar 3000 gas adsorption analyzer. The NiMoA samples were dried at 250 °C for 2 h in a flow of dry N2. Zeolite containing samples were dried for 6 h. The specific surface area was calculated based on the Brunauer–Emmett–Teller equation (BET). The pore size was estimated based on the desorption isotherm using the Barrett–Joyner–Halenda equation (BJH). To verify the metal contents, the fresh and recovered catalysts after the reaction were analyzed by Inductively Coupled Plasma (ICP)-Sector Field Mass Spectroscopy (ICP-SFMS) by ALS Scandinavia AB, Luleå, Sweden. C, H, N and S elemental analysis on the recovered catalysts was carried out by Elemental Microanalysis Ltd. (UK) using EA-1110 (CE Instruments) and NA2000 (Fisons Instruments) elemental analyzers.Ethylamine temperature programmed desorption (TPD) experiments were performed in an arrangement consisting of a manifold of mass flow controllers (MFCs) for feed gas mixing, a quartz tube containing the catalyst sample (approximately 25 mg) in a temperature-controlled oven and a mass spectrometer (Hiden HPR-20 QUI) for measuring the quantities of desorbed products in the outlet carrier gas. The samples were initially pretreated in Ar (110 °C for 1 h and 250 °C for 3 h) followed by reduction in a flow of 13% H2 at 600 °C for 2 h and thereafter cooling to 100 °C in Ar. After flow stabilization in Ar, the sample was exposed to 543 ppm of ethylamine at 100 °C for 3 h. Then, the sample was flushed with Ar for 2 h followed by desorption with a ramp rate of 5 °C min−1 to 600 °C. The total gas flow rate was maintained at 20 NmL min−1 through the quartz tube containing the sample.
The X-ray diffraction (XRD) pattern of the synthesized catalysts was obtained using a Bruker AXSD8 Advance X-ray powder diffractometer with CuKα radiation (λ = 1.542 Å). Scanning parameters of 2θ were from 5 to 80° in the scan mode (0.03° and 1 s). Raman scattering spectroscopy (WITec alpha300 R, 532 nm laser, 75 mW) was used to characterize the Mo–O bond in the supported catalysts. X-ray Photoelectron Spectroscopy (XPS) studies on sulfided catalysts were performed using a PerkinElmer PHI 5000 VersaProbe III Scanning XPS Microprobe. The sample was irradiated with a monochromatic Al-Kα source with a binding energy of 1486.6 eV in a vacuum chamber (less than 2 × 10⁻⁸ torr). The emitted photoelectrons were detected by using a spherical energy analyzer. The angle between the source and detector was 90°. High resolution spectra with a step of 0.10 eV were recorded for Ni, Mo, O, S and C core levels. Data obtained were analyzed by using Multipack software and with CasaXPS. For all spectra the C 1s binding energy of 284.6 eV was taken as the reference.
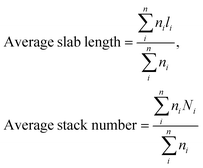
Transmission electron microscopy (TEM) analysis was performed using a FEI Titan 80-300 TEM operating at an accelerating voltage of 300 kV. Scanning TEM (STEM) images were acquired using a high angle annular dark field (HAADF) detector. In the STEM mode, energy dispersive X-ray (EDX) analysis was also performed for chemical identification using an Oxford X-sight detector. Spectrum acquisition and data analysis were performed using TEM Imaging & Analysis (TIA) software. Ni promoted MoS2 crystallites were measured by using ImageJ software and at least 300 slabs were taken to calculate the surface average length and stacking using the first moments of the distribution:56
Furthermore, the MoS2 dispersion denoted as fMo, was measured based on the average fraction of Mo atoms at the MoS2 edge surface assuming that MoS2 slabs have a perfect hexagon shape.
Results and discussion
HDO of BPE
Fig. 2 presents the products and intermediates formed during the HDO of BPE. Selective hydrogenolysis of the Caliphatic–O bond (α-O-4) in BPE primarily yields toluene and phenol.57 On the other hand, the acid catalyzed transalkylation reaction via the transfer of the benzyl group in BPE leads to the formation of benzyl phenols.13 As reported in the literature, recombination of hydrogenolysis and hydrolysis intermediates may also form benzyl phenols and other dimers linked via C–C bonds as presented in Fig. 2(c).34 However, transalkylation seems to be the dominant path to form benzyl phenols as the peak in their formation coincides with when full conversion of BPE occurs. Fig. 2(c) illustrates all the components identified by GC-MS analysis of the samples in a proposed reaction scheme. It is important however to note that benzyl alcohol (faint print in Fig. 2(c)) was not detected. This suggests that the recombination pathway is of lesser importance or that benzyl alcohol is rapidly consumed when formed. The catalysts containing Y-zeolite have enhanced rates of hydrogenolysis as shown in Fig. 2(a). Approximately, 80–90% conversion of BPE occurs in 0.5 h for catalysts with Y-zeolite. This is likely due to increased rates of the transalkylation and hydrolysis reactions of BPE with the more acidic catalysts. The phenolics thus formed undergo HDO, HYD, isomerization and hydrocracking to yield a mixture of deoxygenated aromatics and alicyclics. For simplicity products are grouped into phenolics, deoxygenated aromatics (DA) and cycloalkanes to show their reaction time profiles in Fig. 2(b). Based on the time evolution of these products and intermediates, the reaction scheme in Fig. 2(c) is proposed. The selectivity for phenol and benzyl phenol intermediates was observed to increase first and later decrease, whereas the selectivity for the final products increased with time (Fig. S1†). Table 1 shows the major compounds included in each of these groups and details of the final product selectivity.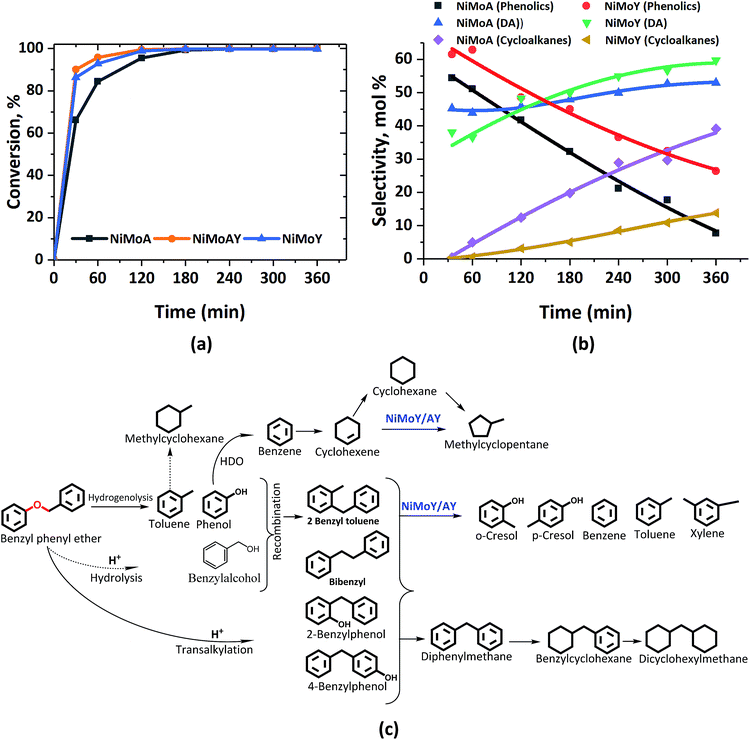 | ||
| Fig. 2 (a) BPE conversion and (b) product selectivity during HDO of BPE in an autoclave at 593 K, 5 MPa and 1000 rpm. (c) Proposed reaction scheme. DA = deoxygenated aromatics. | ||
| Catalyst | X BPE (%) | Carbon balance (%) | Selectivity (%) | |||||||||
|---|---|---|---|---|---|---|---|---|---|---|---|---|
| Cycloalkanes | Deoxygenated aromatics (DA) | Phenolics | ||||||||||
| Others | Dimers | Cresols | Dimers | |||||||||
| a X BPE refers to BPE conversion. | ||||||||||||
| NiMoA | >99 | 94 | <1 | 38 | 1 | — | 43 | — | 9 | 7 | — | 2 |
| NiMoAY | >99 | 92 | 2.7 | 28 | 3.5 | — | 44 | 0.5 | 5 | 13 | 2 | 0.7 |
| NiMoY | >99 | 87 | 9.3 | <1 | 4.5 | 35 | 22 | 2 | — | 18 | 8 | 0.4 |
As can be seen from Fig. 2(b), phenolics deoxygenation is faster without Y-zeolite but with greater formation of methylene/ethylene linked C–C dimers with partial or full hydrogenation of the benzene rings (Fig. 2(c)). The formation of such C–C dimers will be illustrated and discussed further. Interestingly, sulfided NiMoY yields higher DA due primarily to high benzene formation as shown in Table 1 for the final products. Also, even at the same selectivity for phenolics, e.g. ca. 40%, it can be seen in Fig. 2(b) that the selectivity for DA products was higher at 50% for NiMoY, compared to 45% for NiMoA. The results in Table 1 indicate that dimer (phenolics or DA) formation after full reaction time is significantly lower on NiMoY owing to promoted Caryl–Caliphatic bond cleavage of the benzyl phenols, diphenylmethane (DPM), bibenzyl (BB) and others. This facilitates the formation of monoaromatics comprising cresols, benzene, toluene and xylene (BTX). Güvenatam et al.34 reported that acidic conditions lower the side reactions to dimers/trimers in the presence of H2 during HDO of BPE on Pt/C. H2-driven cracking of benzyl phenols, DPM and BB was previously reported for Fe, Ni and Mo-based catalysts at elevated temperatures and pressures.32,58 Koyama et al.32 reported considerable dimer formation while hydrocracking lignin dimers (BPE, diphenyl ether, benzyl phenols, diphenylmethane and dibenzyl) without solvent in a temperature range of 340–450 °C. The extent of C–C cleavage reported for DPM and BB was low at 420 °C but significant for BB at 450 °C. In this study no C–C cleavage of the yielded dimers was observed for NiMoA; however it was observed to a small extent on NiMoAY. Indeed, an increased selectivity for dimer products was observed for NiMoA (discussed in the section ‘Catalytic properties related to the activity’), whereas for NiMoY the selectivity for these products peaked at 1 h and then declined. Improved C–C bond cleavage with NiMoY opens up the possibility to valorize technical lignin in biorefinery processes.40
Interestingly, a high hydrogenation activity yields more cycloalkanes over sulfided NiMoA than NiMoY (Fig. 2(b)). For example, 38% cyclohexane is found for NiMoA, while it is <1% for NiMoY, which instead produced 35% benzene. Methyl-cyclopentane observed primarily with NiMoAY and NiMoY (Table 1) indicates the greater isomerization activity of these catalysts due to the higher concentration of Brønsted acidic sites in the zeolite pores promoting greater isomerization activity.59
HDO of PPE
Fig. 3 shows the formation of phenolics, DA and alicyclics during the HDO of PPE. H2-driven hydrogenolysis of the sp3 C–O bond (β-O-4) to ethylbenzene and phenol is fastest in this case over NiMoAY, whereas the rate of conversion of PPE is slowest for NiMoY as shown in Fig. 3(a). The details of the final product selectivity are shown in Table 2. Fig. 3(c) illustrates all of the observed components in a proposed reaction scheme. Similar to the case of BPE, note however that the phenethyl alcohol (faint print in Fig. 3(c)) intermediate that would be consumed by the recombination reactions was not detected. Transalkylation of the phenethyl group of PPE and recombination reactions are favored in the order of NiMoY > NiMoAY > NiMoA, leading to the formation of high quantities of phenolic dimers as mainly phenylethyl phenols having ethylene linked C–C bonds (Fig. 3(c)). Like with BPE, such dimers undergo C–C cleavage over NiMoY to yield ethyl phenols. The formation and cleavage of such C–C dimers will be further compared in the section ‘Catalytic properties related to the activity’. However, deoxygenated aromatics including benzene, toluene, ethylbenzene and a small number of dimers (Fig. 3(b) and Table 2) increase as the reaction progresses. Based on the evolution of these products and intermediates (Fig. S2†), a reaction scheme shown in Fig. 3(c) is proposed.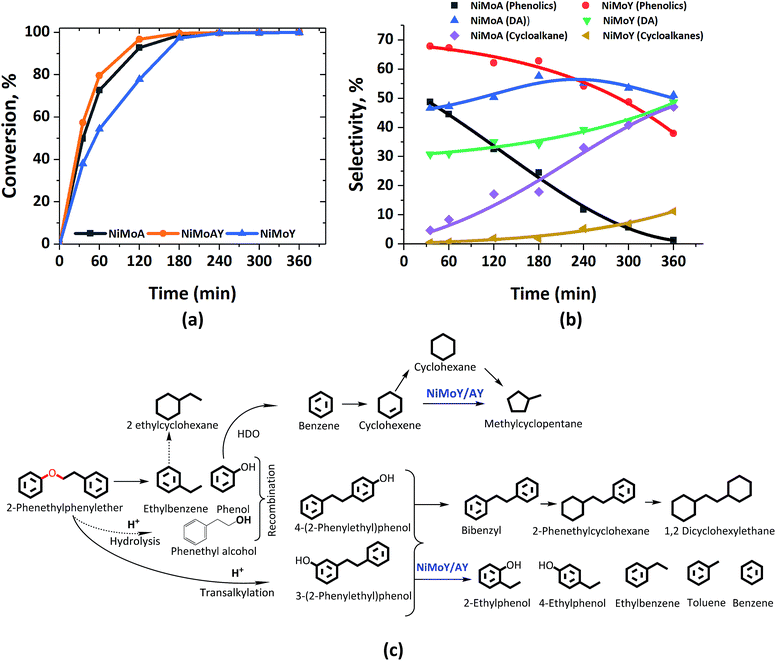 | ||
| Fig. 3 (a) PPE conversion and (b) product selectivity during HDO of PPE in an autoclave at 593 K, 5 MPa and 1000 rpm. (c) Proposed reaction scheme. DA = deoxygenated aromatics. | ||
| Catalyst | X PPE (%) | Carbon balance (%) | Selectivity (%) | |||||||||
|---|---|---|---|---|---|---|---|---|---|---|---|---|
| Cycloalkanes | Deoxygenated aromatics (DA) | Phenolics | ||||||||||
| Others | Dimers | Ethyl-phenols | Dimers | |||||||||
| a X PPE refers to PPE conversion. | ||||||||||||
| NiMoA | >99 | 95 | — | 45 | 3 | — | — | 48 | 3 | 1 | — | 1 |
| NiMoAY | >99 | 93 | 17 | 16 | 3 | — | — | 48 | 3 | 12.5 | 3 | |
| NiMoY | >99 | 84 | 10 | — | 1.5 | 14 | 1 | 32.5 | 2 | 31 | 4 | 4 |
Clearly, the degree of HDO selectivity is very high with NiMoA, whereas isomerization and hydrocracking increase with NiMoY/AY. Hydrogenation activity seems lower for NiMoY leading to high monoaromatics selectivity (>80%) as with BPE, however at the expense of an even lower rate of conversion of phenolics compared to BPE (Fig. 3(b)). Noticeably, as shown in Table 2, selectivity for cycloalkane products is almost four times lower with NiMoY due to a noteworthy drop in hydrogenation activity compared to NiMoA.
Compared to BPE, the cleavage of PPE and PPE derived-dimers seems hindered by the USY pore sizes, particularly its micropores. The presence of such bulkier molecules may hinder the monophenol HDO due to preferential adsorption of the reactant/intermediates which may aid undesirable secondary reactions to build carbonaceous deposits that can deactivate the catalyst with increasing reaction time.
HDO of 2,2′-biphenol
Table 3 shows the final product selectivities for 2,2′-biphenol HDO. After 6 h of reaction at 5 MPa and 593 K, 91% conversion of 2,2′-biphenol was observed over NiMoA while for Y-zeolite containing catalysts it was above 99% (Table 3). Fig. 4(b) shows the complete range of products observed and illustrated in a proposed reaction scheme. The mass balance was poor for the early samples (before 180 min) for NiMoA probably due to the low solubility of the reactant in dodecane at room temperature or residual reactant remaining in the sampling line. However, it became >90% for the latter samples. Fig. 4(a) compares the selectivity for the major products for NiMoA and the zeolite containing catalysts. As can be seen in Fig. 4(a), for all catalysts, the acid catalyzed dehydration reaction leads to the formation of dibenzofuran (DBF) via intramolecular nucleophilic attack of the hydroxyl group.33 DBF formation competes with HDO over NiMoA to form o-phenylphenol (OPP). Over sulfided NiMoA hydrogenation of DBF produces tetrahydro-dibenzofuran (THDBF) which followed by C–O cleavage gives 2-cyclohexylphenol (CHPOH). Para and meta substituted cyclohexylphenol were also observed to a small degree. Further HDO and HYD of CHPOH lead to the formation of several components shown in Fig. 4(b). Biphenyl (BP) formation was quite low indicating the C–O cleavage of CHPOH leading to the formation of cyclohexylbenzene (CHB). Sulfided NiMoA eventually breaks the C–C linkage of CHPOH/CHB to phenol and cyclohexane with substantial cyclic dimers including bicyclohexane (BCH) and cyclopentyl-cyclohexylmethane (CPMCH). From Table 3, it is clear that 36% dimers have been formed with NiMoA. These observations are in line with the previous studies of DBF hydrotreatment over sulfided NiMoA.60 Also, similar product formation was reported for HDO of DBF using a Pt based catalyst over various acid–base supports.61–64| Catalyst | X 5-5′ (%) | C-balance (%) | Selectivity (%) | ||||
|---|---|---|---|---|---|---|---|
| Dimers | |||||||
| a X 5-5′ refers to 2,2′-biphenol conversion. | |||||||
| NiMoA | 91 | 95 | 23 | 4 | 36 | <1 | 36 |
| NiMoAY | >99 | 94 | 59 | 2 | — | 39 | — |
| NiMoY | >99 | 96 | 44 | 13 | — | 43 | — |
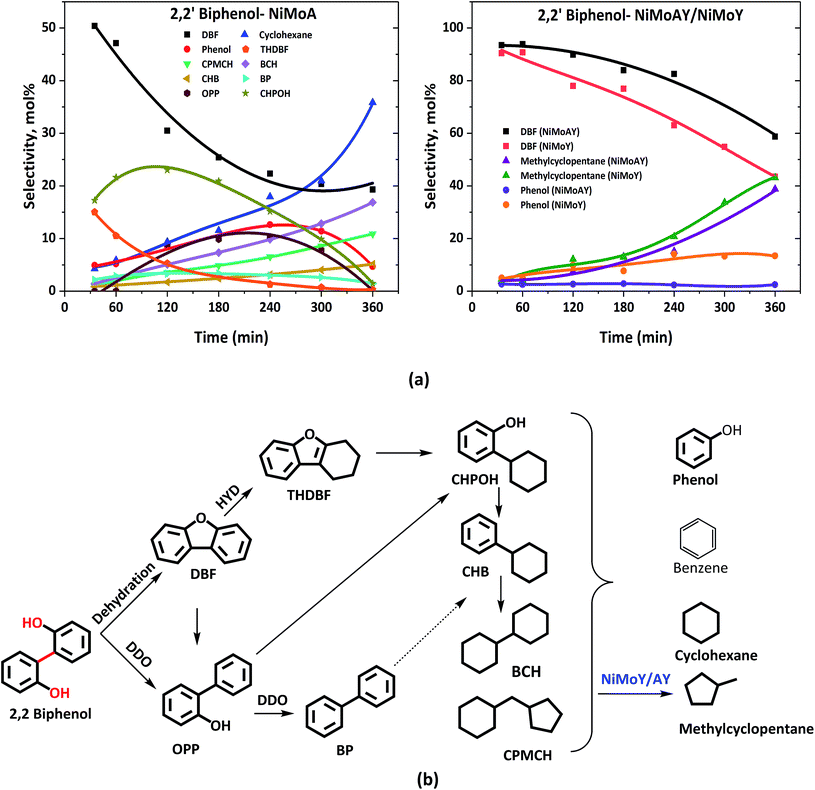 | ||
| Fig. 4 (a) Product selectivity's during HDO of 2,2′-biphenol over NiMoA, NiMoAY and NiMoY and (b) proposed reaction scheme during HDO of 2,2′-biphenol. | ||
For the Y-based catalysts, the dehydration reaction is strongly favoured over DDO resulting in a high yield of DBF which is over 44%, compared to 23% with NiMoA (Table 3). As Fig. 4(a) shows that the conversion of 2,2′-biphenol to DBF occurs quickly and was complete already during the process of heating the reactor to 593 K. Also, for the Y-based catalysts, no OPP was identified in the early samples taken during the experiments. However, the cleavage of the C–O bond in the recalcitrant DBF seems to become the rate determining step, particularly for the Y-zeolite containing catalysts. Once the C–O bond is cleaved, traces of intermediates (e.g. biphenyl, 1-phenyl cyclohexene, etc.) in the reaction mixture appear, which undergo rapid acid induced cracking inside the zeolite pores. This leads to the formation of phenol and cyclohexane as the cracking products. Further isomerization of cyclohexane yielded methyl-cyclopentane at over 39% with the zeolite catalysts compared to only residual quantities with NiMoA (Table 3). Also, with the zeolite catalyst no formation of other C–C dimers was detected (Table 3). Moreover, the reaction with the support USY only primarily yields DBF and its derivatives (e.g. 9-hydroxyfluorene, 9,9 dimethylxanthene, etc.) and a small amount of methylcyclopentane (∼8%) and phenol (∼6%) (Fig. S3†). This indicates a strong synergy between the active NiMoS phase and the acidity of the support which cleaves C–O and C–C faster. And for the reaction with γ-Al2O3, approximately 40% of feed was converted exclusively to DBF. Since NiMoY yielded more coke in the first run (Table 7) we repeated the experiments with the recovered catalysts from the first run in the same fashion. The results (Fig. S4†) indicate a small drop in the catalytic activity of the catalyst.
In summary, with the zeolite-based catalysts the initial formation of DBF was almost exclusively favoured, due to the stronger acidity of these catalysts promoting dehydration reactions, whereas with NiMoA formation of THDBF, OPP and various other products from it was also important. All catalysts had difficulty to further convert the recalcitrant DBF. As a result, for the zeolite-based catalysts the products after complete reaction time contained higher quantities of DBF; however their better activity for C–C cleavage reactions caused their products to be free of detectable amounts of dimers (Table 3).
Catalyst characterization
ICP-SFMS data in Table 4 show the metal contents and Si/Al ratios (SARs) of the zeolite framework. A slight variation in the SAR has been noticed after Ni and Mo impregnation into the Y zeolite and for the recovered catalyst after the activity test; however this is within the expected measurement variation. The Ni/(Ni + Mo) content seems consistent for the synthesized and spent catalysts. Hence, leaching of Ni and Mo can be ruled out.| Catalyst | As-synthesized | After the BPE test | After the PPE test | After the 5-5′ test | ||||||
|---|---|---|---|---|---|---|---|---|---|---|
| Mo (wt%) | Ni (wt%) | Si/Al | Ni/(Ni + Mo) | Si/Al | Ni/(Ni + Mo) | Si/Al | Ni/(Ni + Mo) | Si/Al | Ni/(Ni + Mo) | |
| a Zeolyst international. | ||||||||||
| Y | — | — | 15.0a | — | — | — | — | — | — | — |
| NiMoA | 13.3 | 4.6 | — | 0.26 | — | 0.28 | — | 0.26 | — | 0.24 |
| NiMoAY | 12.3 | 4.4 | 0.6 | 0.27 | 0.71 | 0.27 | 0.65 | 0.27 | 0.62 | 0.26 |
| NiMoY | 13.2 | 4.8 | 16.5 | 0.27 | 13.5 | 0.27 | 13.3 | 0.28 | 16.4 | 0.28 |
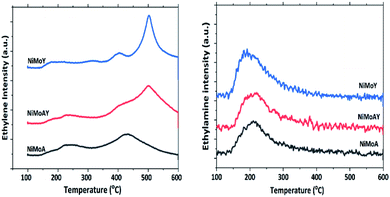
The acidity of the catalysts was measured by ethylamine (C2H5NH2) TPD and is presented in Fig. 5 and Table 5. An advantage of using ethylamine is that it measures the Brønsted acidity directly whereas the more common NH3-TPD requires additional confirmation by e.g. pyridine FTIR to distinguish between Brønsted and Lewis acidity.65–67 During the TPD, ethylamine adsorbs on a Brønsted acid site where proton (H+) transfer occurs and forms ethylammonium ions. They undergo the Hoffman elimination reaction to form ethylene and ammonia at higher temperatures. The concentration of ethylene, which is less likely to undergo readsorption, is used here to quantify Brønsted acidity whereas desorbed ethylamine quantifies the Lewis acidity of the catalyst.68 As seen from Fig. 5, the ethylene desorption peak appeared at different temperatures with an intense peak around 502 °C for NiMoAY and NiMoY. For NiMoA it is around 430 °C.
| Catalyst | Brønsted acidity (μmol g−1) | Lewis acidity (μmol g−1) |
|---|---|---|
| NiMoY | 401 | 22 |
| NiMoAY | 370 | 25 |
| NiMoA | 258 | 30 |
Peak shifting to higher temperatures can be attributed to the strength of the Brønsted acidity.67 The ethylamine desorption peak appears in the range of 150–300 °C. As expected, the Brønsted acidity is the highest for the zeolite containing catalysts, both in strength as well as in amount, whereas there are little differences in the Lewis acidity of the catalysts (Table 5) and in addition the Lewis acid sites are only in the range of 5–10% of the total acidity.
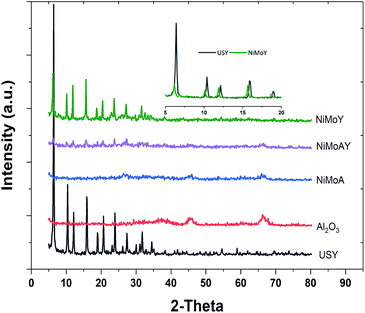
The XRD patterns of the synthesized catalysts are presented in Fig. 6. No diffraction peak of NiO or MoO3 crystallites was distinctly identified. These results indicate that the nickel and molybdenum are well dispersed on the catalyst. However, the inset in the upper right corner of Fig. 6 shows that the diffraction peak shifts toward lower angles after Ni and Mo impregnation in the Y-zeolite. Such a shift observed by others has been considered to result from a change in the composition or strain evolution in the structure.69 Compressive strain development due to pore blockage by Ni and Mo impregnation can therefore not be ruled out. Also, the lower intensity of the diffraction signal for the NiMo impregnated catalysts may indicate lower crystallinity (amorphization) of the metal impregnated zeolite framework.56
Indeed, pore blockage was indicated by changes in the textural properties of the synthesized catalysts, as shown in Table 6. In the fresh catalyst, the pore size is the lowest for NiMoY, where it decreased from 763 to 412 m2 g−1 after impregnation with NiMo. These results are in line with the XRD results indicating strain evolution in the structure. A significant fraction of pore volume due to micropores in the NiMoY catalyst can cause diffusion limitations for dimers having molecular diameters greater than 7.4 Å. In such cases, the reaction will occur preferentially on the external surface or surfaces accessible through mesopores. Sato et al.70 showed that diphenylmethane having a molecular size of 6.2 Å can effectively access the micro- and meso-pores of Y-zeolite. Additionally, a significant reduction in mesopore sizes was observed after the catalytic activity test with all the lignin dimers due to pore blockage. Pore blockage is indeed highest with Y-based catalysts likely due to higher carbon deposition on the catalytic surfaces. For NiMoY/NiMoAY, a 30–45% reduction in the surface area occurred while for NiMoA it is about 8–20%.
| Catalyst | As synthesized | After the BPE test | After the PPE test | After the 5-5′ test | ||||||||
|---|---|---|---|---|---|---|---|---|---|---|---|---|
| S a | V p | d p | S a | V p | d p | S a | V p | d p | S a | V p | d p | |
| a S a = BET surface area (m2 g−1), Vp = pore volume (cm3 g−1), and dp = average pore size for mesopores (Å). | ||||||||||||
| γ-Al2O3 | 199 | 0.48 | 97.6 | |||||||||
| USY | 763 | 0.25 | 63.3 | |||||||||
| NiMoA | 139 | 0.31 | 87.6 | 111 | 0.18 | 84.9 | 119 | 0.20 | 79.1 | 128 | 0.26 | 78 |
| NiMoAY | 270 | 0.26 | 71.9 | 163 | 0.18 | 43.8 | 148 | 0.19 | 51.8 | 175 | 0.23 | 51,9 |
| NiMoY | 412 | 0.20 | 53.1 | 291 | 0.20 | 27.6 | 246 | 0.20 | 31.9 | — | — | — |
Elemental analysis on the recovered catalysts gives the C, H and S contents of the sulfided and post-reaction recovered catalysts as shown in Table 7. For BPE, PPE and 2,2′-biphenol treated catalysts, the carbon deposition rises with increasing Y-zeolite content. Also, in a repeated test using the recovered NiMoY catalyst from the first run with 2,2-biphenol shows an increased carbon content (3 wt% to 5.2 wt%) on the catalyst surface. This is due to the higher concentration of Brønsted acidic sites on NiMoY leading to undesirable side reactions (e.g. adsorption, condensation, polymerization, etc.) of highly reactive adsorbed coke precursors like phenolics. This eventually contributes to catalyst deactivation as the reaction proceeds which has been reported for metal sulfide based catalysts earlier.71 The carbon depositions on the spent catalysts are normalized against the quantity of the conversion of each of the model compounds to deoxygenated products (denoted as C* in Table 7). It seems that carbon deposition is slightly higher for the conversion of the β-O-4 linkage of the model compound (PPE) with the Y-zeolite containing catalysts. This may be related to the higher diffusion resistance of the larger PPE compound in the zeolite structure compared to the other model compounds. Differences in the H content between the fresh and spent catalysts are negligible, whereas there is only a minor decrease in the S content of the spent catalysts.
| Catalyst | Freshly sulfided | After the BPE test | After the PPE test | After the 5-5′ test | ||||||||
|---|---|---|---|---|---|---|---|---|---|---|---|---|
| C | H | S | C* | H | S | C* | H | S | C* | H | S | |
| a C values for catalysts after reaction tests are in (g carbon)/(g catalyst)/(mol of feed converted to deoxygenated products). All other values are in wt% including C in the sulfide catalyst. | ||||||||||||
| NiMoA | 0.4 | 1.3 | 8.8 | 0.98 | 0.8 | 7.7 | 2.1 | 0.7 | 8.2 | 2.7 | 0.5 | 8.3 |
| NiMoAY | — | — | 8.3 | 2.1 | 1.5 | 6.2 | 4.0 | 0.6 | 7.8 | 3.7 | 0.4 | 7.0 |
| NiMoY | 1.0 | 0.9 | 9.8 | 6.5 | 1.6 | 7.1 | 7.9 | 0.5 | 8.9 | 6.7 | 0.5 | 7.0 |
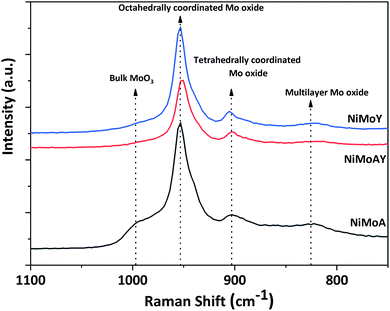
Raman spectra of the synthesized catalysts are presented in Fig. 7. The main peak for all prepared catalysts appeared at around 953 cm−1. This corresponds to the symmetric stretching vibration of Mo![[double bond, length as m-dash]](https://www.rsc.org/images/entities/char_e001.gif) O in octahedrally coordinated Mo oxide species which are considered to interact weakly with the support.72 Such weak interaction enables the formation of highly reducible species and should enhance the activity of the catalyst. Despite a slight shift of the main peak for NiMoAY, all catalysts have similar metal–support interaction. However, peak shoulders observed at different points indicate the presence of bulk MoO3 phases (995 cm−1), less active or inactive tetrahedrally coordinated Mo oxide species (900 cm−1) and the Mo–O–Mo vibration of orthorhombic MoO3, inferring the presence of polymerized Mo oxides (825 cm−1). The absence of the bulk MoO3 peak shoulder at around 995 cm−1 for the more acidic supported catalysts (NiMoAY and NiMoY) implies that they contain more easily reducible Mo oxide species.
O in octahedrally coordinated Mo oxide species which are considered to interact weakly with the support.72 Such weak interaction enables the formation of highly reducible species and should enhance the activity of the catalyst. Despite a slight shift of the main peak for NiMoAY, all catalysts have similar metal–support interaction. However, peak shoulders observed at different points indicate the presence of bulk MoO3 phases (995 cm−1), less active or inactive tetrahedrally coordinated Mo oxide species (900 cm−1) and the Mo–O–Mo vibration of orthorhombic MoO3, inferring the presence of polymerized Mo oxides (825 cm−1). The absence of the bulk MoO3 peak shoulder at around 995 cm−1 for the more acidic supported catalysts (NiMoAY and NiMoY) implies that they contain more easily reducible Mo oxide species.
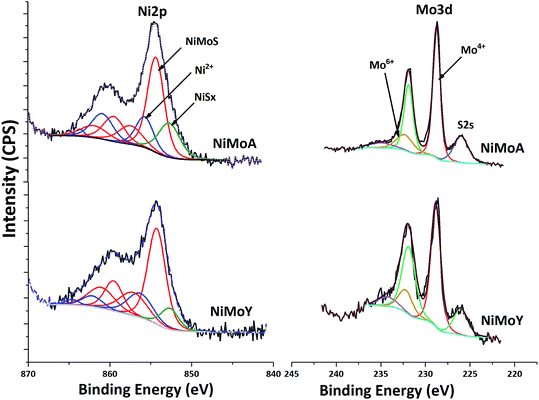
XPS analysis of the sulfided NiMoA and NiMoY is shown in Fig. 8. Evaluation of the Ni 2p and Mo 3d core level spectra infers how the support acidity influences the sulfidation of Mo and Ni. Mo 3d spectral fitting values are: Mo4+ (MoS2) 228.7 ± 0.1 eV for Mo 3d5/2 and 231.9 ± 0.1 eV for Mo 3d3/2; Mo6+ (MoO3) 232.2 ± 0.1 eV for Mo 3d5/2 and 235.4 ± 0.1 eV for Mo 3d3/2. Ni 2p spectral fitting and deconvolution show the presence of NiSx, NiMoS and Ni2+ species at 852.8 ± 0.1, 854.3 ± 0.1 and 856 ± 0.2 eV binding energies respectively. Mo sulfidation was calculated as the contribution of Mo4+ relative to the total amount of Mo species in the Mo 3d core level spectra (excluding S 2s contribution) and Ni sulfidation as the contribution from NiSx and NiMoS relative to the total amount of NiSx, NiMoS and Ni2+. The results in Table 8 show that with the Y support, the contribution of the NiMoS phase is slightly higher than for NiMoA. This indicates that more Ni atoms are embedded into the MoS2 slabs to form the active NiMoS phase73 to a slightly better extent with the Y supported catalyst.
| Catalyst | Mo sulfidation (%) | Ni sulfidation (%) | Slab length (nm) | Stacking | f Mo | ||
|---|---|---|---|---|---|---|---|
| Mo4+ | NiSx | NiMoS | Ni2+ | ||||
| NiMoA | 84 | 16 | 54 | 30 | 4.7 | 3.8 | 0.22 |
| NiMoY | 82 | 8 | 61 | 31 | 4.1 | 4.2 | 0.27 |
Overall sulfidation seems quite similar for both catalysts, and thus independent of the nature of the support. However, the degree of sulfidation may be underestimated from these results since there is a risk for some superfluous oxidation while transferring samples to the XPS chamber.
The morphologies of the metal sulfides are crucial in determining their activity and selectivity under the reaction conditions. The HRTEM images of the sulfided NiMoA and NiMoY shown in Fig. 9 revealed the dispersion of the active NiMoS phase. The average values of the slab length, number of stacks/slabs and fraction of edge Mo atoms were calculated based on 300 individual MoS2 crystals for each sample. As seen from Table 8, a shorter slab length and higher stacking degree with the Y zeolite increase the dispersion (fMo) of the active phases compared to NiMoA. This means that more edge and corner sites of Mo atoms shall be accessible for the case with NiMoY.
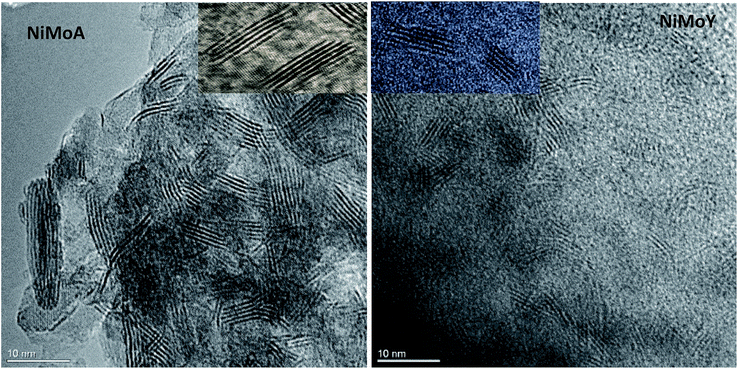 | ||
| Fig. 9 Characteristic HRTEM images of NiMoA and NiMoY: insets show the differences in slab distribution. | ||
Catalytic properties related to the activity
The characterization of the catalysts via TEM, Raman and XPS revealed that NiMo on Y has more active Mo species than NiMoA, due mainly to less bulk MoO3 leading to a comparable degree of sulfidation and an improved dispersion of the active phase. Also, ethylamine-TPD showed a higher concentration of Brønsted acidity on the Y supported catalysts. This provided an enhanced hydrogenolysis of the ether linkage of BPE over NiMoY. However, for PPE the rate of hydrogenolysis is lower for the pure Y supported catalyst. Indeed, for both BPE and PPE, hydrogenolysis is faster on the mixed-support catalyst (NiMoAY) with moderate Brønsted acidity as shown in Fig. 2(a) and 3(a). However, for both cases transalkylation, recombination and acid catalyzed condensation of intermediates were significant leading to the formation of stable aliphatic C-linked phenolic/deoxygenated dimers (Fig. 2(c) and 3(c)). An acid catalyzed intramolecular dehydration reaction was also dominant for 2,2′-biphenol HDO. The combination and proximity of Mo dispersion and Brønsted acidity on NiMoY seem able to effectively cleave the intermediate C–C dimers (both deoxygenated and phenolic). Enhanced hydrocracking for BPE derived intermediates (e.g. DPM, BB, benzyl phenols etc.) to monophenols (cresols) and BTX thus leads to fewer residual dimers. PPE derived intermediates also undergo such cracking to ethyl phenols. For 2,2-biphenol almost no intermediate C–C dimers remained. It is also evident that methyl cyclopentane is a dominant product in the case of NiMoY for all three reactants which indicates the higher isomerization activity of this catalyst. However, the activity tests revealed that the deoxygenation/hydrogenation activity for NiMoY was lower compared to that of NiMoA/NiMoAY. This has led to different products consisting of a mixture of deoxygenated products and cycloalkanes over NiMoA while more aromatics over NiMoY for BPE, PPE and 2,2′-biphenol. The possible reasons for these differences proposed in the literature based on studies of hydroprocessing with sulfided metals on Y zeolite include: (1) stronger adsorption of oxygenates and phenolics on the zeolite surface creating a surface pool of these species, (2) inaccessibility of acidic sites in smaller micropores, (3) the longer diffusion distance between the metallic and acidic sites, i.e. poorer proximity of the active sites especially for the micropores of the zeolite, and (4) different morphologies of metal sulfides inside the zeolite micropores.74,75Previous studies from our group showed that the average particle size of NiMo on alumina, AY and Y-zeolite was in the range of 180–310 Å, which is much larger than that of the zeolite supercage of 12 Å.55 This implies that a portion of particles will remain at the grain boundaries on the external surfaces of the micropore, but parts could be inside the grain and may even not be sulfided.76 The fraction inside grains will be less accessible to the reactants/intermediates. Fig. 10(a) shows the yield of the intermediate phenolic dimers formed during HDO of BPE and PPE over NiMoA and NiMoY. These phenolic dimers are formed from transalkylation and recombination reactions as discussed above. First it can be noted that for the PPE feed the yields of phenolic dimers (2-phenylethylphenols) are higher for NiMoY during the entire reaction period (Fig. 10(a)), whereas for BPE the phenolic dimers (benzyl phenols) are only initially higher for NiMoY. This is likely due to the greater acidity of NiMoY catalyzing transalkylation and dehydration/condensation reactions to form more dimers. For BPE, the intermediate benzyl phenol dimers reached a lower peak yield indicating that they could be converted more rapidly as they should be more accessible to the zeolite micropores than PPE dimers to be cracked to form smaller molecules. For PPE, the formation of 2-phenylethylphenol dimers showed a peak of higher maximum yield after around 3 h, which corresponds to when all the PPE has converted (see Fig. 3(a)), followed by a steep decrease. This indicates that the diffusion limitations play a role for both BPE and PPE; however they are more prominent for PPE and its dimers due to their larger molecular size. The diffusion limitations and pore mouth blockage create a larger surface phenolics pool. As noticed, the degree of hydrocracking/deoxygenation increases over NiMoY once the BPE/PPE are converted. However, the greater surface coverage by recombined dimers and phenolics on NiMoY delays the monophenol deoxygenation on metallic or acid sites due to competitive adsorption in the presence of hydrogen, i.e. via hydrogen transfer reaction.77 The reactive phenolics on the NiMoY surface thus may have longer residence times that favor undesirable reactions that can deactivate the catalyst with carbonaceous products. Both BPE and PPE treated NiMoY spent catalyst samples contain around 14 wt% C, most probably due to strongly adsorbed phenolics and other carbonaceous deposits.
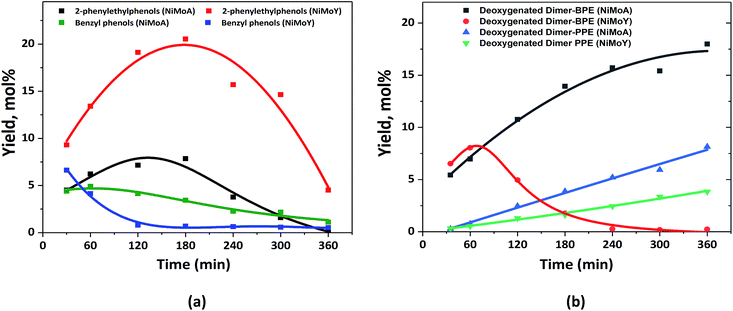 | ||
| Fig. 10 (a) Yield of the intermediate phenolic dimers and benzyl phenols from BPE and 2-phenylethylphenols from PPE; (b) deoxygenated dimers from BPE and PPE. | ||
The phenolic dimer compounds can undergo C–C cleavage reactions to yield monophenols and aromatics or they may undergo HDO to yield deoxygenated dimers. Fig. 10(b) compares the yields of the deoxygenated dimers with NiMoY and NiMoA catalysts for both BPE and PPE. For BPE, there is a remarkable difference where the yield of deoxygenated dimers steadily increases for NiMoA, whereas it rapidly decreases after about 60 min for NiMoY. For PPE, the yield of deoxygenated dimers steadily increases for both catalysts, but at a lower rate for NiMoY. The comparison of the yields of phenolic dimers in Fig. 10(a) and deoxygenated dimers in Fig. 10(b) indicates that for NiMoA, the phenolic dimers mainly undergo HDO, whereas for the NiMoY catalyst C–C bond cleavage reactions are more favored. It is therefore evident from the HDO of BPE and PPE that the NiMoY catalyst can efficiently cleave both etheric and recombined C–C linkages while for the NiMoA C–C dimer yields only increase with time (Fig. 10). Also, the recalcitrant 5,5′ linkages can be partially cleaved with NiMoY. This shows the potential of this catalyst (NiMoY) for upgrading technical lignin in future biorefineries. However, a suitable balance between the Brønsted acid sites (BASs), deoxygenation sites and pore accessibility is the key parameter essential to optimize the performance of NiMoY.
Conclusions
The support acidity of NiMo based catalysts is an effective tool to control product selectivity during the conversion of lignin feedstocks containing α-O-4, β-O-4 and C–C linkages into high value fuel additives and chemicals. NiMo on a modified support (AY) shows enhanced hydrogenolysis of etheric bonds for both BPE and PPE. With BPE, containing an α-O-4 linkage, NiMoY selectively yields more deoxygenated aromatics with fewer residual C–C dimers. For example, NiMoY produced less than 1% cyclohexane and instead formed 35% benzene, while NiMoA produced 38% cyclohexane. With PPE, containing β-O-4 linkages, NiMoA yields more ethylbenzene and cyclohexane while NiMoY favors deoxygenated aromatics including benzene, toluene, and ethylbenzene, but also produces more residual phenolics. Also, the Y-zeolite based sulfided NiMo catalyst can break the C–C linkage in 2,2′-biphenol without the formation of residual C–C dimers which were observed with NiMoA. Increased isomerization and hydrocracking activity of NiMoY can be attributed to better dispersion of the active metal sulfide phases and the presence of more and stronger Brønsted acidic sites. However, the Y-based catalyst suffered from lower phenolic deoxygenation activity that appeared to be related to its higher initial activity for the formation of phenolic dimers and diffusion limitations. Also, a higher rate of coke formation was observed for the Y-based catalyst which may lead to faster catalyst deactivation. Hence, the proximity of the deoxygenation and acidic sites and their accessibility to the reactant/intermediates likely plays a key role for the product selectivity during HDO on NiMo based catalysts on Y-zeolites.Conflicts of interest
There are no conflicts to declare.Acknowledgements
This work is performed at the Competence Centre for Catalysis (KCK) and division of chemical reaction engineering at the Chalmers University of Technology. We would like to acknowledge the Swedish Energy Agency (contract: 2016-08330) for the financial aid. We would also like to acknowledge Stefan Gustafsson for his help with the TEM analysis.Notes and references
- H. Wang, H. Ruan, M. Feng, Y. Qin, H. Job, L. Luo, C. Wang, M. H. Engelhard, E. Kuhn, X. Chen, M. P. Tucker and B. Yang, ChemSusChem, 2017, 10, 1846–1856 CrossRef CAS PubMed.
- J. Zakzeski, P. C. A. Bruijnincx, A. L. Jongerius and B. M. Weckhuysen, Chem. Rev., 2010, 110, 3552–3599 CrossRef CAS PubMed.
- S. Guadix-Montero and M. Sankar, Top. Catal., 2018, 61, 183–198 CrossRef CAS.
- A. V. Bridgwater, Biomass Bioenergy, 2012, 38, 68–94 CrossRef CAS.
- E. L. a. B. Delmon, Ind. Eng. Chem. Res., 1993, 32, 2516–2524 CrossRef.
- C. Zhao, J. He, A. A. Lemonidou, X. Li and J. A. Lercher, J. Catal., 2011, 280, 8–16 CrossRef CAS.
- B. Yoosuk, D. Tumnantong and P. Prasassarakich, Chem. Eng. Sci., 2012, 79, 1–7 CrossRef CAS.
- S. Echeandia, B. Pawelec, V. L. Barrio, P. L. Arias, J. F. Cambra, C. V. Loricera and J. L. G. Fierro, Fuel, 2014, 117, 1061–1073 CrossRef CAS.
- H. Shafaghat, P. S. Rezaei and W. M. Ashri Wan Daud, RSC Adv., 2015, 5, 103999–104042 RSC.
- C. Newman, X. Zhou, B. Goundie, I. T. Ghampson, R. A. Pollock, Z. Ross, M. C. Wheeler, R. W. Meulenberg, R. N. Austin and B. G. Frederick, Appl. Catal., A, 2014, 477, 64–74 CrossRef CAS.
- S. Boullosa-Eiras, R. Lødeng, H. Bergem, M. Stöcker, L. Hannevold and E. A. Blekkan, Catal. Today, 2014, 223, 44–53 CrossRef CAS.
- L. T. Funkenbusch, M. E. Mullins, M. A. Salam, D. Creaser and L. Olsson, Fuel, 2019, 243, 441–448 CrossRef CAS.
- X. Zhu, L. L. Lobban, R. G. Mallinson and D. E. Resasco, J. Catal., 2011, 281, 21–29 CrossRef CAS.
- Q. Tan, G. Wang, A. Long, A. Dinse, C. Buda, J. Shabaker and D. E. Resasco, J. Catal., 2017, 347, 102–115 CrossRef CAS.
- I. T. Ghampson, G. Pecchi, J. L. G. Fierro, A. Videla and N. Escalona, Appl. Catal., B, 2017, 208, 60–74 CrossRef CAS.
- D. Shi, L. Arroyo-Ramírez and J. M. Vohs, J. Catal., 2016, 340, 219–226 CrossRef CAS.
- V. N. Bui, D. Laurenti, P. Afanasiev and C. Geantet, Appl. Catal., B, 2011, 101, 239–245 CrossRef CAS.
- I. D. Mora, E. Méndez, L. J. Duarte and S. A. Giraldo, Appl. Catal., A, 2014, 474, 59–68 CrossRef CAS.
- I. D. Mora-Vergara, L. Hernández Moscoso, E. M. Gaigneaux, S. A. Giraldo and V. G. Baldovino-Medrano, Catal. Today, 2018, 302, 125–135 CrossRef CAS.
- Z. He, M. Hu and X. Wang, Catal. Today, 2018, 302, 136–145 CrossRef CAS.
- Z. Luo, Z. Zheng, Y. Wang, G. Sun, H. Jiang and C. Zhao, Green Chem., 2016, 18, 5845–5858 RSC.
- X. Zhang, T. Wang, L. Ma, Q. Zhang, Y. Yu and Q. Liu, Catal. Commun., 2013, 33, 15–19 CrossRef CAS.
- E. Laurent and B. Delmon, Appl. Catal., A, 1994, 109, 97–115 CrossRef CAS.
- X. Lan, E. J. M. Hensen and T. Weber, Appl. Catal., A, 2018, 550, 57–66 CrossRef CAS.
- H. Y. Zhao, D. Li, P. Bui and S. T. Oyama, Appl. Catal., A, 2011, 391, 305–310 CrossRef CAS.
- T. R. H. Douglas and C. Elliott, Energy Fuels, 2009, 23, 631–637 CrossRef.
- M. Alda-Onggar, P. Maki-Arvela, K. Eranen, A. Aho, J. Hemming, P. Paturi, M. Peurla, M. Lindblad, I. L. Simakova and D. Y. Murzin, ACS Sustainable Chem. Eng., 2018, 6, 16205–16218 CrossRef CAS PubMed.
- X. Liu, W. Jia, G. Xu, Y. Zhang and Y. Fu, ACS Sustainable Chem. Eng., 2017, 5, 8594–8601 CrossRef CAS.
- P. E. Ruiz, B. G. Frederick, W. J. De Sisto, R. N. Austin, L. R. Radovic, K. Leiva, R. García, N. Escalona and M. C. Wheeler, Catal. Commun., 2012, 27, 44–48 CrossRef CAS.
- X. Li, G. Chen, C. Liu, W. Ma, B. Yan and J. Zhang, Renewable Sustainable Energy Rev., 2017, 71, 296–308 CrossRef CAS.
- M. Saidi, F. Samimi, D. Karimipourfard, T. Nimmanwudipong, B. C. Gates and M. R. Rahimpour, Energy Environ. Sci., 2014, 7, 103–129 RSC.
- M. Koyama, Bioresour. Technol., 1993, 44, 209–215 CrossRef CAS.
- A. L. Jongerius, R. Jastrzebski, P. C. A. Bruijnincx and B. M. Weckhuysen, J. Catal., 2012, 285, 315–323 CrossRef CAS.
- B. Güvenatam, O. Kurşun, E. H. J. Heeres, E. A. Pidko and E. J. M. Hensen, Catal. Today, 2014, 233, 83–91 CrossRef.
- C. Zhao and J. A. Lercher, Angew. Chem., Int. Ed., 2012, 51, 5935–5940 CrossRef CAS PubMed.
- W. Zhang, J. Chen, R. Liu, S. Wang, L. Chen and K. Li, ACS Sustainable Chem. Eng., 2014, 2, 683–691 CrossRef CAS.
- Y.-K. Hong, D.-W. Lee, H.-J. Eom and K.-Y. Lee, Appl. Catal., B, 2014, 150–151, 438–445 CrossRef CAS.
- W. Schutyser, T. Renders, S. Van den Bosch, S. F. Koelewijn, G. T. Beckham and B. F. Sels, Chem. Soc. Rev., 2018, 47, 852–908 RSC.
- W. Song, S. Zhou, S. Hu, W. Lai, Y. Lian, J. Wang, W. Yang, M. Wang, P. Wang and X. Jiang, ACS Catal., 2018, 9, 259–268 CrossRef.
- L. Shuai, J. Sitison, S. Sadula, J. Ding, M. C. Thies and B. Saha, ACS Catal., 2018, 8, 6507–6512 CrossRef CAS.
- S. Mukundan, L. Atanda and J. Beltramini, Sustainable Energy Fuels, 2019, 3, 1317–1328 RSC.
- M. Williams, B. Fonfe, C. Sievers, A. Abraham, J. Vanbokhoven, A. Jentys, J. Vanveen and J. Lercher, J. Catal., 2007, 251, 485–496 CrossRef CAS.
- J. García-Martínez, M. Johnson, J. Valla, K. Li and J. Y. Ying, Catal. Sci. Technol., 2012, 2, 987–994 RSC.
- Z. Ma, E. Troussard and J. A. van Bokhoven, Appl. Catal., A, 2012, 423–424, 130–136 CrossRef CAS.
- J. Garcia-Martinez, K. Li and G. Krishnaiah, Chem. Commun., 2012, 48, 11841–11843 RSC.
- S. G. A. Ferraz, B. M. Santos, F. M. Z. Zotin, L. R. R. Araujo and J. L. Zotin, Ind. Eng. Chem. Res., 2015, 54, 2646–2656 CrossRef CAS.
- S. G. A. Ferraz, F. M. Z. Zotin, L. R. R. Araujo and J. L. Zotin, Appl. Catal., A, 2010, 384, 51–57 CrossRef CAS.
- J.-I. Park, J.-K. Lee, J. Miyawaki, Y.-K. Kim, S.-H. Yoon and I. Mochida, Fuel, 2011, 90, 182–189 CrossRef CAS.
- M. O. Kazakov, K. A. Nadeina, I. G. Danilova, P. P. Dik, O. V. Klimov, V. Y. Pereyma, E. A. Paukshtis, I. S. Golubev, I. P. Prosvirin, E. Y. Gerasimov, I. V. Dobryakova, E. E. Knyazeva, I. I. Ivanova and A. S. Noskov, Catal. Today, 2019, 329, 108–115 CrossRef CAS.
- D. Y. Hong, S. J. Miller, P. K. Agrawal and C. W. Jones, Chem. Commun., 2010, 46, 1038–1040 RSC.
- H. Lee, H. Kim, M. J. Yu, C. H. Ko, J. K. Jeon, J. Jae, S. H. Park, S. C. Jung and Y. K. Park, Sci. Rep., 2016, 6, 28765 CrossRef CAS PubMed.
- A. K. Deepa and P. L. Dhepe, RSC Adv., 2014, 4, 12625–12629 RSC.
- M. Abdus Salam, D. Creaser, P. Arora, S. Tamm, E. Lind Grennfelt and L. Olsson, Catalysts, 2018, 8, 418 CrossRef.
- P. Arora, H. Ojagh, J. Woo, E. Lind Grennfelt, L. Olsson and D. Creaser, Appl. Catal., B, 2018, 227, 240–251 CrossRef CAS.
- H. Ojagh, D. Creaser, M. A. Salam, E. L. Grennfelt and L. Olsson, Fuel Process. Technol., 2019, 190, 55–66 CrossRef CAS.
- W. Zhou, Y. Zhou, Q. Wei, L. Du, S. Ding, S. Jiang, Y. Zhang and Q. Zhang, Chemistry, 2017, 23, 9369–9382 CrossRef CAS PubMed.
- J. He, L. Lu, C. Zhao, D. Mei and J. A. Lercher, J. Catal., 2014, 311, 41–51 CrossRef CAS.
- X.-Y. Wei, E. Ogata, Z.-M. Zong and E. Niki, Energy Fuels, 1992, 6, 868–869 CrossRef CAS.
- W.-C. Cheng and K. Rajagopalan, J. Catal., 1989, 119, 354–358 CrossRef CAS.
- S. Krishnamurthy, S. Panvelker and Y. T. Shah, AIChE J., 1989, 27, 994–1001 CrossRef.
- J. Zhang, C. Li, X. Chen, W. Guan and C. Liang, Catal. Today, 2019, 319, 155–163 CrossRef CAS.
- J. Zhang, C. Li, X. Chen, Y. Chen, L. Zhang, B. Zhang and C. Liang, J. Catal., 2019, 371, 346–356 CrossRef CAS.
- J. Zhang, L. Wang, C. Li, S. Jin and C. Liang, Org. Process Res. Dev., 2018, 22, 67–76 CrossRef CAS.
- L. Wang, H. Wan, S. Jin, X. Chen, C. Li and C. Liang, Catal. Sci. Technol., 2015, 5, 465–474 RSC.
- O. A. Abdelrahman, K. P. Vinter, L. Ren, D. Xu, R. J. Gorte, M. Tsapatsis and P. J. Dauenhauer, Catal. Sci. Technol., 2017, 7, 3831–3841 RSC.
- O. Kresnawahjuesa, R. J. Gorte, D. d. Oliveira and L. Y. Lau, Catal. Lett., 2002, 82, 155–160 CrossRef CAS.
- R. J. Gorte, Catal. Lett., 1999, 62, 1–13 CrossRef CAS.
- H. H. Ingelsten, M. Skoglundh and E. Fridell, Appl. Catal., B, 2003, 41, 287–300 CrossRef CAS.
- A. Wang, B. Lin, H. Zhang, M. H. Engelhard, Y. Guo, G. Lu, C. H. F. Peden and F. Gao, Catal. Sci. Technol., 2017, 7, 2362–2370 RSC.
- K. Sato, Y. Nishimura and H. Shimada, Catal. Lett., 1999, 60, 83–87 CrossRef CAS.
- O. İ. Şenol, T. R. Viljava and A. O. I. Krause, Appl. Catal., A, 2007, 326, 236–244 CrossRef.
- N. Kunisada, K.-H. Choi, Y. Korai, I. Mochida and K. Nakano, Appl. Catal., A, 2004, 269, 43–51 CrossRef CAS.
- W. Zhou, M. Liu, Q. Zhang, Q. Wei, S. Ding and Y. Zhou, ACS Catal., 2017, 7, 7665–7679 CrossRef CAS.
- E. J. M. Hensen and J. A. R. van Veen, Catal. Today, 2003, 86, 87–109 CrossRef CAS.
- K. Sato, Y. Nishimura, K. Honna, N. Matsubayashi and H. Shimada, J. Catal., 2001, 200, 288–297 CrossRef CAS.
- M. J. M. Leglise, C. Potvin, G. Djega-Mariadassou and D. Cornet, J. Catal., 1995, 152, 275–290 CrossRef.
- M. Heuchel, C. Dörr, R. Boldushevskii, S. Lang, E. Klemm and Y. Traa, Appl. Catal., A, 2018, 553, 91–106 CrossRef CAS.
Footnote |
| † Electronic supplementary information (ESI) available. See DOI: 10.1039/c9se00507b |
| This journal is © The Royal Society of Chemistry 2020 |


