 Open Access Article
The modifying effect of supramolecular gel fibres on the diffusion of paracetamol and ibuprofen sodium on the picosecond timescale
Robert M.
Edkins
 a,
Markus
Appel
 b,
Tilo
Seydel
 *b and
Katharina
Edkins
 *c
*c
aWestCHEM Department of Pure and Applied Chemistry, Thomas Graham Building, University of Strathclyde, 295 Cathedral Street, Glasgow G1 1XL, UK
bInstitut Max von Laue – Paul Langevin (ILL), 71 Avenue des Martyrs – CS 20156, F-38042 Grenoble, France. E-mail: seydel@ill.eu
cDivision of Pharmacy and Optometry, University of Manchester, Oxford Road, Manchester M13 9PT, UK. E-mail: katharina.edkins@manchester.ac.uk
First published on 20th April 2020
Abstract
Employing neutron spectroscopy, we follow the tracer diffusion of two non-steroidal anti-inflammatory drug molecules, paracetamol (PCM) and ibuprofen sodium (IBU), in a supramolecular gel and the corresponding bulk solution. Both solutes show altered diffusion behaviour in the gel phase, deviating from each other and their bulk solution. Whilst picosecond diffusion of IBU is slightly quicker in the gel, this effect is significantly increased for PCM, which is up to 70% quicker in the gel than in solution. This effect is independent of changes in the solvent diffusion reported previously. An increased residence time of PCM in solution at lower temperatures points towards the onset of nucleation and crystallisation. This work reports one of the first experiments on the novel Backscattering and Time-of-Flight option (BATS) on the IN16B spectrometer at the Institut Laue-Langevin, France, which with its range and resolution in neutron energy and momentum transfer is ideally suited to observe this type of diffusion.
1 Introduction
Diffusion in soft matter impacts upon a variety of areas within biological, physical, material and life sciences. Gels, one of the most common soft materials, consist of a solid fibrous network that immobilises a coherent liquid phase. Revealing both liquid and solid characteristics, gels are naturally occurring in cells and tissues,1,2 but have also been exploited for drug delivery,3,4 solar energy harvesting,5 flexible electronics,6 catalysis,7 and novel battery design.8 Especially in drug delivery with long and sustained release or tailored release kinetics, gels are used as delivery vehicles in their own right.4 The classical examples are gels for topical application, e.g. for the local delivery of pain medication or the systemic delivery of hormones. However, newer applications such as local delivery to the cornea of the eye,9 or as in situ gelling injectables for sustained release,10 have moved patient- and disease-focused drug delivery forward. In addition to their application per se, gels and gel-forming materials are used classically to coat particles, granules or tablets, or can act as a matrix for sustained-release tablets.Traditionally, the solid fibre network of pharmaceutical gels is made up by a variety of biopolymers, such as gelatine and agarose; however, a variety of artificial polymers are nowadays applied for general and more specific drug delivery. Both classes are made of chain-like molecules that can entangle and form a continuous solid network that immobilises the liquid phase to form the gel. As an alternative to macromolecular gelators, supramolecular gels based on low-molecular-weight gelators (LMWGs) utilise small organic molecules with a molecular weight of up to 1000 Da, which undergo an arrested crystallisation to assemble predominantly in a single dimension.11 The resulting fibrils thus mimic the long-chain polymeric gelators, but have the inherent advantage of easier modification using well-versed synthetic tools. Based on various physical stimuli, such as changes in pH, temperature and ion concentration, these gels set reversibly through supramolecular interactions in a variety of solvents including water,12 which is particularly important in pharmaceutical applications. Whilst the advantages of LMWGs have been readily realised and translated into application in fields such as sensing,13 crystallisation,14 and water sequestration,15 their application in the pharmaceutical sector is still in its infancy, likely caused by the more stringent controls of materials hazards in the health sciences.
For any of the mentioned applications, the interaction between the liquid phase and the solid fibre surface is of particular importance. Supramolecular gels are kinetically stabilised intermediates on the path to crystallisation,16 and can show a high mobility of the gelator molecules between solid and liquid phase.17–20 In addition to the gelator kinetics, the solvent diffusion and possibly even more importantly the solute diffusion within these gels have been in the focus of attention. The solid fibre network does not only provide confinement,21 and thus altered diffusion characteristics at diffusion lengthscales larger than the confinement, but also surfaces of high surface area with which solvent and solute molecules can interact.22,23 However, to deconvolve confinement and surface effects is not trivial. The majority of diffusion measurements are performed using pulse-field gradient or diffusion ordered nuclear magnetic resonance (NMR) spectroscopy, which allows diffusion on the millisecond timescale to be gauged. On this timescale, both surface chemistry and confinement structure influence the diffusion. Measurements on shorter timescales, which erase the confinement influence, are possible, e.g. by quasi-elastic neutron spectroscopy, and can lead to quite different results. Using this method, we could recently show that for a prototypical supramolecular gel the picosecond diffusion of the solvent in the gel is quicker than in the bulk solvent.24 Whilst this effect in itself is surprising, measurements on the longer timescales probed by NMR reveal the reverse effect of solvent diffusing faster in bulk solvent than in the gel, where now confinement dominates the apparent diffusion coefficient.
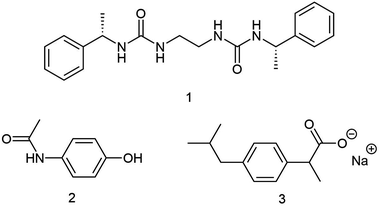
In this study, we employ high-resolution quasi-elastic neutron spectroscopy to explore the diffusion of paracetamol (PCM) and ibuprofen sodium (IBU) solutes loaded in the same prototypical supramolecular gel (Fig. 1) as used by us previously.24 Using the novel spectrometer BATS25–28 at the Institut Laue-Langevin, France, we followed the tracer diffusion of the solute load on a time scale of picoseconds to up to one nanosecond, well below the confinement of the gels, corresponding to energy resolution of BATS of approximately 3.5 μeV FWHM. Whilst the BATS spectrometer is ideally suited to follow the diffusion of the guest molecules, we simultaneously capture the faster diffusion dynamics of the deuterated solvent to some extent.
2 Experimental
The novel cold neutron backscattering-and-time-of-flight (BATS) option25–27 on IN16B29 was used with Si(111) analyser crystals, with the chosen chopper settings corresponding to an energy resolution of approximately 3.5 μeV FWHM.25 The neutron spectra accessed the scattering function S(q,ω) depending on the momentum transfer q and energy transfer ħω.PCM and IBU, and all solvents were purchased from Sigma Aldrich and used without further purification. The gelator molecule was synthesised following literature procedure.30 The samples were prepared by dissolving PCM or IBU at 5% w/v in the deuterated solvent consisting of 7![[thin space (1/6-em)]](https://www.rsc.org/images/entities/char_2009.gif) :
:![[thin space (1/6-em)]](https://www.rsc.org/images/entities/char_2009.gif) 3 v/v D2O
3 v/v D2O![[thin space (1/6-em)]](https://www.rsc.org/images/entities/char_2009.gif) :
:![[thin space (1/6-em)]](https://www.rsc.org/images/entities/char_2009.gif) ethanol-D6. For the gel samples, 0.3% w/v gelator was added. Both gel and solution samples were treated the same with the following protocol to keep them as comparable as possible. The samples were heated to boiling point of the solvent in order to dissolve the gelator solid. The obtained clear solutions were subsequently transferred hot into double-walled cylindrical Al cans with 15 mm outer diameter and a gap of Δr = 0.3 mm. These were hermetically sealed and the solutions left for 30 minutes to cool down and set the gel without further perturbation. The obtained sample cans were inserted in a standard Orange cryofurnace mounted on the spectrometer for temperature control. The neutron scattering recording time amounted to approximately 5 hours per spectrum per temperature. The so measured samples were as follows: pure deuterated solvent mixture, 0.3% w/v gel in deuterated solvent mixture, 5% w/v PCM or IBU in deuterated solvent mixture and in 0.3% w/v gel in deuterated solvent mixture. Each sample was measured at 270 K, 280 K (except IBU-loaded solution and gel), 290 K and 310 K. The major scattering contributions in these samples are the protiated drug loads, which increase the incoherent scattering cross section from 12.9 m−1 of the pure solvent and 14.1 m−1 for the pure gel to 28.7 and 33.7 m−1 for the PCM and IBU gel samples, respectively. The contribution of the protiated gelator is with 1.2 m−1 an order of magnitude smaller than the contribution from the drug load, and, due to its presence as solid, will mainly contribute to the elastic scattering of the signal.
ethanol-D6. For the gel samples, 0.3% w/v gelator was added. Both gel and solution samples were treated the same with the following protocol to keep them as comparable as possible. The samples were heated to boiling point of the solvent in order to dissolve the gelator solid. The obtained clear solutions were subsequently transferred hot into double-walled cylindrical Al cans with 15 mm outer diameter and a gap of Δr = 0.3 mm. These were hermetically sealed and the solutions left for 30 minutes to cool down and set the gel without further perturbation. The obtained sample cans were inserted in a standard Orange cryofurnace mounted on the spectrometer for temperature control. The neutron scattering recording time amounted to approximately 5 hours per spectrum per temperature. The so measured samples were as follows: pure deuterated solvent mixture, 0.3% w/v gel in deuterated solvent mixture, 5% w/v PCM or IBU in deuterated solvent mixture and in 0.3% w/v gel in deuterated solvent mixture. Each sample was measured at 270 K, 280 K (except IBU-loaded solution and gel), 290 K and 310 K. The major scattering contributions in these samples are the protiated drug loads, which increase the incoherent scattering cross section from 12.9 m−1 of the pure solvent and 14.1 m−1 for the pure gel to 28.7 and 33.7 m−1 for the PCM and IBU gel samples, respectively. The contribution of the protiated gelator is with 1.2 m−1 an order of magnitude smaller than the contribution from the drug load, and, due to its presence as solid, will mainly contribute to the elastic scattering of the signal.
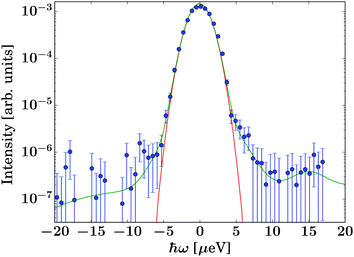
The data were reduced using Mantid31 4.2.0 and subsequently analysed using python 3.6.9 scripts. The energy resolution was measured using vanadium foil in the same geometry as the samples and fitted by a sum of Gaussians for an analytical description of the resolution function. As illustrated by Fig. 2, the resolution function can be described very well by a single Gaussian line shape over at least three orders of magnitude. For this reason, an analytical description of the resolution function was chosen for the fits, thus avoiding the numerical convolution of the model function with the noisy measured resolution function. Since the description of the resolution function ![[scr R, script letter R]](https://www.rsc.org/images/entities/char_e531.gif) consists of a sum of Gaussians, and the model scattering function S(q,ω) consists of Lorentzian and elastic contributions only, the convolution
consists of a sum of Gaussians, and the model scattering function S(q,ω) consists of Lorentzian and elastic contributions only, the convolution ![[scr R, script letter R]](https://www.rsc.org/images/entities/char_e531.gif) ⊗ S(q,ω) of the model with the energy resolution function was performed analytically via Voigt functions built from the Faddeeva function. The scattering contribution from the empty cryofurnace was fitted by a polynomial, which was subtracted from the spectra. This subtraction of a polynomial description of the empty cryofurnace gave very similar results to a direct subtraction, but had the advantage of not adding additional noise as would be the case when propagating the errors on the measured empty cryofurnace through the subtraction. The data were subsequently fitted in two steps: first, the pure solvent signal was fitted by
⊗ S(q,ω) of the model with the energy resolution function was performed analytically via Voigt functions built from the Faddeeva function. The scattering contribution from the empty cryofurnace was fitted by a polynomial, which was subtracted from the spectra. This subtraction of a polynomial description of the empty cryofurnace gave very similar results to a direct subtraction, but had the advantage of not adding additional noise as would be the case when propagating the errors on the measured empty cryofurnace through the subtraction. The data were subsequently fitted in two steps: first, the pure solvent signal was fitted by
Ssolvent(q,ω) = b(q)![[script L]](https://www.rsc.org/images/entities/char_e144.gif) (γsolvent(q),ω) + c(q)δ(ω) + αω + β (γsolvent(q),ω) + c(q)δ(ω) + αω + β | (1) |
Therein, ![[script L]](https://www.rsc.org/images/entities/char_e144.gif) (γsolvent(q),ω) is the Lorentzian with the width γsolvent describing the solvent diffusion, b(q), c(q), α, and β are scalars, and δ(ω) is a Dirac function accounting for the scattering contribution of the sample container, which was not subtracted due to uncertainties in the otherwise required description of the sample self-shielding and absorption, and due to the small elastic scattering from the gelator molecules in the case of the gel, which would be difficult to distinguish from the container itself. The term αω + β accounts for a small apparent sloped background arising from instrument and sample contributions, notably very fast motions in the sample. b(q), c(q), α, β, and γsolvent were free fit parameters that were fitted for the spectra at each q independently.
(γsolvent(q),ω) is the Lorentzian with the width γsolvent describing the solvent diffusion, b(q), c(q), α, and β are scalars, and δ(ω) is a Dirac function accounting for the scattering contribution of the sample container, which was not subtracted due to uncertainties in the otherwise required description of the sample self-shielding and absorption, and due to the small elastic scattering from the gelator molecules in the case of the gel, which would be difficult to distinguish from the container itself. The term αω + β accounts for a small apparent sloped background arising from instrument and sample contributions, notably very fast motions in the sample. b(q), c(q), α, β, and γsolvent were free fit parameters that were fitted for the spectra at each q independently.
Subsequently, the samples containing the guest molecules were fitted by
S(q,ω) = a(q)![[script L]](https://www.rsc.org/images/entities/char_e144.gif) (γsolute(q),ω) + φ × b(q) (γsolute(q),ω) + φ × b(q)![[script L]](https://www.rsc.org/images/entities/char_e144.gif) (γsolvent(q),ω) + d(q)δ(ω) + αω + β, (γsolvent(q),ω) + d(q)δ(ω) + αω + β, | (2) |
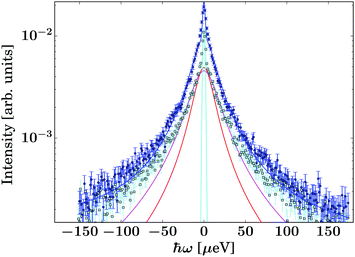 | ||
| Fig. 3 Example spectrum recorded on the gel containing IBU at T = 270 K and q = 1.08 Å−1 (dark blue circle symbols). The light blue/black squares represent the corresponding pure solvent spectrum. The dark blue line superimposed on the circle symbols denotes the fit consisting of the guest molecule, solvent, and container contributions (eqn (2)). | ||
3 Results and discussion
Fig. 4 displays the fit results for the Lorentzian linewidth associated with the solvent diffusion of the pure solvent and unloaded gel, respectively. In both samples at 270 K and to a lower degree at 280 K, a levelling off of the Lorentzian widths over q2 can be observed, most pronounced in the range of 2.0 to 3.0 Å−2. This phenomenon, called de Gennes narrowing,32 is often observed in the vicinity of the maximum of total scattering intensity and is an effect of the predominantly coherent scattering cross section of the deuterated solvent in contrast to the protiated solvent reported earlier.24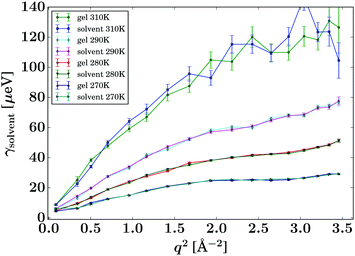 | ||
| Fig. 4 Lorentzian widths γsolvent (eqn (1), symbols) fitted to the pure solvent and pure gel spectra, respectively, for the samples and temperatures as given in the legend. The lines are guides to the eye. | ||
Due to the accessed range in ω, only one Lorentzian function was fitted (eqn (1)). In contrast, on spectrometers with a wider energy range, an additional Lorentzian contribution would be visible for the solvent.33,34 The corresponding intensities b(q) are reported in Fig. 5 and show good comparability between the bulk solvent and gel samples. Whilst the intensities associated with the gel are slightly lower than the corresponding pure solvent, this phenomenon is not significant and could be arising from the fact that a small fraction of the molecules are immobilised in the gel samples, thus contributing to elastic scattering, or it could present an artefact from the sample preparation.
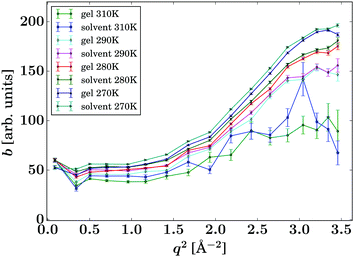 | ||
| Fig. 5 Intensities b(q) of the Lorentzian associated with the pure solvent and pure gel spectra (eqn (1), symbols), respectively, for the samples and temperatures as given in the legend. The lines are guides to the eye. | ||
Based on this data, it can be anticipated that any changes in the diffusion of drug load within the gels is due to an altered environment for the solute molecules rather than a secondary effect from the changed solvent diffusion in the gel samples.
The tracer diffusion linewidth of the solute molecules in solution and the gel samples was fitted with the jump diffusion model35
 | (3) |
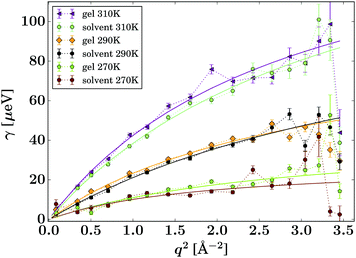 | ||
| Fig. 6 Lorentzian width γ(q) associated with the IBU guest molecule (eqn (2), symbols). The solid lines represent fits of the jump diffusion model (eqn (3)). | ||
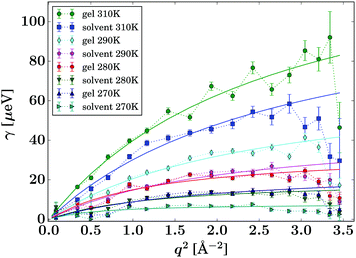 | ||
| Fig. 7 Lorentzian width γ(q) associated with the PCM guest molecule (eqn (2), symbols). The solid lines represent fits of the jump diffusion model (eqn (3)). | ||
| Sample | D [10−9 m2 s−1] | τ [ps] |
|---|---|---|
| IBU gel 310 K | 0.87 ± 0.04 | 6.02 ± 0.59 |
| IBU solvent 310 K | 0.75 ± 0.02 | 5.64 ± 0.42 |
| IBU gel 290 K | 0.47 ± 0.02 | 10.52 ± 1.02 |
| IBU solvent 290 K | 0.39 ± 0.02 | 8.11 ± 1.46 |
| IBU gel 270 K | 0.22 ± 0.03 | 22.69 ± 5.19 |
| IBU solvent 270 K | 0.24 ± 0.06 | 34.72 ± 9.93 |
| PCM gel 310 K | 0.83 ± 0.05 | 6.75 ± 0.79 |
| PCM solvent 310 K | 0.62 ± 0.05 | 8.5 ± 1.4 |
| PCM gel 290 K | 0.44 ± 0.04 | 14.0 ± 1.67 |
| PCM solvent 290 K | 0.33 ± 0.05 | 21.65 ± 3.86 |
| PCM gel 280 K | 0.40 ± 0.07 | 28.62 ± 4.26 |
| PCM solvent 280 K | 0.24 ± 0.06 | 49.26 ± 8.93 |
| PCM gel 270 K | 0.21 ± 0.04 | 39.66 ± 8.69 |
| PCM solvent 270 K | 0.21 ± 0.11 | 124.78 ± 24.47 |
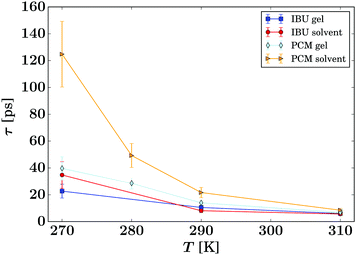 | ||
| Fig. 8 Summary of the residence times τ of the guest molecules (eqn (3), symbols) for all samples as given in the legend. The lines are guides to the eye. | ||
The presented fitted data clearly show a different diffusion behaviour for each solute species, and both differ to that reported for the solvent in the same gel material.24 The diffusion of IBU in the gels is slightly faster than in bulk solution, but even though this trend runs through all sampled temperatures, it is barely significant. The relatively large errors on the fits are likely due to the presence of multiple solute populations present in the gel sample, e.g. as free solute in the centre of the gel pores and a less mobile population associated with the gel fibre surface, rather than a bad fit of the used diffusion model. However, our attempts to fit multiple populations resulted in unstable fits, and thus we cannot prove this hypothesis on the presented data alone.
The gel samples loaded with PCM show a much faster solute diffusion than bulk PCM solution, as indicated by the larger value of γ(q) of the gel samples compared to those for the bulk solution (Fig. 7). Quantitatively, the diffusion coefficients D of PCM are between 30 and 70% larger in the gel than in solution. This behaviour is considerably more pronounced than the increase of solvent diffusion in the unloaded gel,24 for which we found D to increases by up to approximately 14% in the gel. Considering that the solute molecules diffuse approximately half as quickly as the solvent, the massive increase in diffusion coefficient cannot be purely caused by the PCM molecules diffusing with the solvent phase.
The fitting of the jump diffusion model yields a second independent variable in the residence time τ. This variable can be interpreted as the time the diffusing molecules remain static between periods of diffusion (jumps). In the case of IBU diffusion, τ is prolonged in the gel samples, except for the lowest temperature measurement at 270 K. Surprisingly, at 270 K this trend reverses and the residence time in solution is longer than in the gel. However, the error on the fit at this temperature is considerably larger than that for the other fits as the solute diffusion is pushing the limit of resolution of the BATS spectrometer. For PCM the residence time is longer in the bulk solution than in the gel sample at all temperature. Combined with the increased diffusion coefficient D in the gel, it can be concluded that PCM is indeed moving quicker in the gel than in solution. However, the case may not be as trivial as that, as the residence time in solution shows a non-linear behaviour, increasing dramatically at the lower temperature points probed. The fit on the data measured at 270 K shows the strongest deviation from expected values, but similar to IBU it also has the highest error, as a clear indication that the measurement is at the limit of resolution of the spectrometer. However, the trend already starts with the measurement at 280 K without the limitations from the instrument, and thus it is plausible that it continues at lower temperatures as well. A possible explanation for this deviation is that cooling a 5% w/v solution of PCM in 30% ethanol to 270 K is approaching the solubility limit.36 At this point, the solute molecules can change from being a molecular dispersion in the solvent to being constrained in a denser liquid phase, as has been described by the non-classical nucleation theory.37 If this is the case, the solute molecules are not presenting a single population anymore, as individual molecules in solution and those in the denser liquid phase will coexist in the sample, and whilst it is likely that the diffusion coefficients in the two different liquids are significantly different, it is additionally not given that both populations can be described by the jump diffusion model.
Based on the measurements of the same sample at various temperatures, the obtained jump diffusion coefficients D build the basis of an Arrhenius plot (Fig. 9) based on the Arrhenius equation
 | (4) |
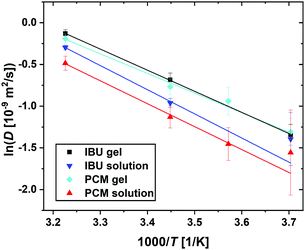 | ||
| Fig. 9 Summary of the jump diffusion coefficients D (eqn (3), symbols) associated with the guest molecule diffusion in an Arrhenius plot for all samples as given in the legend. The lines report linear fits to obtain the Arrhenius activation energies (eqn (4)). | ||
| Sample | E a [kJ mol−1] | ln(A [10−9 m2 s−1]) |
|---|---|---|
| IBU gel | 21.03 ± 0.19 | 8.03 ± 0.08 |
| IBU solvent | 24.07 ± 2.10 | 9.04 ± 0.82 |
| PCM gel | 19.55 ± 1.10 | 7.39 ± 0.44 |
| PCM solvent | 22.85 ± 1.51 | 8.37 ± 0.61 |
From Fig. 9 it is clear that even though a linear fit can be obtained on the collected data, the errors on the data, especially at the lower temperatures and thus closer to the limit of instrument resolution, lead to uncertainty in the fitted parameters. The differences in the obtained values for the activation energy Ea for both guest molecules are insignificant, possibly due to the low number of data points fitted, especially in the case of IBU, this information has to be taken with care. It will be essential to increase the number of temperature points measured to ensure that a linear fit is representing the data, even though this is difficult considering the current practice in neutron beamtime allocation. In this particular case, however, additional data points are essential to elucidate whether the diffusion in the complex samples follows classical Arrhenius behaviour. In other cases, the Arrhenius equation has been shown not to hold; bulk water for example shows a non-linear behaviour that is best described by a power law,38 and water in Portland cement has been described to show non-continuous behaviour that consists of a linear and a super-Arrhenius part.39
4 Conclusions
We have investigated the picosecond tracer diffusion of drug load in a prototypical supramolecular gel and could show that the diffusion behaviour for two solutes differ from that in bulk solution as well as from each other. This effect is independent from the changes in solvent diffusion reported previously. Both solute molecules follow a jump-diffusion model. Ibuprofen sodium shows a slightly increased diffusion coefficient and a marginally reduced residence time in the gel phase compared to the bulk solution. Paracetamol diffuses significantly quicker in the gel than in solution, with increases in diffusion coefficient of up to 70% with a considerably reduced residence time. This behaviour is not related to the increased diffusion of the solvent mixture in the same gel of approximately 14% compared to bulk solvent.34 Surprisingly, the residence time in paracetamol solution at 270 K is enormously increased, which could be interpreted as the impact of supersaturation of the solution and potential spinoidal decomposition into multiple liquid phases. This observation opens up an exciting opportunity to investigate nucleation by variable temperature quasi-elastic neutron spectroscopy, which will be followed up in future studies.It is clear that on the picosecond timescale, diffusion behaviour alters considerably between the gel and the solution phase. This alteration in this study is contrary to the previously reported tracer-diffusion studies using longer timescales, e.g. by using pulse-field gradient NMR spectroscopy. Diffusion on the picosecond timescale will be predominatly be influenced by the gel fibre surface whilst the impact of confinement will be negligible. Quasi-elastic neutron spectroscopy is one of very few methods to gauge this timescale, enabling us to measure gel fibre surface influence only and thus deconvolve its impact from that of confinement. This is arguably the only way to understand, and in future control and exploit, the impact of each factor on the diffusion in supramolecular gels.
In addition, the present study is one of the first scientific applications of the novel BATS spectrometer at the Institut Laue-Langevin. It powerfully shows the ideal suitability of BATS' accessible range and resolution in neutron energy and momentum transfer to observe the self-diffusion of small organic molecules. It is anticipated that further planned improvements on the neutron beam guide will give substantially increased neutron flux at the sample position, further widening the applications of the spectrometer, e.g. to study the temporal evolution of metastable samples. In the case of supramolecular gels, this would allow, e.g., exploration of the effects of ageing over a longer timescale and generate orthogonal kinetic data of its influence on solute diffusion.
Data accessibility
The neutron scattering data are permanently curated by the ILL and available at DOI: http://10.5291/ILL-DATA.9-13-795.40Conflicts of interest
The authors declare no conflicts of interest.Acknowledgements
We would like to thank the Institut Laue-Langevin for the awarded beamtime on IN16B BATS (experiment 9-13-795), and the STFC for funding consumables. We thank Professor J. W. Steed (Durham University, UK) for providing the gelator.References
- F. Pellegrini and D. R. Budman, Cancer Invest., 2005, 23, 264–273 CrossRef CAS PubMed.
- C. Frantz, K. M. Stewart and V. M. Weaver, J. Cell Sci., 2010, 123, 4195–4200 CrossRef CAS PubMed.
- F. Ahmadi, Z. Oveisi, S. M. Samani and Z. Amoozgar, Res. Pharm. Sci., 2015, 10, 1–16 CAS.
- T. R. R. Singh, G. Laverty and R. Donnelly, Hydrogels: Design, Synthesis and Application in Drug Delivery and Regenerative Medicine, CRC Press, 2018 Search PubMed.
- K. K. Sadasivuni, K. Deshmukh, T. Ahipa, A. Muzaffar, M. B. Ahamed, S. K. Pasha and M. A.-A. Al-Maadeed, J. Mater. Sci.: Mater. Electron., 2019, 30, 951–974 CrossRef CAS.
- H. Yu, Y. Chen, H. Wei, J. Gong and W. Xu, Nanotechnology, 2019, 30, 202002 CrossRef CAS PubMed.
- F. Rodrguez-Llansola, J. F. Miravet and B. Escuder, Chem. Commun., 2009, 7303–7305 RSC.
- M. Forsyth, L. Porcarelli, X. Wang, N. Goujon and D. Mecerreyes, Acc. Chem. Res., 2019, 52, 686–694 CrossRef CAS PubMed.
- P.-L. Destruel, N. Zeng, M. Maury, N. Mignet and V. Boudy, Drug Discovery Today, 2017, 22, 638–651 CrossRef CAS PubMed.
- C. K. Thota, N. Yadav and V. S. Chauhan, Sci. Rep., 2016, 6, 1–12 CrossRef PubMed.
- L. A. Estroff and A. D. Hamilton, Chem. Rev., 2004, 104, 1201–1218 CrossRef CAS PubMed.
- M. George and R. G. Weiss, Acc. Chem. Res., 2006, 39, 489–497 CrossRef CAS PubMed.
- M. Ikeda, K. Fukuda, T. Tanida, T. Yoshii and I. Hamachi, Chem. Commun., 2012, 48, 2716–2718 RSC.
- J. A. Foster, K. K. Damodaran, A. Maurin, G. M. Day, H. P. Thompson, G. J. Cameron, J. C. Bernal and J. W. Steed, Chem. Sci., 2017, 8, 78–84 RSC.
- B. O. Okesola and D. K. Smith, Chem. Soc. Rev., 2016, 45, 4226–4251 RSC.
- J. L. Andrews, E. Pearson, D. S. Yufit, J. W. Steed and K. Edkins, Cryst. Growth Des., 2018, 18, 7690–7700 CrossRef CAS.
- S. Iqbal, F. Rodrguez-LLansola, B. Escuder, J. F. Miravet, I. Verbruggen and R. Willem, Soft Matter, 2010, 6, 1875–1878 RSC.
- S. M. Ramalhete, K. P. Nartowski, N. Sarathchandra, J. S. Foster, A. N. Round, J. Angulo, G. O. Lloyd and Y. Z. Khimyak, Chem. – Eur. J., 2017, 23, 8014–8024 CrossRef CAS PubMed.
- M. Wallace, J. A. Iggo and D. J. Adams, Soft Matter, 2015, 11, 7739–7747 RSC.
- A. R. Hirst, I. A. Coates, T. R. Boucheteau, J. F. Miravet, B. Escuder, V. Castelletto, I. W. Hamley and D. K. Smith, J. Am. Chem. Soc., 2008, 130, 9113–9121 CrossRef CAS PubMed.
- M. Wallace, D. J. Adams and J. A. Iggo, Soft Matter, 2013, 9, 5483–5491 RSC.
- M. Wallace, J. A. Iggo and D. J. Adams, Soft Matter, 2017, 13, 1716–1727 RSC.
- B. Escuder, M. LLusar and J. F. Miravet, J. Org. Chem., 2006, 71, 7747–7752 CrossRef CAS PubMed.
- T. Seydel, R. M. Edkins, C. D. Jones, J. A. Foster, R. Bewley, J. A. Aguilar and K. Edkins, Chem. Commun., 2018, 54, 6340–6343 RSC.
- M. Appel, B. Frick and A. Magerl, Sci. Rep., 2018, 8, 1–8 CrossRef CAS PubMed.
- M. Appel, B. Frick and A. Magerl, Physica B, 2019, 562, 6–8 CrossRef CAS.
- L. van Eijck, L. Gérard, B. Frick, T. Seydel and H. Schober, Nucl. Instrum. Methods Phys. Res., Sect. A, 2012, 672, 64–68 CrossRef CAS.
- C. Beck, M. Appel, M. Grimaldo, F. Roosen-Runge, F. Zhang, B. Frick, F. Schreiber and T. Seydel, Physica B, 2019, 562, 31–35 CrossRef CAS.
- B. Frick, E. Mamontov, L. van Eijck and T. Seydel, Z. Phys. Chem., 2010, 224, 33–60 CrossRef CAS.
- G. O. Lloyd, M.-O. M. Piepenbrock, J. A. Foster, N. Clarke and J. W. Steed, Soft Matter, 2012, 8, 204–216 RSC.
- O. Arnold, J. Bilheux, J. Borreguero, A. Buts, S. Campbell, L. Chapon, M. Doucet, N. Draper, R. F. Leal, M. Gigg, V. Lynch, A. Markvardsen, D. Mikkelson, R. Mikkelson, R. Miller, K. Palmen, P. Parker, G. Passos, T. Perring, P. Peterson, S. Ren, M. Reuter, A. Savici, J. Taylor, R. Taylor, R. Tolchenov, W. Zhou and J. Zikovsky, Nucl. Instrum. Methods Phys. Res., Sect. A, 2014, 764, 156–166 CrossRef CAS.
- P. De Gennes, Physica, 1959, 25, 825–839 CrossRef CAS.
- J. Qvist, H. Schober and B. Halle, J. Chem. Phys., 2011, 134, 144508 CrossRef PubMed.
- T. Seydel, R. M. Edkins and K. Edkins, Phys. Chem. Chem. Phys., 2019, 21, 9547–9552 RSC.
- K. Singwi and A. Sjölander, Phys. Rev., 1960, 119, 863–871 CrossRef CAS.
- N. A. Mitchell, C. T. Ó'Ciardhá and P. J. Frawley, J. Cryst. Grow., 2011, 328, 39–49 CrossRef CAS.
- D. Gebauer and H. Cölfen, Nano Today, 2011, 6, 564–584 CrossRef CAS.
- M. Holz, S. R. Heil and A. Sacco, Phys. Chem. Chem. Phys., 2000, 2, 4740–4742 RSC.
- Y. Zhang, M. Lagi, F. Ridi, E. Fratini, P. Baglioni, E. Mamontov and S.-H. Chen, J. Phys.: Condens. Matter, 2008, 20, 502101 CrossRef.
- K. Edkins, M. Appel, R. Edkins, T. Seydel, Institut Laue-Langevin (ILL), 2019 DOI:10.5291/ILL-DATA.9-13-795.
| This journal is © the Owner Societies 2020 |

