Engineering CuOx–ZrO2–CeO2 nanocatalysts with abundant surface Cu species and oxygen vacancies toward high catalytic performance in CO oxidation and 4-nitrophenol reduction†
Baolin
Liu
a,
Yizhao
Li
 *ab,
Shaojun
Qing
c,
Kun
Wang
a,
Jing
Xie
a and
Yali
Cao
 *a
*a
aKey Laboratory of Energy Materials Chemistry, Ministry of Education, Key Laboratory of Advanced Functional Materials, Autonomous Region, Institute of Applied Chemistry, Xinjiang University, Urumqi 830046, Xinjiang, China
bCollege of Chemistry & Chemical Engineering, Xinjiang University, Urumqi 830046, Xinjiang, China
cInstitute of Coal Chemistry, Chinese Academy of Sciences, Taiyuan 030001, Shanxi, China
First published on 18th May 2020
Abstract
Highly dispersed surface Cu species and oxygen vacancies are important for CuOx–CeO2 catalysts in many reactions, but it is difficult to increase the concentrations of highly dispersed Cu species and oxygen vacancies simultaneously by only adding a Cu component. Herein, CuOx–ZrO2–CeO2 (CZC) nanocatalysts with different ratios of Cu/Zr have been effectively produced by a simple solvent-free synthetic strategy. The effect of Zr doping on the structure and reactivity of the CuOx–CeO2 catalysts has been investigated with the help of carbon monoxide (CO) oxidation and 4-nitrophenol (4-NP) reduction as model reactions. It is revealed that the introduction of Zr relieved the agglomeration of surface Cu species, produced more oxygen vacancies in the interior and Cu+ species on the surface of the catalyst, and increased the reducibility of CuOx–CeO2. The CZC catalysts show remarkably enhanced catalytic activity due to the abundant surface active sites and the improved redox properties provided by the suitable doping of Zr into CuOx–CeO2. This work not only offers a practicable way to reconstruct the distribution of active metals on the metal oxide support but also provides a high-efficiency strategy to prepare oxide catalysts with excellent catalytic performance.
Introduction
Ceria (CeO2) has been potentially used in some fields due to its excellent charge transfer properties and thermal stability. In particular, benefiting from the oxygen vacancy defects and high oxygen storage capacity formed by the Ce4+/Ce3+ redox couple, CeO2 has become one of the important catalysts for catalytic reactions.1–3 Researchers in previous studies have found that the oxygen vacancies play a crucial role in reactant activation.2,4,5 The Ce3+ sites could promote the generation of oxygen vacancies on the surface, which could activate and transfer oxygen, thus enhancing the catalytic properties.6,7 Therefore, it is crucial to create more oxygen vacancies to improve the catalytic performance of ceria-based catalysts.The incorporation of Cu species is an efficient method to improve the catalytic performance of CeO2 due to the creation of active Ce3+ and oxygen vacancies.8,9 It has been recognized that CuO–CeO2 binary catalysts possess excellent catalytic performance in some catalytic reactions according to previous reports.2 Wang and coauthors10 synthesized CuO–CeO2 catalysts by the colloidal crystal template route, which exhibit excellent soot combustion efficiencies. Maria Lykaki11 also researched the catalytic performance for CO oxidation of Cu/CeO2 catalysts synthesized by the hydrothermal method which showed good catalytic activity. Maria Ronda-Lloret12 developed a pyrolytic route to prepare CuOx/CeO2 catalysts using metal–organic frameworks as precursors, which showed excellent catalytic properties for the reverse water-gas shift reaction. In these studies, the catalytic performances of CuO–CeO2 are closely related to the concentration of oxygen vacancies. Simultaneously, the dispersion of Cu species on the CeO2 surface has the same significant impact on the catalytic properties. It was found that the oxygen vacancies on the CeO2 surface play a vital role in oxygen activation and transfer,13–15 while the highly dispersed Cu species can also act as the active centers for catalytic reactions.4,16
However, the Cu species on the CeO2 surface would tend to agglomerate under the conditions of overload or high-temperature calcination, and Cu+ is easily oxidized to Cu2+, which is adverse for the adsorption and reaction of gas molecules in the catalytic process.1,16–18 Therefore, it is a meaningful study to improve the dispersion of Cu species and increase the number of active oxygen species in the CuOx–CeO2 catalyst. Recently, a ZrOx–CeO2 binary compound has been employed as a catalyst for CO oxidation, and it was found that the addition of Zr species can increase the oxygen vacancies and the redox properties of CeO2.19,20 It is very possible that the introduction of the third component ZrOx may be an effective way to improve the catalytic performance of the binary oxide CuOx–CeO2. However, the suitable doping of Zr species into the CuOx–CeO2 system is still a challenging research task, thus give full play to the synergistic effect of the three components and show excellent catalytic performance.
In order to improve the dispersion of Cu species and increase the oxygen vacancies on the CeO2 surface, CuOx–ZrO2–CeO2 (CZC) nanocatalysts with different ratios of Cu/Zr were facilely and efficiently fabricated by a simple solid-state chemical strategy in our study. After the adjustment of the Cu/Zr ratio, abundant active sites including highly dispersed Cu species and oxygen vacancies were eventually realized on the surface of the CZC catalysts. CO oxidation and 4-NP reduction were selected as probe reactions to study the catalytic performance of CZC systematically. The effects of the increased oxygen vacancies and the improved dispersity of the Cu component on the catalytic activity were investigated.
Results and discussion
As shown in Scheme 1 and Fig. S1a,† the CZC nanocatalysts can be acquired by straightforward grinding using a metal salt and KOH. This processing allows for the mass production of such samples without the need for organic solvents. The X-ray powder diffraction (XRD) patterns, average crystallite sizes, and lattice parameter (LP) values of the different samples are presented in Fig. 1a and Table 1, respectively. For all the as-prepared samples, the diffraction peaks in the range of 20–80° well correspond to the cubic fluorite phase of ceria (JCPDS No. 34-0394). The diffraction peaks derived from the ZrO2 and CuOx components of all the samples are not observed in the XRD profiles, and the shift of diffraction peaks for the CZC samples are less remarkable compared to that for the pure CeO2 standard reference (Fig. 1b), indicating the high dispersion of ZrO2 and CuOx components on the surface of CeO2 or a very small particle size.21–23 In order to further investigate the structure of the catalysts, the powder XRD patterns of the samples with different ZrO2 doping contents were obtained. As shown in Fig. S1b,† the diffraction peaks derived from ZrO2 for all the samples are not observed in the XRD profiles, and the diffraction peaks shift to lower angles for the CZC samples compared to the pure CeO2 standard reference, indicating the formation of a CeO2–ZrO2 solid solution.24 However, there isn't an obvious shift for the sample CZC0-5 with only Cu loading, which demonstrates that the CuOx components are highly dispersed on the surface of CeO2. Meanwhile, the crystalline particle sizes of the samples calculated using the Scherrer equation applied for the (111) plane of CeO2 (Table 1) show a decrease with the addition of Zr species.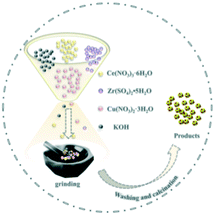 | ||
| Scheme 1 The synthetic schematic diagram of the CZC catalyst obtained by a solid-state chemical approach. | ||
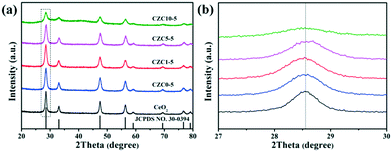 | ||
| Fig. 1 The powder XRD patterns of the different samples: (a) complete profiles; (b) partially enlarged profiles. | ||
| Sample | D (nm) | LPb (Å) | T 50 (°C) | T 100 (°C) |
|---|---|---|---|---|
| a Calculated from the CeO2 (111) lattice plane using the Scherrer equation. b Calculated using the MDI Jade software. | ||||
| CeO2 | 21.6 (1) | 5.413 (7) | 250 | 280 |
| CZC0-5 | 13.9 (5) | 5.415 (1) | 103 | 160 |
| CZC1-5 | 13.6 (5) | 5.417 (3) | 93 | 120 |
| CZC5-5 | 12.8 (4) | 5.404 (9) | 98 | 130 |
| CZC10-5 | 11.3 (4) | 5.417 (6) | 95 | 140 |
From Table 1, the lattice constants of CZC seem to exhibit no obvious trend with the increase of Zr. This may be caused by two factors, the doping effect, since Zr(IV) is smaller than Ce(IV), and the size effect, due to the lower grain size of the sample with more Zr to enlarge the lattice. In addition, the thermal stability of the samples was also tested (Fig. S1c†). For the CZC0-5 sample, the diffraction peaks became sharper and stronger after thermal treatment at 800 °C. However, for the CZC samples with Zr species, these changes are inconspicuous, indicating a good thermal stability after the incorporation of Zr into the CuOx–CeO2 system. It is beneficial to the high dispersion of Cu species in CZC1-5 when going through the elevated temperature process, which very likely enhances the catalytic activity of the CZC catalysts.
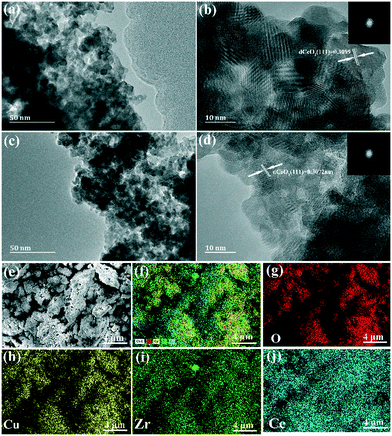
As shown in Fig. 2, the microstructures of CZC0-5 and CZC1-5 samples were further investigated by transmission electron microscopy (TEM). For CZC0-5 and CZC1-5 catalysts, nanoparticles with a diameter of about 11–13 nm can be observed, which is consistent with the value acquired from XRD measurements. The HRTEM images and corresponding fast-Fourier-transform patterns (Fig. 2b and d) of the samples show interplanar spacings of 0.3089 nm and 0.3072 nm, which can be indexed to the (111) plane of CeO2. The lattice fringes related to ZrO2 and CuOx cannot be observed in the above images, indicating that they have been highly dispersed over CeO2.16 The elemental composition of the series of CZC samples was also analyzed by EDS measurement, and the results are summarized in Table S1,† which clearly demonstrated that the catalysts are composed of Ce, Cu, Zr and O elements. The obtained Zr/Ce and Cu/Ce ratios are intensely close to the expected values for each sample. Element mapping analyses (Fig. 2e–h) reveal that Zr and Cu elements are well distributed in CeO2 nanoparticles, which would be favorable for the catalytic performance. In addition, the contents of Ce, Cu, and Zr elements were analyzed by ICP (in Table S2†). From Table S2,† the real contents of Zr and Cu (molar ratio) are less than the theoretical contents (molar ratio) in all the samples. It can be attributed to the loss of Cu during the synthesis of the CZC samples.
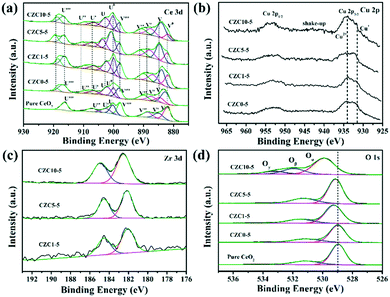
XPS was performed to identify the chemical state and elemental composition on the surface of the different samples. The Ce 3d XPS spectra of the pure CeO2 sample is shown in Fig. 3a, which can be deconvoluted to two types of cerium oxides, Ce3+ and Ce4+, respectively. The V (883.3 eV) and U (902.0 eV) peaks correspond to the 3d5/2 and 3d3/2 contributions derived from the spin–orbit coupling, respectively.25,26 As reported in several relevant studies, six peaks labeled as V, V′′, V′′′, U, U′′ and U′′′ are the evidence of the presence of Ce4+,25–27 while other four peaks denoted as V0, V′ and U0, U′ are assigned to the final Ce3+ states which can be used as an indicator of the existence of oxygen vacancies.14,25,28 The increase of the intensity of V0 and U0 peaks indicates the increase of Ce3+ content on the surface of CeO2. The surface composition has been also confirmed by XPS quantitative analysis shown in Table 2. The amount of Ce3+ is calculated from the area ratio of the Ce3+ species to the total cerium species. The amount of Ce3+ is estimated to be 41% for the CZC5-5 sample, which is higher than those of the other samples (in the order CZC5-5 > CZC1-5 > CZC10-5 > CZC0-5 > CeO2), reflecting the high oxygen vacancy concentration in this CZC sample.
| Sample | Ce3+a (%) | I sat/Impb | Oαc (%) | Oβc (%) | Oγc (%) |
|---|---|---|---|---|---|
| a Ce3+ (%) was calculated from the area ratio of the Ce3+ species to the total cerium species. b I sat/Imp was calculated from the ratio of the intensity of the shake-up satellite peak to the intensity of the Cu 2p3/2 peak. c Oα, lattice oxygen; Oβ, surface adsorbed oxygen; Oγ, chemisorbed water and/or carbonates. | |||||
| CeO2 | 19 | — | 76 | 24 | — |
| CZC0-5 | 22 | 0.37 | 76 | 24 | — |
| CZC1-5 | 38 | 0.22 | 74 | 26 | — |
| CZC5-5 | 41 | 0.23 | 73 | 27 | — |
| CZC10-5 | 33 | 0.36 | 66 | 23 | 11 |
Cu 2p XPS spectra were further studied as shown in Fig. 3b. The peak at 933–935 eV combined with the appearance of a shake-up peak is characteristic of Cu 2p3/2, and another peak at 952–954 eV is characteristic of Cu 2p1/2.29,30 The peak at 932.0 eV can be observed after the Zr species was incorporated, which is attributed to Cu+ and Cu° due to their essentially identical binding energy.31 Here, the peak at 932.0 eV is assigned to Cu+ because of the redox reaction of metal ions originating from the strong metal–support interaction (Cu2+ + Ce3+ → Cu+ + Ce4+).31,32 In addition, the chemical state of Cu species was further analyzed by calculating the intensity ratio of the satellite peak to the main peak (labeled as Isat/Imp). For only CuO, this ratio value should be 0.55.18,33 In the case of CZC0-5, CZC1-5, CZC5-5, and CZC10-5 samples, the Isat/Imp values are lower than 0.55 (Table 2), indicating the existence of Cu+ species.31,34 The Isat/Imp values further decrease when the Zr species is incorporated, suggesting that the Zr species contributes to the enrichment of Cu+ species on the surfaces of the samples. Fig. 3c shows the XPS spectra of Zr 3d, and the two peaks at approximately 182.8 eV and 185.3 eV are consistent with the Zr 3d5/2 and 3d3/2 spin–orbit states, respectively,35 which indicates that the Zr species mainly exists in the Zr4+ state.
The O 1s peaks are shown in Fig. 3d, the peak at 529.0 eV is ascribed to the lattice oxygen of metal oxides (denoted as Oα),36,37 another peak at 531.0 eV corresponds to surface-adsorbed oxygen (denoted as Oβ),38 and the peak at 533.5 eV is attributed to chemisorbed water and/or carbonates (Oγ), respectively.39,40 The binding energy of the most intense peak (Oα) in pure ceria shifts to higher binding energy with the incorporation of Cu and Zr species, indicating a change in structural arrangement and/or electronic structure alteration as a result of the synergetic interaction among components.
CO oxidation is usually used as a model reaction to study the structure–activity relationship of catalysts. Fig. 4 shows the performance of the CZC catalysts with various contents of Zr and Cu toward CO oxidation. The temperatures T50 (50% of CO conversion) and T100 (100% of CO conversion) are summarized in Fig. 4b and Table 1. The CZC0-5 sample accomplished 100% CO conversion at 160 °C, while the pure CeO2 sample exhibited the lowest catalytic activity for CO oxidation (Fig. S2†), which could completely catalyze CO oxidation to CO2 at 300 °C. This result indicates that the incorporation of Cu species drastically promotes the catalytic activity for CO oxidation. However, the samples with higher Cu loading show an obvious decrease in the conversion of CO (Fig. S3a†), which may be ascribed to the agglomeration of CuOx species on the CeO2 surface.41 The two different profiles in “light off” curves for CO oxidation can be observed in Fig. 4a. The CO conversion show “S” shaped behaviors with an increase of reaction temperature for the samples without the incorporation of ZrO2, showing relatively poor catalytic activity. This phenomenon can be attributed to the agglomeration of CuOx species on the CeO2 surface,7 which is adverse for the adsorption and reaction of gas molecules in the catalytic process. After ZrO2 doping, the CO conversion shows an exponential increase with reaction temperature. Among all the samples, the CZC1-5 sample displays the best catalytic activity (Fig. 4), which achieved 100% CO conversion at 120 °C. The catalytic performance declines with the further increase of Zr concentration, which follows the order: CZC1-5 > CZC5-5 > CZC10-5 > CZC0-5 > CeO2. The increase of lattice disorder with the incorporation of Zr species improves the oxygen mobility of the samples and enhances their catalytic activity eventually. However, the CO oxidation activity decreases after exceeding the optimal doping quantity of the Zr species, which might be due to the coverage of the active sites by the excess Zr species. Since CeO2 and CuOx are the active components for CO oxidation, the samples with higher ZrO2 doping content indicate that ZrO2 is enriched on the surface of the composites. This result is consistent with that of EDS and previous studies.19,24
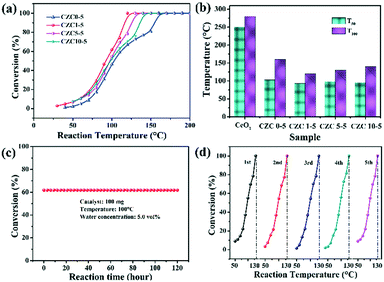 | ||
| Fig. 4 (a and b) The CO conversion performance over the series of CZC catalysts; (c) the stability test of the CZC1-5 sample for CO oxidation; (d) the catalytic cycling curves of the CZC1-5 sample. | ||
The influence of H2O on the activity of the CZC1-5 sample was also tested with 5% vol H2O in a gas stream. As shown in Fig. S3b,† the temperature for full CO conversion shifts to a higher temperature (140 °C) compared with that in the dry gas mixture (120 °C), indicating the partial blockage of the active sites by H2O molecules.42 The stability of the CZC1-5 catalyst, as another index of catalytic performance, was measured at 100 °C under 5% H2O. As can be seen from Fig. 4c, the CZC1-5 catalyst did not exhibit deactivation during the 120 h testing and maintained its activity over 5 runs (Fig. 4d), which implies the excellent stability of the CZC1-5 sample for the CO oxidation reaction. The XRD patterns and Raman spectra of the fresh catalyst and the used one after the long-term stability test under moisture conditions for 120 h are shown in Fig. S4a and b.† The diffraction peaks and Raman peaks have no obvious change for the used catalyst, indicating the high structural stability of the sample during the durability test.
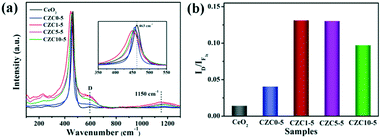
The structural properties of the samples were analyzed by Raman spectroscopy. For the pure CeO2 sample, the evident peak centered at 463 cm−1 corresponds to the triply degenerate F2g active mode in the cubic fluorite structured ceria.13,24,43–45 The broad peaks present at about 600 cm−1 (denoted by D) and 1150 cm−1 are assigned to the defect-induced (D) mode and second-order longitudinal optical (2LO) mode in the ceria lattice, which can be linked to the formation of oxygen vacancies.18,46,47 As shown in Fig. 5, we observed the red shift and broadening of F2g peaks for the CZC1-5 sample compared to pure CeO2 and CZC0-5 samples (the inset of Fig. 5a), indicating the decrease of ceria crystallite size and the increase of oxygen vacancy defects.24,25 These results are in accordance with the conclusion derived from XRD measurement. Generally, the ratio of the peak intensity of 600 to 463 cm−1 (denoted as the ID/IF2g value) can be used for expressing the relative content of oxygen vacancies.11,24 The ID/IF2g values for all the samples were calculated from the Raman spectra (Fig. 5b), and the content of oxygen vacancies is in well accordance with the catalytic performance. As noted above, more oxygen vacancies are created by the introduction of a small amount of ZrO2. The structure distortion of the as-prepared samples may be ascribed to a synergistic interaction among Zr, Cu and CeO2, which is beneficial to the improvement of the ability to activate and transfer oxygen.
In addition, the N2 adsorption–desorption isotherms of the samples were obtained. As shown in Fig. S5,† the typical type IV isotherms and pore size distribution curves (Fig. S5b†) in the range of 2–50 nm are associated with the features of mesoporous materials. The specific surface area, pore volume, and pore size of the samples are shown in Table S3,† respectively. From Table S3,† the BET specific surface area decreases in the order CZC0-5 > CeO2 > CZC1-5 > CZC5-5 > CZC10-5, differing from the sequence of catalytic activity, which indicates that the BET specific surface area is not the dominating factor that influences the catalytic activity.
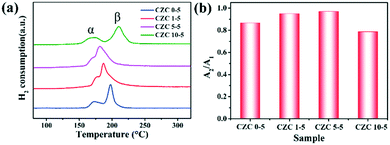
Fig. 6 shows the H2-TPR profiles of the samples. Two reduction peaks in the H2-TPR profile appear approximately at 550 °C and 800 °C (Fig. S6†), corresponding to the reduction of ceria on the surface and bulk (Ce4+ → Ce3+), respectively.24,48 In general, the H2 consumption peak of the CuO sample is centered at around 300 °C (Fig. S7†). Here, two reduction peaks (defined as α and β) assigned to two different types of Cu species depending on their interaction degree with the CeO2 support can be observed in the H2-TPR profiles.46,49,50 The reduction peak at low temperature (150–170 °C, defined as α) originated from the reduction of highly dispersed Cu species which strongly interacted with the CeO2 support, and the other reduction peak at high temperature (180–220 °C, labeled as β) was assigned to the reduction of larger CuOx particles weakly interacting with the CeO2 support, respectively.4 Moderate ZrO2 doping shows better reducibility at low temperature, indicating that the incorporation of Zr species could promote the dispersion of CuOx on the CeO2 support and enhance the metal–support interaction. However, worse reducibility is shown in the sample with higher ZrO2 doping content (CZC10-5 sample), which is consistent with the catalytic activity. Besides, N2O chemical adsorption was implemented to detect the changes in dispersion of CuOx on the CeO2 surface. The value of A2/A1 (the total hydrogen uptake for different samples after and before N2O oxidation) is used to indicate the dispersion. It can be observed from Fig. 6b that the value of A2/A1 increases with the incorporation of moderate amounts of ZrO2 (CZC1-5 and CZC5-5 samples). The hydrogen consumption of the CZC samples with fixed Cu loading (Table S5†) changes with the variation of ZrO2 loading according to the quantitative analysis of H2-TPR experiments, which is consistent with the order of dispersion of CuOx on the CeO2 surface. However, it decreases with a further increase in the ZrO2 loading (CZC10-5 sample). This result implies that the appropriate introduction of ZrO2 facilitates the dispersion of CuOx on the surface of CeO2, decreases the agglomeration of Cu species, and improves the reducibility of copper–cerium species, which could create more adsorption sites for CO oxidation.
To elucidate the effect of the oxygen vacancies and highly dispersed surface Cu species on the catalytic activity more clearly, Rw, the CO conversion rate at 110 °C normalized by the catalyst weight, has been calculated and listed in Table S4,† which follows the sequence CZC1-5 > CZC5-5 > CZC10-5 > CZC0-5, strongly confirming that the catalytic activity of CuOx–CeO2 could be largely changed by ZrO2 doping. In addition, the relationship among the oxygen vacancies (ID/IF2g), highly dispersed surface Cu+ species (Isat/Imp), and catalytic activity (Rw) of the catalysts is shown in Fig. 7. Obviously, the Rw increases with the variation of the amount of oxygen vacancies and the highly dispersed Cu+ species on the CeO2 surface, elucidating that the oxygen vacancies and Cu+ species determine the catalytic activity of the catalysts. The best catalyst (CZC1-5) with the highest Rw possesses the maximum oxygen vacancies and surface Cu+ species.
 | ||
| Fig. 7 Catalytic activity versus oxygen vacancies and surface Cu+ species of the catalysts with different loadings of Zr species. (a) Rwversus ID/IF2g; (b) Rwversus Isat/Imp. | ||
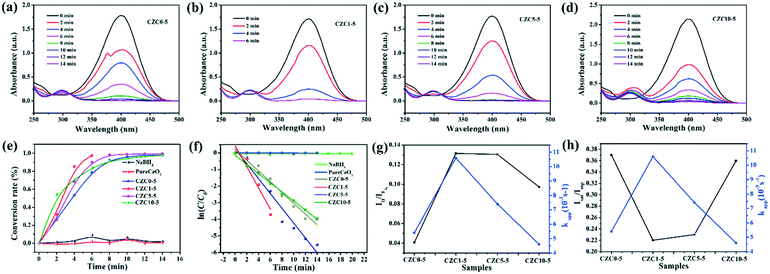
In addition, the reduction of 4-NP was also chosen as a model reaction to further evaluate the catalytic ability of the as-prepared samples. Transforming toxic 4-NP into less toxic 4-aminophenol (4-AP) with catalysts is regarded as an effective environmental remediation tool. The catalytic process of reduction of 4-NP into 4-AP was monitored by UV-vis spectroscopy. Fig. 8a–d show the UV-vis absorption spectra of 4-NP with the prepared catalysts. The change of absorbance at λ = 400 nm corresponds to the degradation of 4-NP, while the development of a new band at λ = 300 nm is observed according to the formation of 4-AP with time.51 As shown in Fig. S8,† it's hard to transform 4-NP into 4-AP without a catalyst or solely with CeO2. The catalytic activity is promoted drastically by the incorporation of Cu and Zr species. Clearly, the catalytic activities follow the order: CZC1-5 > CZC5-5 > CZC10-5 > CZC0-5 > CeO2, which matches well with the activity for CO oxidation of the catalysts. As shown in Fig. 8e, the conversion rates for the reduction of 4-NP on these catalysts are compared. It can be noticed that 98% conversion has been completed at 6 min when the CZC1-5 sample was applied (0.04 mg mL−1 catalyst, 0.1 mM 4-NP, and 2 mM NaBH4), while 90%, 83%, 79% and 1.7% conversion for CZC5-5, CZC10-5, CZC0-5 and CeO2 were obtained at the same time, respectively. The apparent reaction rate (kapp) of the samples was calculated at room temperature (Fig. 8f).
For the CZC1-5 sample, the value reaches 10.6 × 10⁻³ s−1, which is much higher than those of CZC5-5 (7.4 × 10⁻³ s−1), CZC10-5 (4.6 × 10⁻³ s−1), CZC0-5 (5.4 × 10⁻³ s−1) and CeO2 (0.026 × 10⁻³ s−1). The synergistic effect among components is responsible for the enhancement of the catalytic performance. The relationship among the oxygen vacancies (ID/IF2g), surface Cu species (Isat/Imp), and catalytic activity (kapp) of the catalysts is displayed in Fig. 8g and h. Obviously, the kapp of the catalysts increases with the variation of the number of oxygen vacancies and the highly dispersed Cu+ species on the CeO2 surface. The catalyst (CZC1-5) with the maximum oxygen vacancies and surface Cu+ species possesses the highest kapp, which clarifies that the oxygen vacancies and the highly dispersed Cu+ determine the catalytic activity of the catalysts.
Based on the above results, the effects of ZrO2-doping on the structure and catalytic performance can be clarified. The reaction pathway is shown in Fig. 9 for CO oxidation and 4-NP reduction models. The catalytic performance of the samples with Zr species is improved compared to that of the CZC0-5 catalyst, confirming the significant role of Zr species incorporated in the samples. The introduction of Zr species facilitates the formation of a host of Ce3+ species, decreases the agglomeration of Cu species, and improves the reducibility of copper–cerium species, which could create more adsorption sites. As confirmed by Raman, XPS, H2-TPR, and N2O titration, a large number of oxygen vacancies and highly dispersed Cu+ species existed on the surface of the CZC samples. The presence of more active oxygen vacancies and Cu+ sites for chemisorbing gas molecules is responsible for the better catalytic performance.
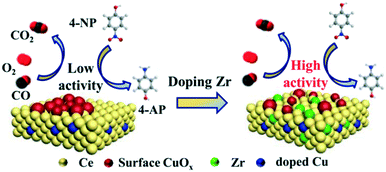 | ||
| Fig. 9 Reaction mechanisms of CuOx–CeO2 and Zr-doped CuOx–CeO2 catalysts toward CO oxidation and 4-NP reduction. | ||
In CO oxidation, the catalytic activity is closely related to oxygen vacancies and highly dispersed Cu+ species existing on the surface of the CZC samples. CeO2 with abundant oxygen vacancies could activate and transfer oxygen, which preferentially takes place at the interface between CuO and CeO2. The activated oxygen further reacts with the CO molecules adsorbed on the interface Cu+ sites. Therefore, the strong CO adsorption of highly dispersed Cu+ together with the efficient oxygen activation of CeO2 should be responsible for the enhanced catalytic activity. However, a higher ZrO2 doping content in the samples results in worse reducibility, and the dispersion of CuOx on the surface of CeO2 is reduced, which are proved by H2-TPR and N2O titration. Therefore, the catalytic activity decreases with the amount of Zr species.
In the 4-NP reduction model, 4-NP and NaBH4 are firstly adsorbed on the CZC catalyst surface.52–54 BH4− reacts with the highly dispersed Cu species to form a hydride complex.53 Subsequently, 4-NP accepts hydrogen ions from the Cu-based hydride complex, converts to 4-AP, and desorbs from the catalyst surface.55 The enhanced catalytic activity of the CZC catalyst might be attributed to the highly dispersed Cu species due to the introduction of Zr species, which improves the highly-efficient utilization of Cu species. Engineering the CZC catalysts with abundant surface Cu active sites and oxygen vacancies was eventually realized by doping a moderate amount of Zr species into the CuOx–CeO2 system, which exhibited excellent catalytic performance.
Conclusions
To regulate the dispersion of Cu species and the concentration of oxygen vacancies in CuOx–CeO2 catalysts, ternary oxide CZC catalysts with different ratios of Cu, Zr and Ce were fabricated by a facile solid-state chemical approach. The CO oxidation and 4-NP reduction reactions have been selected to probe their catalytic activity. It has been revealed that the addition of ZrO2 could produce a large number of Ce3+ cations and improve the thermal stability of CuOx–CeO2 catalysts. The Zr species could promote the dispersion of CuOx on the CeO2 support and enhance the interaction between the metal and support, which induced the generation of a large amount of oxygen vacancies and highly dispersed Cu+ species due to the synergistic effect among components. In consequence, the CZC nanocatalysts showed enhanced catalytic activity for CO oxidation and 4-NP reduction. It provides a feasible way to reconstruct the distribution of active metals on the metal oxide support. The simple solid-state chemical strategy reported in this work may show great potential for the preparation of other catalysts with excellent catalytic performance for the removal of contaminants.Experimental
Materials
Ce(NO3)3·6H2O (AR), Zr(SO4)2·5H2O (AR), Cu(NO3)2·3H2O (AR), KOH (AR), NaBH4 (AR), and 4-NP (AR) were purchased from Aladdin Ltd. (Shanghai, China), respectively.Preparation of CZC catalysts
As shown in Scheme 1, the CuOx–ZrO2–CeO2 catalysts with different loadings of ZrO2 and CuOx were fabricated through a simple solid-state chemical approach. Typically, 5 mmol of Ce(NO3)3·6H2O, 0.25 mmol of Cu(NO3)2·3H2O and various amounts of Zr(SO4)2·5H2O (0 mmol, 0.05 mmol, 0.25 mmol, 0.5 mmol) were sufficiently ground to powder in an agate mortar, and then 22 mmol of KOH was added into the agate mortar. The mixture was continuously ground for about 30 min in the surrounding environment. The obtained product was washed and filtered with distilled water to eliminate impurities. Finally, these samples were dried for about 10 h at ambient temperature, and then calcined at 600 °C for 2 h (2 °C min−1) in a muffle furnace. The obtained samples were labeled as CZC X–Y, where C, Z, and C represent CuOx, ZrO2 and CeO2, respectively; X and Y represent the different Zr/Ce and Cu/Ce ratios (e.g. Zr/Ce = 0.01, X = 1; Cu/Ce = 0.05, Y = 5). Therefore, the obtained oxides were labeled as CZC0-5, CZC1-5, CZC5-5, and CZC10-5, respectively. As a comparison, CZC1-10 and CZC1-15 were prepared. In addition, samples calcined at 800 °C were also acquired, and the samples were denoted as CZC0-5-8 and CZC1-5-8.Characterization of catalysts
Detailed characterization and testing processes are demonstrated in the ESI,† such as X-ray powder diffraction (XRD), high resolution transmission electron microscopy (HRTEM), energy dispersive spectrometry (EDS), X-ray photoelectron spectroscopy (XPS), Raman spectroscopy (Raman), N2 adsorption–desorption isotherm measurement, and H2 temperature-programmed reduction (H2-TPR).Determination of the redox properties of CZC catalysts before/after N2O oxidation
Detailed testing processes of the redox properties of the CZC catalysts before/after N2O oxidation are presented in the ESI.†Test of CO catalytic oxidation and 4-NP reduction
Detailed testing processes of CO catalytic oxidation and 4-NP reduction are presented in the ESI.†Conflicts of interest
There are no conflicts to declare.Acknowledgements
This work was financially supported by the Natural Science Key Project of the Department of Education of Xinjiang Uygur Autonomous Region (XJEDU2018I004), the National Natural Science Foundation of China (No. 21766036), the Natural Science Foundation of Xinjiang Province (No. 2019D04005 and 2017D01C076), the Tianchi Doctoral Project and the 111 Project (No. D18022).Notes and references
- Á. Reyes-Carmona, A. Arango-Díaz, E. Moretti, A. Talon, L. Storaro, M. Lenarda, A. Jiménez-López and E. Rodríguez-Castellón, J. Power Sources, 2011, 196, 4382–4387 Search PubMed.
- J. A. Rodriguez, D. C. Grinter, Z. Liu, R. M. Palomino and S. D. Senanayake, Chem. Soc. Rev., 2017, 46, 1824–1841 RSC.
- T. Montini, M. Melchionna, M. Monai and P. Fornasiero, Chem. Rev., 2016, 116, 5987–6041 CrossRef CAS PubMed.
- X. M. Zhang, P. F. Tian, W. F. Tu, Z. Z. Zhang, J. Xu and Y. F. Han, ACS Catal., 2018, 8, 5261–5275 CrossRef CAS.
- W. Gao, Z. Y. Zhang, J. Li, Y. Y. Ma and Y. Q. Qu, Nanoscale, 2015, 7, 11686–11691 RSC.
- J. Paier, C. Penschke and J. Sauer, Chem. Rev., 2013, 113, 3949–3985 CrossRef CAS PubMed.
- B. L. Liu, Y. Z. Li, Y. L. Cao, L. Wang, S. J. Qing, K. Wang and D. Z. Jia, Eur. J. Inorg. Chem., 2019, 2019, 1714–1723 Search PubMed.
- J. L. Shi, Chem. Rev., 2012, 113, 2139–2181 CrossRef PubMed.
- X. Yu, J. F. Wu, A. A. Zhang, L. Xue, Q. Wang, X. P. Tian, S. Y. Shan, C. J. Zhong and S. H. Zeng, CrystEngComm, 2019, 21, 3619–3626 RSC.
- J. G. Wang, L. Cheng, W. An, J. L. Xu and Y. Men, Catal. Sci. Technol., 2016, 6, 7342–7350 RSC.
- M. Lykaki, E. Pachatouridou, S. A. C. Carabineiro, E. Iliopoulou, C. Andriopoulou, N. Kallithrakas-Kontos, S. Boghosian and M. Konsolakis, Appl. Catal., B, 2018, 230, 18–28 CrossRef CAS.
- M. Ronda-Lloret, S. Rico-Francés, A. Sepúlveda-Escribano and E. V. Ramos-Fernandez, Appl. Catal., A, 2018, 562, 28–36 CrossRef CAS.
- R. S. Peng, X. B. Sun, S. J. Li, L. M. Chen, M. L. Fu, J. L. Wu and D. Q. Ye, Chem. Eng. J., 2016, 306, 1234–1246 Search PubMed.
- R. S. Peng, S. J. Li, X. B. Sun, Q. M. Ren, L. M. Chen, M. L. Fu, J. L. Wu and D. Q. Ye, Appl. Catal., B, 2018, 220, 462–470 CrossRef CAS.
- C. T. Campbell and C. H. F. Peden, Science, 2005, 309, 713–714 CrossRef CAS PubMed.
- H. Zhang, X. Z. Zhao, S. Wang, S. H. Zeng and H. Q. Su, Appl. Surf. Sci., 2018, 441, 754–763 CrossRef CAS.
- J. Li, P. F. Zhu and R. X. Zhou, J. Power Sources, 2011, 196, 9590–9598 CrossRef CAS.
- J. F. Ding, L. Li, P. H. X. Li, S. Q. Chen, S. F. Fang, T. Feng and G. S. Li, ACS Appl. Mater. Interfaces, 2018, 10, 7935–7945 Search PubMed.
- H. L. Zhang, W. Hu, C. X. Zhou, H. R. Liu, P. Yao, J. L. Wang and Y. Q. Chen, Appl. Catal., A, 2018, 563, 204–215 CrossRef CAS.
- W. Cai, Q. Zhong, S. L. Zhang and W. Zhao, Chem. Eng. J., 2014, 236, 223–232 CrossRef CAS.
- S. T. Hossain, E. Azeeva, K. Zhang, E. T. Zell, D. T. Bernard, S. Balaz and R. Wang, Appl. Surf. Sci., 2018, 455, 132–143 CrossRef CAS.
- K. Wang, B. L. Liu, Y. L. Cao, Y. Z. Li and D. Z. Jia, CrystEngComm, 2018, 20, 5191–5199 RSC.
- L. H. Chang, N. Sasirekha, Y.-W. Chen and W. J. Wang, Ind. Eng. Chem. Res., 2006, 45, 4927–4935 CrossRef CAS.
- Y. N. Zheng, K. Z. Li, H. Wang, Y. H. Wang, D. Tian, Y. G. Wei, X. Zhu, C. H. Zeng and Y. M. Luo, J. Catal., 2016, 344, 365–377 CrossRef CAS.
- B. M. Reddy, A. Khan, Y. Yamada, T. Kobayashi, S. P. Loridant and J.-C. Volta, J. Phys. Chem. B, 2003, 107, 11475–11484 CrossRef CAS.
- C. Yuan, H. G. Wang, J. Liu, Q. Wu, Q. Duan and Y. Li, J. Colloid Interface Sci., 2017, 494, 274–281 CrossRef CAS PubMed.
- K. I. Maslakov, Y. A. Teterin, A. J. Popel, A. Y. Teterin, K. E. Ivanov, S. N. Kalmykov, V. G. Petrov, P. K. Petrov and I. Farnan, Appl. Surf. Sci., 2018, 448, 154–162 CrossRef CAS.
- Y. Xia, J. Z. Lao, J. R. Ye, D. G. Cheng, F. Q. Chen and X. L. Zhan, ACS Sustainable Chem. Eng., 2019, 7, 18421–18433 CrossRef CAS.
- M. C. Biesinger, L. W. M. Lau, A. R. Gerson and R. S. C. Smart, Appl. Surf. Sci., 2010, 257, 887–898 Search PubMed.
- S. H. Zeng, Y. Wang, S. P. Ding, J. J. H. B. Sattler, E. Borodina, L. Zhang, B. M. Weckhuysen and H. Q. Su, J. Power Sources, 2014, 256, 301–311 CrossRef CAS.
- W. Kang, H. Guo and A. Varma, Appl. Catal., B, 2019, 249, 54–62 CrossRef CAS.
- J. Wang, L. P. Zhong, J. C. Lu, R. Chen, Y. Q. Lei, K. Z. Chen, C. Y. Han, S. F. He, G. P. Wan and Y. M. Luo, Mol. Catal., 2017, 443, 241–252 CrossRef CAS.
- E. Moretti, L. Storaro, A. Talon, P. Riello, A. I. Molina and E. Rodriguez-Castellon, Appl. Catal., B, 2015, 168, 385–395 CrossRef.
- J. C. Lu, J. Wang, Q. Zou, Y. H. Zhao, J. Fang, S. F. He, D. D. He and Y. M. Luo, J. Alloys Compd., 2019, 784, 1248–1260 CrossRef CAS.
- Y. Li, Y. Li, B. Nan, R. Xie, J. J. Han, S. H. Zhan and Y. Tian, Environ. Sci.: Nano, 2017, 4, 425–436 RSC.
- X. L. Xu, L. Li, J. Huang, H. Jin, X. Z. Fang, W. M. Liu, N. Zhang, H. M. Wang and X. Wang, ACS Catal., 2018, 8, 8033–8045 CrossRef CAS.
- Y. Liu, Y. Guo, H. G. Peng, X. L. Xu, Y. Y. Wu, C. Peng, N. Zhang and X. Wang, Appl. Catal., A, 2016, 525, 204–214 CrossRef CAS.
- H. Xu, Y. Cao, J. Xie, J. Hu, Y. Li and D. Jia, Mater. Res. Bull., 2018, 102, 342–352 CrossRef CAS.
- G. Z. Chen, Q. H. Xu, Y. Yang, C. C. Li, T. Z. Huang, G. X. Sun, S. X. Zhang, D. L. Ma and X. Li, ACS Appl. Mater. Interfaces, 2015, 7, 23538–23544 CrossRef CAS PubMed.
- L. Yang, Z. Cai, L. Hao, Z. P. Xing, Y. Dai, X. Xu, S. Y. Pan, Y. Q. Duan and J. L. Zou, ACS Appl. Mater. Interfaces, 2017, 9, 22518–22529 CrossRef CAS PubMed.
- X. L. Guo, J. X. Mao and R. X. Zhou, J. Power Sources, 2017, 371, 119–128 CrossRef CAS.
- K. Wang, Y. L. Cao, J. D. Hu, Y. Z. Li, J. Xie and D. Z. Jia, ACS Appl. Mater. Interfaces, 2017, 9, 16128–16137 CrossRef CAS PubMed.
- J. Li, Z. Y. Zhang, W. Gao, S. Zhang, Y. Y. Ma and Y. Q. Qu, ACS Appl. Mater. Interfaces, 2016, 8, 22988–22996 CrossRef CAS PubMed.
- W. W. Wang, W. Z. Yu, P. P. Du, H. Xu, Z. Jin, R. Si, C. Ma, S. Shi, C. J. Jia and C. H. Yan, ACS Catal., 2017, 7, 1313–1329 CrossRef CAS.
- T. Alammar, H. Noei, Y. Wang, W. Grünert and A.-V. Mudring, ACS Sustainable Chem. Eng., 2014, 3, 42–54 CrossRef.
- F. Yang, J. J. Wei, W. Liu, J. X. Guo and Y. Z. Yang, J. Mater. Chem. A, 2014, 2, 5662–5667 Search PubMed.
- S. L. Li, N. L. Wang, Y. H. Yue, G. S. Wang, Z. Zu and Y. Zhang, Chem. Sci., 2015, 6, 2495–2500 RSC.
- P. Venkataswamy, K. N. Rao, D. Jampaiah and B. M. Reddy, Appl. Catal., B, 2015, 162, 122–132 CrossRef CAS.
- M. F. Luo, J. J. Ma, J. Q. Lu, Y. P. Song and Y. J. Wang, J. Catal., 2007, 246, 52–59 CrossRef CAS.
- N. J. Lawrence, J. R. Brewer, L. Wang, T.-S. Wu, J. Wells-Kingsbury, M. M. Ihrig, G. Wang, Y.-L. Soo, W.-N. Mei and C. L. Cheung, Nano Lett., 2011, 11, 2666–2671 CrossRef CAS PubMed.
- H. Y. Liu, J. Wang, Z. B. Feng, Y. M. Lin, L. Y. Zhang and D. S. Su, Small, 2015, 11, 5059–5064 CrossRef CAS PubMed.
- Y. H. Xie, B. L. Liu, Y. Z. Li, Z. X. Chen, Y. L. Cao and D. Z. Jia, New J. Chem., 2019, 43, 12118–12125 RSC.
- X. Sun, P. He, Z. Gao, Y. Liao, S. Weng, Z. Zhao, H. Song and Z. Zhao, J. Colloid Interface Sci., 2019, 553, 1–13 CrossRef CAS PubMed.
- Y. Z. Li, Y. L. Cao and D. Z. Jia, J. Nanopart. Res., 2018, 20, 1–8 CrossRef.
- Y. Bai, Q. Wang, C. Du, T. Bu, Y. Liu, X. Sun, W. Luo, R. Li, Y. Zhao, X. Zheng and L. Wang, J. Colloid Interface Sci., 2019, 553, 768–777 CrossRef CAS PubMed.
Footnote |
| † Electronic supplementary information (ESI) available. See DOI: 10.1039/d0ce00588f |
| This journal is © The Royal Society of Chemistry 2020 |

