 Open Access Article
Creative Commons Attribution 3.0 Unported Licence
Phosphane tuning in heteroleptic [Cu(N^N)(P^P)]+ complexes for light-emitting electrochemical cells†
Fabian
Brunner
 a,
Azin
Babaei
b,
Antonio
Pertegás
b,
José M.
Junquera-Hernández
 b,
Alessandro
Prescimone
 a,
Edwin C.
Constable
 a,
Henk J.
Bolink
 b,
Michele
Sessolo
 *b,
Enrique
Ortí
 *b and
Catherine E.
Housecroft
 *a
*a
aDepartment of Chemistry, University of Basel, Spitalstrasse 51, CH-4056 Basel, Switzerland. E-mail: catherine.housecroft@unibas.ch
bInstituto de Ciencia Molecular, Universidad de Valencia, 46980 Paterna, Valencia, Spain. E-mail: enrique.orti@uv.es; michele.sessolo@uv.es
First published on 8th November 2018
Abstract
The synthesis and characterization of five [Cu(P^P)(N^N)][PF6] complexes in which P^P = 2,7-bis(tert-butyl)-4,5-bis(diphenylphosphino)-9,9-dimethylxanthene (tBu2xantphos) or the chiral 4,5-bis(mesitylphenylphosphino)-9,9-dimethylxanthene (xantphosMes2) and N^N = 2,2′-bipyridine (bpy), 6-methyl-2,2′-bipyridine (6-Mebpy) or 6,6′-dimethyl-2,2′-bipyridine (6,6′-Me2bpy) are reported. Single crystal structures of four of the compounds confirm that the copper(I) centre is in a distorted tetrahedral environment. In [Cu(xantphosMes2)(6-Mebpy)][PF6], the 6-Mebpy unit is disordered over two equally populated orientations and this disorder parallels a combination of two dynamic processes which we propose for [Cu(xantphosMes2)(N^N)]+ cations in solution. Density functional theory (DFT) calculations reveal that the energy difference between the two conformers observed in the solid-state structure of [Cu(xantphosMes2)(6-Mebpy)][PF6] differ in energy by only 0.28 kcal mol−1. Upon excitation into the MLCT region (λexc = 365 nm), the [Cu(P^P)(N^N)][PF6] compounds are yellow to orange emitters. Increasing the number of Me groups in the bpy unit shifts the emission to higher energies, and moves the Cu+/Cu2+ oxidation to higher potentials. Photoluminescence quantum yields (PLQYs) of the compounds are low in solution, but in the solid state PLQYs of up to 59% (for [Cu(tBu2xantphos)(6,6′-Me2bpy)]+) are observed. Increased excited-state lifetimes at low temperature are consistent with the complexes exhibiting thermally activated delayed fluorescence (TADF). This is supported by the small energy difference calculated between the lowest-energy singlet and triplet excited states (0.17–0.25 eV). The compounds were tested in simple bilayer light-emitting electrochemical cells (LECs). The optoelectronic performances of complexes containing xantphosMes2 were generally lower with respect to those with tBu2xantphos, which led to bright and efficient devices. The best performing LECs were obtained for the complex [Cu(tBu2xantphos)(6,6′-Me2bpy)][PF6] due to the increased steric hindrance at the N^N ligand, resulting in higher PLQY.
Introduction
Solid-state lighting technologies include organic-light emitting diodes (OLEDs) and light-emitting electrochemical cells (LECs) and interest in these devices has grown tremendously in the last few years.1–4 OLEDs are now well established and are widely employed in display applications. LECs feature many of the advantages of OLEDs including direct electron-to-photon conversion and the possibility of fabrication employing flexible surfaces and thin-film processing. Additionally, the simple device architecture of LECs and the use of air-stable electrode materials might reduce the manufacturing cost of electroluminescent devices and widen their field of applications.5–7 LECs incorporating ionic transition-metal complexes (iTMCs) based on iridium (and to a lesser extent ruthenium) have been the focus of intense investigations and show good performances in terms of colour tunability, brightness and device lifetime.8–14 However, the limited availability of iridium and ruthenium in the Earth's crust motivated the search for alternative emissive materials. LECs employing copper(I) iTMCs show promising characteristics. McMillin and co-workers first reported the photoluminescent properties of copper(I) complexes containing 2,2′-bipyridine (bpy) or 1,10-phenanthroline (phen) and PPh3 or chelating bis(phosphane) ligands,15,16 and the applications of [Cu(N^N)(P^P]+ compounds (N^N = diimine, P^P = bis(phosphane) in LECs followed.9 It has been shown that in many [Cu(N^N)(P^P]+ compounds, thermally activated delayed fluorescence (TADF) is a key feature in determining their photoluminescent properties.17–22 In this mechanism, the energy difference between the lowest-energy singlet and triplet excited states is sufficiently small to allow repopulation of the singlet from the triplet state at room temperature. This enables the indirect harvesting of fluorescence from the triplet state, which boosts device performance.23,24[Cu(P^P)(N^N)]+ complexes in which P^P is bis(2-(diphenylphosphino)phenyl)ether (POP) or 4,5-bis(diphenylphosphino)-9,9-dimethylxanthene (xantphos) (Scheme 1) and N^N is a bpy or phen ligand have been studied systematically in an effort to enhance their photoluminescent properties and device performances. We have investigated the influence of introducing alkyl and phenyl substituents into the 6- and 6,6′-positions of bpy in [Cu(P^P)(bpy)]+ complexes, and demonstrated improved emission and device performance with LECs containing [Cu(xantphos)(Mebpy)][PF6], [Cu(xantphos)(Etbpy)][PF6] and [Cu(POP)(Etbpy)][PF6] having lifetimes longer than 15, 40 and 80 h, respectively.25,26 Weber et al. have studied the influence of substituents in the 4,4′-positions of bpy in [Cu(xantphos)(4,4′-R2bpy)][BF4] on their photo- and electroluminescent properties and found a direct correlation between the σ-Hammett parameters of the R groups in 4,4′-R2bpy and the device efficiency.27 Most attention has focused on the structural and electronic modification of the N^N ligand in [Cu(P^P)(N^N)]+ to tune the emission properties of the complexes and their LEC behaviour.9,24,28–35
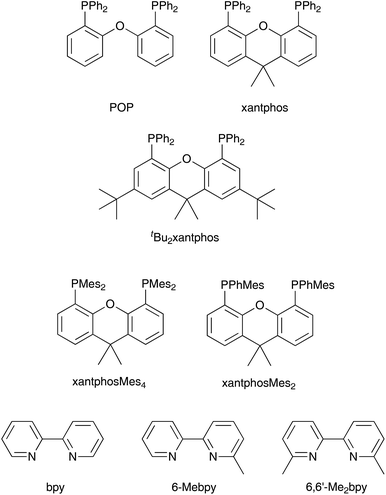
For the P^P ligand in [Cu(P^P)(N^N)]+ complexes, the commercially available POP and xantphos are common choices, although there is some interest in complexes incorporating 1,2-bis(diphenylphosphino)benzene36 and 9,9-dimethyl-4,5-bis(di-tert-butylphosphino)xanthene.37 In the latter case, it has been observed that the photoluminescence (PL) of [Cu(P^P)(N^N)]+ species is significantly reduced when the phenyl groups in xantphos (Scheme 1) are replaced by tert-butyl substituents, attributed to vibrational quenching effects.37 Thus, for good photophysical properties it appears crucial to retain aryl substituents on the phosphorus atoms in ligands related to xantphos or POP.
Here, we report on the effects of modifying the xantphos ligand and investigate the influence on both the structural and electronic properties. It has previously been reported that in [Cu(POP)(N^N)]+ and [Cu(xantphos)(N^N)]+ complexes, the HOMO is mainly centred on copper with small contributions from phosphorus, while the LUMO is localized on the N^N ligand.24,26 Thus, structural modifications made to the P^P ligand will have little if any effect on the energy level of the HOMO and any structural tuning should lead primarily to changes in steric effects. We have introduced tert-butyl groups into the 2,7-positions of xantphos to give tBu2xantphos (Scheme 1); tBu2xantphos has previously been used in combination with palladium(II) in vinylarene hydroamination catalysis.38 The introduction of peripheral tert-butyl groups was expected to additionally result in a larger spatial separation of complex ions in the active layer in a LEC and therefore have an influence on the electroluminescent properties. The other P^P ligands investigated in this work were 4,5-bis(dimesitylphosphino)-9,9-dimethylxanthene (xantphosMes4) and 4,5-bis(mesitylphenylphosphino)-9,9-dimethylxanthene (xantphosMes2), in which the PPh2 groups in xantphos were replaced by either PMes2 or PPhMes units (Scheme 1), thereby tuning the Tolman cone angle39 of the phosphane. The N^N ligands chosen for the investigation were bpy, 6-Mebpy and 6,6′-Me2bpy (Scheme 1). The photophysical properties of [Cu(xantphos)(N^N)][PF6] (N^N = bpy, 6-Mebpy and 6,6′-Me2bpy) have been previously reported,24–26 giving a benchmark series for the present investigation.
Experimental
Details of general instruments are given in the ESI.†tBu2xantphos38 and [Cu(MeCN)4][PF6]40 were prepared according to literature procedures. Other chemicals were purchased from Sigma Aldrich, Apollo Scientific, Angene or Fluorochem and were used as received. Details of the syntheses and characterizations of 6-Mebpy, xantphosMes4, chloro(mesityl)phenylphosphane, xantphosMes2, [Cu(tBu2xantphos)(bpy)][PF6], [Cu(tBu2xantphos)(6-Mebpy)][PF6], [Cu(tBu2xantphos)(6,6′-Me2bpy)][PF6], [Cu(xantphosMes2)(bpy)][PF6] and [Cu(xantphosMes2)(6-Mebpy)][PF6] are given in the ESI.†Crystallography
Data were collected on a Bruker Kappa Apex2 diffractometer with data reduction, solution and refinement using the programs APEX41 and CRYSTALS.42 Structural analysis was carried out using Mercury v. 3.7.43,44 In [Cu(tBu2xantphos)(6-Mebpy)][PF6]·1.5CH2Cl2·0.5H2O, one CH2Cl2 molecule was refined and SQUEEZE45 was used to treat part of the solvent region; formulae and numbers were modified in the cif to keep this result into account. In [Cu(xantphosMes2)(6-Mebpy)][PF6], the 6-Mebpy is orientationally disordered over two orientations and the relevant aromatic rings were refined as rigid bodies.xantphosMes2
C45H44OP2, M = 662.79, colourless plate, monoclinic, space group P21/n, a = 10.6380(9), b = 15.0841(13), c = 23.545(2) Å, β = 102.585(3)°, U = 3687.4(5) Å3, Z = 4, Dc = 1.194 Mg m−3, μ(Cu-Kα) = 1.317 mm−1, T = 123 K. Total 40![[thin space (1/6-em)]](https://www.rsc.org/images/entities/char_2009.gif) 993 reflections, 6810 unique, Rint = 0.035. Refinement of 6264 reflections (433 parameters) with I> 2σ(I) converged at final R1 = 0.0336 (R1 all data = 0.0365), wR2 = 0.0776 (wR2 all data = 0.0794), GOF = 0.9775. CCDC 1860879.†
993 reflections, 6810 unique, Rint = 0.035. Refinement of 6264 reflections (433 parameters) with I> 2σ(I) converged at final R1 = 0.0336 (R1 all data = 0.0365), wR2 = 0.0776 (wR2 all data = 0.0794), GOF = 0.9775. CCDC 1860879.†
[Cu(tBu2xantphos)(bpy)][PF6]·0.5Et2O
C59H61CuF6N2O1.5P3, M = 1092.60, yellow block, triclinic, space group P![[1 with combining macron]](https://www.rsc.org/images/entities/char_0031_0304.gif) , a = 12.0991(12), b = 13.3253(13), c = 18.6750(18) Å, α = 91.353(3), β = 90.939(3), γ = 115.475(2)°, U = 2716.2(5) Å3, Z = 2, Dc = 1.336 Mg m−3, μ(Cu-Kα) = 1.932 mm−1, T = 123 K. Total 35
, a = 12.0991(12), b = 13.3253(13), c = 18.6750(18) Å, α = 91.353(3), β = 90.939(3), γ = 115.475(2)°, U = 2716.2(5) Å3, Z = 2, Dc = 1.336 Mg m−3, μ(Cu-Kα) = 1.932 mm−1, T = 123 K. Total 35![[thin space (1/6-em)]](https://www.rsc.org/images/entities/char_2009.gif) 686 reflections, 9826 unique, Rint = 0.029. Refinement of 9540 reflections (664 parameters) with I > 2σ(I) converged at final R1 = 0.0416 (R1 all data = 0.0423), wR2 = 0.1012 (wR2 all data = 0.1016), gof = 0.9707. CCDC 1844060.†
686 reflections, 9826 unique, Rint = 0.029. Refinement of 9540 reflections (664 parameters) with I > 2σ(I) converged at final R1 = 0.0416 (R1 all data = 0.0423), wR2 = 0.1012 (wR2 all data = 0.1016), gof = 0.9707. CCDC 1844060.†
[Cu(tBu2xantphos)(6-Mebpy)][PF6]·1.5CH2Cl2·0.5H2O
C59.5H62Cl3CuF6N2O1.5P3, M = 1205.97, yellow block, triclinic, space group P![[1 with combining macron]](https://www.rsc.org/images/entities/char_0031_0304.gif) , a = 10.7080(9), b = 13.4475(12), c = 22.167(2) Å, α = 73.142(6), β = 79.483(6), γ = 86.606(6)°, U = 3003.4(5) Å3, Z = 2, Dc = 1.33 Mg m−3, μ(Cu-Kα) = 2.997 mm−1, T = 123 K. Total 35
, a = 10.7080(9), b = 13.4475(12), c = 22.167(2) Å, α = 73.142(6), β = 79.483(6), γ = 86.606(6)°, U = 3003.4(5) Å3, Z = 2, Dc = 1.33 Mg m−3, μ(Cu-Kα) = 2.997 mm−1, T = 123 K. Total 35![[thin space (1/6-em)]](https://www.rsc.org/images/entities/char_2009.gif) 561 reflections, 10
561 reflections, 10![[thin space (1/6-em)]](https://www.rsc.org/images/entities/char_2009.gif) 903 unique, Rint = 0.082. Refinement of 7619 reflections (700 parameters) with I > 2σ(I) converged at final R1 = 0.1178 (R1 all data = 0.1490), wR2 = 0.1151 (wR2 all data = 0.1470), GOF = 1.0317. CCDC 1844063.†
903 unique, Rint = 0.082. Refinement of 7619 reflections (700 parameters) with I > 2σ(I) converged at final R1 = 0.1178 (R1 all data = 0.1490), wR2 = 0.1151 (wR2 all data = 0.1470), GOF = 1.0317. CCDC 1844063.†
[Cu(xantphosMes2)(bpy)][PF6]
C55H52CuF6N2OP3, M = 1027.49, yellow block, monoclinic, space group C2/c, a = 38.341(2), b = 11.8342(7), c = 26.5208(14) Å, β = 126.4524(19)°, U = 9679.2(10) Å3, Z = 8, Dc = 1.410 Mg m−3, μ(Cu-Kα) = 2.126 mm−1, T = 123 K. Total 29![[thin space (1/6-em)]](https://www.rsc.org/images/entities/char_2009.gif) 726 reflections, 8726 unique, Rint = 0.027. Refinement of 7795 reflections (613 parameters) with I > 2σ(I) converged at final R1 = 0.0320 (R1 all data = 0.0362), wR2 = 0.0851 (wR2 all data = 0.0870), GOF = 1.0356. CCDC 1844062.†
726 reflections, 8726 unique, Rint = 0.027. Refinement of 7795 reflections (613 parameters) with I > 2σ(I) converged at final R1 = 0.0320 (R1 all data = 0.0362), wR2 = 0.0851 (wR2 all data = 0.0870), GOF = 1.0356. CCDC 1844062.†
[Cu(xantphosMes2)(6-Mebpy)][PF6]
C56H54CuF6N2OP3, M = 1041.51, yellow block, monoclinic, space group C2/c, a = 38.1932(19), b = 12.0648(6), c = 26.5270(13) Å, β = 127.0427(19)°, U = 9756.6(9) Å3, Z = 8, Dc = 1.418 Mg m−3, μ(Cu-Kα) = 2.117 mm−1, T = 123 K. Total 31![[thin space (1/6-em)]](https://www.rsc.org/images/entities/char_2009.gif) 926 reflections, 8749 unique, Rint = 0.033. Refinement of 7701 reflections (685 parameters) with I > 2σ(I) converged at final R1 = 0.0467 (R1 all data = 0.0531), wR2 = 0.0586 (wR2 all data = 0.0623), GOF = 0.9991. CCDC 1844061.†
926 reflections, 8749 unique, Rint = 0.033. Refinement of 7701 reflections (685 parameters) with I > 2σ(I) converged at final R1 = 0.0467 (R1 all data = 0.0531), wR2 = 0.0586 (wR2 all data = 0.0623), GOF = 0.9991. CCDC 1844061.†
Computational details
A set of density functional theory (DFT) calculations were performed for the [Cu(P^P)(N^N)]+ cations (P^P = tBu2xantphos and xantphosMes2; N^N = bpy, 6′-Mebpy, and 6,6′-Me2bpy) using the A.03 revision of Gaussian 16.46 The Becke's three-parameter B3LYP exchange–correlation functional47,48 was used in all the calculations. The “double-ζ” quality def2svp basis set was employed for C, H, P, N and O atoms, whereas the “triple-ζ” quality def2tzvp basis set was used for the Cu atom.49,50 Intramolecular non-covalent interactions are expected to play a relevant role in determining the molecular geometry of the studied complexes owing to the presence of the bulky xantphos-derived ligands. To get a better description of those interactions, the D3 Grimme's dispersion term with Becke–Johnson damping was added to the B3LYP functional (B3LYP-D3).51,52 The geometries of all the complexes in both their singlet ground electronic state (S0) and their lowest-energy triplet excited state (T1) were optimized without imposing any symmetry restriction. For T1 the spin unrestricted UB3LYP approximation was used with a spin multiplicity of three. The lowest-lying excited states of each complex, both singlets and triplets, were computed at the minimum-energy geometry optimized for S0 using the time-dependent DFT (TD-DFT) approach.53–55 All the calculations were performed in the presence of the solvent (CH2Cl2). Solvent effects were considered within the self-consistent reaction field (SCRF) theory using the polarized continuum model (PCM) approach.56–58Device preparation and characterization
LECs were prepared on top of patterned indium tin oxide (ITO, 15 Ω sq−1) coated glass substrates previously cleaned by chemical and UV-ozone methods. Prior to the deposition of the emitting layer, 80 nm thick films of poly-(3,4-ethylenedioxythiophene):poly(styrenesulfonate) (PEDOT:PSS) (CLEVIOS™ P VP AI 4083, Heraeus) were coated in order to flatten the ITO electrode and to increase its work function. The emitting layer (100 nm thick) was prepared by spin-coating a dichloromethane solution of the emitting compound with the addition of the ionic liquid 1-ethyl-3-methylimidazolium hexafluorophosphate [Emim][PF6] (>98.5%, Sigma-Aldrich), in a 4![[thin space (1/6-em)]](https://www.rsc.org/images/entities/char_2009.gif) :
:![[thin space (1/6-em)]](https://www.rsc.org/images/entities/char_2009.gif) 1 molar ratio. The devices were then transferred to an inert atmosphere glovebox (<0.1 ppm O2 and H2O), where the aluminium cathode (100 nm) was thermally deposited in high vacuum using an Edwards Auto500 chamber integrated in the glovebox. The thickness of all films was determined with an Ambios XP-1 profilometer. The active area of the devices was 6.5 mm2. LECs were not encapsulated and were characterized inside the glovebox at room temperature. The device lifetime was measured by applying a pulsed current and monitoring the voltage and luminance versus time by a True Colour Sensor MAZeT (MTCSiCT Sensor) with a Botest OLT OLED Lifetime-Test System. The electroluminescence (EL) spectra were measured using an Avantes AvaSpec-2048 Fiber Optic Spectrometer during device lifetime measurement.
1 molar ratio. The devices were then transferred to an inert atmosphere glovebox (<0.1 ppm O2 and H2O), where the aluminium cathode (100 nm) was thermally deposited in high vacuum using an Edwards Auto500 chamber integrated in the glovebox. The thickness of all films was determined with an Ambios XP-1 profilometer. The active area of the devices was 6.5 mm2. LECs were not encapsulated and were characterized inside the glovebox at room temperature. The device lifetime was measured by applying a pulsed current and monitoring the voltage and luminance versus time by a True Colour Sensor MAZeT (MTCSiCT Sensor) with a Botest OLT OLED Lifetime-Test System. The electroluminescence (EL) spectra were measured using an Avantes AvaSpec-2048 Fiber Optic Spectrometer during device lifetime measurement.
Results and discussion
Preparation and characterization of P^P ligands
The P^P ligand tBu2xantphos was synthesized using the literature procedure.38 The synthetic routes to xantphosMes4 and xantphosMes2 were based on the strategy of Hamann and Hartwig to prepare bidentate phosphanes with varying steric properties.59 The syntheses of xantphosMes4 and xantphosMes2 are summarized in Scheme 2. Both compounds were isolated as white solids, but facile oxidation to the phosphane oxides made it difficult to obtain analytically pure samples. The electrospray (ESI) mass spectra of xantphosMes4 and xantphosMes2 showed base peaks at m/z 747.3 and 663.5, respectively, arising from the [M + H]+ ions. The solid-state IR spectra of tBu2xantphos and xantphosMes2 are shown in Fig. S1 and S2.† Single crystals of xantphosMes2 were grown from an Et2O solution of the compound by slow evaporation. Fig. S3† shows an ORTEP-style plot of the molecule and important bond parameters are given in the figure caption. Few chiral xantphos-derived ligands have been reported in the literature,60,61 and the solid-state structure of xantphosMes2 represents the (rac)-form of xantphosMes2. It crystallizes in the monoclinic P21/n space group with both the (R,R)- and (S,S)-enantiomers in the unit cell; the (S,S)-enantiomer is shown in Fig. 1. The xanthene unit deviates very slightly from planarity, in contrast to the ‘bowl’ shape that is commonly adopted (see discussion below).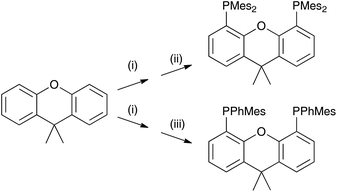 | ||
| Scheme 2 Syntheses of xantphosMes4 and xantphosMes2. Conditions: (i) nBuLi, dry heptane, TMEDA, reflux, 20 min; (ii) Mes2PCl, THF, 0 °C, 1 h; (iii) MesPhPCl, THF, 0 °C, 1 h. | ||
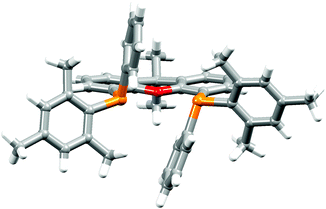 | ||
| Fig. 1 Crystallographically determined structure of the (S,S)-enantiomer of xantphosMes2. See also Fig. S3.† | ||
The 31P NMR spectra of xantphosMes4 and xantphosMes2 exhibit resonances at δ −36.2 and −25.8 ppm, respectively, consistent with one phosphorus environment in each compound. 1H and 13C NMR spectra (see Experimental section in the ESI†) were assigned by 2D methods and were in accord with functionalization in the 4,5-positions of the xanthene unit (Scheme 2). The 1H NMR spectra are shown in Fig. S4 and S5.† The 1H NMR spectrum of xantphosMes2 (Fig. S5†) also shows the presence of a subspecies in solution, present in <10% based on integration. The chemical shifts of the low intensity signals and the presence of diagnostic NOESY peaks suggest the major and minor species are structurally related, and we assign them to the (rac)- and (meso)-forms, respectively. Based on the preference seen in the solid-state, we propose that the dominant species is the (rac)-form. Thus, the bisphosphane is preorganized to give particular diastereoisomers upon complexation with copper(I) and this indeed is the case as discussed later.
Preparation and characterization of copper(I) complexes
Attempts to prepare [Cu(xantphosMes4)(bpy)][PF6], [Cu(xantphosMes4)(6-Mebpy)][PF6] and [Cu(xantphosMes4)(6,6′-Mebpy)][PF6] by reaction of [Cu(MeCN)4][PF6] and xantphosMes4 followed by the corresponding 2,2′-bipyridine ligand failed to yield the desired heteroleptic complexes. The 31P spectrum of each crude reaction mixture was dominated by a signal for the free ligand (δ −36.2 ppm), and also exhibited several other unassigned signals. Evidence for the formation of [Cu(xantphosMes4)]+ came from ESI mass spectrometry with a peak envelope at m/z 809.5. Mononuclear [Cu(P^P)]+ complexes containing sterically demanding substituents attached to the phosphorus atoms are known, for example [Cu(tBu-xantphos-κP,O,P)][PF6]37 (tBu-xantphos = 9,9-dimethyl-4,5-bis(di-tert-butylphosphino)xanthene) and 3-coordinate copper(I) complexes with P^N^P pincer ligands.62 Since xantphosMes4 proved to be too sterically demanding for the formation of [Cu(xantphosMes4)(N^N)]+ species, we turned our attention to the use of xantphosMes2.Heteroleptic [Cu(P^P)(N^N)]+ complexes with P^P = tBu2xantphos or xantphosMes2 were prepared using the established procedure24 by the addition of a mixture of the xantphos and bpy ligands to a solution of [Cu(MeCN)4][PF6] in CH2Cl2. This procedure avoids competitive formation of homoleptic [Cu(P^P)2]+ complexes.63 Homoleptic [Cu(N^N)2]+ complexes where N^N is a bpy derivative, and heteroleptic [Cu(xantphos)(N^N)]+ species are typically red and yellow respectively. In all cases, the reaction mixture remained orange after being stirred for 1–2 hours, suggesting incomplete conversion to the heteroleptic complex. To force full conversion, an additional 0.2 equivalents of the bisphosphane ligand were added, resulting in the solution turning yellow. After being stirred for a further 2.5 hours, the solvent was removed and the excess ligand was removed by washing with Et2O. This procedure yielded [Cu(tBu2xantphos)(bpy)][PF6], [Cu(tBu2xantphos)(6-Mebpy)][PF6], [Cu(tBu2xantphos)(6,6′-Me2bpy)][PF6], [Cu(xantphosMes2)(bpy)][PF6] and [Cu(xantphosMes2)(6-Mebpy)][PF6] as yellow powders. In the reaction between [Cu(MeCN)4][PF6], xantphosMes2 and 6,6′-Me2bpy, the yellow colour corresponding to a heteroleptic complex was not observed and only a red solid, identified by NMR spectroscopy and mass spectrometry as [Cu(6,6′-Me2bpy)2][PF6],64 could be isolated. We suggest that the steric demands of the substituents in 6,6′-Me2bpy combined with the two mesityl groups in xantphosMes2 militate against the formation of [Cu(xantphosMes2)(6,6′-Me2bpy)][PF6].
The five heteroleptic compounds were characterized by 1H, 13C and 31P NMR spectroscopies, elemental analysis, ESI mass spectrometry and IR spectroscopy (see Fig. S6–S10†), as well as representative single crystal structures. The ESI mass spectrum of each complex containing tBu2xantphos exhibited a base peak corresponding to the [M–PF6]+ ion. The ESI mass spectrum of [Cu(xantphosMes2)(bpy)][PF6] showed a base peak envelope at m/z 725.4 assigned to [Cu(xantphosMes2)]+ and a lower intensity peak envelope at m/z 881.5 arising from [M − PF6]+. For [Cu(xantphosMes2)(6-Mebpy)][PF6], the ESI mass spectrum exhibited only a peak envelope for the [Cu(xantphosMes2)]+ ion (m/z 725.4). Elemental analysis and the NMR spectra confirmed the formation of a heteroleptic complex. The solution NMR spectroscopic properties are discussed after the solid-state structures.
Single crystal structures of copper(I) complexes
Single crystals of [Cu(tBu2xantphos)(bpy)][PF6]·0.5Et2O, [Cu(tBu2xantphos)(6-Mebpy)][PF6]·1.5CH2Cl2·0.5H2O, [Cu(xantphosMes2)(bpy)][PF6] and [Cu(xantphosMes2)(6-Mebpy)][PF6] were obtained by layering Et2O over a CH2Cl2 solution of each complex. The tBu2xantphos-containing compounds crystallized in the triclinic space group P![[1 with combining macron]](https://www.rsc.org/images/entities/char_0031_0304.gif) , whereas [Cu(xantphosMes2)(bpy)][PF6] and [Cu(xantphosMes2)(6-Mebpy)][PF6] crystallized in the monoclinic space group C2/c. Fig. S11–S14† show ORTEP-style plots of the [Cu(tBu2xantphos)(bpy)]+, [Cu(tBu2xantphos)(6-Mebpy)]+, [Cu(xantphosMes2)(bpy)]+ and [Cu(xantphosMes2)(6-Mebpy)]+ cations. Selected structural parameters are given in the captions to Fig. S11–S14,† and important parameters are compared in Table 1. In each cation, the copper(I) centre is in a distorted tetrahedral geometry and the xanthene backbone adopts a ‘bowl’ (boat) conformation, which is observed for the majority of free and coordinated xantphos ligands. A search of the Cambridge Structural Database (CSD65 v. 5.39, Conquest43 v. 1.2, search 10 August 2018) revealed 254 xantphos-containing structures, with flattening of the xanthene unit usually being associated with a κP,O,P coordination mode. The angle between the P–Cu–P and N–Cu–N planes (Table 1) is close to 90° in [Cu(P^P)(6-Mebpy)][PF6] and slightly smaller in [Cu(P^P)(bpy)][PF6]. The bite angle of the P^P ligand increases slightly on going from tBu2xantphos to xantphosMes2 (Table 1), consistent with the increased steric effects of PPhMes versus PPh2.
, whereas [Cu(xantphosMes2)(bpy)][PF6] and [Cu(xantphosMes2)(6-Mebpy)][PF6] crystallized in the monoclinic space group C2/c. Fig. S11–S14† show ORTEP-style plots of the [Cu(tBu2xantphos)(bpy)]+, [Cu(tBu2xantphos)(6-Mebpy)]+, [Cu(xantphosMes2)(bpy)]+ and [Cu(xantphosMes2)(6-Mebpy)]+ cations. Selected structural parameters are given in the captions to Fig. S11–S14,† and important parameters are compared in Table 1. In each cation, the copper(I) centre is in a distorted tetrahedral geometry and the xanthene backbone adopts a ‘bowl’ (boat) conformation, which is observed for the majority of free and coordinated xantphos ligands. A search of the Cambridge Structural Database (CSD65 v. 5.39, Conquest43 v. 1.2, search 10 August 2018) revealed 254 xantphos-containing structures, with flattening of the xanthene unit usually being associated with a κP,O,P coordination mode. The angle between the P–Cu–P and N–Cu–N planes (Table 1) is close to 90° in [Cu(P^P)(6-Mebpy)][PF6] and slightly smaller in [Cu(P^P)(bpy)][PF6]. The bite angle of the P^P ligand increases slightly on going from tBu2xantphos to xantphosMes2 (Table 1), consistent with the increased steric effects of PPhMes versus PPh2.
| Complex cation | P–Cu–P chelating angle/° | N–Cu–N chelating angle/° | Angle between P–Cu–P and N–Cu–N planes/° | N–C–C–N torsion angle/° |
|---|---|---|---|---|
| a Values for the conformer with 6-Mebpy oriented with the 6-Me group away from the xanthene bowl as in Fig. 2b. b Values for the conformer with 6-Mebpy oriented with the 6-Me group lying over the xanthene bowl. | ||||
| [Cu(tBu2xantphos)(bpy)]+ | 113.56(2) | 79.90(7) | 84.1 | −0.4(3) |
| [Cu(tBu2xantphos)(6-Mebpy)]+ | 112.70(7) | 80.1(2) | 89.3 | 2.5(8) |
| [Cu(xantphosMes2)(bpy)]+ | 115.96(2) | 79.08(6) | 86.1 | 15.0(2) |
| [Cu(xantphosMes2)(6-Mebpy)]+ | 115.25(3) | 78.6(1)a | 89.3a | −23.3(6)a |
| 79.4(1)b | 89.0b | −22.5(6)b | ||
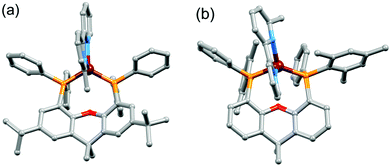
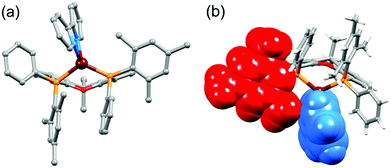
On going from [Cu(P^P)(bpy)]+ to [Cu(P^P)(6-Mebpy)]+, the introduction of the 6-methyl group in the bpy unit lowers the symmetry of the cation. The methyl substituent can, in principle, lie over the xanthene ‘bowl’ or be remote from it.26Fig. 2a shows that in [Cu(tBu2xantphos)(6-Mebpy)][PF6], the methyl group lies over the xanthene unit. In contrast, in [Cu(xantphosMes2)(6-Mebpy)][PF6], the 6-Mebpy ligand is orientationally disordered over two sites, each with 50% occupancy. Fig. 2b depicts the conformer in which the Me group is remote from the xanthene unit; the second conformer is structurally related to [Cu(tBu2xantphos)(6-Mebpy)]+ (Fig. 2a). The N–C–C–N torsion angles in Table 1 demonstrate that the bpy unit is significantly more twisted in the cations containing the xantphosMes2 ligand than those with tBu2xantphos. This appears to be associated with the fact that in both [Cu(xantphosMes2)(bpy)][PF6] (Fig. 3) and [Cu(xantphosMes2)(6-Mebpy)][PF6] one methyl group of one mesityl substituent is directed towards the middle of the bpy domain (Fig. 3b). This spatial proximity is characterized by CMe(Mes)⋯centroidpyridine distances of 3.98 and 4.37 Å (HMe(Mes)⋯centroidpyridine = 3.16 and 3.56 Å) in the [Cu(xantphosMes2)(bpy)]+ cation. Corresponding separations in [Cu(xantphosMes2)(6-Mebpy)]+ are 4.00 and 4.38 Å (3.24 and 3.57 Å) and 3.85 and 4.39 Å (3.27 and 3.48 Å) for the two partial occupancy 6-Mebpy sites.
Solution NMR spectroscopy
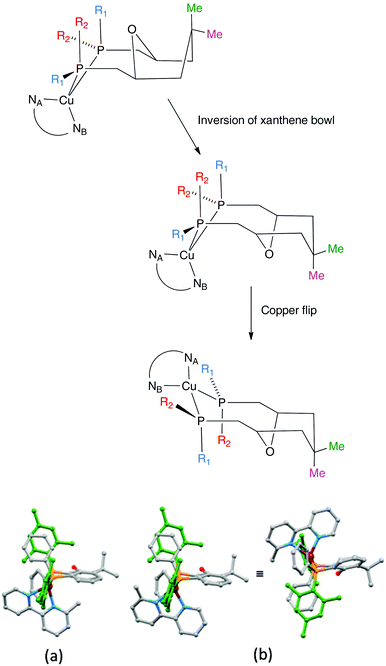
The aromatic regions of the solution 1H NMR spectra of [Cu(tBu2xantphos)(bpy)][PF6], [Cu(xantphosMes2)(bpy)][PF6] and [Cu(tBu2xantphos)(6,6′-Me2bpy)][PF6] are shown in Fig. 4 (see also Fig. S15†), S16 and S17,† respectively. All signals are sharp and well-resolved at room temperature and were assigned using COSY, NOESY, HMBC and HMQC methods. The tBu substituents give rise to a singlet at δ 1.11 ppm in [Cu(tBu2xantphos)(bpy)][PF6] and δ 1.16 ppm in [Cu(tBu2xantphos)(6,6′-Me2bpy)][PF6]. Fig. 4 and S16† reveal that the two pyridine rings of bpy in [Cu(tBu2xantphos)(bpy)][PF6] and [Cu(xantphosMes2)(bpy)][PF6] are magnetically equivalent. Similarly, the 6,6′-Me2bpy ligand in [Cu(tBu2xantphos)(6,6′-Me2bpy)][PF6] is symmetric on the NMR timescale at room temperature (Fig. S17†). We have previously detailed a solution dynamic behaviour for [Cu(xantphos)(N^N)]+ complexes involving inversion of the xanthene unit (‘bowl’),26,32 and this is depicted in the first dynamic process illustrated in Fig. 5. The scheme demonstrates that inversion of the xanthene bowl exchanges the environments of the xanthphos methyl groups (green and magenta in Fig. 5) between axial and equatorial sites, but does not render pyridine rings A and B (represented by NA and NB) equivalent. By invoking a second process involving movement of the {Cu(bpy)} unit (i.e., a change in conformation of the chelate ring, Fig. 5), NA and NB experience both sides of the xanthene bowl and are equivalent on the NMR timescale.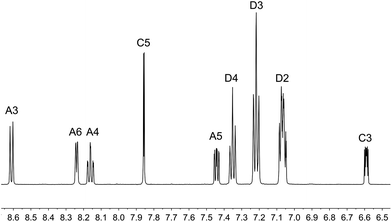 | ||
| Fig. 4 Aromatic region of the 1H NMR spectrum (500 MHz, acetone-d6) of [Cu(tBu2xantphos)(bpy)][PF6]. See Fig. S15† for the full spectrum. See Scheme 3 for atom labelling. | ||
On going from [Cu(tBu2xantphos)(bpy)][PF6] to [Cu(tBu2xantphos)(6-Mebpy)][PF6], the symmetry of the cation is lowered and phenyl rings D (see Scheme 3) split into two sets, those proximate to the methyl group of 6-Mebpy and those on the side of the unsubstituted pyridine ring (Fig. 2a). Fig. 6 shows the aromatic region of the solution 1H NMR spectrum of [Cu(tBu2xantphos)(6-Mebpy)][PF6], in which the sets of D rings are labelled D and D′. In the NOESY spectrum at 298 K, exchange (EXSY) peaks are observed between pairs of signals for protons D2/D2′ and D3/D3′; the D4/D4′ EXSY peaks appear too close to the diagonal in the NOESY spectrum to be cleary resolved. NOESY cross peaks (no EXSY) are observed between MeCq1 and MeCq1′ (Fig. S18†). These observations are consistent with inversion of the chelate ring (‘copper flip’ in Fig. 5) and no inversion of the xanthene bowl.
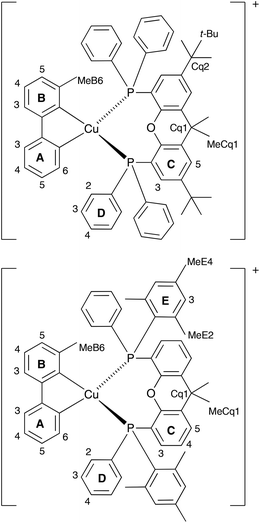 | ||
| Scheme 3 Structures of [Cu(tBu2xantphos)(6-Mebpy)]+ and [Cu(xantphosMes2)(6-Mebpy)]+ with labelling for NMR spectroscopic assignments. | ||
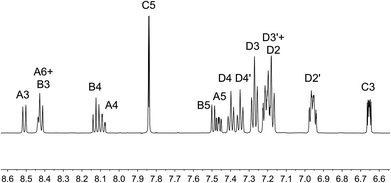 | ||
| Fig. 6 Aromatic region of the 1H NMR spectrum (500 MHz, acetone-d6) of [Cu(tBu2xantphos)(6-Mebpy)][PF6]. See Scheme 3 for atom labelling. | ||
The single crystal structures of [Cu(xantphosMes2)(bpy)][PF6] and [Cu(xantphosMes2)(6-Mebpy)][PF6] reveal that the two PPhMes groups of the xantphosMes2 ligand are mutually oriented as shown in Fig. 3a and 5. This desymmetrizes the xanthene unit (labelled rings C and C′). In addition, the equatorial and axial positions of the Ph and Mes substituents with respect to the chelate ring leads to chemical shift differences in the 1H NMR spectrum for pairs of phenyl rings (D and D′) and mesityl groups (E and E′). Fig. S19† shows the 1H NMR spectrum of [Cu(xantphosMes2)(6-Mebpy)][PF6], and Fig. 7 and S20† show exchange peaks observed in the NOESY spectrum. Exchange peaks between the signals for phenyl proton D2/D2′ and D4/D4′ is consistent with the ‘copper flip’ shown in Fig. 5. This leads to equivalence of the outer rings of the xanthene unit as confirmed by the EXSY peak between the signals for protons C3/C3′. The EXSY peak between signals for the xanthene methyls MeCq1 and MeCq1′ (Fig. S20†) confirms the inversion of the xanthene bowl (Fig. 5). This contrasts with [Cu(tBu2xantphos)(6-Mebpy)][PF6] where no exchange (only NOESY) peaks are observed (see above and Fig. S18†).
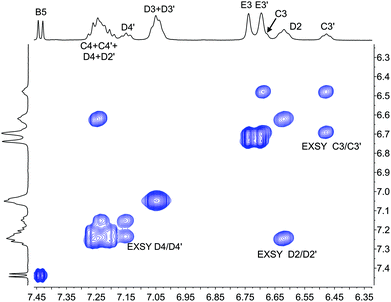 | ||
| Fig. 7 Part of the NOESY spectrum (500 MHz, acetone-d6) of [Cu(xantphosMes2)(6-Mebpy)][PF6] showing exchange (EXSY) peaks between pairs of protons C3 and C3′, D2 and D2′, and D4 and D4′. See also Fig. S20.† | ||
Earlier, we noted an orientational disorder of the 6-Mebpy ligand in the solid-state structure of [Cu(xantphosMes2)(6-Mebpy)][PF6]. The disorder was modelled with a 50% occupancy of each orientation and Fig. 5a and b show the [Cu(xantphosMes2)(6-Mebpy)]+ with the two orientations of 6-Mebpy. The structure in Fig. 5a corresponds to the top diagram in the scheme in Fig. 5, while Fig. 5b corresponds to the bottom diagram in the scheme. The disorder therefore parallels a combination of the two dynamic processes which we propose the cation undergoes in solution.
Variable temperature (VT) NMR spectra were recorded for an acetone-d6 solution of [Cu(xantphosMes2)(6-Mebpy)][PF6]. The 31P NMR spectrum (Fig. S21†) shows only one signal over the range 298–180 K. Fig. 8 shows the effect of temperature on the alkyl region of the 1H NMR spectrum of [Cu(xantphosMes2)(6-Mebpy)][PF6]. The collapse of the signals for mesityl-methyl protons MeE2 and MeE2′ and the appearance of four signals for these methyls below 218 K are consistent with freezing out the rotation of the mesityl groups. A similar temperature dependence is observed for the mesityl E3 protons in the aromatic region of the spectrum (Fig. S22†). Significant shifting of the xanthene methyl protons MeCq1 and MeCq1′ (Fig. 8) and 6-Mebpy protons A6 and MeB6 (Fig. S22†) can be attributed to changes in their magnetic environments as the mesityl groups adopt a static configuration. Both 31P and 1H VT NMR spectra are consistent with the presence of only one conformer in solution.
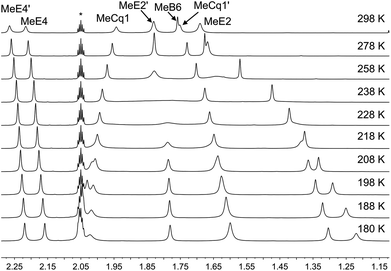 | ||
| Fig. 8 Alkyl regions of the variable temperature 1H NMR spectra (500 MHz, acetone-d6) of [Cu(xantphosMes2)(6-Mebpy)][PF6]. See Scheme 3 for atom labelling. | ||
Electrochemistry
The electrochemical behaviour of the [Cu(N^N)(P^P)][PF6] complexes was studied using cyclic voltammetry and the results are summarized in Table 2 and Fig. 9. All compounds with the exception of [Cu(xantphosMes2)(bpy)][PF6] exhibit a quasi-reversible process in the range +0.76 to +0.85 V, which is assigned to a copper-centred oxidation. For [Cu(xantphosMes2)(bpy)][PF6] the oxidation at +0.80 V is irreversible. Although the corresponding reduction peak could not be resolved, the position of this oxidation peak (Eoxpc) is similar the one observed for [Cu(tBu2xantphos)(bpy)][PF6] (+0.80 V, Fig. 9). When scanning beyond +1.0 V, additional oxidation waves appear and the copper oxidation is no longer reversible. Instead a reduction signal appears at around +0.25 V. This indicates decomposition of the complexes at potentials higher than +1.0 V. Complexes containing tBu2xantphos also show an irreversible reduction wave at around −2.2 V (Table 2) arising from a ligand-based process. For the complexes containing xantphosMes2, no reduction processes were observed within the solvent accessible window.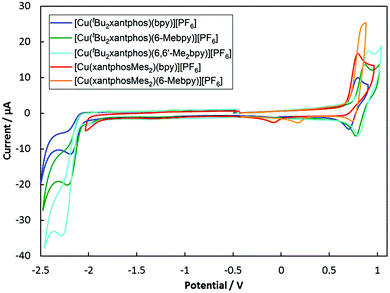 | ||
| Fig. 9 Cyclic voltamogramms of [Cu(P^P)(N^N)][PF6] compounds in CH2Cl2 at a scan rate of 100 mV s−1 referenced to internal Fc/Fc+ = 0 V. | ||
| Complex cation | E ox1/2/V (Epc − Epa/mV) | E oxpc/V | E redpa/V |
|---|---|---|---|
| a Values taken from ref. 24. | |||
| [Cu(tBu2xantphos)(bpy)]+ | +0.76 (90) | −2.20 | |
| [Cu(tBu2xantphos)(6-Mebpy)]+ | +0.83 (90) | −2.22 | |
| [Cu(tBu2xantphos)(6,6′-Me2bpy)]+ | +0.85 (100) | −2.28 | |
| [Cu(xantphosMes2)(bpy)]+ | +0.80ir | ||
| [Cu(xantphosMes2)(6-Mebpy)]+ | +0.84 (70) | ||
[Cu(xantphos)(bpy)]+![[thin space (1/6-em)]](https://www.rsc.org/images/entities/char_2009.gif) a a |
+0.76 (110) | ||
[Cu(xantphos)(6-Mebpy)]+![[thin space (1/6-em)]](https://www.rsc.org/images/entities/char_2009.gif) a a |
+0.85 (100) | ||
[Cu(xantphos)(6,6′-Me2bpy)]+![[thin space (1/6-em)]](https://www.rsc.org/images/entities/char_2009.gif) a a |
+0.90 (150) | ||
Along the series [Cu(tBu2xantphos)(N^N)][PF6] with N^N = bpy to 6-Mebpy to 6,6′-Me2bpy, the copper oxidation shifts to higher potentials (as observed for the analogous [Cu(xantphos)(N^N)][PF6] series, Table 2![[thin space (1/6-em)]](https://www.rsc.org/images/entities/char_2009.gif) 24) while the reduction moves towards more negative potentials. This demonstrates an increase in the HOMO–LUMO gap as the steric demand of the bpy ligand increases. This trend was also observed for a related series of compounds and has been rationalized using DFT calculations.24
24) while the reduction moves towards more negative potentials. This demonstrates an increase in the HOMO–LUMO gap as the steric demand of the bpy ligand increases. This trend was also observed for a related series of compounds and has been rationalized using DFT calculations.24
Theoretical calculations: geometry and molecular orbitals
The geometries of all the [Cu(P^P)(N^N)]+ cations in their electronic ground state (S0) were optimized at the DFT B3LYP-D3/(def2svp + def2tzvp) level in the presence of the solvent (CH2Cl2) and without imposing any symmetry restriction (see the Experimental section for full computational details). The values obtained for the most representative geometrical parameters defining the Cu(I) coordination sphere are summarized in Table S1.† Calculations successfully reproduce the distorted tetrahedral structures observed experimentally around the Cu centre for all the studied complexes. Compared with the values from X-ray diffraction, the Cu–N and Cu–P bond distances and the P–Cu–P and N–Cu–N chelating angles are calculated with errors below 0.05 Å and 2°, respectively. The angle formed by the P–Cu–P and N–Cu–N planes, which can be used as an indication of the deviation from the orthogonal disposition of the P^P and N^N ligands, has values lying between 82 and 89°, in good agreement with those observed experimentally and with those computed in previous works for similar complexes.24,26,66 The N–C–C–N torsion angles remain in a small range between −10 and 14° indicating that the bpy ligand is essentially planar in all the cations. In contrast to the experimental results (Table 1), the cations containing the xantphosMes2 ligand do not feature significantly more twisted bpy ligands (Table S1†), suggesting that the packing forces play an important role in determining the structure in the crystal. Theoretical calculations correctly reproduce the longer Cu–P bond distances observed for these complexes, and the spatial proximity of the equatorial mesityl group to the bpy unit shown in Fig. 3. The differences in the torsion angles between theoretical and X-ray geometries are probably due to the fact that the former are obtained for an isolated molecule optimized in solution and do not take into account the packing forces and intermolecular interactions acting in the solid state.Two geometry minima were found for [Cu(xantphosMes2)(6-Mebpy)]+, which show a different relative orientation of the 6-Mebpy ligand and correspond to the two conformations observed in the single-crystal structure determination (Fig. 5). They possess close energies, the conformation with the 6-methyl group lying over the xanthene bowl being more stable that with the Me group away from the xanthene unit by only 0.28 kcal mol−1. This is in good agreement with the occupancy of 50% experimentally found for each conformation as discussed above.
The geometry of the first triplet excited state (T1) was also optimized at the UB3LYP level for all the [Cu(P^P)(N^N)]+ cations, and the most significant geometry parameters are also included in Table S1.† The molecular geometries in the T1 state significantly differ from those in the ground state S0. As discussed below, the T1 state implies a charge transfer from a molecular orbital that mainly involves a d orbital of the Cu atom to a molecular orbital spreading over the bpy ligand. Consequently, the metal atom is partially oxidized and tends to adopt the square-planar coordination sphere expected for four-coordinate d9 Cu(II) complexes, instead of the tetrahedral conformation typical of d10 Cu(I) coordination complexes. This effect can be studied by following the changes in the angle formed by the N–Cu–N and P–Cu–P planes, which decreases in going from S0 to T1 as the molecule becomes more planar (Table S1†). The distortion degree from the tetrahedral structure in going from S0 to T1 is indeed limited by number of methyl groups in the 6,6′-positions of the bpy ligand, because substituents in these positions impede the movement of the ligands towards more planar dispositions.24 In this way, the [Cu(tBu2xantphos)(bpy)]+ complex, with no substituent in the 6,6′-positions, shows the largest reduction (25.6°) passing from 82.8° in S0 to 57.2° in T1. The [Cu(tBu2xantphos)(6-Mebpy)]+ complex, including one Me group in the 6-position, undergoes a smaller reduction of 23.3° (from 87.9 to 64.6°), and the [Cu(tBu2xantphos)(6,6′-Me2bpy)]+ complex, featuring Me substituents in both the 6- and 6′-positions, shows a reduction of only 15.4° (from 86.1 to 70.7°). Thus, the presence of Me groups in the 6- and 6′-positions strongly affects the degree of geometrical relaxation of the T1 excited state, and limits its stabilization. The energy position of the T1 state relative to S0, and thereby the emission properties of the complexes, therefore depend not only on the electron-donating or electron-withdrawing character of the substituent groups present in the ligands but also on the positions where the substituents are introduced and on the structural effects they induce.
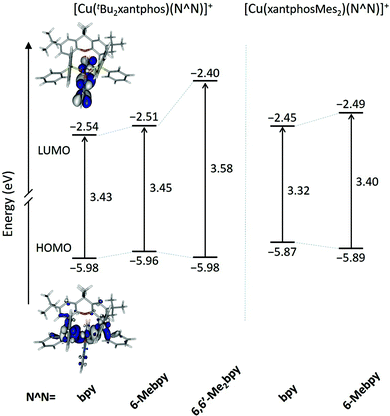
Fig. 10 shows the evolution of the energy calculated for the highest-occupied (HOMO) and lowest-unoccupied molecular orbital (LUMO) of the five complexes. The atomic orbital composition of the molecular orbitals remains almost unchanged along the series and only the contour plots computed for [Cu(tBu2xantphos)(bpy)]+ are displayed as a representative example. As reported previously for similar copper(I) complexes,24,26,66 the HOMO appears mainly centred on the metal with a small contribution from the phosphorus atoms, and the LUMO spreads over the bpy ligand. The addition of tBu groups to the xantphos moiety has a negligible effect on the energy of the HOMO, and the [Cu(tBu2xantphos)(N^N)]+ (N^N = bpy, 6-Mebpy and 6,6′-Me2bpy) complexes have a slightly higher HOMO energy, around −5.97 eV (Fig. 10), than that calculated for the reference complex [Cu(xantphos)(bpy)]+ (−6.00 eV) at the same theoretical level.66 Replacement of PPh2 moieties by PPhMes groups in the xantphos ligand has a more significant effect moving up the HOMO of [Cu(xantphosMes2)(bpy)]+ and [Cu(xantphosMes2)(6-Mebpy)]+ to −5.81 and −5.89 eV, respectively. There are small changes in this energy within each series, as the structural changes introduced in the complexes are made in regions where the HOMO is not centered. The HOMO energies, even considering the small changes described, are quite close, in good agreement with the close Eox1/2 values reported for the complexes in the Electrochemistry section. The LUMO undergoes a small destabilization when a Me group (a weak electron donor) is added to the bpy ligand, a destabilization that becomes more pronounced when a second group is added. The HOMO–LUMO energy gap increases in the [Cu(tBu2xantphos)(N^N)]+ series with the number of Me substituents of the bpy ligand in agreement with the experimental CV data (Table 2). It is therefore expected that excited states described by HOMO → LUMO transitions appear at bluer wavelengths as more Me groups are attached to the N^N ligand.
Photophysical properties
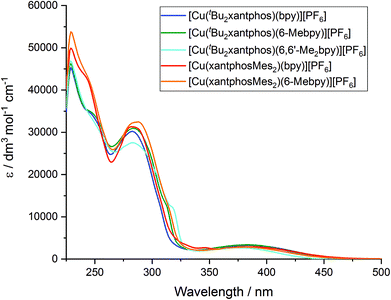
The solution absorption spectra of the [Cu(P^P)(N^N)][PF6] complexes in CH2Cl2 are shown in Fig. 11. The intense bands below 330 nm are assigned to ligand-based n → π* and π → π* transitions and vary little within a series of a certain phosphane ligand. The broad absorption at around 380 nm (Table 3) arises from a metal-to-ligand charge transfer (MLCT) excitation. In the series [Cu(tBu2xantphos)(N^N)][PF6], the MLCT absorption slightly shifts to higher energies on going from bpy to 6-Mebpy and to 6,6′-Me2bpy (see Fig. S23†) as has previously been observed for the analogous [Cu(xantphos)(N^N)][PF6] series.26 This behaviour is also observed in passing from [Cu(xantphosMes2)(bpy)][PF6] to [Cu(xantphosMes2)(6-Mebpy)][PF6], and is in good agreement with the electrochemical properties discussed above.| CH2Cl2 solutiona,b | Powderb | Me-THF at 77 K | Thin film | |||||||||
|---|---|---|---|---|---|---|---|---|---|---|---|---|
| Complex cation | UV-Vis MLCT λmax/nm | λ maxem/nm | PLQY (non-degassed/degassed)% | τ 1/2(av)a,b (non-degassed/degassed)/μs | λ maxem/nm | PLQY/% | τ 1/2(av)a,b/μs | λ maxem/nm | PLQY/% | τ 1/2(av)a,b/μs | λ maxem/nm | PLQY/% |
| a Solution concentration = 2.5 × 10⁻⁵ mol dm−3 unless stated otherwise. sh = shoulder. b λ exc = 365 nm. c Solution concentration = 5.0 × 10⁻⁵ mol dm−3. d Values taken from ref. 24. e Values taken from ref. 26. f Biexponential fit using the equation τ1/2(av) = ΣAiτi/ΣAi where Ai is the pre-exponential factor for the lifetime. | ||||||||||||
| [Cu(tBu2xantphos)(bpy)]+ | 384 | 652 | 0.3/0.4 | — | 584 | 3.0 | 1.95f | 597 | 7 | 27.6 | — | < 1 |
| [Cu(tBu2xantphos)(6-Mebpy)]+ | 382 | 605, 628sh | 0.4/0.9 | 0.205/0.581 | 552 | 16 | 6.32f | 578 | 25 | 56.3 | 569 | 6 |
| [Cu(tBu2xantphos)(6,6′-Me2bpy)]+ | 375 | 566c | 0.6/2.4c | 0.222/1.05c | 522 | 59 | 13.8f | 555 | 46 | 92.1 | 550 | 23 |
| [Cu(xantphosMes2)(bpy)]+ | 385 | 655c | 0.2/0.2c | — | 589 | 1.9 | 1.19f | 594 | 11 | 20.0 | 594 | < 1 |
| [Cu(xantphosMes2)(6-Mebpy)]+ | 381 | 645, 623shc | 0.3/0.4c | 0.115/0.213 | 547 | 26 | 6.62f | 587 | 19 | 19.7 | 584 | 6 |
[Cu(xantphos)(bpy)]+![[thin space (1/6-em)]](https://www.rsc.org/images/entities/char_2009.gif) d d |
383 | 620, 650 | 0.5/0.5 | 0.075/0.104 | 587 | 1.7 | 1.3 | 613 | — | 11 | — | — |
[Cu(xantphos)(6-Mebpy)]+![[thin space (1/6-em)]](https://www.rsc.org/images/entities/char_2009.gif) e e |
379 | 635, 605 | 1.0/1.8 | 0.27/0.78 | 547 | 34 | 9.6 | — | — | — | 574 | 9.7.7 |
[Cu(xantphos)(6,6′-Me2bpy)]+![[thin space (1/6-em)]](https://www.rsc.org/images/entities/char_2009.gif) e e |
378 | 635, 606 | 1.6/10 | 0.45/3.4 | 539 | 37 | 11 | — | — | — | 555 | 21.8 |
To get a better understanding of the nature of the electronic excited states involved in the absorption spectra, the time-dependent DFT (TD-DFT) approach was used to study the lowest lying singlet (Sn) and triplet (Tn) excited states. Table 4 collects the energies and oscillator strengths (f) computed for the S1 and T1 states of all the complexes, together with those obtained for [Cu(xantphos)(bpy)]+ included as a reference. In all cases, both the S1 and the T1 state result from the HOMO → LUMO monoexcitation, with a contribution exceeding 95%. This excitation implies an electron transfer from the Cu(P^P) moiety of the complex to the bpy ligand, supporting the MLCT character of S1 and T1. The broad absorption band observed experimentally at around 380 nm therefore originates in the S0 → S1 transition, and the calculated values, although somewhat displaced to the red, reproduce the experimentally observed shift of the absorption maxima to bluer wavelengths as the number of Me substituents of the bpy ligand increases. This is also in good accord with the increase of the HOMO–LUMO gap along each series of complexes predicted above (Fig. 10).
| Complex cation | S1 | T1 |
|---|---|---|
| E (eV nm−1) (f) | E (eV) | |
| [Cu(xantphos)(bpy)]+ | 2.816/440 (0.08) | 2.569 |
| [Cu(tBu2xantphos)(bpy)]+ | 2.803/442 (0.09) | 2.554 |
| [Cu(tBu2xantphos)(6-Mebpy)]+ | 2.823/439 (0.10) | 2.577 |
| [Cu(tBu2xantphos)(6,6′-Me2bpy)]+ | 2.923/424 (0.07) | 2.694 |
| [Cu(xantphosMes2)(bpy)]+ | 2.664/465 (0.06) | 2.470 |
| [Cu(xantphosMes2)(6-Mebpy)]+ | 2.750/451 (0.06) | 2.582 |
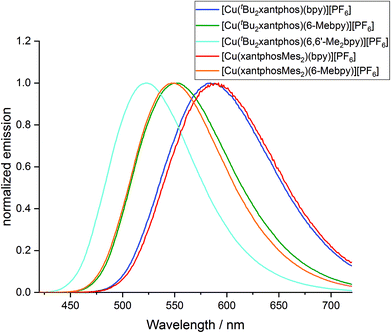
The powder and solution emission spectra are displayed in Fig. 12 and S24,† respectively, and data are given in Table 3. Upon excitation into the MLCT region (λexc = 365 nm), all the compounds show an emission in the orange to yellow region. On going from [Cu(tBu2xantphos)(bpy)][PF6] to [Cu(tBu2xantphos)(6-Mebpy)][PF6] to [Cu(tBu2xantphos)(6,6′-Me2bpy)][PF6], or from [Cu(xantphosMes2)(bpy)][PF6] to [Cu(xantphosMes2)(6-Mebpy)][PF6], the introduction of additional methyl groups in the bpy ligand shifts the emission to higher energies (Table 3). Additionally, the photoluminescent quantum yield (PLQY) increases for solution and especially for powder emission along the series (Table 3). [Cu(tBu2xantphos)(bpy)][PF6] and [Cu(xantphosMes2)(bpy)][PF6], just like [Cu(xantphos)(bpy)][PF6],24 exhibit low PLQY values, especially in solution. This is most probably due to the accessibility of the copper centre, which leads to solvent quenching of the excited state. Consequently, PLQY values in the powder samples are higher than in solution. The emission in the solid state is in all cases blue-shifted compared to the solution emission. This trend has also been observed for related complexes containing POP or xantphos.25,26
The theoretical results reproduce the trends observed in the experimental emission spectra. The emitting T1 state shifts to higher energies as more methyl groups are added to the bpy ligand (Table 4). The [Cu(tBu2xantphos)(6,6′-Me2bpy)]+ complex is predicted to have the higher energy T1, followed by [Cu(tBu2xantphos)(6-Mebpy)]+ and [Cu(xantphosMes2)(6-Mebpy)]+, and finally by the complexes with no methyl substituent. This is in good agreement with the emission wavelengths observed in experimental spectra (Table 3). The broad and mostly unstructured shape of the emission band (Fig. S24†) also agrees with the MLCT nature predicted for the emitting HOMO → LUMO T1 state.
As discussed above, the geometry relaxation of the emitting T1 state leads to the flattening of the tetrahedral coordination environment. This flattening is more hindered as the number of methyl substituents attached to positions 6 and 6′ of the bpy ligand is increased, and the relaxation of the T1 triplet is impeded thus leading to higher emission energies. Inspection of Table 3 shows that increasing the steric hindrance of the bpy ligand is beneficial for the emissive properties. Less flattening of the tetrahedral coordination environment of the copper centre gives rise to higher emission energies and, as expected, longer excited state lifetimes and higher PLQYs. The same is true for the series of [Cu(xantphos)(N^N)][PF6] (Table 3).24,26 However, from a synthetic point of view, the unsuccessful attempt to [Cu(xantphosMes2)(6,6′-Me2bpy)][PF6] demonstrates a limitation in the combined steric properties of the xantphosMes2 and 6,6′-Me2bpy ligands.
The photophysical properties of [Cu(tBu2xantphos)(bpy)][PF6] and [Cu(xantphosMes2)(bpy)][PF6] are similar both in solution and in the solid state (Table 3). In the case of the [Cu(P^P)(6-Mebpy)][PF6] complexes, a similar behaviour is observed in the solid state emission. Both complexes are blue shifted compared to their [Cu(P^P)(bpy)][PF6] analogues but the emission profile is still very similar and the difference in peak position is again low (Δλ = 5 nm). It is notable that the shift difference when going from [Cu(P^P)(bpy)][PF6] to [Cu(P^P)(6-Mebpy)][PF6] complexes is larger in the complexes containing xantphosMes2 (Δλ = 42 nm) compared to tBu2xantphos complexes (Δλ = 32 nm). On the other hand, the solution emission profiles differ significantly for the two [Cu(P^P)(6-Mebpy)][PF6] complexes (Fig. S24†). The emission maximum of [Cu(tBu2xantphos)(6-Mebpy)] is blue shifted compared to [Cu(tBu2xantphos)(bpy)] (Δλ = 47 nm) as expected, but in the case of [Cu(xantphosMes2)(6-Mebpy)][PF6] the emission maximum is blue-shifted very little compared to [Cu(xantphosMes2)(bpy)][PF6] (Δλ = 10 nm). Both [Cu(tBu2xantphos)(6-Mebpy)][PF6] and [Cu(xantphosMes2)(6-Mebpy)][PF6] also show a second unstructured emission feature at 628 nm and 623 nm respectively, which is not observed in the solid-state emission profile.
To investigate whether the compounds showed thermally activated delayed fluorescence (TADF) at room temperature, low temperature emission spectra and excited state lifetimes were recorded in frozen Me-THF at 77 K (Table 3 and Fig. 13). All complexes show a red shift in emission of 5–40 nm compared to the solid state emission and a greatly enlarged excited state lifetime. This indicates the possibility that all complexes are TADF emitters at room temperature. The energy difference between the lowest energy singlet and triplet excited states has been calculated to lie between 0.17 and 0.25 eV (Table 4), and is small enough to allow the occurrence of TADF processes.22
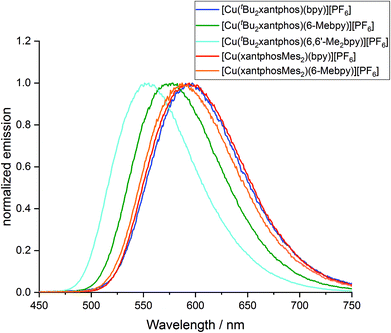 | ||
| Fig. 13 Normalized emission spectra of [Cu(P^P)(N^N)][PF6] complexes in Me-THF at 77 K (λexc = 410 nm). | ||
Low temperature data further support the idea that the position of the emission bands of the [Cu(tBu2xantphos)(N^N)] complexes is strongly affected by the flattening of the tetrahedral environment in the T1 state. In solution, this flattening is not impeded and the difference in peak position between [Cu(tBu2xantphos)(bpy)][PF6] and [Cu(tBu2xantphos)(6-Mebpy)][PF6] is 86 nm (0.30 eV) (Table 3). In powder, the flattening is more restricted and the difference decreases to 62 nm (0.25 eV). Finally, at 77 K, where the relaxation is even more impeded for all the complexes, the emission maxima range between 597 and 555 nm, in a window of just 42 nm (0.15 eV).
Device performances
The series of compounds was tested in LECs using ITO/PEDOT:PSS as the anode, an emitting layer consisting of the complex in the presence of [Emim][PF6] (4![[thin space (1/6-em)]](https://www.rsc.org/images/entities/char_2009.gif) :
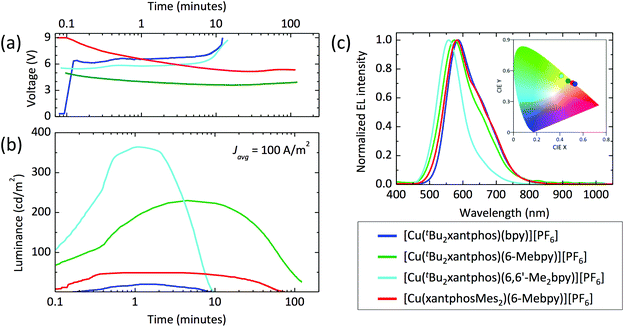
:![[thin space (1/6-em)]](https://www.rsc.org/images/entities/char_2009.gif) 1 molar ratio) and an aluminium cathode. Devices were tested monitoring the electroluminescence and voltage over time, and were driven with a pulsed current (100 A m−2 average, 50% duty cycle, 1 kHz). The main device parameters obtained for the entire samples series are reported in Table 5. The time evolution of the voltage and luminance for the LECs are reported in Fig. 14, together with the electroluminescence spectra. All LECs based on copper(I) complexes with tBu2xantphos as the P^P ligand show a fast luminescence turn-on time (ton, defined here as the time to reach the maximum luminance), ranging from 1 minute for the complex with 6,6′-Me2bpy to 4.5 minutes for the one with 6-Mebpy (Fig. 14b). The maximum luminance registered for these compounds increases with increasing substitution to the N^N ligand, going from 20 cd m−2 for the complex with unsubstituted bpy, to 230 cd m−2 and 370 cd m−2 for the ones containing 6-Mebpy and 6,6′-Me2bpy, respectively. This trend follows that of the PLQY registered for the same compounds (Table 3) and is consistent with an augmented steric hindrance of the N^N ligand, resulting in a higher stabilization of the tetrahedral complex geometry. The highest efficiency of 3.7 cd A−1 for the LECs using [Cu(tBu2xantphos)(6,6′-Me2bpy)][PF6] corresponds to an external quantum efficiency of 1.0%, which is substantially lower as compared to the PLQY of the same compound in thin-film (23%). This implies that even in such bright device, non-radiative losses dominate the recombination of the injected electrons and holes. Interestingly, the quantum efficiencies for photo- and electro-luminescence of the [Cu(tBu2xantphos)(6,6′-Me2bpy)][PF6] are very close to the unsubstituted xantphos analogue (PLQY = 22% and maximum EQE = 1.0%),26 highlighting the dominant role of the N^N ligands on the optical and optoelectronic properties of these compounds.
1 molar ratio) and an aluminium cathode. Devices were tested monitoring the electroluminescence and voltage over time, and were driven with a pulsed current (100 A m−2 average, 50% duty cycle, 1 kHz). The main device parameters obtained for the entire samples series are reported in Table 5. The time evolution of the voltage and luminance for the LECs are reported in Fig. 14, together with the electroluminescence spectra. All LECs based on copper(I) complexes with tBu2xantphos as the P^P ligand show a fast luminescence turn-on time (ton, defined here as the time to reach the maximum luminance), ranging from 1 minute for the complex with 6,6′-Me2bpy to 4.5 minutes for the one with 6-Mebpy (Fig. 14b). The maximum luminance registered for these compounds increases with increasing substitution to the N^N ligand, going from 20 cd m−2 for the complex with unsubstituted bpy, to 230 cd m−2 and 370 cd m−2 for the ones containing 6-Mebpy and 6,6′-Me2bpy, respectively. This trend follows that of the PLQY registered for the same compounds (Table 3) and is consistent with an augmented steric hindrance of the N^N ligand, resulting in a higher stabilization of the tetrahedral complex geometry. The highest efficiency of 3.7 cd A−1 for the LECs using [Cu(tBu2xantphos)(6,6′-Me2bpy)][PF6] corresponds to an external quantum efficiency of 1.0%, which is substantially lower as compared to the PLQY of the same compound in thin-film (23%). This implies that even in such bright device, non-radiative losses dominate the recombination of the injected electrons and holes. Interestingly, the quantum efficiencies for photo- and electro-luminescence of the [Cu(tBu2xantphos)(6,6′-Me2bpy)][PF6] are very close to the unsubstituted xantphos analogue (PLQY = 22% and maximum EQE = 1.0%),26 highlighting the dominant role of the N^N ligands on the optical and optoelectronic properties of these compounds.
| [Cu(P^P)(N^N)]+ | t on (min) | Lummax (cd m−2) | t 1/2 (min) | Eff. (cd A−1) |
|---|---|---|---|---|
| [Cu(tBu2xantphos)(bpy)]+ | 1.1 | 20 | 5.1 | 0.2 |
| [Cu(tBu2xantphos)(6-Mebpy)]+ | 4.5 | 230 | 53.8 | 2.3 |
| [Cu(tBu2xantphos)(6,6′-Me2bpy)]+ | 1.0 | 370 | 4.9 | 3.7 |
| [Cu(xantphosMes2)(6-Mebpy)]+ | 0.7 | 50 | 34.6 | 0.5 |
In general, the device lifetime (t1/2, time to decay to one-half of the peak luminance) for complexes containing tBu2xantphos was found to be low, approximately 5 minutes in the cases of bpy and 6,6′-Me2bpy and above 50 minutes for the LECs with [Cu(tBu2xantphos)(6-Mebpy)][PF6]. The low lifetime of the complexes with bpy and 6,6′-Me2bpy might be due to a reduced stability of the materials toward charge transport, as seen from the corresponding LECs voltage profile which drastically increases after only few minutes of operation (Fig. 14a).
The optoelectronic performance of complexes containing the xantphosMes2 ligand were in general lower as compared to those involving tBu2xantphos. We could not observe any electroluminescence from [Cu(xantphosMes2)(bpy)][PF6], perhaps due to its low PLQY both in solution and in the solid state. Moderate electroluminescence was measured for [Cu(xantphosMes2)(6-Mebpy)][PF6], with fast turn-on (<1 minute) and a maximum luminance of 50 cd m−2.
The spectral shape and position of the electroluminescence (EL, Fig. 14c) signals correlate with the PL maxima observed for the complexes in solution and in the solid state. For the tBu2xantphos-containing complexes, the EL maxima blue-shift from 584 nm to 575 and 557 nm when increasing the substitution at the bpy, i.e. going from bpy to 6-Mebpy and 6,6′-Me2bpy, respectively. As highlighted in the inset of Fig. 14c, this shift corresponds to a colour variation from the orange to the green region of the CIE 1931 colour space. The EL spectrum of [Cu(xantphosMes2)(6-Mebpy)][PF6] peaks at 582 nm, in agreement with the PL signal of the thin-film (Table 3).
Conclusions
We have prepared [Cu(tBu2xantphos)(bpy)][PF6], [Cu(tBu2xantphos)(6-Mebpy)][PF6], [Cu(tBu2xantphos)(6,6′-Me2bpy)][PF6], [Cu(xantphosMes2)(bpy)][PF6] and [Cu(xantphosMes2)(6-Mebpy)][PF6], but steric effects militate against the isolation of [Cu(xantphosMes2)(6,6′-Me2bpy)][PF6]. To prepare the latter, the chiral xantphosMes2 was prepared and characterized, and the single crystal structure reveals the presence of the (rac)-form. In solution, one dominant diastereoisomer is observed, proposed as the (rac) rather than the (meso)-form. This makes the bisphosphane preorganized to give particular diastereoisomers when coordinated to copper(I) in [Cu(xantphosMes2)(N^N]+ complexes. Single crystal structures of four complexes were determined. In [Cu(xantphosMes2)(6-Mebpy)][PF6], the 6-Mebpy unit is disordered over two orientations with 50% occupancies. The disorder corresponds to a combination of two dynamic processes, which the [Cu(xantphosMes2)(N^N)]+ cations undergo in solution. DFT calculations reveal that the energy difference between the two conformers observed in the solid-state structure differ only by 0.28 kcal mol−1.The [Cu(P^P)(N^N)][PF6] compounds show a broad MLCT-absorption around 380 nm which shifts to higher energies on going from bpy to 6-Mebpy to 6,6′-Me2bpy. Upon excitation into the MLCT band, the [Cu(P^P)(N^N][PF6] complexes emit in the yellow to orange region; additional Me groups in the bpy ligand result in a blue-shift in the emission. The MLCT nature of the absorption and emission is supported by DFT calculations, which associate the lowest-energy S1 and T1 excited states to the HOMO → LUMO monoexcitation implying an electron transfer from the Cu(P^P) moiety to the bpy ligand. In solution, PLQY values are low, but in the solid state, PLQYs of 26 and 59% are observed for [Cu(xantphosMes2)(6-Mebpy)][PF6] and [Cu(tBu2xantphos)(6,6′-Me2bpy)]+, respectively, compared to benchmark values of 34 and 37% for [Cu(xantphos)(6-Mebpy)][PF6] and [Cu(xantphos)(6,6′-Me2bpy)][PF6]. Increased excited state lifetimes at low temperature are consistent with the complexes being TADF emitters and this is supported by a calculated energy difference between S1 and T1 of 0.17–0.25 eV.
The compounds were tested in simple bilayer LECs. The optoelectronic performance of complexes containing the xantphosMes2 ligand were generally lower than those with tBu2xantphos, which led to bright and efficient devices. The current efficiency of the LECs follows the trend observed for the PLQY, increasing with increasing substitution at the bpy ligand. In particular, luminances as high as 370 cd m−2 were obtained for the complex [Cu(tBu2xantphos)(6,6′-Me2bpy)][PF6], which correspond to an efficiency of 3.7 cd A−1. These encouraging results suggest that tBu2xantphos is a promising ligand to develop novel and efficient copper emitters for LECs and OLEDs.
Conflicts of interest
There are no conflicts to declare.Acknowledgements
Financial support from the Swiss National Science Foundation (Grant number 162631), the University of Basel, the MINECO of Spain (CTQ2015-71154-P, MAT2017-88821-R and Unidad de Excelencia María de Maeztu MDM-2015-0538), the Generalitat Valenciana (PROMETEO/2016/ 135) and European FEDER funds (CTQ2015-71154-P) is acknowledged. Prof. Dr Oliver S. Wenger and Dr Christopher B. Larsen (Universty of Basel) are thanked for the use of the LP920-KS instrument from Edinburgh Instruments for low-temperature emission and lifetime measurements. MS thanks the MINECO for his RyC contract. Dr Sarah Keller is acknowledged for fruitful discussions and synthetic assistance. Kenneth Atz and PD Dr Daniel Häussinger are acknowledged for assistance with variable temperature NMR measurements.Notes and references
- M. Y. Wong and E. Zysman-Colman, Adv. Mater., 2017, 29, 1605444 CrossRef PubMed.
- C. Bizzarri, E. Spuling, D. M. Knoll, D. Volz and S. Bräse, Coord. Chem. Rev., 2018, 373, 49 CrossRef CAS.
- D. Volz, M. Wallesch, C. Fléchon, M. Danz, A. Verma, J. M. Navarro, D. M. Zink, S. Bräse and T. Baumann, Green Chem., 2015, 17, 1988 RSC.
- E. Fresta and R. D. Costa, J. Mater. Chem. C, 2017, 5, 5643 RSC.
- S. Tang and L. Edman, Top. Curr. Chem., 2016, 374, 40 CrossRef PubMed.
- J. Wu, F. Li, Q. Zeng, C. Nie, P. C. Ooi, T. Guo, G. Shan and Z. Su, Org. Electron., 2016, 28, 314 CrossRef CAS.
- A. Sandström and L. Edman, Energy Technol., 2015, 3, 329 CrossRef.
- Light-emitting electrochemical cells: Concepts, advances and challenges, ed. R. D. Costa, Springer, Cham, 2017 Search PubMed.
- R. D. Costa, E. Ortí, H. J. Bolink, F. Monit, G. Accorsi and N. Armaroli, Angew. Chem., Int. Ed., 2012, 51, 8178 CrossRef CAS PubMed.
- C. E. Housecroft and E. C. Constable, Coord. Chem. Rev., 2017, 350, 155 CrossRef CAS.
- A. M. Bünzli, E. C. Constable, C. E. Housecroft, A. Prescimone, J. A. Zampese, G. Longo, L. Gil-Escrig, A. Pertegás, E. Ortí and H. J. Bolink, Chem. Sci., 2015, 6, 2843 RSC.
- D. Tordera, A. M. Bünzli, A. Pertegás, J. M. Junquera-Hernández, E. C. Constable, J. A. Zampese, C. E. Housecroft, E. Ortí and H. J. Bolink, Chem. – Eur. J., 2013, 19, 8597 CrossRef CAS PubMed.
- S. B. Meier, D. Tordera, A. Pertegás, C. Roldán-Carmona, E. Ortí and H. J. Bolink, Mater. Today, 2014, 17, 217 CrossRef CAS.
- B. N. Bideh, C. Roldán-Carmona, H. Shahroosvand and M. K. Nazeeruddin, Dalton Trans., 2016, 45, 7195 RSC.
- M. T. Buckner and D. R. McMillin, J. Chem. Soc., Chem. Commun., 1978, 759 RSC.
- R. A. Rader, D. R. McMillin, M. T. Buckner, T. G. Matthews, D. J. Casadonte, R. K. Lengel, S. B. Whittaker, L. M. Darmon and F. E. Lytle, J. Am. Chem. Soc., 1981, 103, 5906 CrossRef CAS.
- C. L. Linfoot, M. J. Leitl, P. Richardson, A. F. Rausch, O. Chepelin, F. J. White, H. Yersin and N. Robertson, Inorg. Chem., 2014, 53, 10854 CrossRef CAS PubMed.
- M. J. Leitl, V. a. Krylova, P. I. Djurovich, M. E. Thompson and H. Yersin, J. Am. Chem. Soc., 2014, 136, 16032 CrossRef CAS PubMed.
- R. Czerwieniec and H. Yersin, Inorg. Chem., 2015, 54, 4322 CrossRef CAS PubMed.
- T. Hofbeck, U. Monkowius and H. Yersin, J. Am. Chem. Soc., 2015, 137, 399 CrossRef CAS PubMed.
- R. Czerwieniec, M. J. Leitl, H. H. H. Homeier and H. Yersin, Coord. Chem. Rev., 2016, 325, 2 CrossRef CAS.
- H. Yersin, R. Czerwieniec, M. Z. Shafikov and A. F. Suleymanova, ChemPhysChem, 2017, 18, 3508 CrossRef CAS PubMed.
- J. Liu, J. Oliva, K. Tong, F. Zhao, D. Chen and Q. Pei, Sci. Rep., 2017, 7, 1524 CrossRef PubMed.
- S. Keller, F. Brunner, J. M. Junquera-Hernández, A. Pertegás, M.-G. La-Placa, A. Prescimone, E. C. Constable, H. J. Bolink, E. Ortí and C. E. Housecroft, ChemPlusChem, 2018, 83, 217 CrossRef CAS.
- S. Keller, E. C. Constable, C. E. Housecroft, M. Neuburger, A. Prescimone, G. Longo, A. Pertegás, M. Sessolo and H. J. Bolink, Dalton Trans., 2014, 43, 16593 RSC.
- S. Keller, A. Pertegás, G. Longo, L. Martínez, J. Cerdá, J. M. Junquera-Hernández, A. Prescimone, E. C. Constable, C. E. Housecroft, E. Ortí and H. J. Bolink, J. Mater. Chem. C, 2016, 4, 3857 RSC.
- M. D. Weber, M. Viciano-Chumillas, D. Armentano, J. Cano and R. D. Costa, Dalton Trans., 2017, 46, 6312 RSC.
- E. Fresta and R. D. Costa, J. Mater. Chem. C, 2017, 5, 5643 RSC.
- M. Heberle, S. Tschierlei, N. Rockstroh, M. Ringenberg, W. Frey, H. Junge, M. Beller, S. Lochbrunner and M. Karnahl, Chem. – Eur. J., 2017, 23, 312 CrossRef CAS PubMed.
- N. Armaroli, G. Accorsi, M. Holler, O. Moudam, J.-F. Nierengarten, Z. Zhou, R. T. Wegh and R. Welter, Adv. Mater., 2006, 18, 1313 CrossRef CAS.
- F. Brunner, L. Martínez-Sarti, S. Keller, A. Pertegás, A. Prescimone, E. C. Constable, H. J. Bolink and C. E. Housecroft, Dalton Trans., 2016, 45, 15180 RSC.
- F. Brunner, S. Graber, Y. Baumgartner, D. Häussinger, A. Prescimone, E. C. Constable and C. E. Housecroft, Dalton Trans., 2017, 46, 6379 RSC.
- C. Yi, S. Xu, J. Wang, F. Zhao, H. Xia and Y. Wang, Eur. J. Inorg. Chem., 2016, 2016, 4885 CrossRef.
- R. Czerwieniec, J. Yu and H. Yersin, Inorg. Chem., 2011, 50, 8293 CrossRef CAS PubMed.
- Q. Zhang, Q. Zhou, Y. Cheng, L. Wang, D. Ma, X. Jing and F. Wang, Adv. Funct. Mater., 2006, 16, 1203 CrossRef CAS.
- R. D. Costa, D. Tordera, E. Ortí, H. J. Bolink, J. Schönle, S. Graber, C. E. Housecroft, E. C. Constable and J. A. Zampese, J. Mater. Chem., 2011, 21, 16108 RSC.
- S. Keller, A. Prescimone, E. C. Constable and C. E. Housecroft, Photochem. Photobiol. Sci., 2018, 17, 375 RSC.
- A. M. Johns, N. Sakai, A. Ridder and J. F. Hartwig, J. Am. Chem. Soc., 2006, 128, 9306 CrossRef CAS PubMed.
- C. A. Tolman, Chem. Rev., 1977, 77, 313 CrossRef CAS.
- G. J. Kubas, Inorg. Synth., 1979, 19, 90 CAS.
- W. Bruker Analytical X-ray Systems, Inc., APEX2, version 2 User Manual, M86-E01078, Madison, 2006 Search PubMed.
- P. W. Betteridge, J. R. Carruthers, R. I. Cooper, K. Prout and D. J. Watkin, J. Appl. Crystallogr., 2003, 36, 1487 CrossRef CAS.
- I. J. Bruno, J. C. Cole, P. R. Edgington, M. Kessler, C. F. Macrae, P. McCabe, J. Pearson and R. Taylor, Acta Crystallogr., Sect. B: Struct. Sci., 2002, 58, 389 CrossRef.
- C. F. Macrae, I. J. Bruno, J. A. Chisholm, P. R. Edgington, P. McCabe, E. Pidcock, L. Rodriguez-Monge, R. Taylor, J. van de Streek and P. A. Wood, J. Appl. Crystallogr., 2008, 41, 466 CrossRef CAS.
- A. L. Spek, Acta Crystallogr., Sect. C: Struct. Chem., 2015, 71, 9 CrossRef CAS PubMed.
- M. J. Frisch, G. W. Trucks, H. B. Schlegel, G. E. Scuseria, M. A. Robb, J. R. Cheeseman, G. Scalmani, V. Barone, G. A. Petersson, H. Nakatsuji, X. Li, M. Caricato, A. V. Marenich, J. Bloino, B. G. Janesko, R. Gomperts, B. Mennucci, H. P. Hratchian, J. V. Ortiz, A. F. Izmaylov, J. L. Sonnenberg, D. Williams-Young, F. Ding, F. Lipparini, F. Egidi, J. Goings, B. Peng, A. Petrone, T. Henderson, D. Ranasinghe, V. G. Zakrzewski, J. Gao, N. Rega, G. Zheng, W. Liang, M. Hada, M. Ehara, K. Toyota, R. Fukuda, J. Hasegawa, M. Ishida, T. Nakajima, Y. Honda, O. Kitao, H. Nakai, T. Vreven, K. Throssell, J. A. Montgomery Jr., J. E. Peralta, F. Ogliaro, M. J. Bearpark, J. J. Heyd, E. N. Brothers, K. N. Kudin, V. N. Staroverov, T. A. Keith, R. Kobayashi, J. Normand, K. Raghavachari, A. P. Rendell, J. C. Burant, S. S. Iyengar, J. Tomasi, M. Cossi, J. M. Millam, M. Klene, C. Adamo, R. Cammi, J. W. Ochterski, R. L. Martin, K. Morokuma, O. Farkas, J. B. Foresman and D. J. Fox, Gaussian 16, Revision A.03, Gaussian, Inc., Wallingford CT, 2016 Search PubMed.
- C. Lee, W. Yang and R. G. Parr, Phys. Rev. B: Condens. Matter Mater. Phys., 1988, 37, 785 CrossRef CAS.
- A. D. Becke, J. Chem. Phys., 1993, 98, 5648 CrossRef CAS.
- F. Weigend and R. Ahlrichs, Phys. Chem. Chem. Phys., 2005, 7, 3297 RSC.
- F. Weigend, Phys. Chem. Chem. Phys., 2006, 8, 1057 RSC.
- S. Grimme, J. Antony, S. Ehrlich and H. Krieg, J. Chem. Phys., 2010, 132, 154104 CrossRef PubMed.
- S. Grimme, S. Ehrlich and L. Goerigk, J. Comput. Chem., 2011, 32, 1456 CrossRef CAS PubMed.
- M. Petersilka, U. J. Gossmann and E. K. U. Gross, Phys. Rev. Lett., 1996, 76, 1212 CrossRef CAS PubMed.
- C. Jamorski, M. E. Casida and D. R. Salahub, J. Chem. Phys., 1996, 104, 5134 CrossRef CAS.
- M. E. Casida, C. Jamorski, K. C. Casida and D. R. Salahub, J. Chem. Phys., 1998, 108, 4439 CrossRef CAS.
- J. Tomasi and M. Persico, Chem. Rev., 1994, 94, 2027 CrossRef CAS.
- C. J. Cramer and D. G. Truhlar, in Solvent Effects and Chemical Reactivity, ed. O. Tapia and J. Bertrán, Kluwer, 1996, pp. 1–80 Search PubMed.
- J. Tomasi, B. Mennucci and R. Cammi, Chem. Rev., 2005, 105, 2999 CrossRef CAS PubMed.
- B. C. Hamann and J. F. Hartwig, J. Am. Chem. Soc., 1998, 120, 3694 CrossRef CAS.
- J. Holz, K. Rumpel, A. Spannenberg, R. Paciello, H. Jiao and A. Börner, ACS Catal., 2017, 7, 6162 CrossRef CAS.
- Y. Hamada, F. Matsuura, M. Oku, K. Hatano and T. Shioiri, Tetrahdron Lett., 1997, 38, 8961 CrossRef CAS.
- J. I. van der Vlugt, E. A. Pidko, D. Vogt, M. Lutz and A. L. Spek, Inorg. Chem., 2009, 48, 7513 CrossRef CAS PubMed.
- J. Yuasa, M. Dan and T. Kawai, Dalton Trans., 2013, 42, 16096 RSC.
- B. Bozic-Weber, V. Chaurin, E. C. Constable, C. E. Housecroft, M. Meuwly, M. Neuburger, J. A. Rudd, E. Schönhofer and L. Siegfried, Dalton Trans., 2012, 41, 14157 RSC.
- C. R. Groom, I. J. Bruno, M. P. Lightfoot and S. C. Ward, Acta Crystallogr., Sect. B: Struct. Sci., Cryst. Eng. Mater., 2016, 72, 171 CrossRef CAS PubMed.
- S. Keller, A. Prescimone, H. Bolink, M. Sessolo, G. Longo, L. Martínez-Sarti, J. M. Junquera-Hernández, E. C. Constable, E. Ortí and C. E. Housecroft, Dalton Trans., 2018, 47, 14263 RSC.
Footnote |
| † Electronic supplementary information (ESI) available: Synthetic experimental details. Fig. S1, S2 and S6–S10: IR spectra of ligands and complexes. Fig. S3 and S11–S14: ORTEP-style plots of crystal structures. Fig. S4, S5 and S15–S22: additional NMR figures. Fig. S23 and S24: Solution absorption and emission spectra. Table S1: Selected structural parameters calculated at the B3LYP-D3/(def2svp + def2tzvp) level. CCDC 1844060–1844063 and 1860879. For ESI and crystallographic data in CIF or other electronic format see DOI: 10.1039/c8dt03827a |
| This journal is © The Royal Society of Chemistry 2019 |

