 Open Access Article
Creative Commons Attribution 3.0 Unported Licence
Understanding the structure and dynamics of cationic surfactants from studies of pure solid phases†
Jeremy K.
Cockcroft
 *a,
André
Shamsabadi
 a,
Han
Wu
 b and
Adrian R.
Rennie
 *c
*c
aDepartment of Chemistry, Christopher Ingold Laboratories, UCL, 20 Gordon Street, London WC1H 0AJ, UK. E-mail: j.k.cockcroft@ucl.ac.uk
bDepartment of Chemical Engineering, UCL, Torrington Place, London WC1E 7JE, UK
cCentre for Neutron Scattering, Uppsala University, Box 516, 75120 Uppsala, Sweden. E-mail: adrian.rennie@physics.uu.se
First published on 25th September 2019
Abstract
A homologous series of n-alkyl trimethylammonium bromide surfactants, H(CH2)nN+(CH3)3 Br−, from C10TAB to C18TAB have been studied systematically in the bulk over a wide range of temperatures. Common features in the structures are identified, with packing dominated by the co-ordination of the cationic head groups with bromide anions and interdigitation of the hydrocarbon chains. This arrangement provides an explanation for the thin adsorbed bilayers that have been observed at various hydrophilic surfaces from aqueous solutions in previous studies. The molecular volumes and arrangement are comparable with structures of a number of different self-assembled amphiphiles. For these surfactants with bromide counter-ions, formation of crystal hydrates was not observed. The alkyl chains are highly mobile and at high temperatures a plastic phase is found for all materials with a transition enthalpy that is similar to the melting enthalpy of many long alkyl chains. Other unexpected phase transitions depend more markedly on the hydrocarbon chain length and evidently depend on delicate balances of the various contributions to the free energy.
Introduction
Properties that are related to the structure and mobility of amphiphiles are important for many applications such as drug delivery1 and personal care products2 and in a wide range of industries.3 This motivates fundamental studies that could enable better formulations based on scientific principles and the design of new molecular materials. Even relatively simple molecules such as the alkyl trimethylammonium bromides (known as CnTAB) have found wide application beyond that in formulation of industrial detergents, for example as bactericides and antiseptics for almost 100 years. They have been investigated for other potential clinical applications and their use has been reviewed recently by Jennings et al.4 The European and US Pharmacopeia specify the composition of ‘Cetrimide’ differently as primarily C14TAB and C16TAB, respectively.5 Different activity in pharmaceutical applications has been reported6 and this is a motivation to develop a deeper understanding of interactions and packing at a molecular level for amphiphiles such as surfactants beyond classical ideas of the overall shape and size of hydrophilic and hydrophobic moieties.7For aqueous phases, there is relatively little systematic information about changes observed with the length of the hydrophobic chains apart from differences in the critical micelle concentration and micelle size, but for crystalline materials there is more data. Carboxylic acid structures have been reported by Bond for alkyl chains of length C6 to C15.8 Nelson et al.9 have described the structures of carboxylate salts, for example of potassium soaps of length C8 to C18 and of other salts with sodium and zinc. The odd–even alternation in melting that is well-known for alkanes is also observed in these materials.10
Although for CnTAB, some solid-state structures have been reported for ambient conditions, the literature is confused and contradictory (see the ESI,† Section S6). There has been little attempt to study these surfactants at different temperatures by calorimetry or in situ diffraction and spectroscopy in order to understand the difference in behaviour as a function of chain length n and how it relates to the molecular mobility.
Modern laboratory instruments equipped with solid-state detectors11 now permit rapid collection of powder X-ray diffraction (PXRD) data over a wide range of temperature. The development of micro-focus X-ray sources12 combined with area detectors13 and fully automated data collection14 and structure solution15 has transformed the scope of single-crystal diffraction (SXD) studies. Full laboratory data sets can be collected on small crystals with thicknesses as small as 20 μm in just a few hours. Consequently, structural studies as a function of temperature are realistically feasible.
In this paper, we present a comprehensive study of the solid phases of the homologous series CnTAB (for even values of n from 10 to 18) that identifies the structural changes and thermal transitions that are strongly related to the mobility of the individual parts of the molecule. These results allow us to explain the previously observed unusual structures in adsorbed layers at interfaces of solutions with various solids.16
Experimental
Samples were purchased with the highest purity and used either as supplied or recrystallized as described in the ESI,† Section S1. TGA measurements were made using a PerkinElmer Pyris 1 equipped with a standard furnace. DSC measurements were made using a PerkinElmer DSC8000 equipped with a refrigerated-circulating bath down to −60 °C. Variable temperature PXRD measurements were made using a Stoe Stadi-P diffractometer and SXD measurements were made using an Agilent SuperNova diffractometer. Further details of all experiments are available in the ESI.†Results and discussion
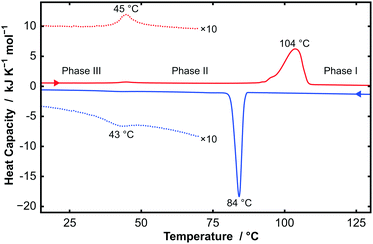
Thermogravimetric analysis (TGA), differential scanning calorimetry (DSC), powder X-ray diffraction (PXRD), and single-crystal X-ray diffraction (SXD) were performed on all samples of CnTAB (for n even from 10 to 18). TGA data showed that the samples were stable to at least 170 °C, above which degradation starts to occur. These measurements demonstrated the anhydrous nature of the samples used in this study; even a sample of C14TAB recrystallized from H2O showed less than 1% weight loss, which is consistent with a small amount of surface bound water (see Fig. S1, ESI†). By contrast, a structure for a hemihydrate of C16TAC, in which the counter-anion is chloride, has been reported and we will describe separately a full study of CnTAC, n = 14, 16, and 18.17Fig. 1 shows DSC data for C14TAB as a typical example of the behaviour of CnTAB. Two first order transitions are clearly visible on heating and cooling. The large endothermic peak at 104 °C on heating corresponds to a process similar to ‘melting’ of the alkyl chain, i.e. the onset of complete rotational mobility of the long chain surfactant cation. This high temperature form is labelled phase I. Such orientationally-disordered structures are frequently designated plastic phases. The weak endothermic peak at 45 °C is due to a more subtle transition between low temperature phase III and an intermediate phase II.
Data for all CnTAB surfactants (for n even from 10 to 18) are shown in Fig. S2–S6 (ESI†). C16TAB and C18TAB show a similar pattern of phase behaviour to C14TAB with the transition temperatures shown in Table 1. By contrast, C10TAB shows a second plastic phase above the plastic phase-transition temperature (phase Ib) and C12TAB exhibits an additional phase just below the large enthalpy transition (phase IIa). The transition temperatures and enthalpy values are provided in the captions to Fig. S2–S6 (ESI†).
| CnTAB | 10 | 12 | 14 | 16 | 18 |
|---|---|---|---|---|---|
| Transition A | III → II | III → II | III → II | III → II | III → II |
| T/°C | −36 | 13 | 45 | 76 | 71 |
| Transition B | II → IIa | ||||
| T/°C | 71 | ||||
| Transition C | II → Ib | IIa → I | II → I | II → I | II → I |
| T/°C | 101 | 103 | 104 | 110 | 101 |
| Transition D | Ib → I | ||||
| T/°C | 147 | ||||
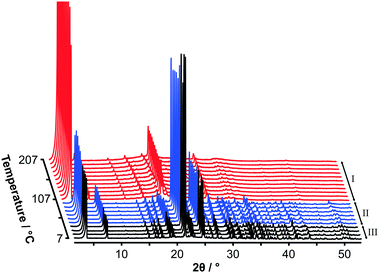
Fig. 2 shows variable temperature PXRD data on heating C14TAB from 7 °C to 207 °C. The transition from phase II to phase I as seen in the strong DSC peak at 104 °C is clearly evident with an obvious change in the PXRD patterns between 97 °C (shown in blue) and 107 °C (shown in red). A second more subtle transition is also evident between 37 °C (shown in black) and 47 °C consistent with the weak DSC peak at 45 °C.
Variable temperature PXRD data for each of the samples (for n even from 10 to 18) are shown in Fig. S7–S11 (ESI†). The additional phases detected by DSC for C10TAB (phase Ib) and C12TAB (phase IIa) are also apparent in the PXRD data. On cooling, the plastic-phase transforms back to a more ordered structure as seen in the DSC. At room temperature, the Bragg peaks are now broader as shown in Fig. S12–S16, ESI.†
The changes in molecular behaviour below the plastic phase transition temperature were determined using variable temperature single-crystal X-ray diffraction (SXD) as summarised in Table 2. Full details of these experiments are available in the ESI,† Section S5, Tables S1–S18 and Fig. S17–S21. In addition, SXD measurements were made on C10TAB at −173 and −23 °C. For the plastic phases, SXD measurements were not possible as the transition on heating always destroyed the single crystals. This observation is consistent with the peak broadening seen in samples after heating and subsequent cooling in the PXRD experiments. Further, to aid later comparison with the plastic phases, a precise structure of tetramethylammonium bromide (C1TAB in the nomenclature of this paper) was refined from SXD data collected on a crystal at −123 °C.
| CnTAB | 10 | 12 | 14 | 16 | 18 |
|---|---|---|---|---|---|
| T/°C | −123 | −123 | −123 | −123 | −123 |
| Phase | III | III | III | III | III |
| Symmetry | P21/c | P21/c | P21/c | P21/c | P21/c |
| V/Å3 | 380 | 425 | 471 | 516 | 562 |
| T/°C | 22 | 22 | 22 | 22 | 22 |
| Phase | II | II | III | III | III |
| Symmetry | P21/m | P21/m | P21/c | P21/c | P21/c |
| V/Å3 | 397 | 441 | 485 | 531 | 578 |
| T/°C | 102 | 107 | 107 | 117 | 117 |
| Phase | II | IIa | II | II | II |
| Symmetry | P21/m | ? | P21/m | P21/m | P21/m |
| V/Å3 | 408 | ? | 501 | 549 | 597 |
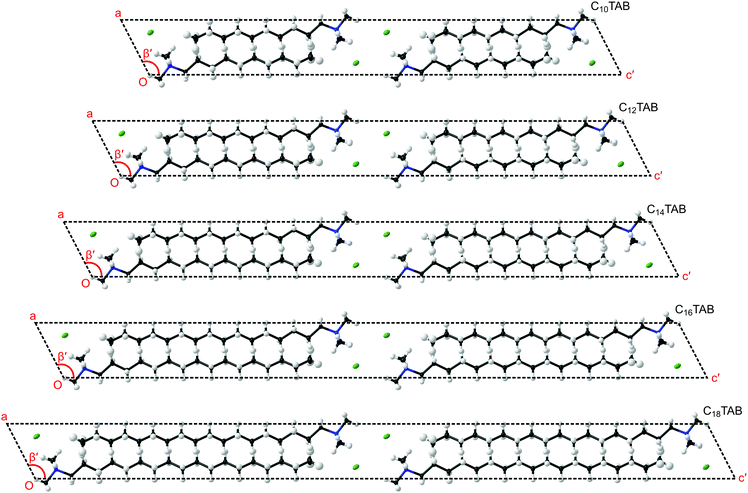
In order to understand the evolution of structure as a function of temperature correctly, first it is important not to miss the subtle doubling of the unit cell at low temperature (see Table 1 and ESI,† Section S5, Fig. S22). Secondly, to make a comparison within the homologous series, a consistent presentation of the refined structure of CnTAB is crucial (see the ESI,† Section S5). In the views presented in Fig. 3 of the lowest temperature phase III, the coordinates and anisotropic displacement parameters of the refined crystal structures at −123 °C were transformed (see CIFs S1–S5, ESI†) to display a principal axis parallel to the alkyl chain (as shown in Fig. S23–S27, ESI†). The clear common features are the coordination of the ionic layer, the interdigitation of the alkyl chains, the inclination of the alkyl chains with respect to the ionic layer, and the twist of the hydrocarbon chain along the principal axis (see Fig. S28, ESI†) that leads to the symmetry change and cell doubling at low temperature (see Fig. S29 and S30, ESI†).
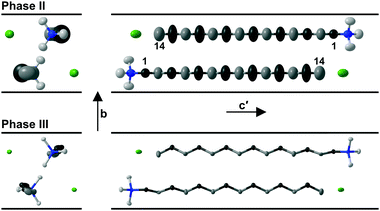
On increasing the temperature, evolution of the molecular motion is observed leading to the intermediate phase II with mirror symmetry as shown in Fig. 4 for the structure of C14TAB at 97 °C. The thermal motion of the alkyl chain is more pronounced at the methyl end of the long chain (see Fig. S31–S35, ESI†). In addition, the increased librational motion of the chain leads to alternate –CH2– groups dynamically crossing what was the c-glide plane at low temperature with consequent disorder and time-averaged mirror symmetry. This motion is analogous to an oscillating crankshaft with the even-numbered C atoms on the axis of the shaft and with the odd-numbered, off-axis, ones exhibiting large displacements. In phase II, the strong ionic interactions limit the scope for stochastic rotational motion of the trimethylammonium head group.
The limitations imposed by the few fixed temperatures that could be measured by SXD and the inability to measure data above the plastic transition temperature can be diminished by analysis of the complementary PXRD data. Whole-pattern fitting methods were used to determine the lattice parameters as a function of temperature over the full range of temperature (see e.g.Fig. 5). This is dependent on the prior reliable SXD structure determination at low temperature given the subtle differences between phases II and III. Furthermore, great care must be taken with whole pattern fitting and monoclinic symmetry since the value of the unit-cell angle β crosses from above to below 90° as a function of temperature for C14TAB (see Fig. 5b and ESI,† Section S4). The large increase in volume (≈14.8%) associated with the transition to the plastic phase seen in Fig. 5a is of similar magnitude to those observed in other materials on melting. Comparable data for all materials are provided in Tables S19–S24 (ESI†) (and are shown in Fig. S36–S43, ESI†).
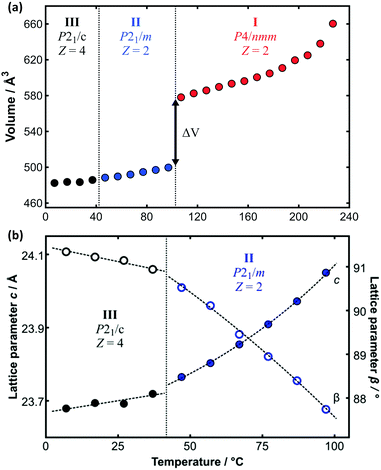 | ||
| Fig. 5 (a) Variation of molecular volume with temperature derived from the PXRD data on C14TAB shown in Fig. 2. The large change in volume (ΔV ≈ 14.8%) between phases II and I is indicative of a transition from a more ordered to a plastic phase. (b) The transition from phase III to phase II is more apparent from the change in the value of the lattice parameters c (as solid circles), divided by 2 for phase III, and β (as open circles) as a function of temperature (using an enlarged temperature scale). Data points are coloured coded as for the raw PXRD patterns shown in Fig. 2. | ||
In contrast to the various lower temperature phases, all the CnTAB investigated here (except for n = 1) have a high-temperature phase I with the axis of the hydrogen carbon chains arranged perpendicular to the layer containing the cationic head groups and bromide anions, which is shown schematically in Fig. 6. The packing arrangement within the ionic layer is substantially unaltered at the transition. The temperature at which this transition occurs is approximately independent of the alkyl chain length (see Table 1). For phase I, the PXRD data can only be interpreted satisfactorily in terms of a plastic phase with large rotational mobility of both the hydrocarbon chain and the head group about the tail axis, which agrees with the large enthalpy change seen in the DSC. As the temperature is increased, the expansion is markedly bigger along the alkyl chain axis direction (see Fig. S53, ESI†) leading to an increase in the separation of the layers of ions and, speculatively, leading to the reduced interdigitation of the molecules and, ultimately, to decomposition.
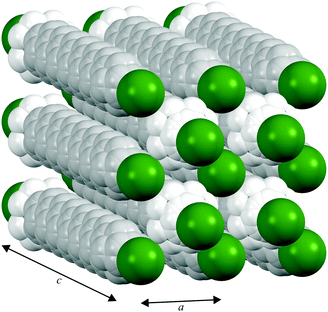 | ||
| Fig. 6 Proposed model of the packing of the C14TAB molecules in the rotator phase in which there is a pseudo body-centred cubic arrangement of bromide anions (shown in green) and the cationic trimethylammonium head groups (shown in bright white with the n-alkyl tails shown in off-white) within the ionic plane region (see Section S4 of the ESI† and Fig. S44–S48); the PXRD data on the additional rotator phase Ib of C10TAB (see Fig. S49, ESI†) can be explained with a double-length cell as shown in Fig. S50, ESI.† To aid the reader, the structure shown represents more than one unit cell (extended from −0.5 to 1.5 in both a and b and −0.1 to 1.1 in c, the latter to show the Br− anion packing within the ionic plane). The packing is subtly different to that of the cations and anions in tetramethylammonium bromide (“C1TAB”) (see Fig. S51, ESI†) despite the latter sharing the same space-group symmetry as for phase I of CnTAB (for n even from 10 to 18) (see Fig. S52, ESI†). | ||
In the lower temperature phases, thermal expansion is dominated by the reduced lateral packing of alkyl chains, which enables a change from ordered phase III to structures with dynamic disorder of alternate methylene groups in phase II. A further increase in temperature leads to complete rotational disorder of the alkyl chains and head groups with a large increase of the inter-chain separation leading to the transition from phase II to phase I.
It is evident from the PXRD data measured on cooling back to 27 °C that the peaks are broader when compared to the measurements made prior to heating above the transition to the plastic phase. Further, the increase in the widths of the peaks correlates with increasing chain length (see Fig. S12–S16, ESI†). Upon the transition to the lower temperature phase, a kinetic hindrance to structural rearrangement, which requires reorientation of the alkyl chains with respect to the ionic layer, explains this observation.
Extra intermediate phases were observed for C10TAB and C12TAB, which were identified by DSC (Table 1) and variable temperature PXRD (see Fig. S11, ESI†). On heating C10TAB, it initially transforms to a plastic phase, designated Ib, with tetragonal symmetry but with a double-length unit cell compared to phase I. This transition can also be seen in the DSC data (see Fig. S6, ESI†). Phase Ib can only be explained in terms of 4 molecules per cell with the head groups in a defined orientation, i.e. the transition from phase II leads first to a phase characterised by rotational freedom of the long hydrocarbon chain but not the ionic head groups. On further heating, rotational disorder of the head group occurs as seen in phase I for all CnTAB. In addition, a re-entrant phase transition was observed serendipitously by PXRD for C10TAB. The transition involves a slight shear of phase II parallel to the ionic plane to form a triclinic phase, designated phase IV, which exists over a very narrow range of temperature (see the ESI,† Section S4 and Fig. S54 and S55).
In the case of C12TAB, the transition from phase II to phase I involves an intermediate phase IIa (see Fig. S10, ESI†), which occurs over a narrow range of temperature. SXD data suggest strongly that this is an incommensurate phase (see Section S5 of the ESI,† plus Fig. S56 and S57), as does the temperature-dependent behaviour of the lowest-angle peak in the PXRD patterns of phase IIa. This might involve realignment of the alkyl tails with respect to the ionic layer prior to full rotational disorder. These differences with the alkyl chain length reflect the changing balance of interactions with temperature arising from steric effects as well as van der Waals and ionic forces.
Our new results can be related to observations on self-assembly from solution. It is interesting to compare the crystal structures of these surfactants with the arrangement of adsorbed layers at interfaces with solutions. While binding at hydrophilic surfaces is usually described as a bilayer, details of the structure are often unavailable. Fragneto et al.16 described adsorption of C16TAB to silica in some detail using specific deuterium labelling of different parts of the hydrocarbon and identified a layer with an overall thickness of about 32 Å with clear interdigitation of the chains. This picture resembles that found in the surfactant crystal. Studies of adsorption to mica using the surface force apparatus have also seen layers with a thickness of about 32 Å to 33 Å.18 Other studies, such as one using X-ray reflection,19 have also reported thin structures, for example with alkyl chain regions for a bilayer of just 25 Å thickness, and these have been attributed to a large tilt of the alkyl chains away from the interface normal, although there are no specific data that identify such structures. As indicated in Fig. 3, similar tilt angles, φ, of about 27° between the alkyl chain direction and the normal to the plane containing the ionic groups were observed for all of the CnTAB as reflected by the monoclinic cell angle of about 117° (= 90° + φ).
Comparison with other amphiphiles is interesting, e.g. studies of a homologous series of n-alkyl carboxylic acids CnCOOH.8 However, even the best available data do not permit direct comparison at identical temperatures for the different chain lengths. A major difference between CnTAB and CnCOOH is the lack of interdigitation in the bilayers of the latter series of amphiphiles and in the tilt of the alkyl chains with respect to the plane of the polar groups. For the n-even acids, the equivalent monoclinic cell angle 90° + φ (θ1 in ref. 8) is significantly bigger and varies from 135° and 129° with increasing n. The average C–C–C bond angles in CnTAB at −123 °C of 113° for each n are similar to the average C–C–C bond angles of 116° in CnCOOH and these are significantly bigger than the tetrahedral angle of 109.5°. From the mean C–C bond length of 1.525 Å and C–C–C bond angle of 113° in CnTAB at −123 °C, an n-alkyl chain length can be calculated. Others have derived widely-quoted formulae20 for the calculation of alkyl chain lengths of surfactant molecules in micelles and as layers at interfaces, which give a similar increment despite the incorrect assumption of a tetrahedral angle, which was compensated for by the use of a longer C–C bond length.
In addition to chain length as a function of n, one can compare the volume increment, VCH2, per –CH2– unit in the different phases of CnTAB and with other systems. At −123 °C, where all CnTAB have the same ordered structure in phase III, VCH2 is around 22.7 Å3, whereas in the rotationally-disordered phase I at 157 °C, it is 29.7 Å3 (see Fig. S58, ESI†). These can be compared to a value of 23.0 Å3 for crystalline n-alkanes,21 27.4 Å3 for disordered lipid phases at 20 °C versus 28.0 Å3 at 40 °C,22 and 30.3 Å3 in micelles of sodium carboxylates at about 80 °C.23 Thus the volume increments observed in this work correspond well to the different states of important practical interest long-chain amphiphiles. Furthermore, for a C14TAB molecule, the molecular volume in micelles24 is 544 Å3 at 25 °C compared to 485 Å3 in the crystalline solid at 22 °C. For micelles at low concentration, the ionic head groups are constrained to a spherical shell and there is no interdigitation of the alkyl chains.
Another indication of the changes to a mobile disordered state comes from DSC data. A large enthalpy of transition at a temperature of about 104 °C in seen in Fig. 1 for C14TAB. It is clear from the diffraction data in Fig. 2 that there are some sharp diffraction peaks that persist at much higher temperatures consistent with a change from an ordered state to a crystalline state with rotationally-mobile alkyl chains. Similar results were observed for the other surfactants (see Fig. S2–S6, ESI†). The large enthalpy changes seen below the melting point are similar to those reported in the earlier work of Iwamoto et al.,25 which increase approximately linearly with the alkyl chain length. The transition enthalpies for the phase change to a rotationally-disordered state are comparable with melting enthalpies reported for a number of long n-alkanes.26 The high-temperature structures are similar to the ‘rotator’ phases seen in the n-alkanes27 but with the significant difference that one end of the chain is fixed in position by ionic forces.
As many neutron scattering experiments are performed on deuterated samples,28 a structure determination was performed on C14TAB with the alkyl chain deuterated (C14TAB-D29) at −123 °C. Within experimental uncertainty, the crystal structures were the same and no significant differences were observed by DSC. This provides reassurance that isotopic labelling of an alkyl chain with deuterium can be used for studies of, for example, dynamics with neutrons and NMR.
The subtle balance of contributions to the free energy that determines different structural arrangements is clear from the PXRD diffraction data for the shorter alkyl chain lengths where a richer phase behaviour is observed. An interesting example is the incommensurate phase observed for C12TAB at a lower temperature than the transition to the rotational disordered phase. For C10TAB, an additional rotator phase with a different ionic head group arrangement was observed. DSC data hint at other subtle phase transitions that are not obvious from diffraction data but were seen by chance in PXRD data, e.g. the re-entrant phase transition in C10TAB. This demonstrates the challenges in interpreting variable temperature PXRD data correctly and the difficulties in computer modelling both the structure and dynamics of surfactants. The shorter length alkyl-chain surfactants C8TAB and C6TAB will be the subject of a further paper.
Conclusions
We report here for the first time novel structures of C10TAB and C18TAB plus new low- and high-temperature structures for C12TAB, C14TAB, and C16TAB. This work clarifies the rich phase behaviour of the CnTAB surfactants and identifies several common features of all the materials investigated. Although there are similarities, transitions from phase III to II occur at different temperatures depending on the chain length. This explains in part the various structures described, often incorrectly, in the literature (see Section S6 of the ESI†). We can now confirm that the previous report on C14TAB and C16TAB at room temperature by Norbert et al.29 correctly identified the doubled unit cell and symmetry for phase III; correct room-temperature structures were reported for phase II of C12TAB in 1983,30 for phase III of C16TAB in 1986,31 and for phase III of C14TAB in 2003.32 No evidence of polymorphs of C16TAB was observed contrary to earlier reports33 and pitfalls in the SXD analysis of CnTAB are pointed out (see Section S5 of the ESI†).The structures that we have obtained for crystalline CnTAB provide an explanation for the observation that an interdigitated structure of the alkyl chains with hydrophilic groups that are strongly coordinated with counter-ions is often preferred, for example as identified previously for the structure of an adsorbed bilayer of C16TAB on a silica surface.16,34 The dominant influence determining the formation of such structures is the co-ordination of the cations with the bromide anions and together with the tilt of the alkyl chains to the plane of the ionic layer this explains the observed small thickness of adsorbed layers of these surfactants that has been discussed previously.35
The structural studies allow a clear identification of the trends of mobility for the alkyl chains both with changes in their length and with temperature. The displacement amplitudes observed for individual carbon atoms increase with decreasing chain length. However, the transition temperature to the plastic phase I is not strongly dependent on chain length. The results suggest that it may be interesting to explore in future studies whether differences in bactericidal activity are related to the mobility of molecules or to possible formation of ordered domains as the surfactants interact with e.g. the cell membrane material.
Finally, we note that all of the measurements reported in this work were accomplished readily with modern laboratory X-ray instruments and without recourse to diffractometers on beamlines at synchrotron X-ray radiation facilities, which are typically associated with long wait times for access.
Conflicts of interest
There are no conflicts to declare.Acknowledgements
We acknowledge financial support from the EPSRC for funding the X-ray diffractometers (grant reference EP/K03930X/1). We thank Marc-Olivier Coppens for access to the Thermal Analysis Facilities within CNIE (grant reference EP/K038656/1). We thank Martin Vickers for PXRD support, Kalpana Balaskandan for help with preliminary PXRD measurements, Ronen Ghosh for computational support, and Peixun Li from the STFC Deuteration Laboratory at RAL for the provision of C14TAB-D29.References
- M. J. Lawrence, Chem. Soc. Rev., 1994, 23, 417–424 RSC; M. Salim, H. Minamikawa, A. Sugimura and R. Hashim, Med. Chem. Commun., 2014, 5, 1602–1618 RSC.
- Surfactants in Personal Care Products and Decorative Cosmetics, ed. L. D. Rhein, M. Schlossman, A. O'Lenick and P. Somasundaran, CRC Press, Baton Rouge, 3rd edn, 2006 CrossRef CAS PubMed; M. Kakran and M. N. Antipina, Curr. Opin. Pharmacol., 2014, 18, 47–55 CrossRef CAS PubMed.
- M. J. Rosen and J. T. Kunjappu, Surfactants and Interfacial Phenomena, Wiley, 4th edn, 2012, ch. 1, pp. 1–38 Search PubMed.
- M. C. Jennings, K. P. C. Minbiole and W. M. Wuest, ACS Infect. Dis., 2015, 1, 288–303 CrossRef CAS PubMed.
- Monograph 0378, European Pharmacopoeia Online, 9th edn, 2017, http://online.pheur.org/EN/entry.htm; USP Dictionary of USAN and International Drug Names, 2012, p. 212, US Pharmacopial Convention, http://www.usp.org/.
- A. Hart, K. E. Moore and D. Tall, J. Appl. Bacteriol., 1976, 41, 235–242 CrossRef CAS PubMed.
- J. N. Israelachvili, Intermolecular and Surface Forces, Academic Press, 3rd edn, 2011, ch. 20, pp. 735–775 Search PubMed.
- A. D. Bond, New J. Chem., 2004, 28, 104–114 RSC.
- P. N. Nelson, H. A. Ellis and R. A. Taylor, J. Mol. Struct., 2014, 1058, 234–243 CrossRef CAS; P. N. Nelson and R. A. Taylor, Spectrochim. Acta, Part A, 2015, 138, 800–806 CrossRef PubMed.
- P. N. Nelson, H. A. Ellis and R. A. Taylor, J. Mol. Struct., 2014, 1075, 299–310 CrossRef CAS.
- B. Schmitt, Ch. Brönnimann, E. F. Eikenberry, F. Gozzo, C. Hörmann, R. Horisberger and B. Patterson, Nucl. Instrum. Methods Phys. Res., Sect. A, 2003, 501, 267–272 CrossRef CAS; A. Bergamaschi, A. Cervellino, R. Dinapoli, F. Gozzo, B. Henrich, I. Johnson, P. Kraft, A. Mozzanica, B. Schmitt and X. Shi, J. Synchrotron Radiat., 2010, 17, 653–668 CrossRef PubMed; D. S. Jung, J. Appl. Crystallogr., 2015, 48, 2044 CrossRef.
- T. Skarzynski, Acta Crystallogr., Sect. D: Biol. Crystallogr., 2013, 69, 1283–1288 CrossRef CAS PubMed.
- A. Förster, S. Brandstetter and C. Schulze-Briese, Philos. Trans. R. Soc., A, 2018, 377(0241), 15 Search PubMed.
- CrysAlisPro, https://www.rigaku.com/en/products/smc/crysalis.
- G. M. Sheldrick, Acta Crystallogr., Sect. A: Found. Adv., 2015, 71, 3–8 CrossRef PubMed ; Autochem ver. 3.0, https://www.rigaku.com/en/products/smc/autochem.
- G. Fragneto, R. K. Thomas, A. R. Rennie and J. Penfold, Langmuir, 1996, 12, 6036–6043 CrossRef CAS.
- K. Okuyama, T. Ishii, K. Vongbupnimit and K. Noguchi, Mol. Cryst. Liq. Cryst. Sci. Technol., Sect. A, 1998, 312, 101–115 CrossRef CAS; J. K. Cockcroft, A. R. Rennieet al., to be published.
- R. M. Pashley, P. M. McGuiggan, R. G. Horn and B. W. Ninham, J. Colloid Interface Sci., 1988, 126, 569–578 CrossRef CAS; P. Kekicheff, H. K. Christenson and B. W. Ninham, Colloids Surf., 1989, 40, 31–41 CrossRef.
- F. Speranza, G. A. Pilkington, T. G. Dane, P. T. Cresswell, P. Li, R. M. J. Jacobs, T. Arnold, L. Bouchenoire, R. K. Thomas and W. H. Briscoe, Soft Matter, 2013, 9, 7028–7041 RSC.
- H. V. Tartar, J. Phys. Chem., 1955, 59, 1195–1199 CrossRef CAS; C. Tanford, J. Phys. Chem., 1972, 76, 3020–3024 CrossRef.
- S. J. Craig, G. P. Hastie, K. J. Roberts and J. N. Sherwood, J. Mater. Chem., 1994, 4, 977–981 RSC.
- D. Uhríková, P. Rybár, T. Hianik and P. Balgavý, Chem. Phys. Lipids, 2007, 145, 97–105 CrossRef PubMed.
- F. Reiss-Husson and V. Luzzati, J. Phys. Chem., 1964, 68, 3504–3511 CrossRef CAS.
- R. D. Lisi, S. Milioto and R. E. Verrall, J. Solution Chem., 1990, 19, 665–692 CrossRef.
- K. Iwamoto, Y. Ohnuki, K. Sawada and M. Senō, Mol. Cryst. Liq. Cryst., 1981, 73, 95–103 CrossRef CAS.
- C. M. L. Atkinson and M. J. Richardson, Trans. Faraday Soc., 1969, 65, 1749–1763 RSC.
- K. Larsson, Nature, 1967, 213, 383–384 CrossRef CAS; I. Denicolò, J. Doucet and A. F. Craievich, J. Chem. Phys., 1983, 78, 1465–1469 CrossRef; J. Doucet, I. Denicolò, A. F. Craievich and C. Germain, J. Chem. Phys., 1984, 80, 1647–1651 CrossRef.
- J. R. Lu, Z. X. Li, J. Smallwood, R. K. Thomas and J. Penfold, J. Phys. Chem., 1995, 99, 8233–8243 CrossRef CAS; G. R. Bell, S. Manning-Benson and C. D. Bain, J. Phys. Chem. B, 1998, 102, 218–222 CrossRef; P. X. Li, R. K. Thomas and J. Penfold, Langmuir, 2014, 30, 6739–6747 CrossRef PubMed.
- A. Norbert, B. Brun and Chan-Dara, Bull. Soc. Fr. Mineral. Cristallogr., 1975, 98, 111–112 CAS.
- K. Szulzewsky, B. Schulz and D. Vollhardt, Cryst. Res. Technol., 1983, 18, 1003–1008 CrossRef CAS.
- A. R. Campanelli and L. Scaramuzza, Acta Crystallogr., Sect. C: Cryst. Struct. Commun., 1986, 42, 1380–1383 CrossRef.
- M. Ramos Silva, A. Matos Beja and J. A. Paixão, Acta Crystallogr., Sect. E: Struct. Rep. Online, 2003, 59, o1151–o1152 CrossRef CAS.
- H. H. Paradies and S. F. Clancy, Rigaku J., 2000, 17, 20–34 Search PubMed; B. Alonso, D. Massiot, P. Florian, H. H. Paradies, P. Gaveau and T. Mineva, J. Phys. Chem. B, 2009, 113, 11906–11920 CrossRef CAS PubMed.
- A. R. Rennie, E. M. Lee, E. A. Simister and R. K. Thomas, Langmuir, 1990, 6, 1031–1034 CrossRef CAS.
- E. Tyrode, M. W. Rutland and C. D. Bain, J. Am. Chem. Soc., 2008, 130, 17434–17445 CrossRef CAS PubMed.
Footnote |
| † Electronic supplementary information (ESI) available: Additional experimental details, crystallographic tables, and additional supporting figures are supplied. CIF files with hkl and intensity data have been deposited at the Cambridge Crystallographic Data Centre with deposition codes: 1941218, 1941219, and 1941220 for C18TAB at −123 °C, 22 °C, and 117 °C; 1941221, 1941222, and 1941223 for C16TAB at −123 °C, 22 °C, and 107 °C; 1941224, 1941225, and 1941226 for C14TAB at −123 °C, 22 °C, and 107 °C; 1941227 for C14TAB-D29 at −123 °C; 1941228 and 1941229 for C12TAB at −123 °C and 22 °C; and 1941230, 1941231, 1941232, 1941233, and 1941234 for C10TAB at −173 °C, −123 °C, −23 °C, 22 °C, and 102 °C, respectively. In addition, data have been deposited with code 1941235 for C1TAB at −123 °C. For ESI and crystallographic data in CIF or other electronic format see DOI: 10.1039/c9cp04486h |
| This journal is © the Owner Societies 2019 |

