 Open Access Article
Creative Commons Attribution 3.0 Unported Licence
On the interpretation of in situ HONO observations via photochemical steady state
Leigh R.
Crilley
a,
Louisa
Kramer
a,
Francis D.
Pope
a,
Lisa K.
Whalley
bd,
Danny R.
Cryer
b,
Dwayne E.
Heard
bd,
James D.
Lee
cd,
Christopher
Reed
c and
William J.
Bloss
*a
aSchool of Geography, Earth & Environmental Sciences, University of Birmingham, UK. E-mail: w.j.bloss@bham.ac.uk
bSchool of Chemistry, University of Leeds, UK
cWolfson Atmospheric Chemistry Laboratory, Department of Chemistry, University of York, UK
dNational Centre for Atmospheric Science, UK
First published on 22nd January 2016
Abstract
A substantial body of recent literature has shown that boundary layer HONO levels are higher than can be explained by simple, established gas-phase chemistry, to an extent that implies that additional HONO sources represent a major, or the dominant, precursor to OH radicals in such environments. This conclusion may be reached by analysis of point observations of (for example) OH, NO and HONO, alongside photochemical parameters; however both NO and HONO have non-negligible atmospheric lifetimes, so these approaches may be problematic if substantial spatial heterogeneity exists. We report a new dataset of HONO, NOx and HOx observations recorded at an urban background location, which support the existence of additional HONO sources as determined elsewhere. We qualitatively evaluate the possible impacts of local heterogeneity using a series of idealised numerical model simulations, building upon the work of Lee et al. (J. Geophys. Res., 2013, DOI: 10.1002/2013JD020341). The simulations illustrate the time required for photostationary state approaches to yield accurate results following substantial perturbations in the HOx/NOx/NOy chemistry, and the scope for bias to an inferred HONO source from NOx and VOC emissions in either a positive or negative sense, depending upon the air mass age following emission. To assess the extent to which these impacts may be present in actual measurements, we present exploratory spatially resolved measurements of HONO and NOx abundance obtained using a mobile instrumented laboratory. Measurements of the spatial variability of HONO in urban, suburban and rural environments show pronounced changes in abundance are found in proximity to major roads within urban areas, indicating that photo-stationary steady state (PSS) analyses in such areas are likely to be problematic. The measurements also show areas of very homogeneous HONO and NOx abundance in rural, and some suburban, regions, where the PSS approach is likely to be valid. Implications for future exploration of HONO production mechanisms are discussed.
1 Introduction
Chemical processes affect atmospheric composition, leading to the removal of primary species, including many air pollutants, and the formation of secondary products. The hydroxyl radical (OH) is the principal gas-phase tropospheric oxidant, responsible for initiating the degradation of most volatile organic compounds (VOCs), including the greenhouse gas methane (CH4), and many nitrogen and sulphur species.1 Products of OH-driven oxidation include pollutants such as ozone (O3), and secondary inorganic and organic aerosol, which affect human health and radiation transfer, hence climate. Consequently, quantitative knowledge of OH abundance – and hence OH sources – underpins understanding of atmospheric chemical processing.2 This paper concerns understanding the gas-phase sources and cycling of OH in the troposphere, and specifically the role of nitrous acid (HONO) in the atmospheric boundary layer.Basic OH-driven VOC oxidation involves interconversion of OH radicals and organic- and hydro-peroxy radicals, RO2 and HO2, mediated by the abundance of nitrogen oxides (NOx). Within this radical cycling, we can distinguish between primary sources of OH, and of HOx (here, HOx = OH + HO2 + RO2), and secondary sources of OH (which simply represent interconversion between OH, HO2 and RO2). In the free troposphere, the dominant primary OH (and HOx) sources are the short-wavelength photolysis of ozone, followed by O(1D) reaction with water vapour; other primary sources of HOx include photolysis of carbonyl species and alkene–ozone reactions, while the predominant secondary source of OH in most tropospheric environments is reaction of HO2 radicals with nitric oxide (NO).
Nitrous acid (HONO) can be considered to be both a primary source of OH, and a HOx (and NOx) reservoir: HONO is formed in the gas phase, through the termolecular reaction between OH radicals and NO (1), and the principal fate of HONO in the sunlit atmosphere is photolysis (2) to reform OH and NO; HONO photolysis frequencies reach ca. 1.7 × 10⁻³ s−1 in the mid-latitude boundary layer (value for SZA = 40°). Reaction with OH (3) represents a further sink of HONO, but in most situations is a minor channel given the broadly photolysis-driven abundance of OH.3 HONO chemistry as described through reactions (1) and (2) has no net effect upon HOx and NOx (once steady state is achieved); however additional HONO formation through other processes (4) will lead to additional, primary, net OH production.4
| OH + NO + M → HONO + M | (1) |
| HONO + hν → OH + NO | (2) |
| HONO + OH → H2O + NO2 | (3) |
| [Other sources] → HONO | (4) |
HONO was first detected in the atmosphere by Differential Optical Absorption Spectroscopy, DOAS.5 Subsequently, HONO has been measured using a range of direct and indirect approaches, including optical methods – open-path DOAS,6 FTIR and various cavity approaches such as broadband cavity enhanced absorption spectroscopy,7 wet chemical approaches,8–10 and through applications of photo-fragmentation/laser induced fluorescence11 and chemical ionisation mass spectrometry.12 While technique equivalence remains a live issue,13 the observations derived from modern instrumentation have highlighted that HONO is likely to play an important role in boundary layer (and potentially free troposphere) HOx and NOx chemistry.
The observed levels of HONO are such that it forms an important – sometimes dominant – component of the OH budget within the boundary layer (where air pollutants immediately impact upon health), e.g. accounting for 48–56% of OH production in New York City,14,15 33% of OH production in a deciduous forest near Jülich (Germany),16 35% of the OH source at a suburban site near Paris,17 80.4% of the OH source at a semi-rural site in Colorado18 and 40% in central London.19 We can identify two contrasting HONO formation mechanisms: within-atmosphere gas-phase HONO formation (with no net effect upon OH abundance) – through reaction (1), and other processes and heterogeneous formation and/or direct emissions (net HONO production, leading to increased OH – reaction (4)).
The existence of additional HONO sources, beyond reaction (1), was identified following the first observations of HONO by DOAS approaches5,6 which showed HONO accumulation during nighttime and removal (by photolysis) during the day. Subsequent co-located observations of HONO, OH and NO have consistently found that additional HONO sources (i.e. reaction (4) in Fig. 1) are required to balance the in situ chemical HONO budget. The missing source strength is far from a minor correction: it has frequently exceeded the known (OH + NO) production by an order of magnitude. For example, in a European deciduous forest a missing source ca. 13-fold larger than OH + NO was identified;16 at a rural site in southern China daytime HONO production exceeded known sources by a factor of 19.20 Recent observations from the (highly homogeneous) SMEAR II Hyytiälä boreal forest site in Finland found that an additional HONO source, ca. 20–30 times larger than that predicted from OH + NO, was present.21 In urban regions, with orders of magnitude higher NOx levels, HONO formation via OH + NO is much faster – however substantial additional HONO sources are still evident: 50% of HONO production was unaccounted for at a suburban Paris site;22 and 40% was unaccounted for in Santiago, Chile.23
A number of candidate mechanisms have been proposed to account for the missing HONO production: formation from dark NO2–H2O interactions occurs upon a range of surfaces24,25 but is thought to be smaller than the missing (daytime) source (e.g. accounting for only 4% of the deficit in Santiago23). Laboratory studies have shown that photoenhanced HONO production can occur following NO2 uptake to surfaces including soot,26 aromatic species,27 humic acids28 and TiO2.29 Of these, photoenhanced NO2-to-HONO conversion upon organic films has been shown to occur at a rate that can potentially account for the missing HONO source. Surface-enhanced nitrate photolysis may contribute to HONO formation upon forest canopies30 although the yield is poorly constrained. Both ground and aerosol surfaces may contribute to heterogeneous HONO production, although aerosol surface areas are generally smaller than the geometric ground surface area within a typical boundary layer, and observations (vertical profiles of HONO and aerosol surface area) have consistently shown that the ground source dominates,31–34 a conclusion supported by low HONO production observed in laboratory studies of NO2–soot interactions.35 Other insights into HONO formation include new gas-phase chemistry, for example the recently proposed reaction between water-complexed HO2 radicals, HO2·H2O, and NO236 and direct emissions from soil bacteria37,38 and biocrusts.39
The identity of the additional HONO sources is still the subject of much attention, and has been variously discussed in the reviews of (for example) Lammel & Cape,40 Kleffman,4 Spataro & Ianniello41 and George et al.42 The focus of this discussion paper is not to identify the source(s) responsible for the net HONO formation frequently observed in the field, but rather to explore the strengths – and limitations – of one method used to identify the magnitude and suggest the identity of additional HONO sources, including in a number of the studies cited above – the application of photostationary steady state to the HONO–OH–NO system.
2 Photostationary steady state
The photostationary steady state (PSS) is a simple application of basic chemical kinetics, in which application of the assumption of chemical equilibrium permits derivation of the relative concentrations of more reactive species in terms of the kinetic and photochemical reaction parameters governing their interchange with less reactive components.43 The classical example of PSS in atmospheric chemistry is the simple NOx–O3 or Leighton ratio:44| NO + O3 → NO2 + O2 | (5) |
| NO2 + hν → NO + O | (6) |
| [NO2]/[NO] = k5[O3]/j6 | (E1) |
Deviations from the Leighton ratio arise from additional chemical processes (and have been used to infer, for example, RO2 abundance and hence ozone production rates45 and possible new chemistry46). Technically however, steady-state is never truly achieved – the concentrations are always relaxing towards equilibrium, on a timescale which may be characterised by the e-folding lifetime. In the case of the Leighton ratio PSS is a reasonable assumption for the sunlit atmosphere, where j6 is of the order of (5–10) × 10−3 s−1 (SZA 60–20°), and k5[O3] typically (5–50) × 10−3 s−1 (10–100 ppb O3; 298 K) – and reactions (5) and (6) are the dominant controls on NOx and O3 abundance in most situations. The HONO PSS however displays more complex timescales. Neglecting additional sources (4):
| [HONO] = k1[OH][NO]/(j2 + k3[OH]) | (E2) |
Consequently, HONO levels observed at a given point in time reflect the integrated effect of reactions (1)–(3), and additional sources, over a period of at least several minutes of the air parcel history – a fetch over which OH and NO, with much shorter chemical lifetimes, may be highly variable depending upon local heterogeneity.
A number of studies have used point observations of HONO, OH and NO to infer the magnitude of additional HONO sources S:
| S = {[HONO]obs × (j2 + k3[OH])} − k1[OH][NO] | (E3) |
This approach is appropriate where the local environment is homogeneous and well mixed – for example remote ground based locations16,21 or free tropospheric measurements36 – but may be problematic for more heterogeneous boundary layer sites, where inappropriate application of eqn (E3) could lead to erroneous measures of additional HONO sources. A further frequently applied metric is the HONO/NO2 (and HONO/NOx) ratio – considered a better conserved quantity than HONO in isolation given the interchange between them – but again potentially subject to bias in heterogeneous environments given the different chemical lifetimes of HONO, NO and NO2. It should be noted that eqn (E3) as presented here is the most simple representation of the dominant chemical terms in the HONO continuity equation; various studies have extended this to incorporate (for example) nitrophenol photolysis47 and surface deposition of NO2.19
Here, we briefly evaluate the “additional” HONO source S, and HONO/NO2 and HONO/NOx ratios, using a new set of field data from an urban background site. We then illustrate the errors in S and the HONO![[thin space (1/6-em)]](https://www.rsc.org/images/entities/char_2009.gif) :
:![[thin space (1/6-em)]](https://www.rsc.org/images/entities/char_2009.gif) NOx ratios which may arise from non-PSS situations using a range of simple illustrative box-model simulations, building upon the insights of Lee et al.;48 and present new on-road spatially resolved measurements of HONO and NOx to investigate the likelihood of these effects being present in real-world, non-remote, continental boundary layer locations. The consequences for interpretation of in situ field data to infer missing atmospheric processes are discussed.
NOx ratios which may arise from non-PSS situations using a range of simple illustrative box-model simulations, building upon the insights of Lee et al.;48 and present new on-road spatially resolved measurements of HONO and NOx to investigate the likelihood of these effects being present in real-world, non-remote, continental boundary layer locations. The consequences for interpretation of in situ field data to infer missing atmospheric processes are discussed.
3 Field observations of HONO, OH and NOx
Field measurements were performed on the campus of the University of York (UK) for a four-week period in early summer (June) 2014, as part of the NERC-funded “Missing OH Reactivity” campaign. The measurement location is considered an urban background site, with light passenger car/LGV traffic around University access roads to the East and West of the site, and bordering farmland to the South-East. The University campus is located 3 km from York city centre (to the North-West), and 1.75 km from the nearest major road(s) (the A64 to the South-East). Measurements were made ca. 3.5 m above ground level, with instrument inlets co-located horizontally (within 2 m) and vertically (within 0.5 m).OH radicals were measured by laser-induced fluorescence (LIF), using the Fluorescence Assay by Gas Expansion (FAGE) technique; full details of the instrument and approach are given elsewhere.2,49,50 OH was determined using the wavelength modulation methodology. NO and NO2 were measured using chemiluminescence, with photolytic NO2 conversion.51 O3 was measured using a conventional UV absorption monitor (TEI 49i). HONO was measured using a LOPAP (Long-Path Absorption Photometer) instrument.8 Photolysis frequencies were determined using a calibrated spectral radiometer (Ocean Optics), alongside basic meteorological parameters.
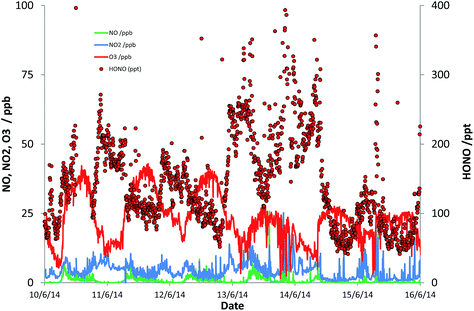
Fig. 1 presents a representative sub-set of the measured timeseries for NO, NO2, O3 and HONO, to illustrate the typical conditions observed. NOx levels ranged between 0.48 and 45 ppb [mean 6.3 ppb; median 4.8 ppb]; HONO levels ranged between 33 ppt and 1.15 ppb [mean 190 ppt; median 156 ppt], while the mean daytime maximum OH concentration was 2.2 × 10⁶ molec cm−3. Descriptive statistics here and subsequently relate to the 2526, 15 minute observations for which all of OH, NO, HONO and photolysis frequencies were satisfactorily measured (i.e. excluding missing data); this represents 48% of all measurement times.
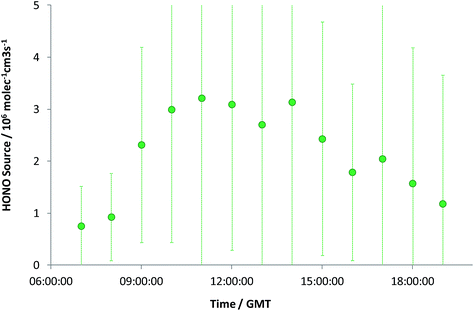
The observed HONO levels were higher than simple steady-state eqn (E2) would predict, by a factor of 1.8 (median). Eqn (E3) was applied to derive the inferred additional HONO source, under the approximation/assumption of the validity of PSS – as noted above, this is the most simple treatment of HONO chemistry, and we stress this neglects (for example) mixing, HONO deposition and other “known” HONO sources such as nitrophenol photolysis – but these have been shown to be minor terms in the urban background HONO budget.19 The resulting “missing HONO source” is shown in Fig. 2, and follows a clear diurnal profile, peaking at ca. 3.2 × 10⁶ molec cm−3 s−1 or approximately 1.3 × 10⁻⁴ ppb s−1. This value is comparable to that reported in similar locations recently (e.g. Michoud et al.:22 suburban Paris, (0.7–1.9) × 10−4 ppb s−1; Lee et al.:19 North Kensington, London, August: 2.5 × 10⁻⁴ ppb s−1), although we note that a range of non-PSS sources (omission of which would increase the retrieved additional HONO production) were also considered in these studies.
The observed source is very strongly correlated with the NO2 photolysis frequency (j5) as shown in Fig. 3a (although many photolysis parameters will follow a similar pattern). The hourly mean diurnal measured HONO/NOx and HONO/NO2 ratios for daytime (here, defined as 07:00–20:00) are shown in Fig. 3b; the ratios averaged factors of 0.031 and 0.040 respectively. Interestingly, the mean ratios increase through the day, potentially indicating some degree of hysteresis. This is the opposite trend in behaviour to that expected for e.g. depletion of a surface HONO reservoir deposited during the night.52
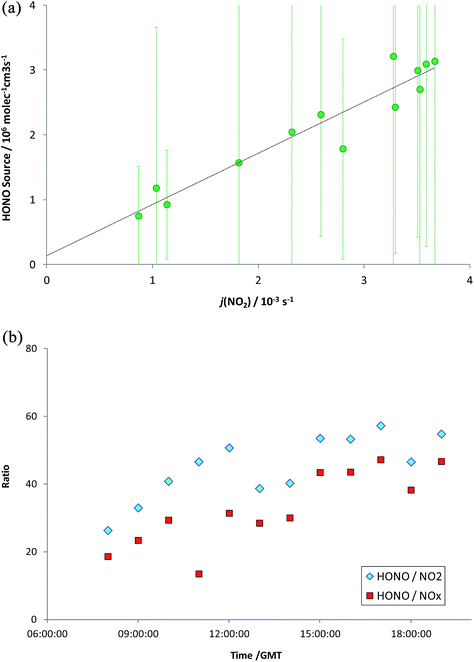 | ||
| Fig. 3 (a) Variation in missing HONO source with NO2 photolysis frequency, jNO2. Error bars as for Fig. 2. (b) HONO/NO2 and HONO/NOx ratios (hourly mean values). | ||
Interpretation of the observationally-derived values of S and the HONO/NO2 and HONO/NOx ratios presented above depends upon the assumption that HONO, OH and NO, HONO and NO2, or HONO and NOx, are in photostationary steady state. To qualitatively assess this assumption, we have performed a series of simple model simulations to illustrate the evolution of OH, NOx, HONO and hence S under a series of scenarios.
4 Illustrative model simulations
Model simulations were performed using a zero-dimensional box model, employing standard inorganic chemistry and oxidation of CO and CH4 (only) as implemented in the Master Chemical Mechanism (MCM) v3.1.53,54 The only HONO processes in this mechanism are reactions (1)–(3). The model was initiated with chemical conditions representative of a suburban background mid-latitude boundary layer airmass (CO = 200 ppb; CH4 = 1850 ppb; O3 = 40 ppb; NOx = 5 ppb – no initial HONO), and allowed to spin-up for a 1 hour period prior to the perturbations outlined below. For simplicity, photolysis frequencies were held constant, and correspond to those calculated for Birmingham (UK) at midday on 1 July (SZA = 30°). Temperature, pressure and RH were set to 293 K, 1 bar and 70% respectively. No mixing or deposition processes were considered – solely photochemical reactions and emissions as outlined below. Many aspects of this simulation are therefore highly simplified in comparison to any real world environment – but serve to illustrate the impacts of the HONO–NOx–OH system. In the discussion below, the following terminology is adopted:| HONOMODEL | The model-calculated HONO concentration – as would be measured in the atmosphere, if only reactions (1)–(4) affected HONO abundance |
| HONOPSS | The HONO concentration calculated using eqn (E2), from the modelled OH, NO and model jHONO values. This is equivalent to the value which would be derived from measured OH, NO and jHONO in the atmosphere, assuming PSS |
| Inferred source S | The “missing” HONO source calculated using eqn (E3), from the modelled OH, NO, HONO and model jHONO values – as would be derived measured OH, NO, HONO and jHONO in atmospheric field measurements, assuming PSS |
Scenario 1
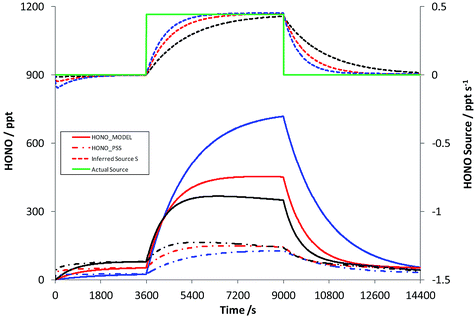
Scenario 1 represents an airmass arriving over a region of continuous HONO emissions – for example, a step change in soil emissions with different surface/vegetation type. A HONO source strength of 1.1 × 10⁷ molec cm−3 s−1 was used, equivalent to the soil bacterial emission inferred for wheat fields of 258 ng N m−2 s−1 as reported by Oswald et al. (2013),38 in a well-mixed boundary layer height of 1000 m; the HONO source was turned on at t = 1 hour and off again at t = 2.5 hours (in reality, the daytime lifetime of HONO is insufficient for even mixing throughout a deep boundary layer). Fig. 4 shows the resulting time series of HONOMODEL, HONOPSS and the true (solid green line) and Inferred Source S, as a function of photolysis rates – for the base case, and increases/decreases in all photolysis frequencies of 50%.Initially, HONO is zero within the model, and over the first 20 min of the simulation approaches steady state with OH and NO, as described by reactions (1)–(3). Upon addition of the HONO emission (at t = 1 hour), HONOMODEL rises to reach ca. 450 ppt at the end of the source-on period (under base case photolysis rates – solid red line), while the steady-state derived HONO, which excludes the missing source, is substantially lower at ca. 140 ppt (dot-dash red line). The inferred HONO source (dashed red line) substantially underestimates the true source (solid green line) initially, approaching to within 90% of the true source after 34.5 minutes. The impact of increased/reduced photolysis frequencies is shown in red and blue respectively – variations of ±50% versus the base case. Decreased actinic flux increases the true HONO level, as would be expected, but also substantially increases the time for the inferred source strength to approach the true value, with 90% agreement only achieved after 61 minutes. Similarly the HONOPSS, as derived from eqn (E2), increases with the increase in photolysis – as the combined increases in OH and NO (i.e. the rate of R1) exceed the increase in the HONO photolysis frequency j2. The error in the inferred source S is substantial, persists for a significant time (of the order of tens of minutes) following a step-change in HONO emissions, and is greater under conditions of lower solar intensity. The model simulation here omits other potential HONO sinks, such as deposition. These will reduce the HONO lifetime, and hence shorten the time for PSS to be established; in this sense the results in Fig. 4 represent a worst-case scenario in terms of the time required to approach steady state.
Scenario 2
Scenario 2 represents an airmass receiving a transient injection of emissions (NOx, and/or HONO, and/or VOCs) – for example a parcel of air making a perpendicular transect across a roadway. As for Scenario 1, the model was initialised and allowed to spin-up under typical continental suburban conditions; photolysis rates were held constant, and the evolution of modelled HOx, NOx and HONO was investigated with a one-off increase (implemented within the model as instantaneous step changes) of NO (8 ppb)/NO2 (2 ppb)/HONO (0.1 ppb), representing an estimated present-day real-world mean UK fleet NO/NO2 ratio with an f-NO2 value of ca. 20%,55 plus 1% HONO (at the upper end of the range recently reported for China56 – no data are available for the UK).
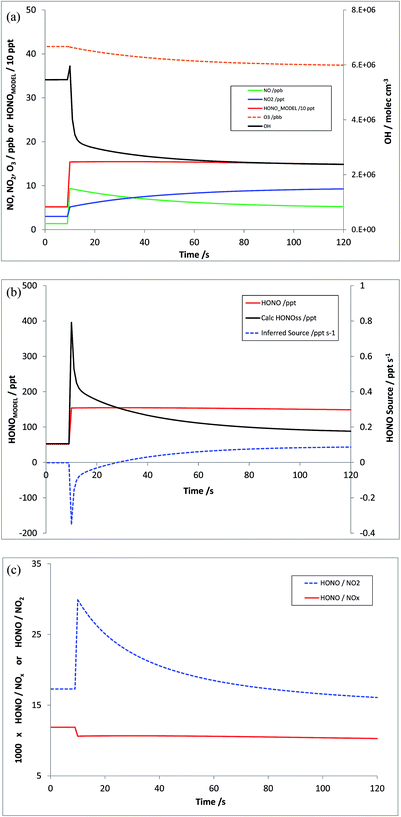
Fig. 5a shows the modelled timeseries of OH, NO, NO2, O3 and HONO, for a 120 second period around the injection point. The initial increases in NOx, their relaxation to PSS with O3, and the response of OH (an initial increase from NO-driven CH3O2 and HO2 titration, followed by reduction reflecting primarily the evolving additional NO2 sink) are apparent. Fig. 5b shows the calculated HONOMODEL (red; with essentially a step-change driven by the emission), the calculated HONOPSS (black), and the resulting inferred HONO source strength (shown by the dashed blue line). At all points following the injection, the true HONO source strength is zero; however the non-equilibrium abundances lead to an initially negative inferred additional source, switching to positive after ca. 30 seconds, peaking at 2.5 minutes, and relaxing to a near-zero value on a timescale of tens of minutes (the e-folding lifetime of S here is 17 minutes). Fig. 5c shows the evolution of the model-derived HONO![[thin space (1/6-em)]](https://www.rsc.org/images/entities/char_2009.gif) :
:![[thin space (1/6-em)]](https://www.rsc.org/images/entities/char_2009.gif) NO2 (blue dashes) and HONO
NO2 (blue dashes) and HONO![[thin space (1/6-em)]](https://www.rsc.org/images/entities/char_2009.gif) :
:![[thin space (1/6-em)]](https://www.rsc.org/images/entities/char_2009.gif) NOx (solid red) ratios (multiplied by 1000, i.e. as ppt/ppb) – which may be compared with the emission ratios within the model simulation here of 0.05% and 1% respectively (or 50 and 10, when scaled by 1000). The absolute values of these are of course directly dependent upon the pre-existing model NOx as well as the emission ratio.
NOx (solid red) ratios (multiplied by 1000, i.e. as ppt/ppb) – which may be compared with the emission ratios within the model simulation here of 0.05% and 1% respectively (or 50 and 10, when scaled by 1000). The absolute values of these are of course directly dependent upon the pre-existing model NOx as well as the emission ratio.
Scenario 3
Scenario 3 represents a repeat of Scenario 2, without the inclusion of the HONO source – i.e. just addition of NO and NO2, at the levels outlined above. The resulting modelled HONO and inferred HONO source is shown in Fig. 6a – the equivalent of Fig. 5b. In this case, HONOMODEL is near-zero, rising slightly in response to the changing NOx (and hence HOx) abundance, but the calculated HONOPSS, and hence the inferred HONO source, respond substantially to the NOx addition – giving an inferred HONO source S which is negative at all times. The evolution of the corresponding model-derived HONO![[thin space (1/6-em)]](https://www.rsc.org/images/entities/char_2009.gif) :
:![[thin space (1/6-em)]](https://www.rsc.org/images/entities/char_2009.gif) NO2 and HONO
NO2 and HONO![[thin space (1/6-em)]](https://www.rsc.org/images/entities/char_2009.gif) :
:![[thin space (1/6-em)]](https://www.rsc.org/images/entities/char_2009.gif) NOx ratios (multiplied by 1000) is shown in Fig. 6b – the true emission ratios in this case being zero, and the pre-injection values reflecting the background model steady state.
NOx ratios (multiplied by 1000) is shown in Fig. 6b – the true emission ratios in this case being zero, and the pre-injection values reflecting the background model steady state.
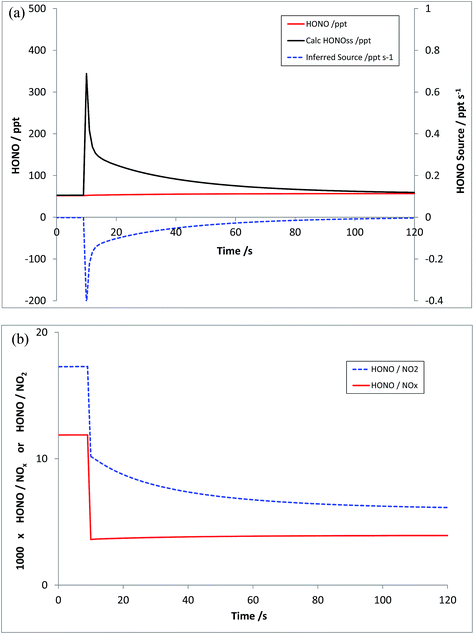 | ||
| Fig. 6 Scenario 3 – addition of NO and NO2 (only) to an air parcel. HONOMODEL, HONOPSS and inferred HONO source strength (panel a, top), and calculated HONO/NO2 and HONO/NOx ratios (panel b, bottom). | ||
Scenario 4
Scenario 4 explores the impact of (initially) OH-only perturbations, through addition of VOCs alone. The model was re-run, under the same initial conditions, with an “emission” or step-change in CH4 and CO of 5550 and 600 ppb respectively – which represents a four-fold increase in OH reactivity (from parent VOCs – a slightly smaller increase overall considering degradation products and NOy). Fig. 7a shows the resulting changes in modelled OH, and HONOMODEL, while Fig. 7b shows the corresponding values of HONOPSS and the inferred HONO source strength S – the latter displaying a positive bias (from the true value of zero), although smaller than the magnitude of the initial signal in Scenario 3 (by a factor of 10), decaying rapidly to near-zero levels. The increase in VOC levels here is a modest change in the total OH reactivity, which at ca. 5.9 s−1 (CH4 and CO) is substantially below that observed recently in London (ca. 20 s−1 (ref. 57 and 58)) and elsewhere – although the reduction in modelled OH following VOC addition (and hence the inferred source strength S) does not scale linearly with k′OH.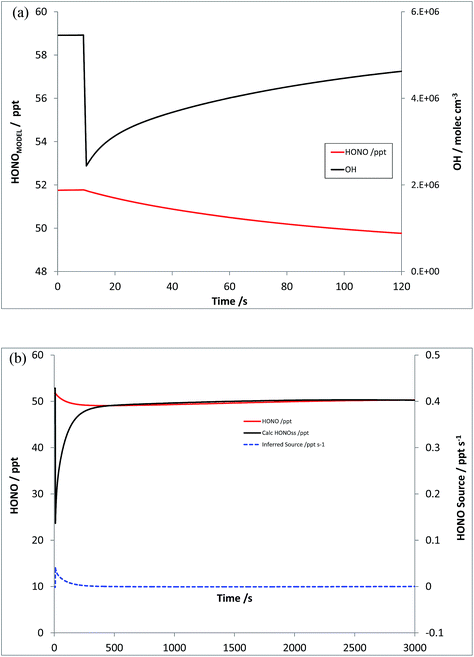 | ||
| Fig. 7 Scenario 4 – increase in VOC reactivity only (no NOx addition). Simulated HONOMODEL and OH timeseries (panel a, top) and HONOPSS and inferred HONO source strength (panel b, bottom). | ||
The model scenarios therefore illustrate the substantial time required for the photostationary state approach to yield accurate results following substantial perturbations in the HOx/NOy/NOy chemistry. They also illustrate the scope for bias to the inferred HONO source from NOx and VOC emissions, in the absence of any true HONO signal. The bias to the inferred HONO source strength may be either positive or negative, depending upon the airmass age following emission, for the more realistic mixed NOx–HONO emission scenario.
The HONO/NO2 ratio evolves substantially following emission in the road-transect Scenario (2), and will only reflect emissions when the background NOx is negligible compared with the emission (a consequence of the ambient daytime NO2/NO ratio favouring NO2, but the vehicle-emitted NOx being predominantly NO, to broadly equal but opposite extents – dependent of course upon O3, jNO2, vehicle identity etc.). In contrast, ambient downwind HONO/NOx ratios are a much better reflection of the emitted species (due to the NO/NO2 relative abundance considerations), and evolve much more slowly (as they are independent of establishment of the NOx–O3 PSS) following emission.
The question which then arises is, how spatially variable is HONO (and the HONO/NOx, HONO/NO2 ratios etc.) in the real environment – in particular in non-remote environments where there is substantial landscape and built environment heterogeneity – are the challenges illustrated in Scenarios 1–4 evident in actual measurements? To explore this issue, we present exploratory spatially resolved measurements of HONO and NOx abundance, performed using a mobile instrumented laboratory in Birmingham (UK) and the surrounding areas.
5 Real-world spatial variation of boundary layer HONO, NO and NO2
The measurements reported here were performed around the University of Birmingham campus, Birmingham city centre and suburbs, and on a transect between Birmingham and Leicester, 50 km to the north east, along the M6/M69 motorway/freeway through an otherwise largely rural region. Instruments were mounted in a mobile laboratory, based upon a modified light goods van, with on-board power provided through batteries/inverters and a UPS system, data logging, GPS and camera facilities for chase vehicle emission “sniffing”. HONO was measured using the LOPAP methodology as outlined above; for each measurement the system was thoroughly warmed up on mains power for several hours prior to on-road measurements. NO and NO2 were measured using chemiluminescence, with a TE 42i-TL NOx monitor – this unit is fitted with a molybdenum converter for NO2 measurements; the approach suffers from known lack of specificity with respect to other nitrogen oxides in the NO2 conversion unit, and the NO2 data may consequently be more reflective of NOy – although little time may have elapsed for NOx oxidation. O3 was measured using a conventional UV absorption monitor (TE 49i). All the monitors sampled from a roof-mounted inlet which protruded directly above and forwards of the front of the vehicle, with the exception of HONO which was sampled from a port on the vehicle side, with the sampling inlet unit located to protrude well beyond the vehicle boundary layer. The measurement time resolution (instrument response times) were 60 s for the NOx instrument and 20 s for the O3 instrument (with (shared) inlet residence time adding negligibly to this). HONO values were obtained every 30 seconds, but the instrument response time is ca. 4.5 minutes – the LOPAP approach is not optimised for high time resolution study, owing to the liquid residence/circulation time, and reagent diffusion. Data were corrected for all instrument lags.Fig. 8a shows the observed HONO and NOx time series for one deployment, which included the University of Birmingham campus (considered an urban background location), and a transect through Birmingham City Centre to the University of Leicester campus, and the return journey, performed on 23rd October 2015. There was a ∼2 hour break in between the outward and return legs of the journey (battery change/recharge). A clear correlation between NOx and HONO is apparent to the eye, although variable in scale (comparing e.g. 12:30 and 13:00). Fig. 8b shows the HONO/NO2 and HONO/NOx ratios, as a function of measurement time point (same dataset as Fig. 8a). The ratios are clearly highly variable, but with patterns reflecting similar values/trends between adjacent measurement points – showing the variation spatially during the journey. To illustrate this more clearly, the spatial trends in the HONO measurements, and HONO/NOx ratio, are shown in Fig. 9a and b (for the whole journey) and Fig. 10a and b (for a zoom in of the region around Leicester).
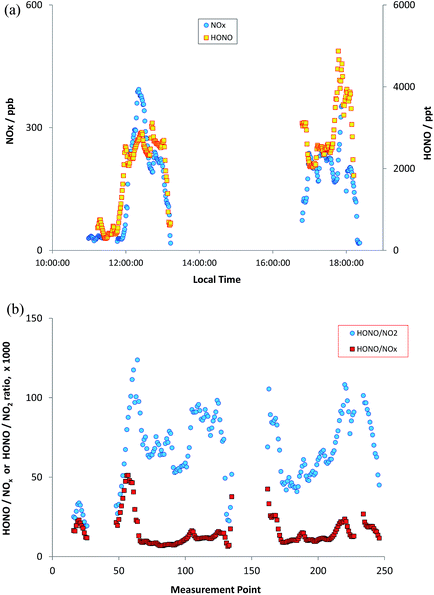 | ||
| Fig. 8 Measured HONO and NOx (panel a, upper) and HONO/NO2 and HONO/NOx ratios (panel b, lower) during on-road measurements, transect from Birmingham to Leicester & return. | ||
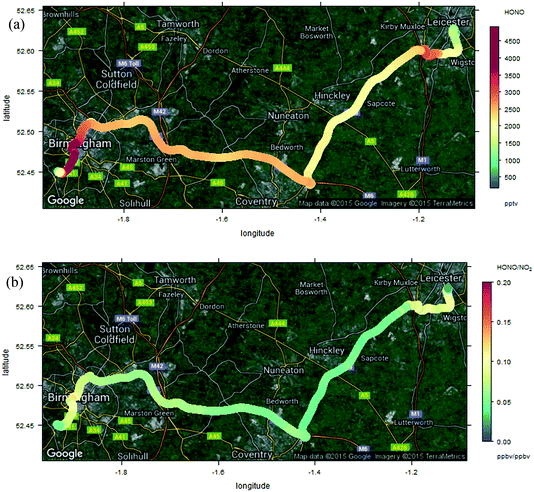 | ||
| Fig. 9 Measured HONO (panel a, upper) and HONO/NO2 ratio (panel b, lower) during Birmingham–Leicester transect. | ||
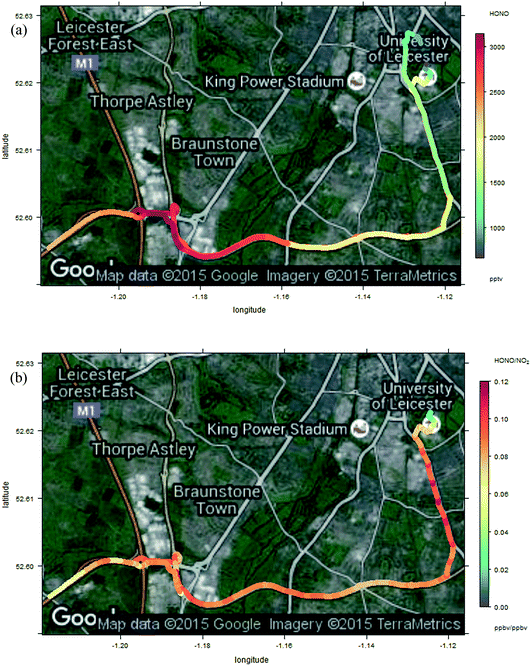 | ||
| Fig. 10 Enlargement of Fig. 9 – measured HONO (panel a, upper) and HONO/NO2 ratio (panel b, lower) around the Leicester end of the journey, including open highway, congested major urban artery and urban background sections, from bottom-left to top-right respectively. | ||
The measured HONO and NO2 data, and resulting HONO/NO2 ratio, show substantial variation across the measurement sites. Elevated HONO is observed in the city centre, consistent with emissions from traffic, or from other urban activities (or from conversion of traffic-emitted NOx, which displays a similar spatial variation). The “hot spots” around the city centres are more localised than might be expected – at the ground level windspeed of 14 km h−1, the HONO lifetime of 17 min (value for 12:30 GMT 23 Oct Birmingham, as calculated by TUV – for clear skies, hence a lower limit to the lifetime) corresponds to a horizontal distance of around 4 km, and a greater spatial influence of the urban environments might have been expected. The relatively slow time response of the LOPAP analyser would be expected to exacerbate such a pattern in the retrieved values. Local topography may have contributed to this, e.g. “street canyon” type environments within the highway infrastructure concrete architecture.
HONO (and NOx) levels are much more uniform on the open motorway/highway section of the journey; this is particularly clear from Fig. 11, which displays the mean (±1 standard deviation) HONO/NOx ratios observed for each environment, spatially defined, during the measurements. The values for the two “motorway” periods are very similar, and with much smaller variability, while the urban centres – Birmingham, Leicester – have similar but much more variable values for the ratio. The decrease in variability apparent across the figure may also reflect the increasing HONO and NOx lifetime, later in the day, as photolysis rates declined. The HONO/NO2 ratio is very highly variable (Fig. 8) – more so than the HONO/NOx ratio – reflecting the issues outlined above (impact of substantial evolution of the NOx PSS following emission, reflecting the differing ratios of NO![[thin space (1/6-em)]](https://www.rsc.org/images/entities/char_2009.gif) :
:![[thin space (1/6-em)]](https://www.rsc.org/images/entities/char_2009.gif) NO2 in exhaust and in background daytime air). For these reasons the HONO/NO2 ratio is much less robust a metric of emissions, and much more sensitive to measurement location vs. post-emission airmass age, than the HONO/NOx ratio, for consideration of traffic sources. As all the environments probed here would be expected to be at least influenced, and in some cases dominated, by traffic emissions, this result may point to multiple sources contributing to the observed HONO levels. Variability in the HONO–NO2 ratio with time (at the same location: weekday vs. weekend) was recently reported,59 indicating the importance of non-direct-emission sources.
NO2 in exhaust and in background daytime air). For these reasons the HONO/NO2 ratio is much less robust a metric of emissions, and much more sensitive to measurement location vs. post-emission airmass age, than the HONO/NOx ratio, for consideration of traffic sources. As all the environments probed here would be expected to be at least influenced, and in some cases dominated, by traffic emissions, this result may point to multiple sources contributing to the observed HONO levels. Variability in the HONO–NO2 ratio with time (at the same location: weekday vs. weekend) was recently reported,59 indicating the importance of non-direct-emission sources.
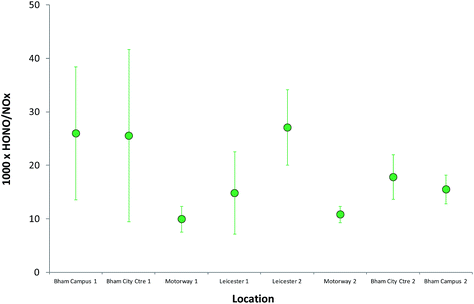 | ||
| Fig. 11 Mean (±1 standard deviation) HONO/NOx ratios observed for each environment, spatially defined, during the on-road transect measurements. | ||
OH observations were not feasible for the mobile measurements, so analysis to determine the relationship between NO, OH and HONO and any additional HONO source is not possible; however the sharp spatial gradients in HONO in the urban centre (Fig. 10a) highlight the challenge of application of this approach to spatially heterogeneous regions, including near to major roadways (e.g. the M1–A42 junction region shown in the lower left of Fig. 10a) – the real-world equivalent of the problems demonstrated in Fig. 5b. In contrast, in environments which are homogeneous on spatial scales of a few km (e.g. the “motorway” segments of the transect in the centre of Fig. 9a), the approximation of the steady state approach is likely to hold. The situation in urban background regions, similar to those employed in a number of previous studies (including the data presented here) is more complex – within the Birmingham and Leicester environments, regions of consistent HONO and NOx abundance are apparent, but also substantial deviations from these – in the vicinity of major road-ways, pointed to traffic sources of HONO (and/or, of NOx which can be converted to HONO through the various mechanisms outlined above). Application of the PSS approach eqn (E3) in such locations may be problematic, because the substantial spatial heterogeneity indicates that local PSS is not achieved, and hence inferred additional source contributions may be inaccurate.
Alternative approaches are required to definitively constrain HONO sources, alongside analyses of point concentration measurements. These include flux measurements for surface sources, obtained using vertically resolved observations;32–34 laboratory and tunnel investigations of specific processes,42,60 and ensuring that where the PSS methods are applied to field data, the environments are sufficiently homogeneous16,21 or decoupled36 that local spatial variability concerns do not apply.
6 Conclusions
A substantial body of literature has shown that HONO levels are higher than can be explained by simple/established gas-phase chemistry (reactions (1)–(3)) supporting the existence of additional sources, and hence the role of HONO as an important net OH precursor in the boundary layer. Application of the PSS approach can quantify the missing source strength, but only where HONO, NOx and OH are in photochemical steady state; the timescale for this to be established (tens of minutes) is non-negligible compared with spatial heterogeneity in many continental environments (although most remote environments will satisfy this condition). Non-chemical-equilibrium conditions can lead to such analyses inferring the presence of additional HONO sources where these do not exist, and can bias such analyses in both positive and negative directions. The HONO/NOx ratio is a more robust tracer of emissions characteristics than the HONO/NO2 ratio during daytime (although the latter is a key tool for constraint of NO2–HONO surface conversion processes and ground fluxes away from local emission sources). Measurements of the spatial variability of HONO in urban, suburban and rural environments in the UK show that pronounced changes in abundance are found in proximity to major roads within urban areas – indicating that PSS analyses in such areas are likely to be problematic – but also areas of very homogeneous HONO and NOx abundance in rural, and some suburban, regions, where the PSS approach may be valid.Acknowledgements
This work was supported in part by the Natural Environment Research Council, grants NE/K012169/1 (Integrated Chemistry of Ozone in the Atmosphere), NE/M013545/1 (Sources of Nitrous Acid in the Atmospheric Boundary Layer) and NE/J008990/1 (Identification of missing organic reactivity in the urban troposphere). We thank Ajit Singh (UoB) for discussions regarding HONO variability. The Leeds FAGE instrumentation is supported by the NERC National Centre for Atmospheric Science.References
- H. Levy, Science, 1971, 173, 141 CAS.
- D. E. Heard and M. J. Pilling, Chem. Rev., 2003, 103, 5163 CrossRef CAS PubMed.
- F. Rohrer and H. Berresheim, Nature, 2006, 442, 184 CrossRef CAS PubMed.
- J. Kleffmann, ChemPhysChem, 2007, 8, 1137 CrossRef CAS PubMed.
- D. Perner and U. Platt, Geophys. Res. Lett., 1979, 6, 917 CrossRef CAS.
- J. Stutz, B. Alicke, R. Ackermann, A. Geyer, S. Wang, A. B. White, E. J. Williams, C. W. Spicer and J. D. Fast, J. Geophys. Res., 2004 DOI:10.1029/2003jd004209.
- S. M. Ball and R. L. Jones, Chem. Rev., 2003, 103, 5239 CrossRef CAS PubMed.
- J. Heland, J. Kleffmann, R. Kurtenbach and P. Wiesen, Environ. Sci. Technol., 2001, 35, 3207 CrossRef CAS PubMed.
- G. Huang, X. Zhou, G. Deng, H. Qiao and K. Civerolo, Atmos. Environ., 2002, 36, 2225 CrossRef CAS.
- J. E. Dibb, M. Arsenault, M. C. Peterson and R. E. Honrath, Atmos. Environ., 2002, 36, 2501 CrossRef CAS.
- W. Liao, A. Hecobian, J. Mastromarino and D. Tan, Atmos. Environ., 2006, 40, 17 CrossRef CAS.
- T. Jurkat, C. Voigt, F. Arnold, H. Schlager, J. Kleffmann, H. Aufmhoff, D. Schäuble, M. Schaefer and U. Schumann, Geophys. Res. Lett., 2011 DOI:10.1029/2011gl046884.
- M. Ródenas, A. Muñoz, F. Alacreu, T. Brauers, H.-P. Dorn, J. Kleffmann, and W. Bloss, Assessment of HONO Measurements: The FIONA Campaign at EUPHORE, Disposal of Dangerous Chemicals in Urban Areas and Megacities, NATO Science for Peace & Security Series C: Environmental Security, ed. I. Barnes and K. J. Rudzínski, 2012, ch. 4, pp. 45–58, DOI:10.1007/978-94-007-5034-0_4.
- X. Ren, H. Harder, M. Martinez, R. L. Lesher, A. Oliger, J. B. Simpas, W. H. Brune, J. J. Schwab, K. L. Demerjian, Y. He, X. Zhou and H. Gau, Atmos. Environ., 2003, 37, 3639 CrossRef CAS.
- X. Ren, W. H. Brune, J. Mao, M. J. Mitchell, R. L. Lesher, J. B. Simpas, A. R. Metcalf, J. J. Scwabb, C. Caib, Y. Lib, K. L. Demerjian, H. D. Felton, G. Boynton, A. Adams, J. Perry, Y. Hed, X. Zhou and J. Hou, Atmos. Environ., 2006, 40, S252 CrossRef CAS.
- J. Kleffman, T. Gavriloaiei, A. Hofzumahaus, F. Holland, R. Koppmann, L. Rupp, E. Schosser, M. Siese and A. Wahner, Geophys. Res. Lett., 2005, 32 DOI:10.1029/2005gl022524.
- V. Michoud, A. Kukui, M. Camredon, A. Colomb, A. Borbon, K. Miet, B. Aumont, M. Beekmann, R. Durand-Jolibois, S. Perrier, P. Zapf, G. Siour, W. Ait-Helal, N. Locoge, S. Sauvage, C. Afif, V. Gros, M. Furger, G. Ancellet and J. F. Doussin, Atmos. Chem. Phys., 2012, 12, 11951 CAS.
- S. Kim, T. C. VandenBoer, C. J. Young, T. P. Riedel, J. A. Thornton, B. Swarthout, B. Sive, B. Lerner, J. B. Gilman, C. Warneke, J. M. Roberts, A. Guenther, N. L. Wagner, W. P. Dubé, E. Williams and S. S. Brown, J. Geophys. Res., 2014 DOI:10.1002/2013jd019784.
- J. D. Lee, L. K. Whalley, D. E. Heard, D. Stone, R. E. Dunmore, J. F. Hamilton, D. E. Young, J. D. Allan, S. Laufs and J. Kleffmann, Atmos. Chem. Phys., 2015, 15, 22097 Search PubMed.
- X. Li, T. Brauers, R. Häseler, B. Bohn, H. Fuchs, A. Hofzumahaus, F. Holland, S. Lou, K. D. Lu, F. Rohrer, M. Hu, L. M. Zeng, Y. H. Zhang, R. M. Garland, H. Su, A. Nowak, A. Wiedensohler, N. Takegawa, M. Shao and A. Wahner, Atmos. Chem. Phys., 2012, 12, 1497 CrossRef.
- R. Oswald, M. Ermel, K. Hens, A. Novelli, H. G. Ouwersloot, P. Paasonen, T. Petäjä, M. Sipilä, P. Keronen, J. Bäck, R. Königstedt, Z. Hosaynali Beygi, H. Fischer, B. Bohn, D. Kubistin, H. Harder, M. Martinez, J. Williams, T. Hoffmann, I. Trebs and M. Sörgel, Atmos. Chem. Phys., 2015, 15, 799 CrossRef.
- V. Michoud, A. Colomb, A. Borbon, K. Miet, M. Beekmann, M. Camredon, B. Aumont, S. Perrier, P. Zapf, G. Siour, W. Ait-Helal, C. Afif, A. Kukui, M. Furger, J. C. Dupont, M. Haeffelin and J. F. Doussin, Atmos. Chem. Phys., 2014, 14, 2805 Search PubMed.
- Y. F. Elshorbany, R. Kurtenbach, P. Wiesen, E. Lissi, M. Rubio, G. Villena, E. Gramsch, A. R. Rickard, M. J. Pilling and J. Kleffmann, Atmos. Chem. Phys., 2009, 9, 2257 CrossRef CAS.
- R. M. Harrison and A.-M. N. Kitto, Atmos. Environ., 1994, 28, 1089 CrossRef CAS.
- B. J. Finlayson-Pitts, L. M. Wingen, A. L. Sumner, D. Syomin and K. A. Ramazan, Phys. Chem. Chem. Phys., 2003, 5, 223 RSC.
- M. Ammann, M. Kalberer, D. T. Jost, L. Tobler, E. Rossler, D. Piguet, H. W. Gäggeler and U. Baltensperger, Nature, 1998, 395, 157 CrossRef CAS.
- C. George, R. S. Strekowski, J. Kleffmann, K. Stemmler and M. Ammann, Faraday Discuss., 2005, 130, 195 RSC.
- K. Stemmler, M. Ammann, C. Donders, J. Kleffmann and C. George, Nature, 2006, 440, 195 CrossRef CAS PubMed.
- J. M. Langridge, R. J. Gustafsson, P. T. Griffiths, R. A. Cox, R. M. Lambert and R. L. Jones, Atmos. Environ., 2009, 43, 5128 CrossRef CAS.
- X. Zhou, N. Zhang, M. TerAvest, D. Tang, J. Hou, S. Bertman, M. Alaghmand, P. B. Shepson, M. A. Carroll, S. Griffith, S. Dusanter and P. S. Stevens, Nat. Geosci., 2011, 4, 440 CrossRef CAS.
- C. J. Young, R. A. Washenfelder, J. M. Roberts, L. H. Mielke, H. D. Osthoff, C. Tsai, O. Pikelnaya, J. Stutz, P. R. Veres, A. K. Cochran, T. C. VendenBoer, J. Flynn, N. Grossberg, C. L. Haman, B. Lefer, H. Stark, M. Graus, J. de Gouw, J. B. Gilman, W. C. Kuster and S. S. Brown, Environ. Sci. Technol., 2012, 46, 10965 CrossRef CAS PubMed.
- B. Vogel, H. Vogel, J. Kleffmann and R. Kurtenbach, Atmos. Environ., 2003, 37, 2957 CrossRef CAS.
- N. Zhang, X. Zhou, P. B. Shepson, H. Gao, M. Alaghmand and B. Stirm, Geophys. Res. Lett., 2009, 36 DOI:10.1029/2009gl038999.
- T. C. VandenBoer, S. S. Brown, J. G. Murphy, W. C. Keene, J. C. Young, A. A. P. Pszenny, S. Kim, C. Warneke, J. A. de Gouw, J. R. Maben, N. L. Wagner, T. P. Riedel, J. A. Thornton, D. E. Wolfe, W. P. Dubé, F. Öztürk, C. A. Brock, N. Grossberg, B. Lefer, B. Lerner, A. M. Middlebrook and J. M. Roberts, J. Geophys. Res., 2013 DOI:10.1002/jgrd.50721.
- J. Kleffmann and P. Wiesen, Atmos. Chem. Phys., 2005, 5, 77 CrossRef CAS.
- X. Li, F. Rohrer, A. Hofzumahaus, T. Brauers, R. Häseler, B. Bohn, S. Broch, H. Fuchs, S. Gomm, F. Holland, J. Jäger, J. Kaiser, F. N. Keutsch, I. Lohse, K. Lu, R. Tillmann, R. Wegener, G. M. Wolfe, T. F. Mentel, A. Kiendler-Scharr and A. Wahner, Science, 2014, 344, 292 CrossRef CAS PubMed.
- H. Su, Y. Cheng, R. Oswald, T. Behrendt, I. Trebs, F. X. Meixner, M. O. Andreae, P. Cheng, Y. Zhang and U. Pöschl, Science, 2011, 333, 1616 CrossRef CAS PubMed.
- R. Oswald, T. Behrendt, M. Ermel, D. Wu, H. Su, Y. Cheng, C. Breuninger, A. Moravek, E. Mougin, C. Delon, B. Loubet, A. Pommerening-Röser, M. Sorgel, U. Pöschl, T. Hoffmann, M. O. Andreae, F. X. Meixner and I. Trebs, Science, 2013, 341, 1233 CrossRef CAS PubMed.
- B. Weber, D. Wu, A. Tamm, N. Ruckteschler, E. Rodríguez-Caballero, J. Steinkamp, H. Meusel, W. Elbert, T. Behrendt, M. Sörgel, Y. Cheng, P. J. Crutzen, H. Su and U. Pöschl, Proc. Natl. Acad. Sci. U. S. A., 2015, 15, 15384 CrossRef PubMed.
- G. Lammel and J. N. Cape, Chem. Soc. Rev., 2006, 25, 361 RSC.
- F. Spataro and A. Ianniello, J. Air Waste Manage. Assoc., 2014, 64, 1232 CAS.
- C. George, M. Ammann, B. D'Anna, D. J. Donaldson and S. A. Nizkorodov, Chem. Rev., 2015, 115, 4218 CrossRef CAS PubMed.
- D. L. Chapman and L. K. Underhill, J. Chem. Soc., Trans., 1913, 103, 496 RSC.
- P. A. Leighton, Photochemistry of air pollution, Academic Press, New York, 1961 Search PubMed.
- A. Volz-Thomas, H. W. Pätz, N. Houben, S. Konrad, D. Mihelcic, T. Klüpfel and D. Perner, J. Geophys. Res., 2003, 108 DOI:10.1029/2001jd001255.
- Z. Hosaynali Beygi, H. Fischer, H. D. Harder, M. Martinez, R. Sander, J. Williams, D. M. Brookes, P. S. Monks and J. Lelieveld, Atmos. Chem. Phys., 2011, 11, 8497 Search PubMed.
- I. Bejan, Y. Abd El Aal, I. Barnes, T. Benter, B. Bohn, P. Wiesen and J. Kleffmann, Phys. Chem. Chem. Phys., 2006, 8, 2028 RSC.
- B. H. Lee, E. C. Wood, S. C. Herndon, B. L. Lefer, W. T. Luke, W. H. Brune, D. D. Nelson, M. S. Zahniser and J. W. Munger, J. Geophys. Res., 2013 DOI:10.1002/2013jd020341.
- D. Stone, L. K. Whalley and D. E. Heard, Chem. Soc. Rev., 2012, 41, 6348 RSC.
- L. K. Whalley, K. L. Furneaux, A. Goddard, J. D. Lee, A. Mahajan, H. Oetjen, K. A. Read, N. Kaaden, L. J. Carpenter, A. C. Lewis, J. M. C. Plane, E. S. Saltzman, A. Wiedensohler and D. E. Heard, Atmos. Chem. Phys., 2010, 10, 1555 CAS.
- J. D. Lee, S. J. Moller, K. A. Read, A. C. Lewis, L. Mendes and L. J. Carpenter, J. Geophys. Res., 2009, 114 DOI:10.1029/2009jd011878.
- T. C. VandenBoer, C. J. Young, R. K. Talukdar, M. Z. Markovic, S. S. Brown, J. M. Roberts and J. G. Murphy, Nat. Geosci., 2015, 8, 55 CrossRef CAS.
- C. Bloss, V. Wagner, M. E. Jenkin, R. Volkamer, W. J. Bloss, J. D. Lee, D. E. Heard, K. Wirtz, M. Martin-Reviejo, G. Rea, J. C. Wenger and M. J. Pilling, Atmos. Chem. Phys., 2005, 5, 641 CrossRef CAS.
- S. M. Saunders, M. E. Jenkin, R. G. Derwent and M. J. Pilling, Atmos. Chem. Phys., 2003, 3, 161 CrossRef CAS.
- D. C. Carslaw and G. Rhys-Tyler, Atmos. Environ., 2013, 81, 339 CrossRef CAS.
- Z. Xu, T. Wang, J. Wu, L. Xue, J. Chan, Q. Zha, S. Zhou, P. K. K. Loouie and C. W. Y. Luk, Atmos. Environ., 2015, 106, 100 CrossRef CAS.
- R. E. Dunmore, J. R. Hopkins, R. T. Lidster, J. D. Lee, M. J. Evans, A. R. Rickard, A. C. Lewis and J. F. Hamilton, Atmos. Chem. Phys. Discuss., 2015, 15, 9983, DOI:10.5194/acp-15-9983-2015.
- L. K. Whalley, L. K. D. Stone, B. Bandy, R. Dunmore, J. F. Hamilton, J. Hopkins, J. D. Lee, A. C. Lewis and D. E. Heard, Atmos. Chem. Phys. Discuss., 2016, 16, 2747, DOI:10.5194/acp-16-2747-2016.
- S. E. Pusede, T. C. VandenBoer, J. G. Murphy, M. Z. Markovic, C. J. Young, P. Veres, J. M. Roberts, R. A. Washenfelder, S. S. Brown, X. Ren, C. Tsai, J. Stutz, W. H. Brune, E. C. Browne, P. Wooldridge, A. R. Graham, R. Weber, A. H. Goldstein, S. Dusanter, S. Griffith, P. S. Stevens, B. Lefer and R. C. Cohen, Environ. Sci. Technol., 2015 DOI:10.1021/acs.est.5b02511.
- R. Kurtenbach, K. H. Becker, J. A. G. Gomes, J. Kleffmann, J. C. Lörzer, M. Spittler, P. Wiesen, R. Ackermann, A. Geyer and U. Platt, Atmos. Environ., 2001, 35, 3385 CrossRef CAS.
| This journal is © The Royal Society of Chemistry 2016 |

