 Open Access Article
Creative Commons Attribution 3.0 Unported Licence
Tailoring and visualizing the pore architecture of hierarchical zeolites
Ying
Wei
*,
Tanja E.
Parmentier
,
Krijn P.
de Jong
and
Jovana
Zečević
*
Inorganic Chemistry and Catalysis, Debye Institute for Nanomaterials Science, Utrecht University, Universiteitsweg 99, 3584 CG, Utrecht, Netherlands. E-mail: j.zecevic@uu.nl; y.wei@uu.nl; Fax: +31 30 2511027; Tel: +31 62 8834480
First published on 26th May 2015
Abstract
Recently the concept of hierarchical zeolites invoked more explicit attention to enhanced accessibility of zeolites. By realizing additional meso-/macroporosity with the intrinsic microporosity of zeolites, a hierarchical pore system arises which facilitates mass transport while maintaining the zeolite shape selectivity. A great number of synthesis strategies have been developed for tailoring the pore architecture of hierarchical zeolites. In this review, we give a general overview of different synthesis methods for introduction of additional porosity. Advantages and limitations of these different synthesis approaches are addressed. The assessment of pore structure is essential to build the link between the zeolite pore structure and its functionality. A variety of 2D and 3D microscopy techniques are crucial to visualize the hierarchical pore structure, providing unique and comprehensive information that, however, should be linked to the results of bulk characterization techniques as much as possible. The microscopy techniques are classified and discussed according to the different probes used, such as optical light, X-rays and electrons. Representative work is reviewed to elucidate the capability of each technique and their drawbacks.
1. Introduction
Zeolites are crystalline aluminosilicates of various structures containing ordered micropore networks and large active surfaces, rendering these materials their great importance as shape-selective adsorbents and catalysts in a wide range of industrial applications such as refinery and petrochemical processes.1–3 Zeolite micropores have the same dimensions as most molecules involved in the catalytic reactions they are applied for. Reactants that have larger dimensions than the channels in the zeolites will not be able to enter the pore system and diffuse to these active sites. This is called reactant shape selectivity and is illustrated in Fig. 1a. The shape of the zeolite pores can also influence the selectivity towards certain products. This is called transition state selectivity since a certain transition state is favoured over others due to the limited space in the pores, as shown in Fig. 1b. The last type is product shape selectivity, which is shown in Fig. 1c. Generated molecules that are relatively large will have a limited diffusivity to reach the end of the pores. These molecules will probably be converted to smaller products inside the zeolite or even contribute to the deactivation of the zeolite by blocking the pores or the formation of coke.4 According to the International Zeolite Association (IZA), to date over 200 zeolites with different structures have been discovered in nature or synthesized in the laboratory.5 Although there is such a variety of zeolites with different microporous systems, the zeolite with optimal structure can find utilization in different catalytic reactions.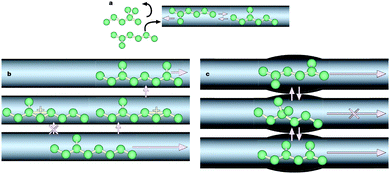 | ||
| Fig. 1 Different types of shape selectivity in zeolites. (a) Reactant shape selectivity: molecules that are too large to enter the zeolite pores cannot reach acid sites for reaction and are therefore not converted into products. (b) Transition state shape selectivity: molecules (and transition states) that are too large to fit inside a pore do not form. (c) Product shape selectivity: new molecules are formed in the adsorbed phase, but are too large to desorb as a product. (Reprinted from ref. 4 with permission, Copyright Nature Publishing Group.) | ||
Zeolite micropores are beneficial for the unique shape selectivity in catalysis; however, the sole presence of the microporous network also imposes significant diffusion limitation. The diffusion of the bulky molecules into and from the active sites confined in the zeolite crystals is impeded. Even when the size of micropores is larger than the molecules of the reactants and products, slow mass transport of these molecules through the pore system may be apparent. Diffusion limitation due to restricted access and low diffusion coefficients will lower the effectiveness of the zeolite and reduce the reaction rate. Furthermore, it may also cause pore blocking due to the large molecules or coke formation that contributes to deactivation of the catalysts.
Great efforts have been made to explore new materials with improved pore architecture to solve the diffusion limitation problem associated with conventional microporous zeolites. Ordered mesoporous aluminosilicates with pore size between 2 and 50 nm have gathered considerable research interest as solid acid catalysts and adsorbents, especially if bulky molecules are involved in the process.6–8 Unfortunately, their amorphous structure and correspondingly low hydrothermal stability and low acidity limit their practical application. Another strategy is to prepare novel zeolite structures with larger micropore size. A large number of new extra-large pore zeolites have been discovered by using complex organic compounds as structure directing agents and germanium as framework atoms.9,10 However, such extra-large pore zeolites are still limited in industrial application because of their low acidity, high production cost, and inferior thermal and hydrothermal stability.
Alternatively, zeolites featuring hierarchical porosity with at least two levels of pore size, i.e. inherent zeolite microporosity and additional mesoporosity (or macroporosity), have been developed. This can be achieved either by generating intracrystalline mesopores in the microporous zeolite crystals or by inducing intercrystalline mesopores in between the intergrown nano-sized zeolite crystals. Hierarchical zeolites, also referred to as mesoporous zeolites, integrate shape selectivity that is provided by the intracrystalline micropores and efficient mass transfer that is facilitated by the mesopore structure due to the increased diffusivity and reduced diffusion path length. In recent years, there has been a rapid development of new synthesis strategies for the tailoring of hierarchical zeolite pore architecture in order to maximize the zeolite functionality. A number of excellent reviews highlighting various aspects of the recent developments in this field have been published.11–21 In the second section of this review, we will give a summary on the progress of the synthesis strategies with emphasis on the pioneering examples and the most recent developments. It is to be noted that packed nanozeolites with transient mesoporosity22–24 and supported zeolite composites with mesoporosity derived from the presence of the non-zeolitic materials11,25,26 will not be covered in this review.
Hierarchical pore architecture with different levels of organization and interconnectivity of pores in three dimensions is highly relevant to the diffusion and adsorption of molecules and thus the performance of the materials in practical applications. These characteristics can be assessed according to several pore morphology properties, such as size, shape, connectivity, accessibility and tortuosity. A wide range of techniques have been used to unravel hierarchical zeolite structures, but perhaps the most intuitive of all are the microscopy techniques, providing visualization in 2D and 3D and at different length scales, from macro to nanometer, depending on the probes used (e.g., optical photons, X-rays or electrons). In the recent years, with the improvement of these techniques and development of image processing, unprecedented information about the hierarchical structure at both qualitative and quantitative levels has been obtained. In the third section, we will focus on these different techniques that have been used for visualizing the pore architecture of hierarchical zeolites.
2. Tailoring the pore architecture of hierarchical zeolites
Various synthesis strategies have been developed for tailoring the pore architecture of hierarchical zeolites, which can be classified into assembly, demetallization and mixed methods. The assembly methods, also referred to as ‘bottom-up’ methods, create the mesopore structure by the assembly of zeolite precursor units or nanocrystals. They can be categorized into hard templating, soft templating and indirect templating routes. The former two are defined according to the nature of the mesopore templates employed during the synthesis, while the latter one represents the synthesis method without using a mesopore template. The demetallization methods, also referred to as ‘top-down’ methods, mainly cover dealumination and desilication routes, in which the mesopore structure is introduced through selective removal of framework aluminium or silicon atoms from the pre-synthesized zeolite crystals. The mixed method denotes a combination of assembly and demetallization methods, i.e. zeolite recrystallization route, in which mesoporosity forms via dissolution and recrystallization of the preformed zeolite most often with the aid of surfactants.2.1 Assembly methods
Several synthesis approaches representing the assembly method have been developed. A large proportion of these synthesis approaches involve the use of mesopore templates for the generation of mesopore structure, in addition to the traditional micropore templates or structure-directing agents (SDA) employed in the zeolite synthesis. Depending on the flexibility of mesopore templates, these synthesis strategies can be classified as hard and soft templating. The hard and soft mesopore templates are usually encapsulated within the zeolite during the synthesis and removed afterwards by calcination to give rise to mesoporosity. In addition to the hard and soft templating, a range of indirect templating synthesis strategies introducing mesoporosity without the employment of mesopore templates have also been explored. In this case, the mesoporous structures are formed by the intergrowth of the zeolite nanocrystal without the encapsulation of mesopore templates.Carbon nanoparticles were first applied as a matrix for the confined space synthesis of nanozeolites, in which the amount of zeolite synthesis gel was required to be equal to or lower than the pore volume of the matrix and thus zeolites were confined to grow in the voids of the carbon matrix.27,28 Later on, Jacobsen et al. found that when an excess of the zeolite synthesis gel was used, carbon nanoparticles can be encapsulated in zeolite crystals during the growth, which gave rise to mesoporous zeolite single crystals with a broad mesopore size distribution in the range of 5–50 nm (Fig. 2a).29 The wide applicability of this approach was further demonstrated by the subsequent success in the synthesis of different structures and compositions of zeolites and zeotypes, such as MFI (TS-1 and Silicalite-1), MEL (ZSM-11, TS-2 and Silicalite-2), MTW (ZSM-12), BEA (Beta), AFI (AlPO-5) and CHA (AlPO-34).30–33 These mesoporous zeolites exhibited significantly improved diffusion properties and catalytic performance compared with the conventional microporous counterpart due to the formation of extra mesoporosity in the structure. However, it is also found that the size distribution of the resulting mesopores is generally broad and cavity-like mesopores always form which are accessible only via the micropores and do not contribute much to the improvement of mass transfer.
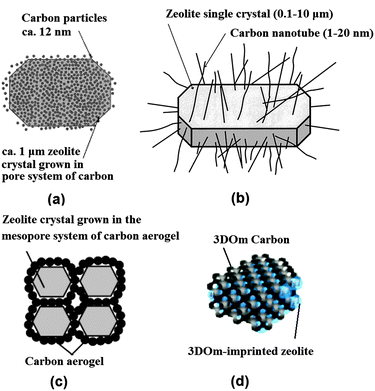 | ||
| Fig. 2 Schematic diagram showing mesoporous zeolite templated by different forms of carbon materials: (a) carbon nanoparticles, (b) carbon nanotubes, (c) carbon aerogel and (d) 3D ordered mesoporous (3DOm) carbon. (Adapted from ref. 29, 34, 38 and 53.) | ||
The use of carbon nanotubes and nanofibers instead offers an improved control over the size and shape of the resultant mesopores.34–37 Schmidt et al. first used commercial multiwall carbon nanotubes with 12 nm diameter and several micrometres length to prepare zeolite silicalite-1, leading to the formation of straight and uniformly sized mesoporous channels penetrating the zeolite single crystals (Fig. 2b).34 Carbon nanofibers as more cost-effective choices were also used by Janssen et al., which produced cylindrical mesopores with low tortuosity.36 Kaskel et al. found that a significant improvement in the kinetic uptake of n-butane and in the methanol conversion could be achieved with the mesoporous SAPO-34 templated by carbon nanotubes, as compared with carbon nanoparticle templated counterpart, due to the better accessibility of the hierarchical pore system.37
Alternatively, carbon aerogels were employed as hard templates to fabricate hierarchical zeolite monoliths with interconnected mesoporous channels. Tao et al. made use of the carbon aerogels, prepared by sequential CO2 supercritical drying and thermal pyrolysis of resorcinol–formaldehyde gels, to obtain mesoporous zeolite ZSM-5 (MFI structure), A (LTA structure) and Y (FAU structure) monoliths (Fig. 2c).38–40 The resultant mesoporous channels had a good interconnection and a narrow distribution of pore size corresponding well to the thickness of the pore wall of carbon aerogels. Li et al. modified this approach with two steps of impregnation to ensure a high loading of zeolite precursors, which resulted in a high mechanical stability of the Silicalite-1 monolith product.41 Similarly to carbon aerogels, mesoporous carbon materials derived from cheap precursor sugar, such as sucrose and glucose, were also tested in some studies.42–45 Kustova et al. developed in situ generation of carbon templates from sugar by decomposition directly onto the silica raw material for the hierarchical zeolite synthesis.42 This also leads to the formation of highly interconnected intracrystalline mesopores, but of a disordered nature. Additionally, the pore size of mesopores can be tuned by changing the molar carbon/silica ratio. Recently, a biomass-derived, N-doped carbon aerogel, prepared by the hydrothermal carbonization of glucose in the presence of ovalbumin (an N-rich glycoprotein), was also used to synthesize hierarchical ZSM-5 zeolite single crystals with intracrystalline mesopores of 12–16 nm diameter.45 The N-doped carbonaceous monoliths were hierarchically porous and their texture, dimensions, and chemistry could be directed via precursor ratio, solvent volume, and post-synthesis thermal annealing, potentially offering a cost-effective and highly flexible manner of synthesis.
When ordered mesoporous carbons, nanocast from ordered mesoporous silicates or imprinted from colloid silica, were used as hard templates, zeolites with ordered mesoporous channels were claimed to be prepared.46–53 It should be noted that there is some debate over whether they have been attained, or composites were formed instead. Yang and Liu et al. respectively developed the synthesis of mesoporous zeolites by using ordered mesoporous carbons, such as CMK-1 and CMK-3, replicated from ordered mesoporous silicates MCM-48 and SBA-15.46,47 However, the obtained products had disordered meso- or microporosity, which was ascribed to the difficulties of the small pore size of CMK carbon materials in accommodating stable zeolite nanocrystals. Hu et al. reported success in the preparation of an ordered mesoporous aluminosilicate with completely crystalline zeolite pore wall structure.48 Here the key to the success was that the replicated ordered mesopore carbon template CMK-5 was in situ used as a hard template for the recrystallization of SBA-15. However, it was also noted that slightly less ordered mesopores were found in the products. Ryoo et al. systematically studied the synthesis of an ordered mesoporous MFI zeolite using CMK-type mesoporous carbons as a template under dry-gel synthesis conditions.49 The results show that the success of the replica depends on the pore size, humidity, framework rigidity, etc. On the other hand, ordered mesoporous carbon imprinted from the colloidal mesoporous silica was also exploited as a template for the synthesis of nano- or mesoporous zeolites.50–53 Fan et al. first reported the synthesis of ordered cubic mesoporous (20–40 nm) zeolite silicalite-1, templated from an ordered cubic mesoporous (20–40 nm) carbon.52 They demonstrated that a wide range of crystal morphologies can be realized through such confined growth within three dimensional ordered mesoporous (3DOm) carbons which are synthesized by the replication of colloidal crystals composed of size-tunable (about 10–40 nm) silica nanoparticles. Confined crystal growth within these templates leads to size-tunable, uniformly shaped Silicalite-1 nanocrystals as well as 3DOm-imprinted single-crystal zeolite particles. In this approach, steam-assisted crystallization (SAC) was required because zeolite precursors tend to migrate from mesopores to external surfaces during the course of zeolite crystallization. Chen et al. developed a hydrothermal synthesis method for the 3DOm-imprint of a number of zeolites including BEA, FAU, LTA and LTL with highly ordered, tunable mesopores between 3 and 7 nm (Fig. 2d).53 Though the practical application of this strategy is limited due to the time-consuming and costly preparation process, it may be useful for the fundamental studies of the effect of hierarchical mesopore structures on the catalytic performance of zeolites.
Zeolites featuring hierarchical structures can also be synthesized using other hard templates, for example, polystyrene beads,54,55 resin beads,56,57 urea–formaldehyde resin,58,59 CaCO360 and even biological materials like bacteria,61 wood,62,63 sugarcane bagasse64 and leaves.65,66 In most of the cases, the zeolites are formed around the templates, and occur as nanosized polycrystalline ensembles.
Hierarchical zeolites can be prepared by the crystallization of silanized zeolitic seeds through a multi-step synthesis, which generally includes four steps: (i) synthesis of small zeolitic seeds by refluxing the zeolite gel at 90 °C, (ii) functionalization of zeolitic seeds through refluxing with organosilanes such as phenylaminopropyl-trimethoxysilane (PHAPTMS), (iii) crystallization of the functionalized zeolite gel under hydrothermal conditions, (iv) removal of the structure directing agent (SDA) and organosilane by calcination.77 The organosilanes added during the initial stages of zeolite crystallization can anchor on the external surface of the zeolitic seeds and thus prevent zeolite growth into large crystals (Fig. 3). Taking ZSM-5 as an example, the obtained mesoporous zeolite had particles of about 300–400 nm, formed by aggregation of ultrasmall crystallites below 10 nm with a significant degree of intergrowth. The N2 physisorption revealed that the mesopores in between the nanocrystals had a relatively uniform and small size around 4.5 nm. It was also found later that the size of the nanocrystals and the intercrystalline mesopores can be tuned to some extent by changing the synthesis parameters like pre-crystallization temperature and the concentration and organic moiety nature of the silanization agent.78,79 Moreover, combining silanization with alkoxylation by adding alcohols like 2-propanol or methanol was also reported to be capable of improving the zeolite textural properties, which was ascribed to the strong interaction between the silanization agent and the linear alcohols, increasing the hydrophobicity and stability of the protective layer.80
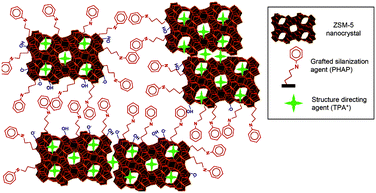 | ||
| Fig. 3 Schematic diagram showing the distributions of the TPA+ zeolite-structure-directing and PHAPTMS surface-silanization species with respect to the interior nanopores and exterior surfaces of ZSM-5 zeolite nanocrystals. (Reprinted from ref. 78 with permission, Copyright American Chemical Society.) | ||
In contrast to the seed-silanization route, Ryoo et al. reported a one-step synthesis using an amphiphilic organosilane as the mesopore template to prepare the hierarchical ZSM-5 zeolite.81 The amphiphilic organosilanes are positively charged and constructed from a long-chain hydrophobic group (tail) and a hydrolysable alkoxysilane (head), such as 3-(trimethoxysilyl) propyl hexadecyl dimethyl ammonium chloride (TPHAC). The presence of a positive charge and silanol group is favorable for a strong interaction with the growing crystal domain through the formation of covalent bonds with other SiO2 and Al2O3 sources, and the long-chain hydrophobic group is very helpful in forming mesoscale micelles. The obtained mesoporous ZSM-5 particles were globular with rugged surfaces, formed by aggregation of very small nanocrystals. The mesopore diameters are very uniform as that of MCM-41 and SBA-15, and can also be finely adjusted in the range of 2–8 nm by tuning the molecular structure of the mesopore-directing silanes and the hydrothermal synthesis temperature. This strategy was also applied to the synthesis of mesoporous LTA and SOD zeolite, aluminophosphate and silicoaluminophosphate zeolite analogues by using either amphiphilic organosilanes or alkylphosphonic acid as mesopore directors.82–85 All these mesoporous zeolites exhibited relatively compact morphology with extra-mesopores uniformly located inside the crystallites. In contrast to these examples, Schwieger et al. reported the synthesis of hierarchical Faujasite-type zeolite X by using the same organosilane surfactant TPHAC, which unprecedentedly led to the formation of house-of-cards-like nanosheet assemblies.86 The unique hierarchical pore system contained intracrystalline mesopores of about 7 nm within the nanosheets and intercrystalline macropores of about 200 nm in between the self-pillared nanosheets, the formation of which was related to the interplay between the surface activity of TPHA+ and charge-balancing effects of the inorganic cations in the synthesis gel. Additionally, Tsapatsis et al. recently found a small amount of EMT structure within these FAU-type nanosheets, which plays a crucial role in directing the atypical morphology of interpenetrating sheets with well-defined intersection angles of 70.5°.87
Silane-functionalized polyethyleneimine polymer formed from the reaction of (3-glycidoxypropyl)trimethoxysilane and polyethylenimine was also employed by Pinnavaia et al. as a mesoporogen to fabricate intracrystalline mesopores within the ZSM-5 zeolite.88 The presence of –SiO3 units on the polymer allows it to be grafted to the proto-zeolite surface through covalent Si–O–Si linkages during the nucleation stage. As the zeolite crystal grows, the incorporated polymer becomes phase-segregated from the zeolite matrix, forming a polymer network covalently linked to the zeolite framework inside the crystal (Fig. 4). The obtained intracrystalline mesopores had a pore size of 2.0–3.0 nm and narrow pore size distributions of ca. 1.0–1.5 nm width at half maximum. It was noted that the hydrodynamic radius of polyethylenimine (6.6 nm) didn't match the resultant mesoporous radius (1.5 nm), indicating that the zeolite matrix greatly altered the solvation and conformation of the polymer. This strategy was also applied for the synthesis of mesoporous FAU zeolite.
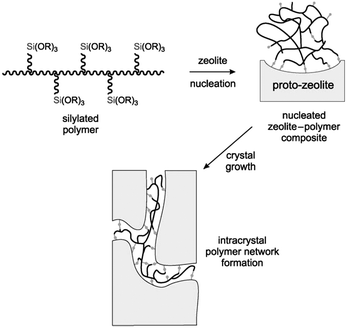 | ||
| Fig. 4 Conceptional approach to the synthesis of a zeolite with intracrystal mesopores using a silylated polymer as the mesoporogen. (Reprinted from ref. 88 with permission, Copyright John Wiley & Sons, Inc.) | ||
Cationic polymers were also verified as a suitable soft template for mesoporous zeolite synthesis due to their effective interaction with negatively charged inorganic silica species and high stabilities under alkaline conditions at temperatures up to 200 °C. Xiao and coworkers for the first time employed a mixture of small organic ammonium salts and cationic polymers as micropore and mesopore templates respectively to synthesize mesoporous zeolites.89 By using tetraethylammonium hydroxide and polydiallyldimethylammonium chloride (PDADMAC), they successfully prepared mesoporous Beta zeolite with a relatively wide mesopore size distribution of 5–40 nm. Compared with conventional microporous Beta zeolite, the obtained mesoporous Beta zeolite exhibited much higher catalytic activity in the alkylation reaction, which strongly indicated the improved mass transfer induced by the extra mesopore system. This method was also extended to the mesoporous ZSM-5 synthesis when a mixture of tetrapropylamine hydroxide and dimethyldiallyl ammonium chloride acrylamide copolymer was used. Amphiphilic copolymer polystyrene-co-4-polyvinylpyridine, when positively charged by treatment with methyl iodide, can also be used as a soft template, leading to ZSM-5 zeolite with b-axis-aligned mesopores of 10–50 nm.90 The specific orientation of the obtained mesopores was probably because the copolymer template was energetically favourable to occupy the (010) face in the self-assembly. In addition, cationic polymers (PDADMAC) can also act as flocculating agents to create mesopores in between the zeolite beta nanoparticles, which was highly aggregated and easily retrievable as compared to the colloidal nanosized beta obtained without the addition of PDADMAC.91 By changing the polymer concentration, the resultant intercrystalline meso-/macropores can be tuned between 40 and 400 nm.
Apart from the above mentioned cases, in which mesopores and micropores are directed by the soft templates and the conventional zeolite templates respectively, dual-function polyquaternary ammonium surfactants, which simultaneously generate micropores and mesopores, were also designed for the synthesis of mesoporous zeolites. Ultrathin MFI zeolite nanosheets were obtained when C22H45–N+(CH3)2–C6H12–N+(CH3)2–C6H13(Br−)2 (C22-6-6) was used for the first time by Choi et al.92 The hydrophilic part with two quaternary ammonium groups spaced by a C6 alkyl linkage directed the microporous MFI structure, while the hydrophobic long-chain C22 alkyl group induced the mesoscale micellar structure and restricted the excessive growth of zeolite (Fig. 5a). The products were obtained as either multilamellar or unilamellar nanosheets (Fig. 5b and c). The multilamellar nanosheets were 20–40 nm-thick, composed of alternating layers of 2.0 nm-thick MFI zeolite framework and 2.8 nm-thick surfactant micelles. After calcination, a high mesoporosity with a rather broad mesopore size distribution remained, probably owing to the pillar effect by the crystal intergrowths and the slight deviations of the crystal orientation preventing the complete condensation of MFI layers. The unilamellar nanosheets even exhibited a significantly increased surface area (720 m2 g−1), compared to their multilamellar counterpart (520 m2 g−1).92 A later study showed that the unilamellar structure can be transformed into the ordered multilamellar mesostructure through a dissolution–recrystallization process upon prolonged hydrothermal aging.93
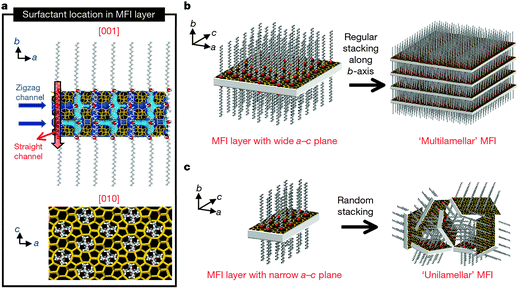 | ||
| Fig. 5 Crystallization of MFI nanosheets. Proposed structure model for a single MFI nanosheet. Surfactant molecules are aligned along the straight channel of the MFI framework. Two quaternary ammonium groups (indicated as a red sphere) are located at the channel intersections: one is inside the framework, and the other is at the pore mouth of the external surface (a). Many MFI nanosheets form either multilamellar stacking along the b-axis (b) or a random assembly of unilamellar structure (c). (Reprinted from ref. 92 with permission, Copyright Nature Publishing Group.) | ||
The dual-function surfactant can be tailored by changing the number of ammonium centers, the length and structure of the linkage and the hydrophobic tails, leading to different meso- and microporous structures. Significantly, by using C18H37–N+(CH3)2–C6H12–N+(CH3)2–C6H12–N+(CH3)2–C18H37(Br−)3 (C18–N3–C18) as a template, a zeolite with hexagonally ordered mesopores was synthesized by Ryoo and coworkers.94 The resultant zeolite consisted of uniform nano-crystals with a hexagonal array of mesopores of about 3.5 nm in size and a 1.7 nm-thick MFI-type microporous framework, exhibiting an extremely large specific surface area of 1190 m2 g−1. When C22–N4–C22 was used, the mesopore size and microporous framework thickness increased to 3.8 and 2.3 nm. Beta-like microporous frameworks, but with disordered mesopores, can also be obtained by increasing the number of quaternary ammonium groups and inducing phenyl groups in the linkage.94 Although the mesopore ordering decreased, the mesopore wall thickness and the mesopore size were uniform and tunable in terms of the overall length of the surfactant head groups and the addition of micelle swelling agents, such as 1,3,5-trimethylbenzene. A dual-function amphiphilic surfactant with aromatic groups in the hydrophobic segments was recently designed by Che and co-workers, showing strong ordered self-assembling ability through pi-stacking.95 When biphenyl and naphthyl were introduced into the alkyl tail of an amphiphilic template with a single quaternary ammonium head group, single-crystalline mesostructured MFI zeolite nanosheets with a lamellar structure were synthesized, however, showing a similar external surface area (395 m2 g−1) to the conventional MFI zeolite after calcination due to condensation. When bolaform amphiphilic templates with bi-quaternary ammonium head groups and biphenyl groups were used, mesostructured MFI nanosheets joined with a 90° rotational boundary were prepared. Remarkably, the bolaform templates with proper hydrophobic chain lengths can result in house-of-cards-like morphologies, leading to well-defined micro–meso–macroporous architecture after calcination with a high external surface area (658 m2 g−1) due to the mutual pillaring between ultrathin plates. Multiamines with amphiphilic structures have also been used as difunctional templates for the synthesis of hierarchical aluminophosphate materials and their analogues, such as silicoaluminophosphate, cobalt aluminophosphate, and gallium phosphate.96 Moreover, dual-function surfactant C22H45–N+(CH3)2–(CH2)4–N+(CH3)2–C4H9(Br−)2 (C22-4-4) was used together with a conventional micropore template (tetramethyl adamantanehydroxide, TMAdOH) in the synthesis of mesoporous SSZ-13 with CHA topology.97 The resultant mesopores had a broad size distribution; however the smaller amount of expensive dual-function templates used makes this approach more cost-effective.
In addition to the surfactant, polymers were also recently used as dual-function templates to synthesize mesoporous zeolites. Xiao et al. found that the cation polymer PDADMA can also be used as a dual-function template to synthesize mesoporous Beta single crystals.98 In this case, the quaternary ammonium groups on the polymer act as a micropore template for the zeolite, while PDADMA does not self-assemble to form mesoscale micelle structure as the dual-function surfactant, but acts as a “porogen” giving rise to disordered mesopores. The mesopore diameter can be tuned in the range of 4–10 nm by simply varying the molecular weight of PDADMA. Ryoo et al. used a linear polystyrene functionalized with a random distribution of multi-ammonium side groups to synthesize mesoporous zeolite and AlPO4 analogue nanosponge.99 The electrostatic force binds the multi-ammonium groups and the negatively charged inorganic source along the polymer chains, leading to the polymerization of the inorganic sources to form a mesostructured gel. Subsequently, multi-ammonium groups function as a micropore template directing the zeolite crystallization, while the polymer backbones become crowded around the surfaces of the zeolite crystal and limit crystal growth to a thickness of only a few nanometres (Fig. 6). The mesopore diameters can be tailored with the alteration of the functionalization degree.
 | ||
| Fig. 6 Description of random-graft polymer-directed mesoporous zeolite crystallization. (Reprinted from ref. 99 with permission, Copyright John Wiley & Sons, Inc.) | ||
Alternatively, Ryoo et al. synthesized nanocrystalline zeolites with intercrystalline mesopores by a novel route named pseudomorphic crystallization, which relies on the use of cyclic diquaternary ammoniums (CDA) acting as a structure directing agent and in the meanwhile suppressing the mobility of silicates during crystallization.100 When (3,10-diazoniabicyclo[10.2.2]hexadeca-12,14,15-triene-3,3,10,10-tetramethyl-dichloride) was used, nanocrystalline Beta zeolite aggregates of crystallites (about 20 nm) were prepared with a high mesopore volume (0.84 mL g−1), micropore volume (0.17 mL g−1) and BET surface area of 653 m2 g−1. The suppressing effect of CDA was further confirmed when using diatomaceous earth as the silica precursor. The original macro-structure was fully retained after complete crystallization of Beta zeolite, leading to three levels of porosity at macro-, meso- and microscales. This synthesis route is not limited to BEA structure, and in the following study MFI and MTW nanocrystallites with intercrystalline mesopores were also obtained by changing the structure of CDA.101
Other templates, for example, starch102–105 and sugar,106–108 were also used as cheap alternatives in the preparation of mesoporous zeolites. However, the mesopores in these samples were always located inside the zeolite bodies with low connectivity and played a limited role in the diffusion of gas molecules. The benefit of creating mesopores by soft templating methods is that the size can easily be controlled by changing the length of the surfactant that is used. However, the surfactant is burned away to create the pores and can't be reused. This makes this method relatively expensive and less attractive for large scale use.
By using steam-assisted crystallization (SAC), hierarchical zeolites can be prepared without the use of mesopore templates.109–111 For instance, Bein et al. prepared hierarchical zeolite beta in the presence of only common zeolite SDA tetraethylammonium hydroxide (TEAOH) by using the SAC method.109 The obtained self-sustaining zeolite beta aggregates were assembled from 20 nm crystalline domains, which resulted in a mesoporous structure with pore diameters of about 13 nm, featuring large surface areas between 630 and 750 m2 g−1 and total pore volumes up to 0.9 mL g−1. It was suggested that the uniformly nanosized crystallites were achieved by the dense-gel synthesis under SAC treatment to induce a burst of nucleation (Fig. 7). In the synthesis, the amount of water was critical for the growth kinetics and needed to be adjusted for a specific temperature, reactor volume and sample loading.
 | ||
| Fig. 7 Schematic representation of the formation of hierarchical zeolite Beta from a dense precursor gel. (a) Dense precursor gel with concentration fluctuations leading to nucleation; (b) contraction (densification) and partial conversion of the gel into nanozeolites after short steam-assisted crystallization (SAC) treatment; at this stage, filtration yields a colloidal solution of zeolite Beta; and (c) continued SAC reaction converts residual gel completely into small aggregated crystallites; the low mobility in the nearly dry environment arrests nanocrystals into a hierarchical zeolite network. (Reprinted from ref. 109 with permission, Copyright American Chemical Society.) | ||
Similar to the SAC method, a quasi-solid-state method by the crystallization of the zeolite synthesis gel in glycerol medium was carried out by Su et al. for the preparation of micro–meso–macroporous zeolitic TS-1.112 The gel was made from the amorphous meso-macroporous titanosilicate SDA impregnated with tetrapropylammonium ions (TPA+) and an additional silica source tetraethyl orthosilicate (TEOS). The preformed macroporous structure was well preserved during the crystallization, while the amorphous wall was transformed into the aggregated zeolite TS-1 nanocrystal with evenly sized particles of about 200 nm and relatively uniform interparticle mesopores of about 4.8 nm. The relatively mild glycerol system employed was considered as a potential reason for the formation of uniform particles due to the possibility of slowing down the growth rate under these conditions.
Compared with SAC and quasi-solid-state methods, a more simple and efficient strategy named “nanofusion” was reported by Möller et al., in which 20–40 nm nanozeolite Beta particles were hydrothermally converted from a concentrated precursor gel containing SDA TEAOH and instantly fused into stable hierarchical zeolite aggregates by drying and calcination.113 It was proposed that the fusion of the nanozeolites was enabled by the dissolved aluminosilicate species present in the gel. The fused zeolite Beta sample shows a high surface area, micropore volume, and mesopore volume. The interstitial mesopore size can be tuned from 15 to 35 nm when the reaction time was extended from 6 to 72 hours as a result of the growth of the crystal domain.
Another different example reported by Zhang et al. involves repetitive branching by 90° rotation intergrowth during one-step hydrothermal synthesis. Orthogonal twinning MFI-type nanosheets with “house-of-cards” arrangement were prepared by using only simple zeolite SDA tetrabutylphosphonium (TBP).114 The nanosheets were 2 nanometers thick and self-pillared with a permanent network of 2- to 7-nanometer mesopores, resulting in a high external surface area. It was inferred that the MFI twins were connected by a higher-symmetry-related MEL zeolite running through the entire interface. Okubo et al. also obtained plate-like hierarchical MFI zeolites with enhanced 90° rotational intergrowths by using a modified zeolite SDA (C3H7)3N+–(CH2)5N+(C3H7)3. This SDA can be situated in the framework with the N–N chains fitted along the straight channels, which results in framework distortion and limits crystal growth along the b axis with a plate-like morphology and a few intergrowths.115
There are also some other examples that can be classified as indirect templating methods. For instance, Wei et al. synthesized hierarchical SAPO-34 zeolite with intergrown nanosheet structure by using the natural layered material kaolin as the raw material, which appeared to influence zeolite growth with nanoscale confinement effects.116 Inayat et al. reported that some simple inorganic salts, such as zinc nitrate and lithium carbonate, can be used to direct the growth of FAU-type zeolites into nanosheet morphologies, giving rise to the formation of mesoporosity in the interlayer.117
Compared with hard and soft templating, indirect templating is still a less general method to extend to different zeolite topology synthesis and a successful synthesis always depends on the rigorous conditions. Furthermore, it has a relatively low control on the mesopore size. For some cases, the mechanism of the formation of mesopores is still not clear.
2.2 Demetallization methods
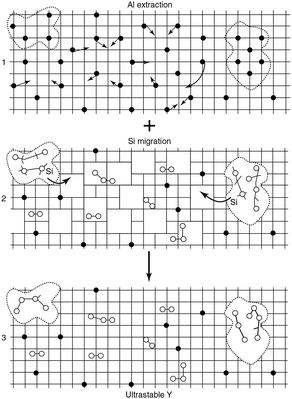 | ||
| Fig. 8 Schematic picture of the formation of mesopores. The grid denotes the zeolite framework, the black dots are framework aluminium atoms, the open circles are aluminium atoms extracted from the framework, and the dotted lines indicate the mesopores. (Adapted from ref. 120.) | ||
Aluminium can also be expelled from the framework by only acid leaching with concentrated acid solutions.122,123 The mechanism of mesopore formation is the same as steaming. Tromp et al. compared the activity of an acid-leached Pt/mordenite catalyst with that of a non-treated Pt/mordenite catalyst based on their performance in the hydroisomerisation of n-hexane.124 They found an increased activity in the hydroisomerisation of n-hexane catalysed by the acid leached zeolite. They attributed this increase to a better access to the active acid sites and accelerated desorption by the decrease of the diffusion path length.
Apart from the aforementioned methods, calcination and chemical treatment with ammonium hexafluorosilicate, silicon tetrachloride or ethylenediaminetetraacetic acid have also been reported as dealumination methods in the preparation of mesoporous zeolites. For details on these routes, we refer to a recent review by van Donk et al. and the references therein.14 During the dealumination process, the number of acid sites decreases in the zeolite because aluminium atoms are extracted from the framework. Moreover, the hierarchical zeolites prepared by dealumination were found to contain many isolated cavities rather than interconnected mesopores, which could not solve the diffusion limitation problem of microporous zeolites.
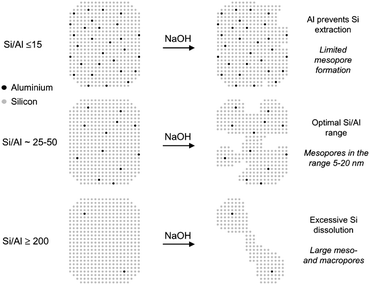 | ||
| Fig. 9 Schematic representation of the influence of the Al content on the desilication treatment of MFI zeolites in NaOH solution and the associated mechanism of pore formation. (Reprinted with permission from ref. 129, Copyright 2004 American Chemical Society.) | ||
A recent development on desilication is the introduction of inorganic additives (such as Al(OH)4− and Ga(OH)4−) or organic additives (such as tetrapropyl ammonium and tetrabutyl ammonium) acting as external PDA to regulate the intra-crystalline mesoporosity during the base leaching process. Pérez-Ramírez et al. showed that the specific interaction of these additives with the zeolite surface under alkaline conditions can provide a tunable protection against zeolite dissolution.133–135 This protection enabled the fabrication of zeolites with similar mesopore surface areas, smaller mesopore size (5 nm instead of 10 nm) and better preserved micropore volumes compared to that prepared by standard alkaline treatment. The affinity of the PDA to the zeolite surface was considered to play a crucial role in the pore formation process. Molecular criteria for the selection of organic PDAs in NaOH leaching were investigated on USY and Beta zeolites of distinct aluminium contents (Si/Al = 15–385).136 The results showed that the efficient PDAs are positively charged and have organic moieties in the range of ca. 10–20 carbon atoms. A very appealing advantage of the use of external PDA is that it extends the suitability of desilication for controlled mesopore formation to all-silica zeolites. Moreover, the inclusion of organic external PDAs prevents realumination during desilication, yielding solids with Si/Al ratios similar to that of the starting zeolite.
The accessible Si/Al range for base leaching could further extend to Al-rich zeolites. In this case, a dealumination step needs to be executed to increase the Si/Al ratio within the optimal range, facilitating the introduction of mesoporosity upon successive base leaching. Li et al. and Van Laak et al. used sequential acid and base leaching to synthesize mesoporous mordenite.137,138 They started from a parent with Si/Al ∼ 13, and increased it to Si/Al ∼ 28, after which a subsequent base leaching led to the introduction of mesoporosity, as well as the typical reduction in the Si/Al ratio. Verboekend et al. prepared hierarchical Clinoptilolite and L zeolites using optimized tandem acid–base treatments.139 For natural Clinoptilolite, acid treatments using aqueous HCl solutions were applied, while for L a controlled dealumination using ammonium hexafluorosilicate was required. Subsequent desilication by NaOH treatment yields mesopore surface areas of up to 4-fold (Clinoptilolite, 64 m2 g−1; L, 135 m2 g−1) relative to the parent zeolite. De Jong et al. subjected a commercially available steamed and acid leached zeolite Y with a bulk Si/Al ratio of 28 to a base leaching treatment.140 N2 physisorption results showed that the steamed, acid and base leached zeolite Y had a unique trimodal porosity with micropores (∼1 nm), small mesopores (∼3 nm) and larger mesopores (∼30 nm).
Base leaching on template-containing zeolites was also reported. Pérez-Ramírez et al. found that the mesoporosity of hierarchical zeolites can be tailored by partial detemplation of zeolites followed by desilication in alkaline medium.141 Van Laak et al. reported that base leaching of the organic template-containing zeolite led to the formation of intercrystalline mesoporosity without loss of micropore volume.142
Similar to dealumination, desilication inevitably modulates the framework Si/Al ratios; however, in this case it resulted in decreased Si/Al ratios. Moreover, some extra-framework aluminium species are often observed after the base treatment due to the realumination. Therefore, an additional acid treatment or ion-exchange step is needed to remove these species for opening the micropores and mesopores.143
In addition to the above demetallization methods, an irradiation route was developed by Valtchev et al. to prepare hierarchical ZSM-5 zeolite with uniform parallel macropores that extended through the entire crystal.144 A high energy 238U ion beam was first employed to form latent tracks in zeolite crystals, which were further etched with diluted HF solution. The selective extraction of material from latent tracks was achieved due to the higher etching velocity of highly agitated zones created by heavy ion bombardment. Compared with other synthesis strategies, the irradiation method offers a remarkable advantage in creating uniformly and parallelly distributed macropores. However, the difficulty in the handling of uranium would limit its commercial application on a large scale.
2.3 Mixed methods
The mixed synthesis strategy involves methods to create mesoporosity through the combination of the assembly and demetallization routes. The representative example is the zeolite recrystallization route, in which base leaching over zeolites is most often carried out in the presence of surfactants.Ordered mesopores within the zeolite crystals can be created by zeolite recrystallization through local rearrangement of the zeolite framework. However, zeolite–mesoporous oxide composites are always prepared, if the conditions of the treatment are not adequately selected.145–149 Ivanova et al. observed that, during the treatment of Mordenite with a solution containing cetyltrimethylammonium bromide and NaOH, with increasing base concentrations, the micropore volume decreased up to almost complete disappearance for a NaOH concentration of 1.6 M, while the mesopore volume was enhanced up to 0.92 cm3 g−1.145 Therefore, the zeolite was completely removed and replaced by an ordered mesoporous MCM-41 type material due to the harsh conditions employed in the treatment. However, it was noted that under intermediate conditions, using lower NaOH concentrations, the recrystallized mordenites exhibited both micropores and mesopores suggesting that they might be truly hierarchical zeolites. A further study revealed that two types of mesopores formed, in which small mesopores of 3–4 nm were attributed to surfactant-induced micelle formation involving dissolved species and larger mesopores of 3–20 nm resulted from desilication processes occurring under the alkaline reaction conditions.150 The dual mesopore structure was also found by Tsapatsis et al. when they prepared mesoporous ZSM-5 zeolites through desilication and re-assembly processes.151
Remarkably, Garcia-Martinez et al. synthesized mesoporous zeolite Y with uniformly distributed intracrystalline mesopores of approximately 4 nm by hydrothermal treatment with a mixture of zeolite Y, diluted NH4OH and the surfactant CTAB at 150 °C for 10–20 h.152 The mesopores can be tuned between 2.5 and 4.5 nm by changing the chain length of surfactants. The well-controlled mesoporosity was presumably induced into zeolite crystals by a crystal-rearrangement mechanism. This structural reorganization took place due to the base-induced breaking of Si–O–Si bonds in the presence of a cationic surfactant (Fig. 10). This process allows the prevention of the dissolution of the crystals and almost complete recovery of the zeolite material. The performance of this USY FCC catalyst was compared with the performance of the mesoporous zeolite Y made by soft templating. The catalysts made from mesostructured USY zeolites produced significantly more gasoline and light cycle oil (LCO), and less bottoms and coke. The much improved product selectivity could be attributed to the mesostructure introduced into the zeolites that eased the diffusion limitation in the conventional zeolites. The mixed method does not suffer from the typical drawbacks of the desilication approach, i.e. significant loss of silica or damage of the zeolite crystals.
 | ||
| Fig. 10 Scheme of the proposed zeolite mesopore formation process: (a) original zeolite Y, (b) Si–O–Si bond opening/reconstruction in basic media, (c) crystal rearrangement to accommodate the surfactant micelles, and (d) removal of the template to expose the mesoporosity introduced. (Reproduced from ref. 152.) | ||
In this section, we review the general synthesis methods hitherto developed for tailoring the pore architecture of hierarchical zeolites. For comparison, these synthesis strategies together with the structure information of the corresponding hierarchical zeolites are listed in Table 1.
| Synthesis strategy | Mesopore templates | Framework | Crystal size | Type of mesoporosity | Ref. |
|---|---|---|---|---|---|
| Assembly | |||||
| Hard templating | Carbon nanoparticle: BP2000 | MFI | 0.3–1.2 μm | Intracrystalline, 5–50 nm | 29 |
| Multi-wall carbon nanotube | MFI | 0.25–1.0 μm | Intracrystalline, 6–15 nm | 35 | |
| Resorcinol–formaldehyde carbon aerogel | MFI | 10 nm | Intercrystalline, 11 ± 2 nm | 38 | |
| 3DOm carbon | MFI | 0.2–0.3 μm | Intracrystalline, 4.5 ± 2 nm | 53 | |
| Soft templating | Silylated seed: PHAPTMS | MFI | <10 nm | Intercrystalline, 2–8 nm | 77 |
| Silylated surfactant: TPHAC | MFI | <10 nm | Intercrystalline, 3.1 ± 1 nm | 81 | |
| Silylated polymer: PEI | MFI | 0.2 μm | Intracrystalline, 2–4 nm | 88 | |
| Cationic amphiphilic copolymer: C-PSt-co-P4VP | MFI | 1–2 μm | Intracrystalline, 10–50 nm | 90 | |
| Polyquaternary ammonium surfactants: C22-6-6 | MFI | 2 nm, thickness | Intercrystalline, 5–20 nm | 92 | |
| Polyquaternary ammonium surfactants: 18–N3–18 | MFI | 1.7 nm, thickness | Intracrystalline, 3.5 nm | 94 | |
| Random-graft polymer: linear polystyrene-N3-SDA | MFI | 4.5 nm | Intercrystalline, 2–10 nm | 99 | |
| Indirect templating | Steaming-assisted crystallization: none | BEA | 20 nm | Intercrystalline, 5–20 nm | 109 |
| Nanofusion: none | BEA | 20–40 nm | Intercrystalline, 15–35 nm | 113 | |
| Repetitive branching: none | MFI/MEL | 2 nm, thickness | Intercrystalline, 2–7 nm | 114 | |
| Demetallization | |||||
| Dealumination | Steaming: none | FAU | 0.2–0.3 μm | Intracrystalline, 15–20 nm | 119 |
| Desilication | Base leaching: none | MFI | 0.5 μm | Intracrystalline, 2–40 nm | 130 |
| Steaming and acid–base leaching: none | FAU | 0.4 μm | Intracrystalline, 2–5 and 15–40 nm | 140 | |
| Mixed | |||||
| Recrystallization | Base leaching: CTAB | FAU | 0.4 μm | Intracrystalline, 4 nm | 152 |
3. Visualizing the pore architecture of hierarchical zeolites
Mesopores are introduced in zeolites to overcome the diffusion limitations and improve the accessibility to active acid sites located in zeolite micropores. The size, shape and connectivity of the mesopores should be studied if one wants to relate the change in textural properties to the catalytic performance of the catalyst. The most common technique to investigate textural properties of materials is gas physisorption.153,154 Other techniques include mercury porosimetry,155,156 thermoporometry,157,158 nuclear magnetic resonance,159,160etc. However, these techniques provide bulk information since the textural properties are averaged over a relatively large amount of material. For example, the amount of sample used for N2 physisorption is ∼0.05 g. Furthermore, these techniques provide only limited information about size, shape and accessibility of pores. The performance of the catalysts is dependent among others on the accessibility of the active sites and diffusion of reactants and products towards and from the active site, that is, on the interconnectivity between micro-, meso- and macropores. Visualizing such complex porous network provides unique opportunity to study in greater detail porous structures. In recent years, the microscopy and image analysis techniques have significantly advanced and have been more frequently used for elucidating the pore architecture of porous materials, such as hierarchical zeolites.Depending on the probe used in microscopy, such as optical light, X-rays or electrons, one can visualize the zeolites and the porosity at different length scales, ranging from macroscopic to microscopic. Various microscopy techniques have been utilized to obtain a great deal of information about the presence and, to some extent, the shape and size of mesopores in the sample. The problem of conventional microscopy techniques is that they can't accurately describe the connectivity and provide the exact shape and size of the mesopores since spatial information is limited when the structural features of 3D porous particles are overlaid in a 2D image. A method that overcomes this limitation is tomography, i.e. 3D microscopy, which has been developed more recently. The term “tomography” is derived from the old Greek words “tomos” and “graphein”, which mean “slice” and “to record”. By using tomography techniques, the object can be reconstructed in three dimensions based on the information from a series of 2D images. With the development of these more advanced visualization techniques and image analysis operations, great improvements have been made in evaluating the pore architecture of hierarchical zeolites, both qualitatively and quantitatively. In this section, we will provide a review of this rapidly developed field.
3.1 Confocal fluorescence microscopy
Fluorescence microscopy is a type of optical microscopy, which images the fluorescence that is emitted from the fluorescent molecules (dyes) in the sample. Generally, dyes are hit by light of a specific wavelength, for which lasers are often used, and subsequently the fluorescent dyes in the sample will emit a lower energy of light with a longer wavelength. Making use of a dichromatic mirror, only the light emitted from the sample is detected by the detector, giving rise to a high-contrast of the images. Confocal fluorescence microscopy (CFM) uses pinholes to collect the light that is emitted from a certain area, while all the other light is rejected. This technique greatly enhances the optical resolution. Moreover, by changing the point of focus, images from various depths of the sample can be collected, enabling thus information in 3D.161Fluorescence microscopy, next to the application in cellular biology, has proved as a very useful technique in the study of heterogeneous catalysts.162–164 Recently, it has also been used for the visualization of the pore architecture of hierarchical zeolites.165,166 Aramburo et al. studied the effect of steaming on pore accessibility of large ZSM-5 zeolite crystals (100 × 20 × 20 μm3) using CFM with bulky dyes, which enabled the 3D visualization of cracks and mesopores connected to the outer zeolite surface.166 The parent ZSM-5 catalyst (ZSM-5-P) after staining with proflavine (Fig. 11b) showed only little visible fluorescence (Fig. 11d) in both the top and middle plane of the crystal (Fig. 11a), which indicated the absence of mesopores because proflavine cannot enter the micropore system of the catalysts (Fig. 11f). ZSM-5 catalyst after mild steam treatment (ZSM-5-MT) exhibited strong fluorescence especially in the lateral sub-units as compared to its pyramidal counterparts (Fig. 11d). The heterogeneous distribution of the fluorescence indicates the different susceptibility of the distinct crystal regions to steaming. After a severe steam treatment, the catalyst (ZSM-5-ST) showed strong and even more broadly distributed fluorescence (Fig. 11d), which reveals the increased pore accessibility in the lateral crystal sub-units as well as a partial opening of the crystal sub-unit boundaries. Furthermore, the in situ generation of fluorescein from phthalic acid anhydride and resorcinol (Fig. 11c) was performed for the detection of mesoporous cavities within the steamed ZSM-5 zeolite crystals. Because the reactants are non-fluorescent and able to diffuse throughout the crystal, the fluorescein thus can be generated in the cavities, which are connected with the outer crystal surface only via the micropore system and cannot be accessed by proflavine. The ZSM-5-P crystal showed a lack of fluorescence as compared to the steamed samples, since only micropores are present in the parent crystal (Fig. 11e). Compared with proflavine stained experiments, more homogeneous distribution of the fluorescence signal was observed in the steamed samples, which indicates that a large number of cavities are generated. Moreover, the intense fluorescence signal originating from the pyramidal crystal sub-units of ZSM-5-ST suggests that a significant amount of cavities are formed in this region after a severe hydrothermal treatment (Fig. 11f). These results demonstrated that ZSM-5 catalyst consists of different crystal subunits with diffusion barriers in between them. The different regions have a different susceptibility towards steaming, so mesopore generation will be different in each region.
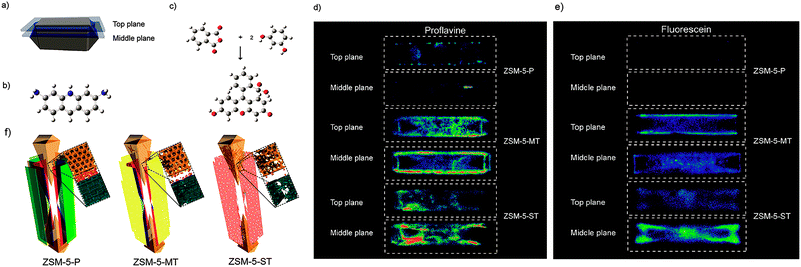 | ||
| Fig. 11 (a) Schematic illustration of the crystal regions where the confocal fluorescence microscopy images were recorded. (b) Bulky dye molecule proflavine used to investigate the changes taking place in the pore accessibility upon steaming. (c) Staining reaction based on the in situ synthesis of fluorescein used to visualize mesoporous structural defects. (d) Confocal fluorescence microscopy images obtained from the top and middle plane of ZSM-5-P, ZSM-5-MT and ZSM-5-ST after staining with proflavine. (e) Confocal fluorescence microscopy images obtained from the top and middle plane of ZSM-5-P, ZSM-5-MT and ZSM-5-ST during the in situ synthesis of fluorescein at 200 °C. λex = 488 nm, detection 510–550 nm. Images are presented as thermal maps; the warmer the colour, the higher the intensity of the fluorescence signal. All the intensities have been boosted with the same factor. (f) Schematic illustration summarizing the main observations described in this study for ZSM-5-P, ZSM-5-MT and ZSM-5-ST zeolite crystals. The molecular diffusion barriers, depicted in green, red and blue in ZSM-5-P, are substantially modified with increasing steaming temperature. Additionally, steaming induces different modifications in the physicochemical properties of the distinct crystal sub-units. The lateral sub-units undergo significant structural modifications due to the mild and more severe hydrothermal treatment, whereas the pyramidal sub-units mainly alter their properties as a result of a severe hydrothermal treatment. (Adapted from ref. 166.) | ||
CFM allows one to study the location and accessibility of the mesopores within tens of micrometres large zeolite crystals. However, it cannot image pores directly, but fluorescence of molecules within them. Furthermore, no information about size and shape of the mesopores can be obtained because the resolution is limited. In this context, X-ray and electron-based microscopy techniques are more advantageous. Besides imaging porosity, the recently developed optical method based on microimaging by interference and infrared microscopy was successfully used to monitor diffusion of non-fluorescent guest molecules, such as methanol and ethanol, through nanoporous zeolites.167
3.2 X-ray tomographic microscopy
X-ray microscopy uses X-rays as a probe to image a sample. The short wavelength of X-rays ranging from 0.01 to 10 nanometres renders a higher resolution of X-ray microscopy as compared to optical microscopy. In addition, X-rays have a stronger ability to penetrate matter than optical light, which allows X-ray microscopy to monitor the inside of the specimen without physically cutting it. X-ray microscopy has proved to be an important tool for nanoscale structural and chemical imaging.168,169 Many types of X-ray microscopy have been developed, among which X-ray tomography allows non-destructive 3D analysis of both morphology and chemical composition. It uses X-rays to record 2D images of an object that are later used to reconstruct a virtual 3D model without destroying the original object. In absorption-based studies, the image contrast corresponds to X-ray attenuation, which is strongly dependent on the atomic number and density of the material. For a laboratory X-ray source, it can provide three-dimensional structural information down to the micrometre level.170 With the application of high-flux synchrotron radiation in the hard X-ray range, the spatial resolution down to the sub-micrometre, and even sub-100 nm, level can also be achieved.171–173Recently, Mitchell et al. used synchrotron radiation X-ray tomography microscopy (SRXTM) to visualize the internal pore architecture of an industrial granule consisting of hierarchical alkaline-treated ZSM-5 zeolite and the binder attapulgite.174 A whole granule was first analysed by standard SRXTM. The computed two-dimensional virtual slices reflected its long-range structural order, as the pores (black regions) uniformly dispersed throughout the entire granule. High-resolution SRXTM was further performed to study the details of the internal structure. For this analysis, columns of ∼40 μm in size were cut from the sample for the measurement. The round-like intraparticle macropores with diameters of 3–5 μm can be distinguished in the 2D virtual slice (Fig. 12a) of the three-dimensional reconstructions (Fig. 12b), which seem to be isolated from the surrounding interparticle network of macropores with varying size and orientation extending throughout the granule interior.
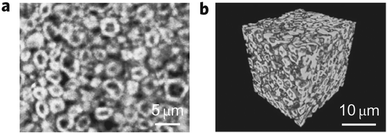 | ||
| Fig. 12 Internal structure of a hierarchical zeolite body by high-resolution SRXTM. (a) Two-dimensional virtual slices obtained from three-dimensional SRXTM (b) can be used for quantitative study of the macropore structure within a defined volume. (Reprinted from ref. 174 with permission, Copyright Nature Publishing Group.) | ||
Using X-ray tomography, the pore architecture can be directly visualized without the introduction of additional molecules as in the fluorescence microscopy. Furthermore, it can be used to visualize the sample of hundreds of micrometres thickness without the need of cutting and induces very weak radiation damage, whereas optical microscopy requires more transparent samples. The current disadvantage is that synchrotron X-ray sources with very high intensity are necessary, which is inconvenient for routine studies. Recently, it was reported that large improvements in the resolution have been witnessed using X-ray ptychographic computed tomography.171,175 This, if successfully established with laboratory sources, could become a powerful method for filling the resolution gap between optical microscopy and electron microscopy, which will make routine imaging of mesopores feasible.
3.3 Electron microscopy
Electron-based microscopy techniques make use of electrons instead of previously discussed X-rays. The use of electrons is advantageous because of their very short wavelength, which depends on the accelerating voltage, e.g. at commonly used 100 keV and 200 keV, λ = ∼3.8 pm and ∼2.7 pm respectively. Such short wavelength enables visualization of even the atomic structure of materials. In fact, the wavelength of the electrons doesn't limit the resolution of the microscopes; it is rather spherical and chromatic aberrations arising from an imperfect lens system, as well as the presence of mechanical vibrations, that limit the resolution.176,177 The most commonly used electron microscopy techniques include scanning electron microscopy (SEM) and transmission electron microscopy (TEM), while focus ion beam scanning electron microscopy (FIB-SEM) and electron tomography (ET) are more specialized techniques. These techniques have been extensively used in the characterization of the pore architecture of hierarchical zeolites and each of them will be discussed below.SEM has been a commonly used technique in the study of the surface topology of solid materials. Especially, with the development of through-the-lens detection systems, which permit a reduced landing energy (the energy of the primary beam before impacting the sample) and the selection of high-resolution, topographically specific emitted electrons, the high resolution (HR) SEM technique has been developed as a powerful tool in the study of the fine structure of nanomaterials. For instance, Ryoo and Terasaki et al. demonstrated the merit of low electron landing energy on the beam damage of mesoporous LTA zeolite templated with an organosilane surfactant, which is highly sensitive to electron-beam irradiation. The results showed that the image obtained using a lower landing energy of 80 eV (Fig. 13a) exhibited very clear characteristics of the mesopores on the zeolite surface with a lesser edge effect because of small interaction volume, while landing energies of 1 keV and above produced distinct beam damage on the original pore morphology (Fig. 13b and c).178
 | ||
| Fig. 13 SEM images of mesoporous LTA acquired at low landing energy, thereby reducing the effect of beam damage. Conditions: specimen bias = −5 kV. Scale bar is 100 nm. (Reprinted from ref. 178 with permission, @ 2014 Elsevier.) | ||
SEM has been often employed for the characterization of hierarchical zeolites. It proved useful in determining the presence of meso- and macropores, topology of porous zeolites and, to a lesser extent, allowed estimating the pore size and shape. Matsukata et al. used SEM to study the effect of alkaline treatments on ZSM-5 catalyst.128 As shown in Fig. 14a, the parent ZSM-5 crystals before alkaline treatments have a uniform shape and particle size with a smooth surface. After base leaching (Fig. 14b), a dramatic morphology change was observed and grooves and voids appeared on the surface of the zeolite, indicating the etching of the materials by base solution. Christensen et al. studied mesoporous ZSM-5 crystals templated by carbon black with SEM.179Fig. 14c and d show the SEM images of the conventional zeolite synthesized without carbon and the carbon templated mesoporous zeolite crystals. Although the typical coffin shape of MFI crystals was observed for both, the surface morphologies were very different, with the mesoporous sample showing a much rougher surface. Ryoo et al. synthesized mesoporous ZSM-5 zeolite using an amphiphilic organosilane as the template.81 SEM images (Fig. 14e) showed that the resultant zeolite had regularly globular morphologies with homogeneously rugged surfaces, which indicated the presence of uniform mesoporosity and well crystallized zeolite frameworks in nature. In another study, they synthesized mesoporous ZSM-5 zeolite using dual-function diquaternary ammonium surfactants as templates.92 The SEM image (Fig. 14f) revealed that the ZSM-5 zeolite was composed of flake-like nanosheets of 2 nm in thickness. The nanosheets appeared to be pillared by the intergrowth, forming mesopores in between the crystals.
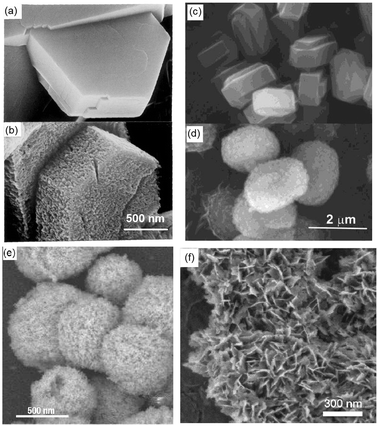 | ||
| Fig. 14 SEM images: comparison between (a) as-received and (b) alkaline-treated ZSM-5. Comparison between (c) conventional and (d) mesoporous zeolite ZSM-5 templated by carbon black. (e) Mesoporous ZSM-5 templated by an amphiphilic organosilane. (f) MFI nanosheets with a multi-lamellar structure templated by a dual-function diquaternary ammonium-type surfactant. (Adapted from ref. 128, 179, 81 and 92.) | ||
Compared to X-ray microscopy requiring synchrotron radiation, SEM can provide a much higher resolution and be performed routinely in the laboratory. In addition to imaging, SEM coupled with energy dispersive X-ray (EDX) detectors allows detection of the characteristic X-rays emitted from the sample upon incident beam bombardment. This provides elemental analysis of the surface of the sample. However, with SEM, it is not possible to visualize the internal structure of the zeolite particles. The pore morphology can only be, to certain extent, deduced from the surface topology of the sample observed in the SEM images.
FIB-SEM has been recently used for the visualization of the pore architecture of hierarchical zeolites prepared by soft templating and steaming strategies.165,180,181 Ryoo et al. reported the synthesis of mesoporous zeolites using organosilane surfactants (OSS) as templates.81 It was found that the size and concentration of OSS were important parameters influencing the mesopore properties. To unravel the exact mechanism for the generation of mesopores by OSS, Cho et al. studied mesoporous LTA zeolites synthesized with different concentrations of OSS using HRSEM combined with an argon ion beam.180 The HRSEM micrographs as shown in Fig. 15 revealed that the mesopores for both samples were located not only on the external surfaces but also inside the crystals with tunable size depending on the concentration of OSS. More specifically, NaA-2 prepared with a low concentration of OSS presented randomly branched and interconnected channels with quite a uniform width (6–9 nm) on the external surface, while radial mesopores of fairly uniform size were inside the zeolite crystal. In NaA-8, the crystal surfaces were very rough with wider and more random mesopores than that of NaA-2 and the direction of the internal channels was quite random, which indicated that the OSS micelles expanded with the excessive OSS molecules. Based on these observations, a mechanism for mesopore generation was proposed by the authors. At a low loading of OSS, the crystal growth seemed to affect or induce orientation of the OSS micelles along the 〈100〉 axis and single crystals formed with the incorporation of OSS inside, while at a high loading of OSS, the expansion and disorder of OSS micelles seem to dominantly affect the crystal growth process into polycrystalline particles.
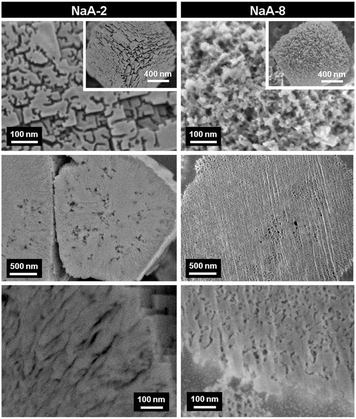 | ||
| Fig. 15 HRSEM micrographs of mesoporous LTA (NaA-n, n represents the moles of OSS with respect to 100 moles of Si in the synthesis gel) synthesized with different concentrations of an organosilane surfactant. The top images were taken from the external surfaces of calcined samples. The others were taken after cross-sectioning by an argon ion beam. The SEM images at the cross-sectioned planes show mesopores inside these zeolite particles. (Reprinted from ref. 180 with permission, @ 2011 Elsevier.) | ||
Karwacki et al. studied the effect of steaming on the mesopore distribution within zeolite crystals using FIB-SEM.165,181 Three distinct regions of the parent (ZSM-5-P) and steamed (ZSM-5-ST) ZSM-5 crystal were examined, corresponding to the parts of the crystal with straight and sinusoidal channels open to the surface, and the part where straight channels are covered by the 90° rotational barrier.182 The parent sample ZSM-5-P did not show the presence of mesopores, while severely treated ZSM-5-ST crystal showed vast areas of mesoporosity in all three regions. The quantitative analysis of the size and number of mesopores observed in the three studied regions showed that region A on the tip of the ZSM-5-ST crystal contained less mesopores (about 23% of the overall number) than regions B (40%, close to the tip of the crystal) and C (37%, in the middle of the crystal). This suggests that the straight zeolite channels are less susceptible towards dealumination. Moreover, the dominating mesopore size in region A was about 6.2 nm with a maximal mesopore diameter of 20 nm, whereas in regions B and C, the average diameter of all mesopores increased to 8.2 and 8 nm with maximal mesopore diameters of 50 and 35 nm, respectively. Strikingly, more than 84% of all recorded mesopores presented a diameter smaller than 10 nm. These qualitative and quantitative results obtained by FIB-SEM indicate a significant dependency between the crystal regions (i.e., internal architecture) and the amount, diameter and orientation of the generated mesopores, which is in line with the results obtained from the CFM characterization as shown in Section 3.1. Although with FIB-SEM only a small area of the zeolite can be analysed compared to CFM, it provides straightforward and more detailed information on the mesoporosity of different regions of the individual crystal.
FIB-SEM tomography, also called “slice and view”, is developed to acquire 3D information in contrast to only 2D information shown above. In this technique, the sample embedded in resin is repeatedly milled with a focused ion beam (FIB) and each newly produced block face is imaged with the SEM, and thus a 3D data set of the object under investigation is generated. FIB-SEM tomography is a suitable technique to characterize porous crystals without the introduction of artifacts as is in the case of ultramicrotomy.
To access the 3D information and study mesopore length, shape and orientation in steamed ZSM-5 crystals, Karwacki et al. also used FIB-SEM tomography.181 A stack of 150 consecutive FIB milled and SEM imaged cross-sections separated from each other by ∼10 nm and with a surface area of about 5 × 5 μm2 were first collected from an individual steamed ZSM-5 crystal of 100 × 20 × 20 μm3 size (Fig. 16a). 5 × 5 × 1.5 μm3 volume (Fig. 16b and c) was reconstructed, revealing the presence of approximately 750 mesopores with length exceeding 10 nm, in which approximately 630 of them (85%) were in the range of 10 to 100 nm and only 1% rise above 200 nm (Fig. 16d and e). 11 mesopores were manually traced, overlaid in the subsequent FIB-SEM images and digital meshing of the pore surface was applied (Fig. 16f and g). It was found that the long axis of the mesopores always aligned with the direction of the pores open to the crystal surface. This suggests that dealumination was likely to take place in pores with such specific orientation. These results show that FIB-SEM tomography can provide quantitative 3D information, such as length and orientation of the mesopores and thus impart unique insights into the dealumination process. However, it should be noted that the mesopores smaller than 10 nm were not taken into account because the resolution was limited to approximately 5.2 nm.
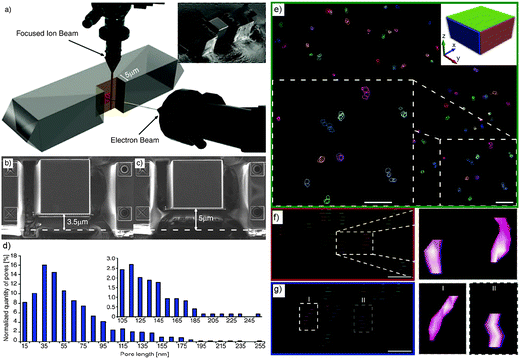 | ||
| Fig. 16 (a) Individual steamed ZSM-5 crystal during FIB-SEM tomography. Focused ion beam (top) subsequently removes (10 ± 2) nm thick cross-sections from the plane normal to the crystal's surface, while the electron-beam images of 5 × 5 μm are indicated with the red square. The inset shows a steamed crystal after FIB cross-section milling. (b, c) SEM images illustrating the beginning and the end of the volume studied by FIB-SEM tomography. The difference between the thickness of the material in images (b) and (c) is 1.5 μm. (d) Mesopore length distribution based on approximately 750 reconstructed mesopores from the volume of a steamed ZSM-5 crystal. Inset: zoom-in into the pores longer than 100 nm. The error range for each pore length data point equals ±5 nm (i.e. a slice thickness equal to 10 nm). (e) A reconstructed distribution of mesopores in the 750 × 750 × 200 nm3 sub-volume of a steamed ZSM-5 crystal. The xy plane is shown; the upper right corner inset indicates the orientation of the xy, xz, and yz planes as green, red, and blue rectangles, respectively. The ×2 zoomed-in area of the section of the xy plane shown in the right lower corner shows a group of 11 reconstructed mesopores. Scale bars = 60 nm. Surface of indicated (traced) mesopores is not rendered allowing visualization of their overlay. (f, g) Projection of the mesopores to the xz and yz planes, respectively. Each layer indicates the consecutive cross-section plane recorded by SEM tomography. Zoomed-in area focuses on two pores with rendered surface. Scale bars are 50 nm. (Adapted from ref. 181.) | ||
The advantage of FIB-SEM is that it can provide information about the mesoporous network from volumes as large as 5 μm3 without limitation on the total size of the zeolite crystal. However, it remains a less commonly used technique because more time, effort and specialized expertise for data acquisition are required. Moreover, during the measurement, the analysed volume of sample is destroyed by the ion beam.
TEM analysis represents one of the most prevailing techniques and provides a wealth of information on the structures of the mesopores in hierarchical zeolites prepared by different strategies. In the study of the desilication process of zeolites by Groen et al., the clear lighter-areas and lattice fringes in the high resolution TEM image (Fig. 17a) indicate the presence of intracrystalline mesoporosity and the high crystallinity of the alkaline-treated zeolite ZSM-5.183 The estimated mesopore size was about 10 nm, which was in excellent agreement with the pore size distribution derived from N2 adsorption. Jacobsen et al. synthesized mesoporous ZSM-5 zeolite single crystals using carbon black as the hard template.29 The TEM image (Fig. 17b) revealed that relatively large and well-shaped crystals were obtained with the existence of mesoporosity. Diffraction patterns with discrete diffraction spots can be well indexed according to the [100] direction of the MFI structure, which proved that the resultant zeolite was a single crystal rather than an agglomerate of smaller crystals. Ryoo et al. synthesized nanosheets of zeolite MFI using dual-function diquaternary ammonium-type surfactant C22–6–6 as a template.92 HRTEM images (Fig. 17c) revealed that the meso-structured stacking of the nanosheets was composed of alternating layers of 2.0 nm-thick MFI zeolite framework and 2.8 nm-thick surfactant micelles. When changing the template to 18–N3–18, hexagonal arrays of mesopores with a diameter of 4.51 nm can be clearly distinguished from the HRTEM image and the corresponding Fourier diffractogram (Fig. 17d).94
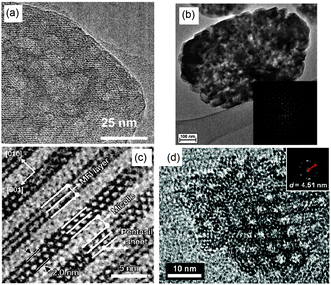 | ||
| Fig. 17 (HR)TEM of (a) alkaline-treated (0.2 M NaOH, 338 K, 30 min) ZSM-5 zeolite. (b) An isolated mesoporous ZSM-5 single crystal templated by carbon black and the inset with the diffraction pattern obtained from the same crystal. The size of the selected area aperture for electron diffraction was ∼1 μm and covered the entire crystal shown in the figure. (c) MFI nanosheets with a multi-lamellar structure templated by dual-function diquaternary ammonium-type surfactant C22–6–6. (d) Hexagonally ordered mesoporous MFI zeolite templated by dual-function diquaternary ammonium-type surfactant 18–N3–18 and the inset with Fourier diffractogram. (Adapted from ref. 183, 29, 92 and 94.) | ||
A variant of transmission electron microscopy is scanning transmission electron microscopy (STEM), which has also been exploited in the visualization of mesoporous structures. STEM uses a focused beam of electrons scanned over the sample surface in a raster fashion. Images can be recorded in bright field (BF) STEM mode, high angle annular dark field (HAADF) STEM mode and secondary electron (SE) mode (Fig. 18a). These signals can be obtained simultaneously with different detectors installed in a STEM, therefore allowing direct correlation of these images. Moreover, compared with BF-STEM mode, HAADF-STEM mode has a much reduced diffraction contrast along with the enhanced contrast related to the atomic number (Z-contrast), possibly providing higher resolution images for crystalline nanostructures. Recently, Milina et al. used an aberration-corrected STEM to study the mesoporous structures prepared by base leaching of parent ZSM-5 (Z50-C, Si/Al atomic ratio 50) in the absence (Z50-H1) and presence (Z50-H2) of pore-directing agent tetrapropylammonium cations (TPA+).184 TPA+ cations have a high level of control over the dissolution process in the base leaching owing to their strong interaction with the crystal surface, leading to hierarchical zeolites with distinct mesopore topology. The preliminary HRTEM study showed that Z50-H1 displayed a heavily leached surface, while Z50-H2 showed well-preserved crystal facets and discrete homogeneously distributed mesopores (Fig. 18b–d). To improve insights into the mesopore accessibility, identical-location SE and HAADF STEM images were taken using an aberration-corrected STEM (Fig. 18e). From high-resolution SE images, it can be seen that Z50-H1 showed a heavily eroded external crystal surface with large open mesopores, while in contrast Z50-H2 displayed the pristine appearance of the crystal surface with the few readily distinguishable mesopores identical to that of the parent zeolite. Alongside, HAADF-STEM images clearly showed extensive intracrystalline mesoporosity in both the Z50-H1 and Z50-H2 zeolites as revealed by the dark contrast areas in comparison to the uniformly bright contrast observed in the parent zeolite (Fig. 18e). These correlative images provide insights into the impact of demetallation on both the external and bulk structure and corroborate the respective introduction of open and constricted mesopores in the hierarchical H1 and H2 zeolites (Fig. 18f), which agreed well with the results obtained by mercury porosimetry.
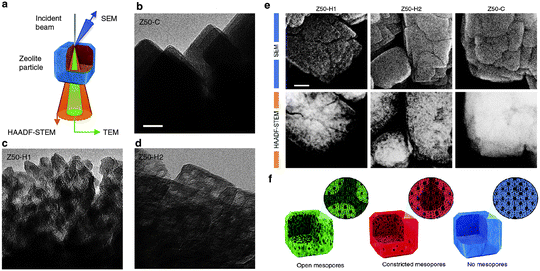 | ||
| Fig. 18 (a) The electron microscopic approach enabling the acquisition of information specific to the bulk (TEM, HAADF-STEM) or external surface (SE) structure of a crystal. (b–d) TEM examination of the zeolites. In comparison with the uniform contrast of the purely microporous crystals of a conventional ZSM-5 (Z50-C, b), the intracrystalline mesopores are evidenced in the catalysts prepared by post-synthetic alkaline treatment (Z50-H1, c, and Z50-H2, d). Remarkably, the gaping fissures and jagged crystal edges exhibited by Z50-H1 zeolite relative to the more internally distributed discrete mesopores and the better preserved external surface of the crystals of Z50-H2 zeolite illustrate the directing role of TPA+ in the preparation of the latter sample. Scale bar indicates 20 nm. (e) Assessment of mesopore location in alkaline-treated zeolites. The distinct mesopore distribution within the hierarchical zeolites is unequivocally discriminated by identical-location SE and HAADF-STEM imaging: the relatively preserved crystal surface of Z50-H2 observed in SE micrographs distinctly contrasts with the highly pitted surface of Z50-H1, appearing unaltered from that of the conventional zeolite, while the prominent regions of dark contrast observed in HAADF-STEM projections evidence the presence of extensive mesoporosity in both Z50-H1 and Z50-H2 compared with the solid appearance of Z50-C. Scale bar indicates 50 nm. (f) The distinct 3D structure of the open and constricted mesopores is illustrated schematically to facilitate visualization. (Reprinted from ref. 184 with permission, Copyright Nature Publishing Group.) | ||
Clearly, TEM provides much higher imaging resolution compared to previously discussed techniques, and insight into the internal structure of imaged crystals. However, it is limited to zeolite crystals of only several hundreds of nanometres in size. To overcome this limitation and allow for larger zeolite crystals to be studied (e.g. ZSM-5 of tens of micrometres in size), thin slices of zeolite samples can be prepared by either FIB sectioning or ultramicrotomy. Xiao and Zou et al. reported the synthesis of single crystal ZSM-5 zeolites with b-axis-aligned mesopores, using a designed cationic amphiphilic copolymer as a mesoscale template.90 TEM showed that the sample consisted of uniformly sized particles (1–2 μm) and the electron diffraction pattern proved that the entire particle was a single crystal (Fig. 19a and b). To unravel the inner pore structures of the crystals, FIB was used to prepare thin slices perpendicular to the main crystallographic axes of ZSM-5 crystals (Fig. 19c–e). Round mesopores were observed in the high-resolution images taken along the b-axis, indicating the orientation of the mesoporous channels parallel to the b-axis. The HRTEM images taken along the c- and a-axis further confirm the existence of mesopore channels running along the b-axis, which were 10–50 nm in size, in good agreement with the N2 adsorption results (6–60 nm). The b-axis-aligned mesoporous ZSM-5 shows much higher catalytic activities for bulky substrate conversion than conventional ZSM-5 and ZSM-5 with randomly oriented mesopores. The possible reason is that almost all b-axis-aligned mesopores in zeolite crystals are open to the surface of ZSM-5 crystals and are accessible by bulky molecules, whereas a majority of the disordered mesopores in the ZSM-5 crystals may be located in the interiors of the crystals and hardly accessible by bulky molecules.
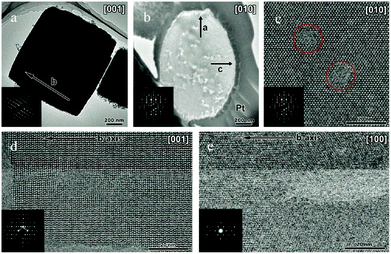 | ||
| Fig. 19 (HR)TEM of ZSM-5 with b-axis-aligned mesopores templated by a cationic amphiphilic copolymer. (a, b) TEM images taken along the (a) c- and (b) b-axis. (c–e) HRTEM images of thin slices of ZSM-5 viewed along the (c) b-, (d) c-, and (e) a-axis, with the crystals cut perpendicular to the b-, c-, and a-axis, respectively, by FIB. The b-axis is marked in (a), (d), and (e). The inset shows the corresponding electron diffraction pattern. (Reprinted from ref. 90 with permission, Copyright American Chemical Society.) | ||
TEM can offer very high-resolution images and provide detailed structure information even at the atomic scale. In addition, the incident electron beam–sample interaction gives rise to characteristic X-rays, which can be used for elemental analysis by EDX. Upon transmission through the sample, the incident electron beam can lose some energy which is element specific, and this loss can be measured using electron energy-loss spectroscopy (EELS). By using energy filters, electrons with energy-loss specific to an element can be selected to form the so-called energy-filtered image (EF-TEM). Therefore, besides the structure, TEM can be used for high spatial resolution elemental mapping. However, the spatial information of the pore architecture is to some extent obscured because the 3D structural features are projected in a 2D image. To visualize the structure in 3D, electron tomography has been developed based on the TEM technique.
Originally, ET was mainly used for the study of biological samples. The first application of ET in materials science was reported by de Jong and co-workers in 2000, focusing on the study of the pore architecture of a dealuminated zeolite as well as the size and location of metal particles on supported catalysts.190 In this work, the mesopores (3–20 nm in diameter) inside an industrially important acid-leached Mordenite zeolite, which were hardly distinguishable in conventional TEM images due to the superimposition of the surrounding material and/or the variant sample thickness, were unequivocally clarified by an ET slice from the 3D reconstruction of the crystallite (Fig. 20).
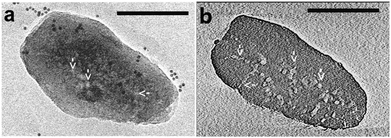 | ||
| Fig. 20 Mesopores in an intact acid-leached H-mordenite crystal. Scale bar is 100 nm. (a) Conventional TEM image indicating the mesopores in the crystallite (white spots, arrows) and several gold beads (black dots, 5 nm in diameter) on the grid for the alignment. (b) Digital slice (0.6 nm thick) through the 3D reconstruction of the crystallite showing the mesopores inside the crystallite (arrows). (Reprinted from ref. 190 with permission, Copyright American Chemical Society.) | ||
Mesoporous zeolite Y obtained by dealumination is an important catalyst for oil refining processes such as fluid catalytic cracking and hydrocracking. From the ET analysis of three different zeolite Y catalysts, including a non-treated zeolite Y (NaY), a steamed NH4Y zeolite (USY) and a NH4Y subjected to two steaming and one acid leaching treatment (XVUSY), new insights into their mesopore architecture were obtained.191 As expected, both TEM and ET images of the non-treated sample NaY zeolite confirmed the absence of mesopores (Fig. 21a and b). In contrast, the USY and XVUSY zeolite exhibited lots of mesopores within the crystals, which had been clearly resolved in the ET slices (Fig. 21d and f) as compared to the TEM images (Fig. 21c and e). Due to the very clear visualization of the mesopores in the ET slices, the diameter of the mesopores can be determined accordingly: 3–20 nm and 4–34 nm for USY and XVUSY, respectively. The fidelity of these values was confirmed by the very good agreement with the pore size distribution calculated from the N2 physisorption results: 4–20 nm for USY and 4–40 nm for XVUSY. From the ET slice of the USY sample (Fig. 21d), some dark cavities and a dark band on the outer surface of the crystal were also detected. The difference between the bulk and surface Si/Al ratio indicated that such dark areas were amorphous alumina deposited during the steam treatment. This amorphous material can deteriorate the mass transfer in the porous system. This phenomenon was absent in XVUSY, because the amorphous material was removed by the acid-treatment, as evidenced from the ET slices and the absence of the dark band. Moreover, it was found by ET that many mesopores in USY and XVUSY were cavities rather than cylindrical mesopores. Such cavities connect to the outer surface of the crystal only via the zeolite micropores. This is consistent with the results from N2 physisorption showing sudden closure of the hysteresis loop characteristic of the existence of ink-bottle type mesopores with a ‘bottle-neck’ smaller than 4 nm. The cavity mesopores, in principle, are hardly beneficial for the accessibility of and diffusivity within zeolite micropores, and should be avoided during the pore-tailoring for catalysis application.
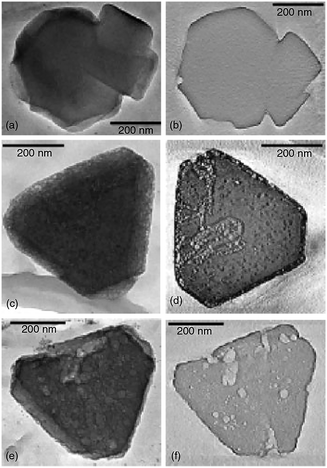 | ||
| Fig. 21 (a) 2D TEM image of NaY. (b) Slice of the 3D reconstruction of NaY zeolite. (c) 2D TEM image of USY zeolite. (d) Slice of the 3D reconstruction of USY zeolite. (e) 2D TEM image of XVUSY zeolite. (f) Slice of the 3D reconstruction of XVUSY zeolite. (Reprinted from ref. 191 with permission, Copyright John Wiley & Sons, Inc.) | ||
According to these results, a mechanism for mesopore generation during steaming and acid leaching was proposed, adding new aspects to the earlier model.192 During the first steaming step, small cavities were formed by the extraction of aluminium ions from the zeolite lattice, which were subsequently deposited in the micro- and mesopores and on the external surface of the crystals. During the second steaming step, small cavities coalesced into larger cavities or cylindrical pores in XVUSY. The deposited aluminium species were removed by the subsequent acid leaching. A further study by combining results from ET with nitrogen physisorption and mercury porosimetry enabled the discrimination between cylindrical mesopores and cavities inside the zeolite.193 A large relative fraction of the mesopores with respect to the total mesopore volume (0.20 for USY and 0.29 for XVUSY) proved to be cavities. It was also found that zeolite Y obtained by a special hydrothermal treatment and acid leaching exhibited almost exclusively interconnected cylindrical mesopores.
Apart from the dealuminated zeolites, ET has also been used to study hierarchical zeolites synthesized by other strategies such as carbon-templating, base leaching, zeolite recrystallization, and soft-templating, offering more clear information on the presence, location, morphology and connectivity of the mesopores.36,98,194,195
Janssen et al. employed ET to study the influence of the carbon source and zeolite synthesis conditions on the mesoporous zeolites obtained by the hard templating method.36 The results reveal that both carbon nanofibers and carbon black aggregates employed could lead to the formation of cylindrical mesopores open to the external surface of the zeolite crystals. Moreover, it was unambiguously demonstrated that the tortuosity of the mesopores templated with carbon black was much higher than that obtained with carbon nanofibers. With increasing zeolite crystal size by changing the synthesis condition, carbon aggregates tend to be completely surrounded by the zeolite, resulting in ink-bottle type mesopores only accessible through micropores.
Groen et al. studied the effect of Al gradients in zeolite crystals on porosity development during base leaching with ET.194 The non-treated zeolite ZSM-5 crystals with a size ranging from 400 to 700 nm (Fig. 22a) showed no mesoporosity in the N2 isotherms (Z-nt in Fig. 22b) and TEM images (Fig. 22c). When subjected to base leaching for 15 or 30 min, the samples exhibited mesoporosity as evidenced from the enhanced N2 uptake and the distinct hysteresis loop over the isothermal curves (Fig. 22b). A H2 hysteresis loop with a forced closure at p/p0 = 0.42 appeared over the sample treated for 15 min (Z-at15), indicating the presence of voids or cavities accessible only by pores smaller than 4 nm. The bright areas in the TEM image (Fig. 22d) also indicated the formation of mesopores obscured by a dark rim of material. The ET virtual slice (Fig. 22e) through the reconstruction of the crystal clearly showed a rather uniform mesoporosity in the interior of the crystal, while the outer part remained relatively unaffected by base treatment (Fig. 22f). The visualization by ET successfully proved the presence of a hollow zeolite structure, resulting from the base leaching of the zeolite with Al-zoning, that is, an Al-rich external surface as compared to the bulk Al concentration.
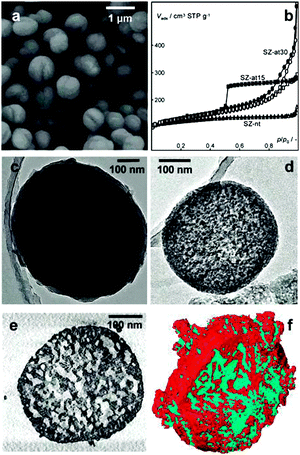 | ||
| Fig. 22 (a) SEM micrograph of non-treated ZSM-5 crystals (Z-nt). (b) N2 adsorption isotherms at 77 K of Z-nt and alkaline-treated ZSM-5 (Z-at). (c) TEM micrograph of Z-nt. (d) TEM micrograph of Z-at. (e) ET virtual cross sections through the reconstruction of a Z-at crystal. (f) Surface rendering of a Z-at crystal; zeolite material in red, porosity in blue. A section was cut out to obtain an inside view of the particle. (Reprinted from ref. 194 with permission, Copyright American Chemical Society.) | ||
ET was recently used in combination with rotation electron diffraction (RED), also referred to as electron diffraction tomography (EDT), which provides explicit information on the crystalline phase structure in 3D.
Garcia-Martinez et al. studied the pore architecture of hierarchical zeolite Y prepared by the zeolite recrystallization strategy.195 Though this catalyst showed significantly improved product selectivity, the nature and connectivity of the mesopores are still controversial. Other groups also suggested that materials of composite nature can be prepared under a similar synthesis condition.19 To clarify this question, advanced characterization techniques such as electron tomography and three-dimensional rotation electron diffraction were employed, giving a comprehensive picture of the mesostructure and crystallinity of this zeolite. The electron diffraction from the rotation electron diffraction (RED) data series (Fig. 23a) proved the high crystallinity of the mesoporous Y crystals. The 3D reciprocal lattice (Fig. 23c) reconstructed from the 3D RED data further showed two sets of crystal lattices in the zeolite Y particle, indicating the presence of twinning. The tomogram reconstructed from the TEM images clearly shows how the mesopores are distributed throughout the crystal. The pore architecture and the connectivity of the mesopores are illustrated in the volume rendered model of electron tomography (Fig. 23b and d). These results unambiguously revealed the intracystalline nature and connectivity of the introduced mesopores and provided 3D-specific information on zeolite crystallinity.
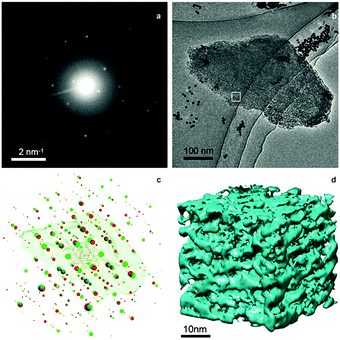 | ||
| Fig. 23 RED and ET characterizations of the mesoporous zeolite Y prepared by the zeolite recrystallization strategy. (a) An electron diffraction frame in the RED data series. (b) The corresponding TEM image in the ET series. (c) Reconstructed 3D reciprocal lattices from the RED data with the reconstructed 3D morphology of the corresponding particle obtained from electron tomography superimposed. RED data show that the particle is highly crystalline zeolite Y with two twin domains (lattices shown in red and green, respectively) sharing a common [111] axis. (d) The 3D volume of a part of the tomogram from the area marked in (b) showing the connectivity of the mesopores in the crystal. (Reprinted from ref. 195 with permission, Copyright John Wiley & Sons, Inc.) | ||
Recently, Xiao et al. used a nonsurfactant cationic polymer as a dual-function template and synthesized a highly mesoporous single-crystalline zeolite Beta.98 To elucidate the single crystal nature and mesoporous structure of the obtained zeolite, HAADF-STEM tomography and EDT were employed. With EDT, 3D reciprocal space was reconstructed from a series of SAED patterns. The obtained reciprocal lattice (Fig. 24a–c) demonstrated the single-crystalline nature of the obtained beta zeolite. The non-identity of the projections in a* and b* directions and the 10 ± 1.5° elongation of the projection in the b* direction (Fig. 24c) suggest a certain degree of structural distortion, possibly due to the presence of highly dense mesopores. ET tomography was constructed from the tilt series of STEM images (Fig. 24d) and can be visualized through surface rendering. A highly mesoporous structure was observed on the surface of the rendered 3D volume (Fig. 24e), while the ET slice showed the distribution of the mesopores inside the crystal (Fig. 24f).
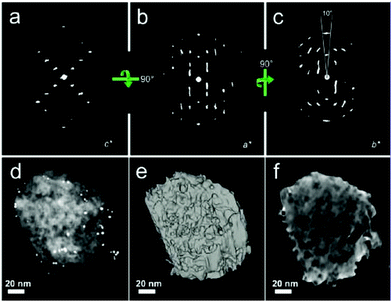 | ||
| Fig. 24 EDT and ET characterizations of single-crystalline mesoporous beta templated by a dual-function nonsurfactant cationic polymer. (a–c) Reconstructed reciprocal lattice from EDT projected along the c*, a*, and b* directions, respectively. For the reciprocal space reconstruction, 435 SAED patterns were collected around an arbitrary axis at 0.2° intervals from a randomly selected beta-MS crystal. (d) Representative HAADF-STEM image selected from a tilting series over a range from −75° to +75° at regular intervals of 1°. The bright dots represent Au nanoparticles that were used as markers for image tracking during the tomography. (e) Reconstructed morphology from HAADF-STEM tomography visualized by surface rendering. (f) A slice (2 nm thick) approximately normal to the [001] direction extracted from the reconstructed volume, clearly showing the presence of abundant mesopores within the crystal. (Reprinted from ref. 98 with permission, Copyright American Chemical Society.) | ||
Besides the qualitative information on mesoporosity in zeolites discussed in previous examples, ET combined with image analysis can provide important quantitative information.196,197 Image analysis allows, based on the difference in contrast between zeolite and mesopores, to segment (i.e. isolate) zeolite and mesopores using thresholding operation. The isolated volumes of mesopores can be further measured and analysed using different morphological operations (e.g. opening size distribution for determining the local pore diameter). To obtain quantitative information, the 3D reconstructions of the mesopores of the USY and XVUSY zeolites were submitted to image analysis by Ziese et al.196 The resulting volume rendered segmentations of 3D reconstructions can be seen in Fig. 25a. The blue areas in the zeolite represented the mesopores. The mesopores in the USY zeolite had a relatively narrow distribution with the maximum around 7 nm, while the mesopores in XVUSY zeolite had a broader size distribution centred at about 11 nm (Fig. 25b), which indicates a higher amount of larger pores in XVUSY zeolite. Although obtained from a single zeolite crystal, these results were in agreement with N2 physisorption results. Compared to the USY zeolite, the XVUSY zeolite was treated with an extra steaming step and acid leaching step, which seems to enlarge the mesopores in the zeolite.
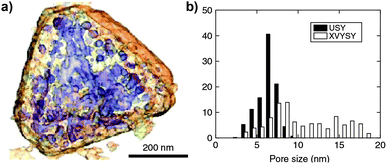 | ||
| Fig. 25 (a) 3D representation of XVUSY showing the mesopores through the transparent surface of the particle. (b) Mesopore size distributions of USY and XVUSY obtained by image analysis of electron tomograms. (Adapted from ref. 196.) | ||
By combining ET with advanced image analysis Zečević and Gommes et al. made a more in-depth quantitative study of the mesoporous morphology properties of an industrially relevant mesoporous zeolite Y prepared by steaming and acid leaching. Detailed information on the architecture of the mesoporous network, such as accessibility and tortuosity of mesopores and size distribution of microporous domains created upon the introduction of mesopores, was obtained.197 Based on the segmented ET reconstruction and image processing, three types of mesopores were distinguished including open mesopores that are accessible from the outer surface of the crystal (Fig. 26a), closed mesopores that can only be reached by micropores (Fig. 26b), and constricted mesopores that can be reached from the outer surface only through narrower openings (smaller than 4 nm), the size of which cannot be resolved by N2 physisorption. The volume and diameters of these mesopores can be quantitatively determined as shown in Fig. 26c. The tortuosity of the mesopore network, that is, how curved the mesopore channels are, is an important parameter that can greatly influence the mass transfer efficiency of the mesopore network. For the studied mesopores, the tortuosity was calculated to be 1.3, which indicates on average rather straight pores. Finally, quantitative information about the size of the microporous domains between mesopore channels, which essentially determines the diffusion path length of molecules within the zeolite, was also obtained by measuring the distance between any point in the micropore region and the closest mesopore surface. It was found that 90% of the micropores had a distance smaller than 15 nm from the closest mesopore channel (Fig. 26d and e). The quantitative information grants a more comprehensive and accurate assessment of the mesopore properties and thus greatly improves the understanding of the mesoporous architecture of hierarchical zeolites.
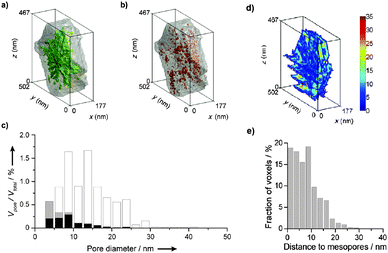 | ||
| Fig. 26 (a–c) Accessibility of the mesopores described and quantified using image processing. Volume-rendered 3D representations of the open mesopores in green (a) and the “closed” mesopores in red (b) visually suggest that an open type of porosity prevails. (c) Pore size distribution of open mesopores (white), constricted mesopores (gray), and “closed” mesopores (black) defined as Vpore/Vtotal, where Vpore corresponds to the volume of the considered types of mesopores and Vtotal to the total volume of the zeolite crystal. (d, e) Size distribution of microporous domains created upon introduction of mesopores. (d) Color map of the shortest distances from any point of a micropore region to the nearest mesopore surface. Color bar refers to distances in nm. (e) Size distribution of the microporous domains defined as a fraction of the voxels of the microporous region with a corresponding shortest distance to the mesopore surface. (Reprinted from ref. 197 with permission, Copyright John Wiley & Sons, Inc.) | ||
From the above examples, we can see that compared to conventional TEM, ET yields unprecedented and unambiguous 3D information, both qualitatively and quantitatively, on the mesopore characteristics including pore shape, size, connectivity, accessibility and tortuosity inside individual crystals. Such knowledge greatly contributes to our understanding of the relationship between the pore architecture and the synthesis method employed, and further enables a rational design of mesoporous zeolites with improved functionality. However, compared with conventional SEM and TEM characterization, ET requires much longer time for data acquisition, which is not only time-consuming but also increases the difficulty for the analysis of electron beam sensitive samples.
3.4 Integrated approach
From the aforementioned techniques, we can see that different structural probes are required to visualize the hierarchical zeolite materials and study them at different length scales. With optical microscopy such as confocal fluorescence microscopy, one can determine the location of mesopores on a macro-scale and within a large area (hundreds of microns). Electron-based techniques, such as SEM, TEM, FIB-SEM tomography and electron tomography, allow the study of pore architecture at nanoscales, however, sacrificing the view area (hundreds of nanometres). The resolution of X-ray tomography lies between that of the optical microscopy and the electron-based microscopy, bridging the gaps between these two techniques. Pérez-Ramírez and co-workers recently showed an integrated approach to visualize millimetre-sized granules of a hierarchical MFI type zeolite by a combination of state-of-the-art optical, X-ray and electron-based microscopic and tomographic techniques.174 In this work, digital reflected light microscopy was used to image the macroscopic structure (Fig. 27a). With profilometry, a relatively uniform rough surface of the granules was observed (Fig. 27c). Confocal laser scanning microscopy (CLSM) showed clear green fluorescence formed by the reaction of thiophene with zeolitic Brønsted acid sites upon illumination with a 488 nm laser, revealing zeolite particles with varying size in the external surface region of the granules (Fig. 27d). X-ray micro-CT and SRXTM were used to unravel the internal structure as we have described in Section 3.2 (Fig. 27b, e and g), together with FIB-SEM (Fig. 27f) revealing the homogeneous internal distribution of the zeolite, binder and the macro-/mesoporosity in between. The high-resolution SEM showed that the zeolite particles were tightly aggregated polycrystalline particles of 50–70 nm in size, and the binder particles were needle-like with a width of 10–20 nm and a length of 0.5–1 μm surrounding the zeolites (Fig. 27h). Energy-dispersive X-ray (EDX) spectroscopy clearly differentiated the zeolite and binder phase with distinct composition through mapping the silicon and aluminium (Fig. 27i). TEM images of the microtomed sample revealed that the binder particles were wedged between the zeolite particles and the intracrystalline mesopores were created in the zeolite crystal by base leaching (Fig. 27k). HAAFD-STEM and HRTEM images further confirmed the uniform distribution of intracrystalline mesopores within individual zeolite aggregates (Fig. 27j and l). The authors demonstrated that only by integrating various imaging techniques the millimetre sized zeolite-based catalyst body can be comprehensively studied from macro- to nanoscales, providing thus a full picture of the structure and composition. Such approach proves to be a powerful methodology, revealing otherwise inaccessible information regarding structural organization over the whole range of length scales.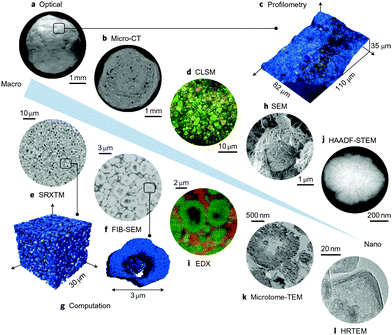 | ||
| Fig. 27 Integrated approach to the visualization of a hierarchical zeolite body from macro to nano length scales. (a, b) The macroscopic structure of a hierarchical zeolite granule is observed by optical microscopy (a) and the internal structure is revealed by X-ray micro-CT (b), providing insight into the agglomeration behaviour within the shaped body. (c, d) The structure of the external surface is further examined by profilometry (c) and CLSM (d). (e–g) SRXTM (e) and FIB-SEM (f) reveal the homogeneous internal distribution of zeolite and binder phases and permit visualization and computation of the macro- and mesopore structures (g). (h, i) The arrangement of binder particles at the external surface of zeolite particles is seen by SEM (h) and elemental maps of silicon (green) and aluminium (red) are obtained by EDX (i). (j) A HAAFD-STEM image confirms the uniform distribution of intracrystalline mesopores within individual zeolite aggregates. (k, l) Nanostructural insights are gained through the TEM study of microtome cross-sections (k) and ultimately by HRTEM (l). (Reprinted from ref. 174 with permission, Copyright Nature Publishing Group.) | ||
4. Conclusions
Hierarchical zeolites, coupling meso- and/or macroporosity with the intrinsic microporosity, are considered an attractive upgrade of conventional zeolites in many established and emerging processes involving catalytic reactions especially with bulky molecules. Over the past years, the ever-increasing interest in hierarchical zeolites has fuelled the development and progress of both synthesis strategies for tailoring the pores and imaging techniques for visualizing the pore architecture.In this review, we have classified and summarized the so far developed synthesis approaches, including assembly (hard, soft and non-templating), demetallization (dealumination and desilication) and mixed (zeolite recrystallization) methods. The dealumination strategy was developed the earliest of all and has been widely applied for industrial zeolite catalysts. However, with the extraction of aluminium from the framework, the number of acid sites is decreased together with the formation of many isolated mesoporous cavities, which hardly facilitate the diffusion. Desilication is an alternative demetallization method to create hierarchical porosity at the expense of removing Si from the zeolite framework. In recent years, it has undergone a great development. With the aid of extra pore directing agents or coupling with acid leaching, it now offers increased control over pore size and connectivity and expands the range of the accessible Si/Al ratio of the parent zeolite for successful desilication. The loss of material is a problem of this method with respect to large scale applications. The assembly methods mainly rely on the use of hard or soft templates to create mesopores. With the exploration of novel templates, a higher control of the additional porosity has been achieved. However, the economic and environmental costs need to be considered because most of these templates are expensive and irretrievable. Although assembly methods without the use of mesopore templates have been reported, it is still difficult to implement them on a large scale due to the time-consuming preparative process and the rigorous synthesis condition. Zeolite recrystallization through desilication in the presence of conventional surfactants is the closest to industrial realization at the moment due to the advantage of high yield and relatively low environmental cost as compared to the demetallization methods and the assembly methods. Recently, FCC catalysts with mesoporous zeolite Y made by the zeolite recrystallization route were scaled up and successfully performed in two separate North American refineries.198,199 Although great improvements have been made, new synthesis strategies for tailoring hierarchical pore architecture with low economic and environmental cost, high controllability and versatility still remain of great interest and challenge.
To optimize the functionality of hierarchical zeolites, comprehensive assessment and full understanding of the pore network structure is a premise. Various microscopy techniques have been employed to visualize pore architecture at different length scales. With optical microscopy, such as confocal fluorescence microscopy, the whole zeolite crystals can be studied. By making use of a molecule that can only be synthesized in the larger pores of the zeolite, one can map the location of these pores. However, the mesoporosity cannot be studied in great detail due to the limited resolution. A higher resolution than optical microscopy can be achieved by X-ray microscopy. X-rays have much higher penetrative power and X-ray tomography can be used to visualize the sample of hundreds of micrometres thickness in 3D without the need of cutting. However, high intensity synchrotron X-ray sources are required, which is inconvenient for routine studies. SEM provides a lot of information about the surface morphology of the crystals. With the combination of FIB and SEM, the internal structure of the sample can also be studied. FIB-SEM tomography allows mapping of the internal mesoporous structure in 3D, although with limited resolution. A more detailed technique is TEM, with which even atomic resolution can be achieved. A thin sample is required for this technique since a beam of electrons must be transmitted through the sample. Although TEM can provide some information about the presence and shape of mesopores in the sample, it can't provide information about the connectivity of the mesopores as 3D information is lacking. ET has already proven to be a very promising technique for the 3D characterization of materials. Quantitative information about the zeolite pore structure, such as the distance from micropores to mesopores and tortuosity, can be derived from the reconstructions. However, challenges remain in reducing the time to acquire tomograms. The electron beam can be destructive for the zeolite sample, causing it to shrink during the measurement and thus reduce tomogram resolution. Elemental analysis by EDX combined with ET could yield very valuable information on both chemical composition and porous structure. Another challenge lies in the development of in situ TEM and tomography. Visualization of mesopore formation in zeolites in real time would provide very valuable information to optimize and control these processes. It is important to note that ET inevitably only probes a small amount of the sample, and hence, verification by comparison with bulk physical measurements is mandatory. While techniques such as N2 physisorption and Hg porosimetry are common bulk techniques for assessing pore size distributions, they can only to certain extent describe pore network accessibility and connectivity. Recently developed positron annihilation lifetime spectroscopy, however, showed promising results in determining the pore connectivity parameter which correlated to the performance of investigated catalysts.200
Acknowledgements
The research of YW has been made possible by support of the BP International Limited. KP and JZ acknowledge support from NRSCC and an ERC Advanced Grant.Note and references
- A. Corma, Chem. Rev., 1995, 95, 559–614 CrossRef CAS
.
- J. Weitkamp, Solid State Ionics, 2000, 131, 175–188 CrossRef CAS
.
- C. R. Marcilly, Top. Catal., 2000, 13, 357–366 CrossRef CAS
.
- B. Smit and T. L. Maesen, Nature, 2008, 451, 671–678 CrossRef CAS PubMed
.
- http://www.iza-structure.org/databases/ .
- C. T. Kresge, M. E. Leonowicz, W. J. Roth, J. C. Vartuli and J. S. Beck, Nature, 1992, 359, 710–712 CrossRef CAS PubMed
.
- J. S. Beck, J. C. Vartuli, W. J. Roth, M. E. Leonowicz, C. T. Kresge, K. D. Schmitt, C. T. W. Chu, D. H. Olson, E. W. Sheppard, S. B. McCullen, J. B. Higgins and J. L. Schlenker, J. Am. Chem. Soc., 1992, 114, 10834–10843 CrossRef CAS
.
- D. Zhao, Science, 1998, 279, 548–552 CrossRef CAS
.
- M. E. Davis, Nature, 2002, 417, 813–821 CrossRef CAS PubMed
.
- J. Jiang, J. Yu and A. Corma, Angew. Chem., Int. Ed., 2010, 49, 3120–3145 CrossRef CAS PubMed
.
- S. Lopez-Orozco, A. Inayat, A. Schwab, T. Selvam and W. Schwieger, Adv. Mater., 2011, 23, 2602–2615 CrossRef CAS PubMed
.
- D. Verboekend and J. Pérez-Ramírez, Catal. Sci. Technol., 2011, 1, 879 CAS
.
- Z. L. Hua, J. Zhou and J. L. Shi, Chem. Commun., 2011, 47, 10536–10547 RSC
.
- R. Chal, C. Gérardin, M. Bulut and S. van Donk, ChemCatChem, 2011, 3, 67–81 CrossRef CAS PubMed
.
- L. H. Chen, X. Y. Li, J. C. Rooke, Y. H. Zhang, X. Y. Yang, Y. Tang, F. S. Xiao and B. L. Su, J. Mater. Chem., 2012, 22, 17381–17403 RSC
.
- K. Moller and T. Bein, Chem. Soc. Rev., 2013, 42, 3689–3707 RSC
.
- D. P. Serrano, J. M. Escola and P. Pizarro, Chem. Soc. Rev., 2013, 42, 4004–4035 RSC
.
- K. Na, M. Choi and R. Ryoo, Microporous Mesoporous Mater., 2013, 166, 3–19 CrossRef CAS PubMed
.
- I. I. Ivanova and E. E. Knyazeva, Chem. Soc. Rev., 2013, 42, 3671–3688 RSC
.
- K. Li, J. Valla and J. Garcia-Martinez, ChemCatChem, 2014, 6, 46–66 CrossRef CAS PubMed
.
- K. Na and G. A. Somorjai, Catal. Lett., 2015, 145, 193–213 CrossRef CAS PubMed
.
- L. Tosheva and V. P. Valtchev, Chem. Mater., 2005, 17, 2494–2513 CrossRef CAS
.
- E. P. Ng, D. Chateigner, T. Bein, V. Valtchev and S. Mintova, Science, 2012, 335, 70–73 CrossRef CAS PubMed
.
- H. Awala, J. P. Gilson, R. Retoux, P. Boullay, J. M. Goupil, V. Valtchev and S. Mintova, Nat. Mater., 2014, 14, 447–451 CrossRef PubMed
.
- F. Ocampo, H. S. Yun, M. Maciel Pereira, J. P. Tessonnier and B. Louis, Cryst. Growth Des., 2009, 9, 3721–3729 CAS
.
- B. Louis, F. Ocampo, H. S. Yun, J. P. Tessonnier and M. Maciel Pereira, Chem. Eng. J., 2010, 161, 397–402 CrossRef CAS PubMed
.
- C. Madsen and C. J. H. Jacobsen, Chem. Commun., 1999, 673–674 RSC
.
- I. Schmidt, C. Madsen and C. J. H. Jacobsen, Inorg. Chem., 2000, 39, 2279–2283 CrossRef CAS
.
- C. J. H. Jacobsen, C. Madsen, J. Houzvicka, I. Schmidt and A. Carlsson, J. Am. Chem. Soc., 2000, 122, 7116–7117 CrossRef CAS
.
- I. Schmidt, A. Krogh, K. Wienberg, A. Carlsson, M. Brorson and C. J. H. Jacobsen, Chem. Commun., 2000, 2157–2158 RSC
.
- M. Y. Kustova, P. Hasselriis and C. H. Christensen, Catal. Lett., 2004, 96, 205–211 CrossRef CAS
.
- K. Egeblad, M. Kustova, S. K. Klitgaard, K. Zhu and C. H. Christensen, Microporous Mesoporous Mater., 2007, 101, 214–223 CrossRef CAS PubMed
.
- X. Wei and P. G. Smirniotis, Microporous Mesoporous Mater., 2006, 89, 170–178 CrossRef CAS PubMed
.
- I. Schmidt, A. Boisen, E. Gustavsson, K. Stahl, S. Pehrson, S. Dahl, A. Carlsson and C. J. H. Jacobsen, Chem. Mater., 2001, 13, 4416–4418 CrossRef CAS
.
- A. Boisen, I. Schmidt, A. Carlsson, S. Dahl, M. Brorson and C. J. H. Jacobsen, Chem. Commun., 2003, 958–959 RSC
.
- A. H. Janssen, I. Schmidt, C. J. H. Jacobsen, A. J. Koster and K. P. de Jong, Microporous Mesoporous Mater., 2003, 65, 59–75 CrossRef CAS PubMed
.
- F. Schmidt, S. Paasch, E. Brunner and S. Kaskel, Microporous Mesoporous Mater., 2012, 164, 214–221 CrossRef CAS PubMed
.
- Y. S. Tao, H. Kanoh and K. Kaneko, J. Am. Chem. Soc., 2003, 125, 6044–6045 CrossRef CAS PubMed
.
- Y. S. Tao, H. Kanoh and K. Kaneko, J. Phys. Chem. B, 2003, 107, 10974–10976 CrossRef CAS
.
- Y. S. Tao, H. Kanoh and K. Kaneko, Langmuir, 2005, 21, 504–507 CrossRef CAS PubMed
.
- W. C. Li, A. H. Lu, R. Palkovits, W. Schmidt, B. Spliethoff and F. Schuth, J. Am. Chem. Soc., 2005, 127, 12595–12600 CrossRef CAS PubMed
.
- M. Kustova, K. Egeblad, K. Zhu and C. H. Christensen, Chem. Mater., 2007, 19, 2915–2917 CrossRef CAS
.
- K. Zhu, K. Egeblad and C. H. Christensen, Eur. J. Inorg. Chem., 2007, 3955–3960 CrossRef CAS PubMed
.
- X. Wang, G. Li, W. Wang, C. Jin and Y. Chen, Microporous Mesoporous Mater., 2011, 142, 494–502 CrossRef CAS PubMed
.
- R. J. White, A. Fischer, C. Goebel and A. Thomas, J. Am. Chem. Soc., 2014, 136, 2715–2718 CrossRef CAS PubMed
.
- Z. X. Yang, Y. D. Xia and R. Mokaya, Adv. Mater., 2004, 16, 727–732 CrossRef CAS PubMed
.
- A. Sakthivel, S. J. Huang, W. H. Chen, Z. H. Lan, K. H. Chen, T. W. Kim, R. Ryoo, A. S. T. Chiang and S. B. Liu, Chem. Mater., 2004, 16, 3168–3175 CrossRef CAS
.
- Y. Fang and H. Hu, J. Am. Chem. Soc., 2006, 128, 10636–10637 CrossRef CAS PubMed
.
- H. S. Cho and R. Ryoo, Microporous Mesoporous Mater., 2012, 151, 107–112 CrossRef CAS PubMed
.
- S. S. Kim, J. Shah and T. J. Pinnavaia, Chem. Mater., 2003, 15, 1664–1668 CrossRef CAS
.
- H. Li, Y. Sakamoto, Z. Liu, T. Ohsuna, O. Terasaki, M. Thommes and S. Che, Microporous Mesoporous Mater., 2007, 106, 174–179 CrossRef CAS PubMed
.
- W. Fan, M. A. Snyder, S. Kumar, P. S. Lee, W. C. Yoo, A. V. McCormick, R. Lee Penn, A. Stein and M. Tsapatsis, Nat. Mater., 2008, 7, 984–991 CrossRef CAS PubMed
.
- H. Chen, J. Wydra, X. Zhang, P. S. Lee, Z. Wang, W. Fan and M. Tsapatsis, J. Am. Chem. Soc., 2011, 133, 12390–12393 CrossRef CAS PubMed
.
- B. T. Holland, L. Abrams and A. Stein, J. Am. Chem. Soc., 1999, 121, 4308–4309 CrossRef CAS
.
- K. H. Rhodes, S. A. Davis, F. Caruso, B. J. Zhang and S. Mann, Chem. Mater., 2000, 12, 2832–2834 CrossRef CAS
.
- V. Naydenov, L. Tosheva and J. Sterte, Microporous Mesoporous Mater., 2003, 66, 321–329 CrossRef CAS PubMed
.
- V. Naydenov, L. Tosheva and J. Sterte, Chem. Mater., 2002, 14, 4881–4885 CrossRef CAS
.
- Y. Kang, W. Shan, J. Wu, Y. Zhang, X. Wang, W. Yang and Y. Tang, Chem. Mater., 2006, 18, 1861–1866 CrossRef CAS
.
- Y. Shi, X. Li, J. Hu, J. Lu, Y. Ma, Y. Zhang and Y. Tang, J. Mater. Chem., 2011, 21, 16223–16230 RSC
.
- H. Zhu, Z. Liu, Y. Wang, D. Kong, X. Yuan and Z. Xie, Chem. Mater., 2008, 20, 1134–1139 CrossRef CAS
.
- B. J. Zhang, S. A. Davis, N. H. Mendelson and S. Mann, Chem. Commun., 2000, 781–782 RSC
.
- A. G. Dong, Y. J. Wang, Y. Tang, N. Ren, Y. H. Zhang, J. H. Yue and Z. Gao, Adv. Mater., 2002, 14, 926–929 CrossRef CAS
.
- O. de la Iglesia, J. Luis Sanchez and J. Coronas, Mater. Lett., 2011, 65, 3124–3127 CrossRef CAS PubMed
.
- F. Ocampo, J. A. Cunha, M. R. de Lima Santos, J. P. Tessonnier, M. M. Pereira and B. Louis, Appl. Catal., A, 2010, 390, 102–109 CrossRef CAS PubMed
.
- V. Valtchev, M. Smaihi, A. C. Faust and L. Vidal, Angew. Chem., Int. Ed., 2003, 42, 2782–2785 CrossRef CAS PubMed
.
- V. P. Valtchev, M. Smaihi, A. C. Faust and L. Vidal, Chem. Mater., 2004, 16, 1350–1355 CrossRef CAS
.
- P. Prokesova-Fojokova, S. Mintova, J. Cejka, N. Zilkova and A. Zukal, Microporous Mesoporous Mater., 2006, 92, 154–160 CrossRef PubMed
.
- A. Karlsson, M. Stocker and R. Schmidt, Microporous Mesoporous Mater., 1999, 27, 181–192 CrossRef CAS
.
- L. M. Huang, W. P. Guo, P. Deng, Z. Y. Xue and Q. Z. Li, J. Phys. Chem. B, 2000, 104, 2817–2823 CrossRef CAS
.
- Y. Zhu, Z. Hua, J. Zhou, L. Wang, J. Zhao, Y. Gong, W. Wu, M. Ruan and J. Shi, Chem. – Eur. J., 2011, 17, 14618–14627 CrossRef CAS PubMed
.
- M. B. Yue, L. B. Sun, T. T. Zhuang, X. Dong, Y. Chun and J. H. Zhu, J. Mater. Chem., 2008, 18, 2044 RSC
.
- Y. Liu, W. Z. Zhang and T. J. Pinnavaia, Angew. Chem., Int. Ed., 2001, 40, 1255–1258 CrossRef CAS
.
- Y. Liu, W. Z. Zhang and T. J. Pinnavaia, J. Am. Chem. Soc., 2000, 122, 8791–8792 CrossRef CAS
.
- Z. T. Zhang, Y. Han, L. Zhu, R. W. Wang, Y. Yu, S. L. Qiu, D. Y. Zhao and F. S. Xiao, Angew. Chem., Int. Ed., 2001, 40, 1258–1262 CrossRef CAS
.
- Y. D. Xia and R. Mokaya, J. Mater. Chem., 2004, 14, 3427–3435 RSC
.
- S. P. Naik, A. S. T. Chiang, R. W. Thompson and F. C. Huang, Chem. Mater., 2003, 15, 787–792 CrossRef CAS
.
- D. P. Serrano, J. Aguado, J. M. Escola, J. M. Rodríguez and A. Peral, Chem. Mater., 2006, 18, 2462–2464 CrossRef CAS
.
- D. P. Serrano, J. Aguado, G. Morales, J. M. Rodríguez, A. Peral, M. Thommes, J. D. Epping and B. F. Chmelka, Chem. Mater., 2009, 21, 641–654 CrossRef CAS
.
- D. P. Serrano, J. Aguado, J. M. Escola, J. M. Rodríguez and A. Peral, J. Mater. Chem., 2008, 18, 4210–4218 RSC
.
- D. P. Serrano, J. Aguado, J. M. Escola, A. Peral, G. Morales and E. Abella, Catal. Today, 2011, 168, 86–95 CrossRef CAS PubMed
.
- M. Choi, H. S. Cho, R. Srivastava, C. Venkatesan, D. H. Choi and R. Ryoo, Nat. Mater., 2006, 5, 718–723 CrossRef CAS PubMed
.
- G. V. Shanbhag, M. Choi, J. Kim and R. Ryoo, J. Catal., 2009, 264, 88–92 CrossRef CAS PubMed
.
- M. Choi, R. Srivastava and R. Ryoo, Chem. Commun., 2006, 4380–4382 RSC
.
- K. Cho, H. S. Cho, L.-C. de Ménorval and R. Ryoo, Chem. Mater., 2009, 21, 5664–5673 CrossRef CAS
.
- Y. Fan, H. Xiao, G. Shi, H. Liu and X. Bao, J. Catal., 2012, 285, 251–259 CrossRef CAS PubMed
.
- A. Inayat, I. Knoke, E. Spiecker and W. Schwieger, Angew. Chem., Int. Ed., 2012, 51, 1962–1965 CrossRef CAS PubMed
.
- M. Khaleel, A. J. Wagner, K. A. Mkhoyan and M. Tsapatsis, Angew. Chem., Int. Ed., 2014, 53, 9456–9461 CrossRef CAS PubMed
.
- H. Wang and T. J. Pinnavaia, Angew. Chem., Int. Ed., 2006, 45, 7603–7606 CrossRef CAS PubMed
.
- F. S. Xiao, L. Wang, C. Yin, K. Lin, Y. Di, J. Li, R. Xu, D. S. Su, R. Schlogl, T. Yokoi and T. Tatsumi, Angew. Chem., Int. Ed., 2006, 45, 3090–3093 CrossRef CAS PubMed
.
- F. Liu, T. Willhammar, L. Wang, L. Zhu, Q. Sun, X. Meng, W. Carrillo-Cabrera, X. Zou and F. S. Xiao, J. Am. Chem. Soc., 2012, 134, 4557–4560 CrossRef CAS PubMed
.
- K. Moeller, B. Yilmaz, U. Mueller and T. Beins, Chem. Mater., 2011, 23, 4301–4310 CrossRef
.
- M. Choi, K. Na, J. Kim, Y. Sakamoto, O. Terasaki and R. Ryoo, Nature, 2009, 461, 246–249 CrossRef CAS PubMed
.
- K. Na, W. Park, Y. Seo and R. Ryoo, Chem. Mater., 2011, 23, 1273–1279 CrossRef CAS
.
- K. Na, C. Jo, J. Kim, K. Cho, J. Jung, Y. Seo, R. J. Messinger, B. F. Chmelka and R. Ryoo, Science, 2011, 333, 328–332 CrossRef CAS PubMed
.
- D. Xu, Y. Ma, Z. Jing, L. Han, B. Singh, J. Feng, X. Shen, F. Cao, P. Oleynikov, H. Sun, O. Terasaki and S. Che, Nat. Commun., 2014, 5, 4262–4270 CAS
.
- Y. Seo, S. Lee, C. Jo and R. Ryoo, J. Am. Chem. Soc., 2013, 135, 8806–8809 CrossRef CAS PubMed
.
- L. Wu, V. Degirmenci, P. C. Magusin, B. M. Szyja and E. J. Hensen, Chem. Commun., 2012, 48, 9492–9494 RSC
.
- J. Zhu, Y. Zhu, L. Zhu, M. Rigutto, A. van der Made, C. Yang, S. Pan, L. Wang, L. Zhu, Y. Jin, Q. Sun, Q. Wu, X. Meng, D. Zhang, Y. Han, J. Li, Y. Chu, A. Zheng, S. Qiu, X. Zheng and F. S. Xiao, J. Am. Chem. Soc., 2014, 136, 2503–2510 CrossRef CAS PubMed
.
- C. Jo, Y. Seo, K. Cho, J. Kim, H. S. Shin, M. Lee, J. C. Kim, S. O. Kim, J. Y. Lee, H. Ihee and R. Ryoo, Angew. Chem., Int. Ed., 2014, 53, 5117–5121 CAS
.
- M. Choi, K. Na and R. Ryoo, Chem. Commun., 2009, 2845–2847 RSC
.
- K. Na, M. Choi and R. Ryoo, J. Mater. Chem., 2009, 19, 6713–6719 RSC
.
- Y. Liu, W. P. Zhang, Z. C. Liu, S. T. Xu, Y. D. Wang, Z. K. Xie, X. W. Han and X. H. Bao, J. Phys. Chem. C, 2008, 112, 15375–15381 CAS
.
- C. Mei, P. Wen, Z. Liu, H. Liu, Y. Wang, W. Yang, Z. Xie, W. Hua and Z. Gao, J. Catal., 2008, 258, 243–249 CrossRef CAS PubMed
.
- L. Wang, C. Yin, Z. Shan, S. Liu, Y. Du and F.-S. Xiao, Colloids Surf., A, 2009, 340, 126–130 CrossRef CAS PubMed
.
- H. Tao, C. Li, J. Ren, Y. Wang and G. Lu, J. Solid State Chem., 2011, 184, 1820–1827 CrossRef CAS PubMed
.
- Y. Ma, J. Hu, L. Jia, Z. Li, Q. Kan and S. Wu, Mater. Res. Bull., 2013, 48, 1881–1884 CrossRef CAS PubMed
.
- W. Wang, G. Li, L. Liu and Y. Chen, Microporous Mesoporous Mater., 2013, 179, 165–171 CrossRef CAS PubMed
.
- D. Nandan, S. K. Saxena and N. Viswanadham, J. Mater. Chem. A, 2014, 2, 1054–1059 CAS
.
- K. Moeller, B. Yilmaz, R. M. Jacubinas, U. Mueller and T. Bein, J. Am. Chem. Soc., 2011, 133, 5284–5295 CrossRef PubMed
.
- G. Majano, S. Mintova, O. Ovsitser, B. Mihailova and T. Bein, Microporous Mesoporous Mater., 2005, 80, 227–235 CrossRef CAS PubMed
.
- C. Li, Y. Wang, B. Shi, J. Ren, X. Liu, Y. Wang, Y. Guo, Y. Guo and G. Lu, Microporous Mesoporous Mater., 2009, 117, 104–110 CrossRef CAS PubMed
.
- L. H. Chen, X. Y. Li, G. Tian, Y. Li, J. C. Rooke, G. S. Zhu, S. L. Qiu, X. Y. Yang and B. L. Su, Angew. Chem., Int. Ed., 2011, 50, 11156–11161 CrossRef CAS PubMed
.
- K. Moller, B. Yilmaz, U. Muller and T. Bein, Chem. – Eur. J., 2012, 18, 7671–7674 CrossRef PubMed
.
- X. Zhang, D. Liu, D. Xu, S. Asahina, K. A. Cychosz, K. V. Agrawal, Y. Al Wahedi, A. Bhan, S. Al Hashimi, O. Terasaki, M. Thommes and M. Tsapatsis, Science, 2012, 336, 1684–1687 CrossRef CAS PubMed
.
- W. Chaikittisilp, Y. Suzuki, R. R. Mukti, T. Suzuki, K. Sugita, K. Itabashi, A. Shimojima and T. Okubo, Angew. Chem., Int. Ed., 2013, 52, 3355–3359 CrossRef CAS PubMed
.
- J. Zhu, Y. Cui, Y. Wang and F. Wei, Chem. Commun., 2009, 3282–3284 RSC
.
- A. Inayat, C. Schneider and W. Schwieger, Chem. Commun., 2015, 51, 279–281 RSC
.
- A. Zukal, V. Patzelova and U. Lohse, Zeolites, 1986, 6, 133–136 CrossRef CAS
.
- Y. Sasaki, T. Suzuki, Y. Takamura, A. Saji and H. Saka, J. Catal., 1998, 178, 94–100 CrossRef CAS
.
- S. van Donk, A. H. Janssen, J. H. Bitter and K. P. de Jong, Catal. Rev., 2003, 45, 297–319 CAS
.
- G. Agostini, C. Lamberti, L. Palin, M. Milanesio, N. Danilina, B. Xu, M. Janousch and J. A. van Bokhoven, J. Am. Chem. Soc., 2010, 132, 667–678 CrossRef CAS PubMed
.
- D. M. Roberge, H. Hausmann and W. F. Hölderich, Phys. Chem. Chem. Phys., 2002, 4, 3128–3135 RSC
.
- K. H. Chung, Microporous Mesoporous Mater., 2008, 111, 544–550 CrossRef CAS PubMed
.
- M. Tromp, J. A. van Bokhoven, M. T. Garriga Oostenbrink, J. H. Bitter, K. P. de Jong and D. C. Koningsberger, J. Catal., 2000, 190, 209–214 CrossRef CAS
.
-
D. A. Young, US3326797, 1967
.
- A. Cizmek, B. Subotic, R. Aiello, F. Crea, A. Nastro and C. Tuoto, Microporous Mater., 1995, 4, 159–168 CrossRef CAS
.
- A. Cizmek, B. Subotic, I. Smit, A. Tonejc, R. Aiello, F. Crea and A. Nastro, Microporous Mater., 1997, 8, 159–169 CrossRef
.
- M. Ogura, S. Y. Shinomiya, J. Tateno, Y. Nara, E. Kikuchi and H. Matsukata, Chem. Lett., 2000, 882–883 CrossRef CAS
.
- J. C. Groen, J. C. Jansen, J. A. Moulijn and J. Pérez-Ramírez, J. Phys. Chem. B, 2004, 108, 13062–13065 CrossRef CAS
.
- J. C. Groen, L. A. Peffer, J. A. Moulijn and J. Pérez-Ramírez, Chem. – Eur. J., 2005, 11, 4983–4994 CrossRef CAS PubMed
.
- J. C. Groen, J. A. Moulijn and J. Pérez-Ramírez, J. Mater. Chem., 2006, 16, 2121–2131 RSC
.
- S. Svelle, L. Sommer, K. Barbera, P. N. R. Vennestrøm, U. Olsbye, K. P. Lillerud, S. Bordiga, Y. H. Pan and P. Beato, Catal. Today, 2011, 168, 38–47 CrossRef CAS PubMed
.
- S. Abelló, A. Bonilla and J. Pérez-Ramírez, Appl. Catal., A, 2009, 364, 191–198 CrossRef PubMed
.
- J. Pérez-Ramírez, D. Verboekend, A. Bonilla and S. Abelló, Adv. Funct. Mater., 2009, 19, 3972–3979 CrossRef PubMed
.
- D. Verboekend and J. Pérez-Ramírez, Chem. – Eur. J., 2011, 17, 1137–1147 CrossRef CAS PubMed
.
- D. Verboekend, G. Vilé and J. Pérez-Ramírez, Cryst. Growth Des., 2012, 12, 3123–3132 CAS
.
- X. Li, R. Prins and J. A. van Bokhoven, J. Catal., 2009, 262, 257–265 CrossRef CAS PubMed
.
- A. N. C. van Laak, S. L. Sagala, J. Zečević, H. Friedrich, P. E. de Jongh and K. P. de Jong, J. Catal., 2010, 276, 170–180 CrossRef CAS PubMed
.
- D. Verboekend, T. C. Keller, M. Milina, R. Hauert and J. Pérez-Ramírez, Chem. Mater., 2013, 25, 1947–1959 CrossRef CAS
.
- K. P. de Jong, J. Zecevic, H. Friedrich, P. E. de Jongh, M. Bulut, S. van Donk, R. Kenmogne, A. Finiels, V. Hulea and F. Fajula, Angew. Chem., Int. Ed., 2010, 49, 10074–10078 CrossRef CAS PubMed
.
- J. Pérez-Ramírez, S. Abelló, A. Bonilla and J. C. Groen, Adv. Funct. Mater., 2009, 19, 164–172 CrossRef PubMed
.
- A. N. C. van laak, L. Zhang, A. N. Parvulescu, P. C. A. Bruijnincx, B. M. Weckhuysen, K. P. de Jong and P. E. de Jongh, Catal. Today, 2011, 168, 48–56 CrossRef CAS PubMed
.
- P. Sazama, Z. Sobalik, J. Dedecek, I. Jakubec, V. Parvulescu, Z. Bastl, J. Rathousky and H. Jirglova, Angew. Chem., Int. Ed., 2013, 52, 2038–2041 CrossRef CAS PubMed
.
- V. Valtchev, E. Balanzat, V. Mavrodinova, I. Diaz, J. El Fallah and J. M. Goupil, J. Am. Chem. Soc., 2011, 133, 18950–18956 CrossRef CAS PubMed
.
- I. I. Ivanova, A. S. Kuznetsov, V. V. Yuschenko and E. E. Knyazeva, Pure Appl. Chem., 2004, 76, 1647–1658 CrossRef CAS
.
- S. Wang, T. Dou, Y. Li, Y. Zhang, X. Li and Z. Yan, Catal. Commun., 2005, 6, 87–91 CrossRef CAS PubMed
.
- V. V. Ordomsky, V. Y. Murzin, Yu. V. Monakhova, Y. V. Zubavichus, E. E. Knyazeva, N. S. Nesterenko and I. I. Ivanova, Microporous Mesoporous Mater., 2007, 105, 101–110 CrossRef CAS PubMed
.
- I. I. Ivanova, A. S. Kuznetsov, E. E. Knyazeva, F. Fajula, F. Thibault-Starzyk, C. Fernandez and J. P. Gilson, Catal. Today, 2011, 168, 133–139 CrossRef CAS PubMed
.
- Yu. P. Khitev, Yu. G. Kolyagin, I. I. Ivanova, O. A. Ponomareva, F. Thibault-Starzyk, J. P. Gilson, C. Fernandez and F. Fajula, Microporous Mesoporous Mater., 2011, 146, 201–207 CrossRef CAS PubMed
.
- I. I. Ivanova, I. A. Kasyanov, A. A. Maerle and V. I. Zaikovskii, Microporous Mesoporous Mater., 2014, 189, 163–172 CrossRef CAS PubMed
.
- W. C. Yooa, X. Zhang, M. Tsapatsis and A. Stein, Microporous Mesoporous Mater., 2012, 149, 147–157 CrossRef PubMed
.
- J. Garcia-Martinez, M. Johnson, J. Valla, K. Li and J. Y. Ying, Catal. Sci. Technol., 2012, 2, 987–994 CAS
.
- K. S. W. Sing, D. H. Everett, R. A. W. Haul, L. Moscou, R. A. Pierotti, J. Rouquerol and T. Siemieniewska, Pure Appl. Chem., 1985, 57, 603–619 CrossRef CAS
.
-
S. J. Gregg and K. S. W. Sing, Adsorption, Surface Area and Porosity, Academic Press, London, 2nd edn, 1982 Search PubMed
.
- J. Rouquerol, D. Avnir, C. W. Fairbridge, D. H. Everett, J. H. Haynes, N. Pernicone, J. D. F. Ramsay, K. S. W. Sing and K. K. Unger, Pure Appl. Chem., 1994, 66, 1739–1758 CrossRef CAS
.
- J. C. Groen, S. Brouwer, L. A. A. Peffer and J. Pérez-Ramírez, Part. Part. Syst. Charact., 2006, 23, 101–106 CrossRef CAS PubMed
.
- M. Brun, A. Lallemand, J. F. Quinson and C. Eyraud, Thermochim. Acta, 1977, 21, 59–88 CrossRef CAS
.
- A. H. Janssen, H. Talsma, M. J. van Steenbergen and K. P. de Jong, Langmuir, 2004, 20, 41–45 CrossRef CAS
.
-
J. Kärger and D. M. Ruthven, Diffusion in Zeolites and Other Microporous Solids, John Wiley & Sons, Inc., New York, 1992 Search PubMed
.
- P. Kortunov, S. Vasenkov, J. Kärger, R. Valiullin, P. Gottschalk, M. F. Elía, M. Perez, M. Stöcker, B. Drescher, G. McElhiney, C. Berger, R. Gläser and J. Weitkamp, J. Am. Chem. Soc., 2005, 127, 13055–13059 CrossRef CAS PubMed
.
-
O. D. Lavrentovich, in Characterization of Materials, ed. E. N. Kaufmann, John Wiley & Sons, Inc., 2nd edn, 2012 Search PubMed
.
- M. B. Roeffaers, B. F. Sels, I. H. Uji, F. C. De Schryver, P. A. Jacobs, D. E. De Vos and J. Hofkens, Nature, 2006, 439, 572–575 CrossRef CAS PubMed
.
- M. B. J. Roeffaers, J. Hofkens, G. De Cremer, F. C. De Schryver, P. A. Jacobs, D. E. De Vos and B. F. Sels, Catal. Today, 2007, 126, 44–53 CrossRef CAS PubMed
.
- I. L. Buurmans and B. M. Weckhuysen, Nat. Chem., 2012, 4, 873–886 CrossRef CAS PubMed
.
- L. R. Aramburo, L. Karwacki, P. Cubillas, S. Asahina, D. A. de Winter, M. R. Drury, I. L. Buurmans, E. Stavitski, D. Mores, M. Daturi, P. Bazin, P. Dumas, F. Thibault-Starzyk, J. A. Post, M. W. Anderson, O. Terasaki and B. M. Weckhuysen, Chem. – Eur. J., 2011, 17, 13773–13781 CrossRef CAS PubMed
.
- L. R. Aramburo, J. Ruiz-Martínez, J. P. Hofmann and B. M. Weckhuysen, Catal. Sci. Technol., 2013, 3, 1208–1214 CAS
.
- J. Kärger, T. Binder, C. Chmelik, F. Hibbe, H. Krautscheid, R. Krishna and J. Weitkamp, Nat. Mater., 2014, 13, 333–343 CrossRef PubMed
.
- E. de Smit, I. Swart, J. F. Creemer, G. H. Hoveling, M. K. Gilles, T. Tyliszczak, P. J. Kooyman, H. W. Zandbergen, C. Morin, B. M. Weckhuysen and F. M. de Groot, Nature, 2008, 456, 222–225 CrossRef CAS PubMed
.
- L. R. Aramburo, E. de Smit, B. Arstad, M. M. van Schooneveld, L. Sommer, A. Juhin, T. Yokosawa, H. W. Zandbergen, U. Olsbye, F. M. de Groot and B. M. Weckhuysen, Angew. Chem., Int. Ed., 2012, 51, 3616–3619 CrossRef CAS PubMed
.
- A. Tkachuk, M. Feser, H. Cui, F. Duewer, H. Chang and W. Yun, Progr. Biomed. Opt. Imaging Proc. SPIE., 2006, 6318, 63181D Search PubMed
.
- J. C. da Silva, K. Mader, M. Holler, D. Haberthür, A. Diaz, M. Guizar-Sicairos, W.-C. Cheng, Y. Shu, J. Raabe, A. Menzel and J. A. van Bokhoven, ChemCatChem, 2015, 7, 413–416 CrossRef CAS PubMed
.
- S. R. Bare, M. E. Charochak, S. D. Kelly, B. Lai, J. Wang and Y. K. Chen-Wiegart, ChemCatChem, 2014, 6, 1427–1437 CrossRef CAS PubMed
.
- F. Meirer, D. T. Morris, S. Kalirai, Y. Liu, J. C. Andrews and B. M. Weckhuysen, J. Am. Chem. Soc., 2015, 137, 102–105 CrossRef CAS PubMed
.
- S. Mitchell, N. L. Michels, K. Kunze and J. Pérez-Ramírez, Nat. Chem., 2012, 4, 825–831 CrossRef CAS PubMed
.
- M. Holler, A. Diaz, M. Guizar-Sicairos, P. Karvinen, E. Färm, E. Härkönen, M. Ritala, A. Menzel, J. Raabe and O. Bunk, Sci. Rep., 2014, 4, 3857–3861 CAS
.
- A. Datye, J. Catal., 2003, 216, 144–154 CrossRef CAS
.
- H. Friedrich, P. E. de Jongh, A. J. Verkleij and K. P. de Jong, Chem. Rev., 2009, 109, 1613–1629 CrossRef CAS PubMed
.
- M. Suga, S. Asahina, Y. Sakuda, H. Kazumori, H. Nishiyama, T. Nokuo, V. Alfredsson, T. Kjellman, S. M. Stevens, H. S. Cho, M. Cho, L. Han, S. Che, M. W. Anderson, F. Schüth, H. Deng, O. M. Yaghi, Z. Liu, H. Y. Jeong, A. Stein, K. Sakamoto, R. Ryoo and O. Terasaki, Prog. Solid State Chem., 2014, 42, 1–21 CrossRef CAS PubMed
.
- C. H. Christensen, K. Johannsen, I. Schmidt and C. H. Christensen, J. Am. Chem. Soc., 2003, 125, 13370–13371 CrossRef CAS PubMed
.
- K. Cho, R. Ryoo, S. Asahina, C. Xiao, M. Klingstedt, A. Umemura, M. W. Anderson and O. Terasaki, Solid State Sci., 2011, 13, 750–756 CrossRef CAS PubMed
.
- L. Karwacki, D. A. de Winter, L. R. Aramburo, M. N. Lebbink, J. A. Post, M. R. Drury and B. M. Weckhuysen, Angew. Chem., Int. Ed., 2011, 50, 1294–1298 CrossRef CAS PubMed
.
- E. Stavitski, M. R. Drury, D. A. de Winter, M. H. Kox and B. M. Weckhuysen, Angew. Chem., Int. Ed., 2008, 47, 5637–5640 CrossRef CAS PubMed
.
- J. C. Groen, L. A. A. Peffer, J. A. Moulijn and J. Pérez-Ramírez, Microporous Mesoporous Mater., 2004, 69, 29–34 CrossRef CAS PubMed
.
- M. Milina, S. Mitchell, P. Crivelli, D. Cooke and J. Pérez-Ramírez, Nat. Commun., 2014, 4, 825–831 Search PubMed
.
- F. Nudelman, G. de With and N. A. J. M. Sommerdijk, Soft Matter, 2011, 7, 17–24 RSC
.
-
A. H. Janssen, Three-dimensional Transmission Electron Microscopy of Porous Catalysts, 2003 Search PubMed
.
- J. Zečević, K. P. de Jong and P. E. de Jongh, Curr. Opin. Solid State Mater. Sci., 2013, 17, 115–125 CrossRef PubMed
.
- P. A. Midgley, E. P. W. Ward, A. B. Hungria and J. M. Thomas, Chem. Soc. Rev., 2007, 36, 1477–1494 RSC
.
- R. Leary, P. A. Midgley and J. M. Thomas, Acc. Chem. Res., 2012, 45, 1782–1791 CrossRef CAS PubMed
.
- A. J. Koster, U. Ziese, A. J. Verkleij, A. H. Janssen and K. P. de Jong, J. Phys. Chem. B, 2000, 104, 9368–9370 CrossRef CAS
.
- A. H. Janssen, A. J. Koster and K. P. de Jong, Angew. Chem., Int. Ed., 2001, 40, 1102–1104 CrossRef CAS
.
- C. R. Marcilly, Pet. Technol., 1986, 328, 12–18 CAS
.
- A. H. Janssen, A. J. Koster and K. P. de Jong, J. Phys. Chem. B, 2002, 106, 11905–11909 CrossRef CAS
.
- J. C. Groen, T. Bach, U. Ziese, A. Donk, K. P. de Jong, J. A. Moulijn and J. Pérez-Ramírez, J. Am. Chem. Soc., 2005, 127, 10792–10793 CrossRef CAS PubMed
.
- J. Garcia-Martinez, C. Xiao, K. A. Cychosz, K. Li, W. Wan, X. Zou and M. Thommes, ChemCatChem, 2014, 6, 3110–3115 CrossRef CAS PubMed
.
- K. P. de Jong, A. J. Koster, A. H. Janssen and U. Ziese, Stud. Surf. Sci. Catal., 2005, 157, 225–242 CAS
.
- J. Zečević, C. J. Gommes, H. Friedrich, P. E. de Jongh and K. P. de Jong, Angew. Chem., Int. Ed., 2012, 51, 4213–4217 CrossRef PubMed
.
- B. Speronello, J. Garcia-Martinez, A. Hansen and R. Hu, Refin. Oper., 2011, 2, 1–6 Search PubMed
.
- G. Krishnaiah, B. Speronello, A. Hansen, J. Crosby, American Fuels and Petrochemical Maufacturers Annual Meeting, San Antonio, 2013.
- M. Milina, S. Mitchell, D. Cooke, P. Crivelli and J. Pérez-Ramírez, Angew. Chem., Int. Ed., 2015, 54, 1591–1594 CrossRef CAS PubMed
.
| This journal is © The Royal Society of Chemistry 2015 |


