
 Open Access Article
 This Open Access Article is licensed under a Creative Commons Attribution-Non Commercial 3.0 Unported Licence
Optimizing TDP-43 silencing with siRNA-loaded polymeric nanovectors in neuronal cells for therapeutic applications: balancing knockdown and function†
Annamaria
Russo
a,
Gabriele
Maiorano
a,
Barbara
Cortese
 b,
Stefania
D'Amone
a,
Alessandra
Invidia
c,
Angelo
Quattrini
d,
Alessandro
Romano
*de,
Giuseppe
Gigli
af and
Ilaria E.
Palamà
*a
b,
Stefania
D'Amone
a,
Alessandra
Invidia
c,
Angelo
Quattrini
d,
Alessandro
Romano
*de,
Giuseppe
Gigli
af and
Ilaria E.
Palamà
*a
aNanotechnology Institute, CNR-NANOTEC, Monteroni street, 73100 Lecce, Italy. E-mail: ilaria.palama@nanotec.cnr.it
bNanotechnology Institute, CNR-NANOTEC, c/o La Sapienza University, P. le A. Moro, 00185 Rome, Italy
cDepartment of Mathematics and Physics, University of Salento, Monteroni Street, 73100 Lecce, Italy
dIRCCS San Raffaele Scientific Institute, Neuropathology Unit, Division of Neuroscience, Institute of Experimental Neurology, Milan, 20132 Italy. E-mail: romano.alessandro@hsr.it
eDepartment of Life Sciences, Health and Health Professions, Link Campus University, del Casale di San Pio V street, 44, I-00165 Rome, Italy
fDepartment of Experimental Medicine, University of Salento, c/o Campus Ecotekne, Monteroni street, 73100 Lecce, Italy
First published on 4th November 2024
Abstract
TAR DNA-binding protein 43 (TDP-43) is a ubiquitously expressed DNA/RNA binding protein critical for regulating gene expression, including transcription, splicing, mRNA stability, and protein translation. Aggregation of pathological TDP-43 proteins in the cytoplasm of neurons and glial cells appears to be a common feature of amyotrophic lateral sclerosis (ALS) and other neurodegenerative diseases such as frontotemporal dementia (FTD), contributing to motor neuron degeneration and clinical symptoms. Downregulation of TDP-43 expression to prevent or reduce the formation of pathological aggregates is a potential therapeutic approach for treating TDP-43-related diseases. However, therapeutic strategies to reduce TDP-43 aggregation face significant challenges, as the downregulation of TDP-43 must balance the need to maintain its normal functions, which are essential for RNA metabolism and cellular homeostasis. In this study, we developed novel polymeric nanovectors for the delivery of TDP-43 siRNAs in neuronal cells. These nanovectors were designed to provide adequate TDP-43 silencing to achieve the desired functional reduction of TDP-43 levels, thereby optimizing its impact on cellular functions. Our results demonstrate that the polymeric nanovector formulations effectively reduced TDP-43 mRNA and protein levels to an extent comparable to those observed with traditional lipid-based systems. Concurrently, the polymeric nanovectors exhibited an enhanced capacity to reduce stress granules (SG) formation and facilitate TDP-43-containing SG disassembly, while preserving its essential cellular functions. This study provides the first evidence that polymeric nanovectors may be a valuable tool for developing therapeutic strategies to treat TDP-43 protein diseases, such as ALS and FTD, by directly silencing TDP-43 to reduce its aggregation.
A. Introduction
Amyotrophic lateral sclerosis (ALS) is a neurodegenerative disease caused by the rapidly progressive degeneration and death of the lower and upper motor neurons (MNs),1 resulting in severe muscle wasting and respiratory distress.2 The molecular pathways underlying the pathogenesis of ALS are not fully understood, and multiple pathogenic mechanisms appear to be involved.3Although many factors contribute to the disease, the accumulation of TDP-43 aggregates in the brain is a common feature in 97% of familial and sporadic ALS patients.4–6 Moreover, other neurodegenerative diseases, such as frontotemporal dementia (FTD), also show abnormal TDP-43 aggregates. TDP-43 is a ubiquitously expressed DNA/RNA binding protein that regulates gene expression at multiple levels, including transcription, splicing, mRNA stability, DNA replication/repair, protein translation, and RNA export or retention. Under basal physiological conditions, TDP-43 is predominantly nuclear.7–11 In response to cellular stress, such as oxidative stress, TDP-43 translocates to the cytoplasm and co-localizes with stress granules (SGs),12–15 protein/RNA complexes that aggregate/assemble to protect the cells from insults.6 Chronic stress or pathological TDP-43 mutations have been associated with the formation/accumulation of permanent SG-like TDP-43 aggregates in ALS.5,7 Strategies to prevent or mitigate the formation of these aggregates by reducing TDP-43 expression offer an intriguing potential therapeutic option for TDP-43-related diseases. Nevertheless, this approach has been considered unsuitable due to the challenge of decreasing TDP-43 expression without compromising its physiological/vital functions.
RNA interference (RNAi) is a biological mechanism by which RNA molecules can inhibit the expression or translation of specific genes. This mechanism is used in the development of RNAi-based therapies using small interfering RNA (siRNA), microRNA (miRNA), or inhibitory antisense oligonucleotide (ASO) molecules to selectively degrade mRNA transcripts and downregulate/silence pathological/toxic proteins. Recent efforts have led to the first RNAi-based drugs approved for clinical use, while others are currently in preclinical trials or under investigation.16,17
Despite the potential of RNAi-based gene therapy, degradation, stability, bioavailability, and delivery across membranes still limit RNAi drug development18–20 and hinder the clinical translation of RNAi therapeutics.17,21 Viral vectors are highly efficient systems for delivering siRNA into cells, but their use has some limitations, including activation of the immune system, with significant side effects.22–24
Several efforts have been made to improve the delivery of RNAi-based therapeutics through a non-viral and clinical translatable approach using lipid- and polymer-based nanocarriers.25 Compared to viral vectors, these nanocarriers offer several advantages, including reduced off-target effects, improved extracellular stability, lower immunogenicity, and simpler preparation for rapid clinical translation.32
Lipid-based nanocarriers are the most widely used RNAi delivery systems, but their use is mainly limited to in vitro studies due to concerns about toxicity.26,27 For example, cationic lipids like N-[1-(2,3-dioleoyloxy)]-N-N-N tri-methyl ammonium propane (DOTAP), which have long been employed for DNA transfection, have also been adapted for siRNA delivery. However, a high concentration of these lipids can disrupt membrane integrity leading to cell lysis and necrotic death. Additionally, lipid-based nanocarriers could be highly immunogenic, triggering innate immune responses via Pattern Recognition Receptors (PRRs).33 Preclinical findings using lipoplexes as siRNA nanocarriers have demonstrated in vivo toxicity, including high mortality rates in animals following systemic administration of cationic lipid nanocarriers.34
In contrast, polymer-based delivery vectors for RNAi therapeutics present a promising alternative, particularly given the growing concern over the toxicity of lipid-based systems.28–31 Synthetic polymers such as polyethylenimine (PEI) have shown considerable potential in siRNA delivery due to their ability to form stable complexes with nucleic acids and promote endosomal escape via the proton-sponge effect. In particular, PEI has been considered the gold standard for nucleic acid delivery due to its good cell membrane interaction, high cellular uptake, and efficient endosomal escape. However, free (uncomplexed) PEI is known to cause significant toxicity, both in vitro and in vivo which has limited its broader application.35 To address these concerns, recent approaches have focused on natural polymers such as poly-L-lysine, chitosan, and dextran, which have been shown to have reduced cytotoxicity and low in vivo immunogenicity.
In this study, we developed novel polymeric nanovectors (NVs) for siRNA delivery using naturally occurring, biocompatible, and biodegradable polymers, chitosan (CH), protamine (PRM), and dextran (DXS). Chitosan, a cationic polysaccharide derived from the partial deacetylation of chitin, has demonstrated high cytocompatibility and biodegradability, making it a valuable material for tissue engineering and drug and gene delivery platforms.36 Several studies have also reported the efficacy of chitosan-based nanocarriers for siRNA delivery both in vitro and in vivo. Protamine, a natural polycationic peptide rich in arginine, is widely used in DNA complexation and has been shown to improve cell penetration due to its low molecular weight and positive charge.37,38 Finally, dextran, a bacterial polysaccharide with excellent biocompatibility, biodegradability, and non-immunogenic properties, enhances nanocarrier stability and promotes renal excretion, thereby reducing drug-related side effects.39
By exploiting the unique properties of CH, PRM, and DXS, we designed siRNA-loaded NVs using a quality-by-design approach. These NVs feature an inner core of siRNA-CH polyplexes coated with PRM and DXS to enhance stability, degradation, and cell uptake.
We demonstrated that the novel polymeric NVs loaded with TDP-43 siRNAs have similar efficacy in silencing TDP-43 expression levels (mRNA and protein) to classical lipid cation delivery systems but have improved ability to reduce SGs and accelerate the disassembly of TDP-43-containing SGs. Our results provide the first evidence that polymeric NVs can be used as a novel, simple, and potentially clinically translatable tool to optimize therapeutic strategies aimed at reducing TDP-43 for the treatment of TDP-43 proteinopathies, including ALS and FTD.
B. Materials and methods
Chemicals and reagents
Cell culture media, supplements and chemicals were purchased from Sigma-Aldrich; siRNA sequences were obtained from Eurofins Genomic; primary and secondary antibodies were obtained from Proteintech, Abcam, Sigma Aldrich and Cell signaling; Clarity Western ECL Substrate, Blotting Grade Blocker from Bio-rad; Low Range ssRNA Ladder was bought from New England BioLabs; Lipofectamine 3000 Reagent was purchased from Invitrogen (Germany); Revert Aid RT kit from Thermo Scientific; PowerUp SYBR Green Master Mix from Applied biosystems; Annexin/PI from Abcam; GenElute Total RNA Purification Kit from Sigma Aldrich.siRNA-loaded NV preparations
All siRNA duplexes were chemically synthesized by Eurofins Genomics and the sequences are as follows:siRNATDP-43 A, 5′-AAGCAAAGCCAAGAUGAGCCU-3′
siRNATDP-43 F, 5′-CACUACAAUUGAUAUCAAA-3′
scrambled siRNA NT (non-targeting siRNA), 5′-UUCUCCGAACGUGUCACGU-3′
siRNAs were suspended in nuclease-free, sterile water. Medium molecular weight chitosan (CH) (75–85% deacetylated) was dissolved overnight in 0.5% w/v HCl, 0.1 M NaCl at a final concentration of 5 mg mL−1. Protamine sulphate (PRM) was dispersed in 0.1 M of NaCl overnight to obtain an aqueous solution containing protamine at 5 mg mL−1. Dextran sulphate sodium salt (DXS, Mr ∼40![[thin space (1/6-em)]](https://www.rsc.org/images/entities/char_2009.gif) 000) was suspended in 0.1 M NaCl at a concentration of 1 mg mL−1. Before use, solutions were filtered through a 0.22 μm membrane filter. Complexes were formulated by incubating siRNAs at a final concentration of 1 μM with 40 μl of chitosan solution under vigorous stirring. After 5 minutes, PRM and DXS were added to a final concentration of 1 mg mL−1 and 0.025 mg mL−1 respectively. Solutions were kept under vigorous stirring for 60 minutes in a microtube shaker, at 25 °C. The final volume was adjusted with ultrapure water to obtain a concentration of siRNAs of 0.1 μM. For the formulation of fluorescent-labeled NVs, TRITC-labeled protamine sulphate was employed.
000) was suspended in 0.1 M NaCl at a concentration of 1 mg mL−1. Before use, solutions were filtered through a 0.22 μm membrane filter. Complexes were formulated by incubating siRNAs at a final concentration of 1 μM with 40 μl of chitosan solution under vigorous stirring. After 5 minutes, PRM and DXS were added to a final concentration of 1 mg mL−1 and 0.025 mg mL−1 respectively. Solutions were kept under vigorous stirring for 60 minutes in a microtube shaker, at 25 °C. The final volume was adjusted with ultrapure water to obtain a concentration of siRNAs of 0.1 μM. For the formulation of fluorescent-labeled NVs, TRITC-labeled protamine sulphate was employed.
Size, zeta and morphological characterization
Dynamic light scattering (DLS) measurements (Zetasizer Nano-ZS90, Malvern Instruments) were performed to investigate the mean hydrodynamic diameter and zeta potential (ζ) values of the formulated NVs. These analyses were performed also during the assembly process of the NVs.A drop of NVs was placed on SiO2 wafers and dried overnight for morphological analysis. Analysis was performed using a SEM Sigma 300VP, Zeiss, Germany.
Analysis of siRNA encapsulation and release from NVs
All formulations of siRNA loaded NVs (final concentration of siRNA 0.1 μM) were ultracentrifuged at 25000g for 30 minutes at 4 °C using an Optima MAX-XP (Beckman Coulter), and the amount of free siRNA in the supernatants was quantified using a Nanodrop ND-ONEC-W (ThermoFisher) to estimate the loading efficiency. The release of siRNA from NVs was evaluated by incubating nanoformulations with PBS pH 4.5, representing the lysosomal pH. Samples were maintained at 37 °C, under stirring and at different time points, aliquots were centrifuged at 25000g for 30 minutes at 4 °C. Supernatants were employed to assess their specific absorbance values to measure the release of siRNA from NVs.
Agarose gel retardation assay
The loading of siRNAs into NVs was analyzed using the agarose gel retardation assay. Briefly, siRNA-loaded NVs were loaded to a 2% agarose gel electrophoresis in TAE 1× (Tris/Acetate/EDTA) buffer with 2 μL of ethidium bromide at 90 V for 45 minutes. Bands were visualized using a UV transilluminator (Chemidoc, Bio-Rad). A low-range ssRNA Ladder (New England, BioLabs) was used to confirm siRNA integrity.Serum protection assay
The ability of NVs to protect siRNA against degradation by serum components was analyzed incubating for different timeframe windows (15-, 30-, 90- and 120-minutes) siRNA loaded NVs with 10% fetal bovine serum (FBS) with constant stirring (600 rpm) at 37 °C. At the end of the incubation periods the reaction was stopped with SDS 1%. The protection of siRNA by NVs was analyzed by electrophoresis on 2% agarose gel in TAE 1× for 1 hour at 60 V. Free siRNA sequences were used as a positive control. Bands were visualized with ethidium bromide staining under a UV transilluminator (Chemidoc, Bio-Rad).Cell culture
Human neuroblastoma SH-SY5Y cells were maintained in DMEM medium supplemented with 10% heat-inactivated FBS, 100 units per mL penicillin, and 100 μg mL−1 streptomycin. Cultures were seeded into flasks containing supplemented medium and maintained at 37 °C in a humidified atmosphere of 5% CO2.NV cellular uptake and biocompatibility
:500, Sigma-Aldrich) and mounted with DAPI Fluoroshield and analyzed by confocal laser scanning microscopy (CLSM, LSM 700, Zeiss, Germany), equipped with a 40× oil immersion objective. Quantitative analysis of NV cellular uptake was performed using the same set of experiments employed for the qualitative investigation described above, using a flow cytometer (CytoFLEX S, Beckam-Coulter) counting 10000 ungated events.

The control sample is referred to as the SH-SY5Y cells in normal conditioning media, without any treatment.
000 ungated cells with a CytoFLEX S, Beckman-Coulter. siRNA molecules delivered with lipofectamine 3000 were used as the positive control.
000 ungated events with CytoFLEX S (Beckman-Coulter) using ROS, NO, and SOD detection kits according to the manufacturer's instructions (Abcam). All experiments were performed in triplicate.
TDP-43 silencing
Neuroblastoma SH-SY5Y cells were seeded on 24-well culture plates (105 cells per well) and treated with different siRNA-loaded NV formulations for 24-, 48-, and 72 hours. Lipofectamine 3000 reagent was used as a positive control.RNA isolation and cDNA synthesis
Neuroblastoma SH-SY5Y cells were seeded on a 24-well plate (105 cells per well). At 80% confluency, cells were transfected with siRNA molecules (50 nM) delivered with Lipofectamine 3000 or NVs at 24-, 48-, and 72 hours. Cell lysis protocol with RIPA buffer was performed. RNA extraction was achieved with the Gene Elute Total RNA Purification kit and purified using the RNeasy MiniElute Cleanup Kit according to the manufacturer's protocol (Sigma-Aldrich). The final RNA concentration and purity were determined using a Nanodrop ND-ONEC-W (ThermoFisher Scientific), obtaining A260/A280 ratios between 1.9 and 2.1 in all the samples. First-strand complementary DNA (cDNA) was synthesized from 500 ng of total RNA by reverse transcription using RevertAid Reverse Transcriptase (Thermo Scientific) according to the manufacturer's protocol, starting with a gDNA elimination step. At the end, cDNA was diluted 1:10 in nuclease-free water and stored at −80 °C for further analysis.
Quantitative Real-Time PCR
Quantitative Real-Time PCR for hTARDBP was performed to analyze mRNA relative gene expression. Reactions were run on a Real-Time PCR system, BioRad CFX96, using Power Up SYBR Green Master Mix (Applied Biosystems) according to the manufacturer's protocol (Table 1). The concentration of each primer was 300 nM and the thermal protocol was as follows: UDG activation at 50 °C for 2 minutes, 95 °C for 2 minutes, followed by 40 cycles composed of 15 seconds at 95 °C and 1 minute at 60 °C. The relative mRNA levels were calculated by the ΔΔCt method and GAPDH served as an internal control. All the primers were chemically synthesized by Eurofins Genomics. The sequences of primers were as follows:| Gene | Primer sequence | Product length (bp) |
|---|---|---|
| GAPDH | Forward: 5′-CTCCTCCTGTTCGACAGTCA-3′ | 105 |
| Reverse: 5′-CGACCAATCCGTTGACTCC-3′ | ||
| hTARDBP | Forward: 5′-ATGGTGCAGGTCAAGAAAG-3′ | 140 |
| Reverse: 5′-GGAAGTTTGCAGTCACACC-3 |
Western blotting analysis
Neuroblastoma SH-SY5Y cells were seeded on a 24-well plate and treated as previously described with siRNA-loaded NVs or Lipofectamine 3000. Cells were washed with PBS 1× before protein extraction in RIPA buffer supplemented with a protease inhibitor cocktail for 30 minutes on ice. Subsequently, the cell suspension was centrifuged at 4 °C for 30 minutes, and the supernatant lysate was quantified using the Bradford assay (Sigma Aldrich) according to the manufacturer's instructions. Lysates were denatured in sample buffer Laemmli 2× at 95 °C for 5 minutes. Then, all samples were subjected to SDS-PAGE, followed by immunoblotting. Electrophoresed proteins were transferred to 0.45 μm pore PVDF membranes (GE Healthcare Life Sciences) via wet transfer in 1× Tris/glycine buffer with 20% methanol. Membranes were blocked with 5% milk-blocking grade (Bio-Rad) and 0.1% Tween-20 (Sigma-Aldrich) in PBS 1× for 1 hour at RT. Then, blot membranes were incubated with primary antibodies (C-term TDP-43, 1:1000 dilution, Proteintech; GAPDH, 2 μg mL−1, Thermo Fisher Scientific) overnight at 4 °C. Immunoreactive bands were detected with secondary antibodies conjugated to horseradish-peroxidase, HRP (1:2000, goat anti-rabbit IgG-HRP, Abcam, 1:2000 horse anti-mouse IgG-HRP, Cell signaling). Membranes were visualized using Clarity Western ECL Substrate (Bio-rad).
Stress granules immunofluorescence and analysis
For stress granules (SA) analysis, neuroblastoma SHSY-5Y cells were incubated with different siRNA-loaded NVs or lipofectamine 3000 for 48 hours. Sodium Arsenite (SA), at a concentration of 500 μM, was added to the medium and incubated for 45 minutes. Untreated cells (CTR) were used as the negative control. Stress-stimulated cells or subjected to recovery in the complete medium by removing the stressor for 30 and 75 minutes were fixed and stained.Cells were grown on ∅12 mm glass coverslips and fixed with 4% paraformaldehyde in PBS for 15 minutes, followed by washes with PBS 1× and permeabilization in cold methanol for 5 minutes. After blocking in 5% bovine serum albumin (BSA) in 0.1% Triton X-100 for 1 hour at RT, coverslips were incubated with primary rabbit anti-C term TDP-43 antibody diluted 1:200 in blocking solution at 4 °C overnight. Primary antibodies were detected using fluorochrome-conjugated antibodies (anti-rabbit TRITC, 1:1000 dilution in blocking solution) that were added for 1 hour at RT in the dark. Coverslips were mounted with Fluoroshield with DAPI (Sigma Aldrich). Fluorescent and phase contrast images were acquired using a fluorescence microscope (Leica STP6000) with a 40× oil immersion objective. Images were analyzed using Image J software (https://imagej.nih.gov/ij/index.html). For SG quantification, a total number of 100 cells for samples were counted in 20 random fields. SGs inside the cells were counted, and mean ratio values were used in statistics.
Statistical analysis
Data are represented as mean values ± standard error of the mean (SEM). Comparisons between experimental and control groups were performed by one-way ANOVA followed by Tukey's comparison test, using GraphPad Prism software. Statistical difference was accepted when P < 0.05.C. Results and discussion
Aberrant TDP-43 cytoplasmic aggregates are the pathological hallmark of ALS and other neurodegenerative proteinopathies, including frontotemporal degeneration (FTD). Prevention or reduction of TDP-43 aggregates by decreasing TDP-43 expression are potential therapeutic strategies for treating TDP-43 proteinopathies. Despite the potentiality of this strategy, drawbacks lie in the need for the TDP-43 to be balanced against maintaining its normal functions, which are essential for cellular homeostasis and RNA metabolism. A smart possible strategy to overcome this problem is the development of siRNA delivery NVs that can provide controlled and defined silencing efficiencies to achieve the desired functional reduction of TDP-43 levels. In particular, two different nanoformulations were developed using siRNA A and F targeting two distinct regions of TDP-43 (Fig. 1). In addition, a scrambled NT (non-targeting) siRNA was used as a negative control. | ||
| Fig. 1 Schematic representation of nanovectors (NVs) designed to deliver siRNA targeting TDP-43 mRNA. (A) Illustration of the NV structure for siRNA delivery, with siRNA (red/blue) encapsulated in a matrix of chitosan (CH, blue), protamine (PRM, pink), and dextran (DXS, yellow). (B) Table showing the sequences of the two specific siRNAs targeting TDP-43 mRNA used in this study. (C) Schematic of the TARDBP mRNA, which encodes the TDP-43 protein, organized into six exons. The blue regions represent the coding sequences, while the yellow regions indicate the untranslated regions (UTRs). siRNA A targets the junction between exons 4 and 5, while siRNA F targets the UTR within exon 6. | ||
NV synthesis and characterization
Quality-by-design has driven the development of polymeric NVs in which enzyme- (PRM) and pH- (PRM and CH) responsive components34,38 represent a promising strategy to improve siRNA loading, stability, and delivery ability. Synthesis of NVs and the process parameters were optimized to produce siRNA-loaded NVs with prime monodispersion and nanometer-scale dimensions.The physicochemical properties of NVs, particularly the hydrodynamic size and ζ-potential are renowned parameters for the stability and cellular uptake of NPs. DLS and SEM were used to characterize siRNA-loaded NVs for hydrodynamic particle size, PDI, surface zeta potential (ζ, mV) and morphology. DLS analyses revealed monodispersed siRNA-loaded NVs with hydrodynamic sizes of 413 ± 50.2 nm, 404 ± 63 nm and 427 ± 74 nm for siRNA A-, siRNA F- and siRNA NT-loaded NVs respectively (Fig. 2A). All the nanoformulations exhibited a polydispersity index (PDI) ≤ 0.15, indicating a good dispersion. The monodisperse nature of these NVs was also confirmed through SEM imaging. In particular, nanometric NVs with a round-oval morphology were reported (Fig. 2B–D).
 | ||
| Fig. 2 (A) DLS analysis of differently siRNA loaded NVs. (B–D) Representative SEM images of siRNA A-, siRNA F-, and siRNA NT loaded NVs, respectively. Scale bars: 1 μm. (E) Agarose retardation assay of siRNA loaded NVs. Lanes 1–3: free siRNA (NT, A and F). Lanes 4–6: siRNA (NT, A and F) loaded NVs. (F) FBS protection assay of siRNA loaded NVs. Lanes 1–3: free siRNA (NT, A and F) and Lanes 4–6: siRNA loaded NVs (NT, A and F) after incubation with FBS 10% for 120 minutes. Lanes 7–9: free siRNA (NT, A and F) and Lanes 10–12: siRNA loaded NVs (NT, A and F) after incubation with FBS 10% for 90 minutes. (G) FBS protection assay of siRNA loaded NVs. Lanes 1–3: free siRNA (NT, A and F) and Lanes 4–6: siRNA loaded NVs (NT, A and F) after incubation with FBS 10% for 30 minutes. Lanes 7–9: free siRNA (NT, A and F) and Lanes 10–12: siRNA loaded NVs (NT, A and F) after incubation with FBS 10% for 15 minutes. Lane M: Low Range ssRNA Ladder. | ||
Positive surface charges promote the uptake of NVs via electrostatic interactions with the cell membranes, allowing the adsorptive transcytosis pathway more effectively than neutral or negatively charged nanoformulations.40,41 In the NV synthesis reported here, siRNA molecules formed complexes with chitosan (CH) through electrostatic interactions. These initial chitosan–RNA complexes exhibited slightly negative surface charges (ESI Fig. S1†), indicating that the chitosan used was insufficient to neutralize the negative charges on the siRNAs. Consequently, PRM strongly interacted with these complexes in the following step, resulting in NVs with positive zeta potential values. After the addition of DXS, only a slight decrease in zeta potential was observed, suggesting that the small amount of DXS promoted the formation of nano-assemblies without significantly altering the cationic nature of the NVs (ESI Fig. S1†). The final surface charge values of the NVs were +36.2 ± 2.5 mV for siRNA A-loaded NVs, +38.0 ± 3.25 mV for siRNA F-loaded NVs, and +37.7 ± 2.89 mV for siRNA NT-loaded NVs.
To evaluate the effective loading of siRNA molecules into NVs, an agarose retardation assay was performed. In the assay, free/unencapsulated siRNA binds the positive ethidium bromide dye and migrates during agarose gel electrophoresis. The encapsulated siRNA, on the other hand, remains complex with chitosan in the NV core, making it inaccessible to ethidium bromide and unable to migrate. The migration of siRNA molecules was entirely stopped when loaded inside the NVs (Fig. 2E), confirming that all siRNA molecules were encapsulated because NVs completely shield the RNA sequences, making them inaccessible to the ethidium bromide intercalation. In contrast, free siRNA sequences, used as a control, were observed to migrate along the gel. Encapsulation efficiencies, evaluated by centrifugation and absorbance measurements, were calculated as 95.21% ± 1.058, 93.24% ± 0.5053 and 92.38% ± 1.849 for NVs loaded with siRNA NT, A and F respectively (ESI Fig. S2A†). The ability of these NVs to properly protect and encapsulate siRNA was demonstrated by evaluating the release of siRNAs from the formulated NVs at pH 4.5. As reported (ESI Fig. S2B†), the acidic pH led to the protonation of cationic building blocks, which caused the release of the siRNAs from their nanostructures.
As the rapid degradation mediated by RNase hampers siRNA delivery,42 we explored the ability of NVs to protect siRNA from degradation using FBS protection assays at different time points. Fig. 2F and G show the ability of NVs to protect siRNAs from the action of nucleases present in FBS for 15, 30, 90 and 120 minutes. In the first period (15–30 minutes), no bands related to siRNA degradation were visible, while a small band corresponding to free siRNA sequences appeared evident at 90 and 120 minutes. On the other hand, a time-dependent degradation of free siRNA molecules was observed starting from 15 minutes of incubation with FBS. Collectively, these results confirmed that the NVs can protect siRNAs from degradation by serum nucleases, which is crucial for ensuring that active siRNAs survive passage through the circulation.
Uptake and biocompatibility of NVs
The effective cellular uptake of NVs was determined by imaging the intracellular localization of fluorescent NVs with a CLSM along the z-axis. As shown in Fig. 3A, NVs appeared as nanosized diamonds within the cell cytoplasm confirming cellular internalization of the NVs. Moreover, the uptake of NVs was quantified by cytofluorimetric analysis (Fig. 3B) which showed that 60% of the cells were fluorescent after 24 hours. Overall, these data confirmed the cellular uptake of NVs in neuroblastoma cells. | ||
| Fig. 3 (A) Qualitative assessment of NV uptake in neuroblastoma SH-SY5Y cells. Cells were stained with TRITC-labeled NVs (red), FITC-tubulin (green) and DAPI for nuclei (blue). Scale bar: 20 μm. (B) Quantification of NV uptake by flow cytometry. The red line represents untreated control cells (CTR), and green line represents NV-treated cells. (C and D) MTT assay results showing SH-SY5Y cell viability after 24, 48, and 72 hours of incubation with (C) siRNA-loaded NVs or (D) siRNA delivered by Lipofectamine 3000 (Dunnett's multiple comparisons test, *p < 0.05 vs. untreated CTR 24 hours). All the MTT data were normalized to control cells at 24 hours. | ||
The biocompatibility of NVs loaded with different siRNA sequences was investigated. The effect of NVs on the viability of SHSY-5Y cells was compared with Lipofectamine 3000 (a gold standard formulation for siRNA delivery). The results showed that the cell viability was not statistically affected by NVs, indicating a favorable biocompatible NV profile (Fig. 3C and D). This profile was observed up to 72 hours post-treatment. However, after 72 hours, Lipofectamine 3000 siRNA formulations showed decreased cell viability compared to the control group. Biocompatibility of NVs was further confirmed by performing Live/Dead assay and cell cycle analysis at 48 hours post-treatment (ESI Fig. S3A and B†).
Finally, NO, ROS production and SOD activity, which are associated with cell death, were also evaluated after 48 hours of treatment with the different siRNA-loaded formulations. Results showed no significant increase in NO and ROS production (ESI Fig. S4A and B†) or inhibition of SOD activity (ESI Fig. S4C†) in cells treated with any formulation.
Overall, these results suggested that NVs loaded with different siRNA sequences can be an effective and biocompatible alternative for siRNA delivery.
Modulation of TDP-43 expression and function with siRNA NVs
The two siRNA A/F-loaded NVs were evaluated for their efficacy in modulating/downregulating the expression of TDP-43 in SHSY-5Y neuroblastoma cells. The changes in the cellular TDP-43 mRNA and protein levels were assessed after 24, 48 and 72 hours of treatment with the two different NV formulations. Lipofectamine 3000 was used as a gold standard system for siRNA A/F delivery in all experiments. As shown in Fig. 4, NV formulations loaded with siRNA A and siRNA F significantly reduced the TDP-43 mRNA levels at 24 and 48 hours of treatment compared to NVs loaded with scrambled (non-targeting TDP-43) siRNA NT as analyzed by quantitative real-time PCR (Fig. 4A and B). On the other hand, the downregulation of TDP-43 by siRNA A- and siRNA F-loaded NVs disappeared after 72 hours of treatment (Fig. 4C). A similar time course of TDP-43 mRNA downregulation was observed when siRNA molecules were delivered using Lipofectamine 3000 (Fig. 4). Interestingly, control cells treated with lipofectamine loaded with scrambled (non-targeted) siRNA showed a higher level of non-specific knockdown of TDP-43 compared to cells treated with NVs loaded with the same scrambled siRNA. It is well-known that different transfection methods can induce various levels of cell stress that can affect gene expression independently of the siRNA target.42,43 This observation suggests that NVs may induce less non-specific responses/effects on global cellular transcription upon transfection than the lipofectamine-based transfection system.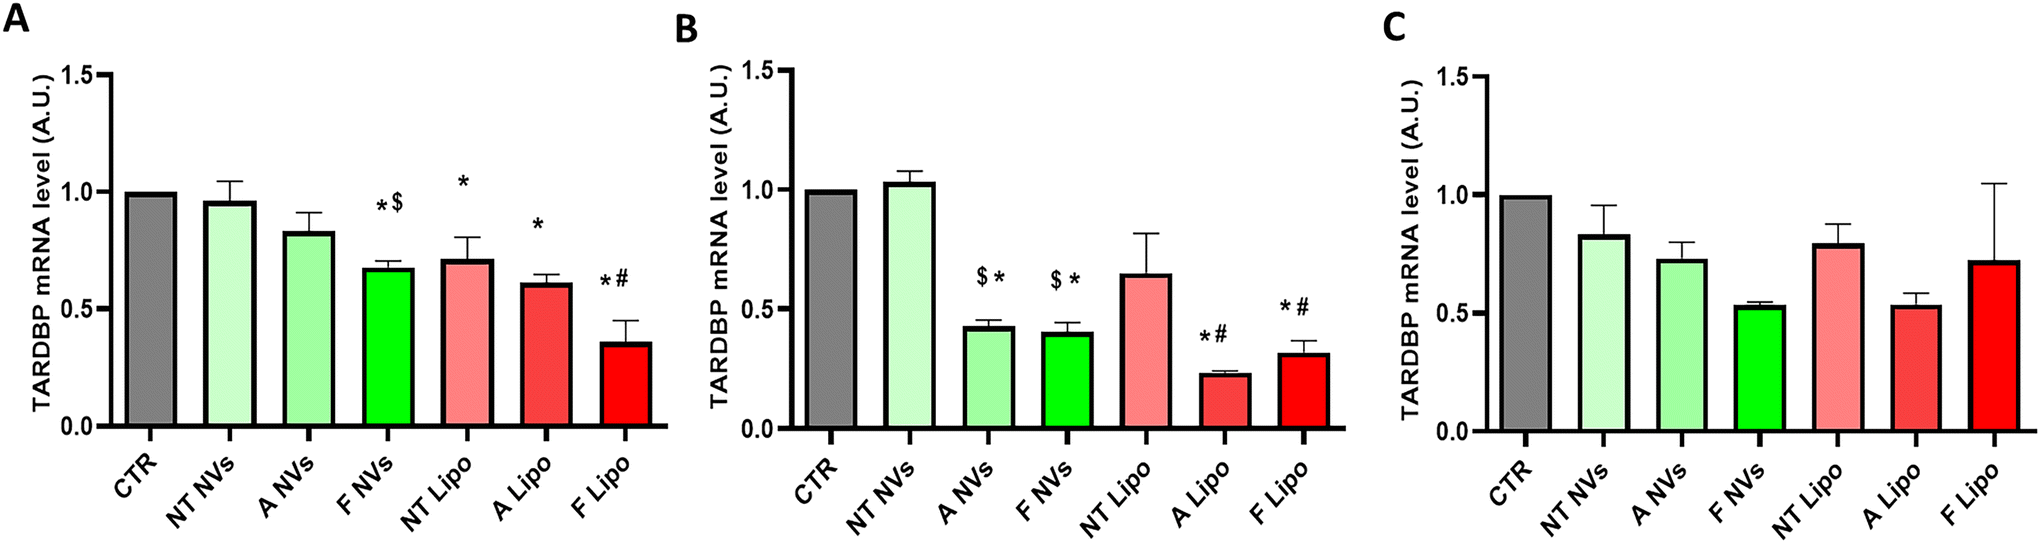 | ||
| Fig. 4 qPCR analysis of human TARDBP mRNA levels in neuroblastoma cells after treatment with siRNA-loaded NVs or lipofectamine for 24 (A), 48 (B) and 72 hours (C). GAPDH mRNA was used as an internal control. Data are shown as mean ± SEMs and analyzed by one-way ANOVA followed by Tukey's Multiple Comparison test *p < 0.05 versus CTR (untreated); # p < 0.05 versus NT Lipo; $ p < 0.05 versus NT NPs. | ||
The modulation/downregulation of TDP-43 expression by the siRNA A- and siRNA F-loaded NV formulations was confirmed at the protein level through western blotting analysis (Fig. 5A). The data collected showed that siRNA-loaded NVs slightly reduced TDP-43 expression within the first 24 hours of treatment (Fig. 5B). TDP-43 protein expression significantly decreased after 48 hours of treatment (Fig. 5C). However, it returned to basal levels after 72 hours of treatment (Fig. 5D). Similar downregulation of the TDP-43 protein was observed when the siRNAs were delivered using Lipofectamine 3000 (Fig. 5).
 | ||
| Fig. 5 (A) Protein levels of TDP-43 analyzed by western blotting in neuroblastoma cells after treatment with different siRNA delivered with NVs or Lipofectamine for 24, 48 and 72 hours and the densitometric analysis (respectively in B, C and D) normalized with GAPDH as the internal control. *p < 0.05 versus CTR (untreated), # p < 0.05 versus NT Lipo or NT NVs. | ||
TDP-43 autoregulates its expression levels (transcripts and proteins) through alternative splicing and 3′-end processing mechanisms.44–47 The short-term TDP-43 silencing kinetics observed after a single administration/dose of the siRNA NVs in cell cultures may be partly due to the autoregulatory mechanisms of TDP-43 that compensate for its downregulation. In this regard, these results open the possibility of using siRNA NVs (in single or multiple administrations) to achieve the desired time-controlled downregulation of the TDP-43 without compromising its essential cellular functions.
TDP-43 accumulates/aggregates in the cytoplasm of the cells, not only as a consequence of neurodegenerative diseases but also within SGs during the physiological response to cellular stress.48,49 Recent studies have linked aberrant SG formation to ALS pathology and SGs have been investigated as potential start sites of TDP-43 aggregation.50–52
To gain insight into the ability of the siRNA-NVs to potentially modulate the cytoplasmic accumulation of TDP-43, the effect of the NV-mediated TDP-43 downregulation on SG formation was analyzed. Neuroblastoma SH-SY5Y cells were treated with siRNA A/F-loaded NVs for 48 hours and successively exposed to acute oxidative stress with sodium arsenite (SA, 500 μM; 45 min) to induce SG formation as previously reported.53 NVs loaded with scramble-siRNA and SA (siRNA-NT NVs) or with SA alone (CTR) were used as controls. Cells treated with siRNA A/F-loaded NVs showed a significant reduction in the number of SGs per cell compared to the controls (Fig. 6A and B). Lower SGs per cell were also observed in the cells treated with Lipofectamine-delivered siRNA A/F but to a lesser extent (Fig. 6D). Notably, compared to the classic lipofectamine-based siRNA delivery system, NV formulations resulted in a higher reduction in SG formation despite achieving equal or lower levels of TDP-43 silencing, as observed in the scatter plots correlating the TDP-43 silencing (mRNA and protein) with the SG inhibition, with NV formulations loaded with siRNA A/F predominantly located in the high SG inhibition quadrants (Q3 and Q4) (Fig. 6E and F).
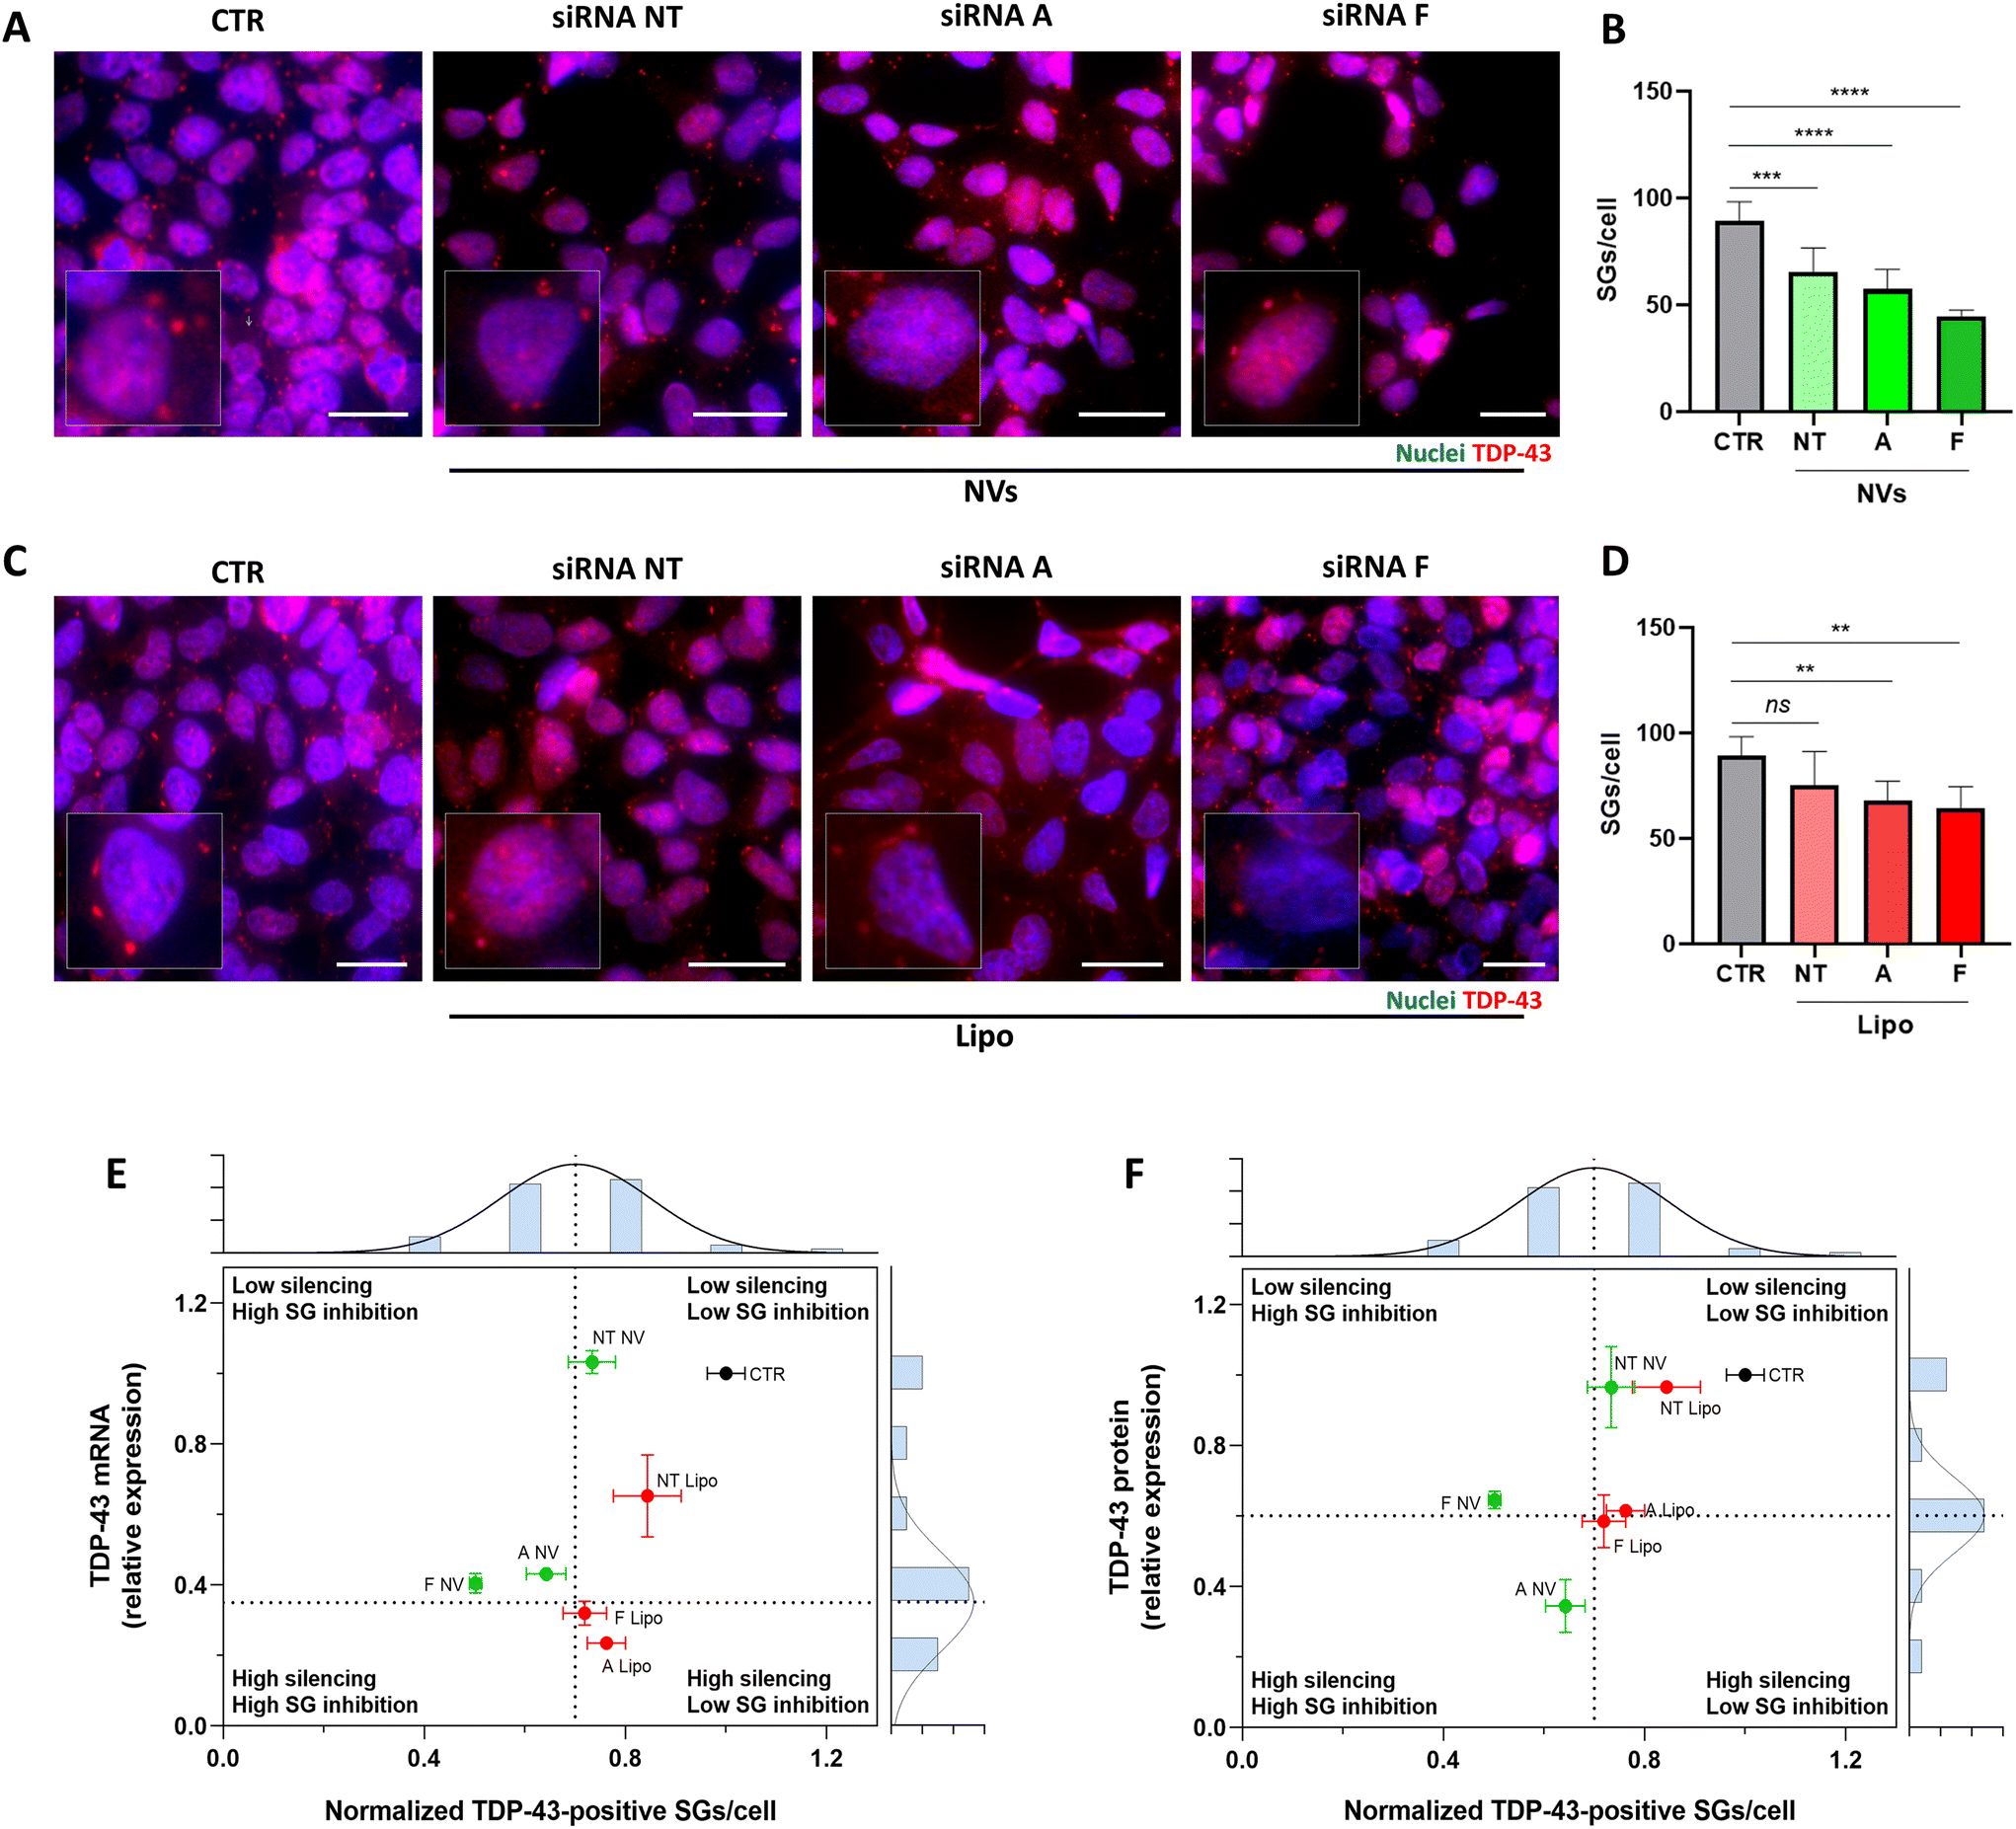 | ||
| Fig. 6 (A) Fluorescence images of localization of SG in neuroblastoma cells after treatments with siRNA-loaded NVs and (C) siRNA-loaded lipofectamine for 48 hours and stressed with SA for 45 minutes. Nuclei were stained with DAPI (blue), TDP-43 labeled in red. Scale bars: 25 μm. Inset images (digitally zoomed) highlight SGs in single cells. (B) Number of TDP-43 positive SGs per cell, after treatment with siRNA NT (NT NVs), siRNA A (A NVs), or siRNA F (F NVs) loaded NVs and (D) siRNA loaded lipofectamine for 48 hours and SA stressed for 45 minutes, untreated cells are used control (CTR). Data are shown as mean ± SEMs and analyzed by one-way ANOVA followed by Tukey's Multiple Comparison tests (*p < 0.05; **p < 0.01; ***p < 0.001; ****p < 0.0001). (E and F) Scatter plots with marginal histograms showing the relationship between TDP-43 silencing and SG formation inhibition. The scatter plots show the values of the TDP-43 silencing (y-axis) and SG inhibition (x-axis) for each condition. Marginal histograms, positioned along the axes of the scatter plots, represent the frequency distribution of the data for each variable generated from the same data points shown in the scatter plot. The x-axis histogram shows the distribution of TDP-43 silencing values and the y-axis histogram shows the distribution of SG inhibition values. The means of each distribution are used to draw the dashed lines that divide the scatter plot into the four quadrants: low silencing/low SG inhibition (Q1), high silencing/low SG inhibition (Q2), high silencing/high SG inhibition (Q3), and low silencing/high SG inhibition (Q4). The quadrants help to distinguish different response patterns, with NV formulations lying predominantly in the high SG inhibition quadrants (Q3 and Q4). (E) Scatter plot of TDP-43 mRNA silencing versus SG formation inhibition, with the corresponding marginal histograms. (F) Scatter plot of TDP-43 protein silencing versus SG formation inhibition, with the corresponding marginal histograms. | ||
Finally, the impact of the NV-mediated TDP-43 silencing on the dynamics of SG disassembly/degradation was investigated. SGs undergo physiological disassembly after stress removal, and failure of this process has been associated with several diseases, including neurodegenerative diseases.54 SH-SY5Y cells treated with siRNA A/F-loaded NVs for 48 hours were exposed to SA for 45 minutes and allowed to recover from the stress for 30 and 75 minutes, respectively. Treatment of SH-SY5Y cells with siRNA A/F-loaded NVs reduced the number of SGs per cell at 30 min recovery compared to control conditions (SGs per cell 30 min: 71.6% ± 0.04% and 72.0% ± 0.08% for CTR and siRNA-NT NVs cells vs. 51.4% ± 0.03% and 56.8% ± 0.11% for siRNA-A NVs and siRNA-F NVs cells; see Fig. 7). This difference was minimal or no longer evident after 75 minutes of recovery (SGs per cell 75 min: 45.1% ± 0.03% and 51.7% ± 0.05% for CTR and siRNA-NT NVs cells vs. 40.1% ± 0.05% and 44.6% ± 0.04% for siRNA-A NVs and siRNA-F NVs cells; see Fig. 7). To a lesser extent, a similar result was observed in cells treated with lipofectamine delivering siRNA-A but not with lipofectamine delivering siRNA-F (ESI Fig. S5†). Overall, the data suggest that, while NV formulations achieve similar or slightly lower levels of TDP-43 silencing compared to lipofectamine, they are more effective at reducing SG formation and accelerating SG disassembly, as shown in Fig. 6 and 7. The enhanced efficacy of NVs in inhibiting and disassembling SGs likely originates from their design characteristics. Polymeric NVs are engineered to provide a more sustained and controlled cytoplasmic release of siRNA, ensuring prolonged siRNA activity. In addition, their surface properties are optimized to facilitate more efficient cellular uptake and endosomal escape, resulting in improved cytoplasmic siRNA delivery compared to liposomal systems such as lipofectamine. This combination of sustained release and optimized intracellular delivery may result in more effective TDP-43 silencing at the critical sites of SG formation, even if the overall TDP-43 knockdown is similar.
 | ||
| Fig. 7 Fluorescence images of localization of SG in neuroblastoma cells (A) after treatments with siRNA-loaded NVs for 48 hours and stressed with SA for 45 minutes and after recovery of 30 minutes or 75 minutes. Nuclei were stained with DAPI (blue), TDP-43 labeled in red. Scale bars: 25 μm. Inset images (digitally zoomed) highlight SGs in single cells. Number of TDP-43 positive SGs per cell (B) after treatment with siRNA NT (NT NVs), siRNA A (A NVs), or siRNA F (F NVs) loaded NVs for 48 hours and SA stressed for 45 minutes, untreated cells are used control (CTR). Data are shown as mean ± SEMs and analyzed by one-way ANOVA followed by Tukey's Multiple Comparison tests (*p < 0.05; **p < 0.01; ***p < 0.001). | ||
Conclusions
Abnormal accumulations of TDP-43 in the cytoplasm of neurons are common histopathological features of several neurodegenerative diseases, including ALS and FTD. Therapeutic strategies to prevent or dismantle pathological TDP-43 inclusions/aggregates have been extensively investigated as a potential therapeutic approach to treating these conditions.55 Specifically, it has been shown that reducing or modulating the expression of the toxic excess of wild-type or mutant TDP-43 improves the degenerative phenotype of cells and animal models of ALS/FTD disease.52,56–58 However, therapeutic strategies based on the direct downregulation/silencing of TDP-43 expression face the challenge of balancing the need to reduce TDP-43 expression with maintaining appropriate levels of TDP-43 to ensure its essential physiological cellular functions.Herein a simple and potentially clinical translatable method for loading and delivering siRNA using a biocompatible and biodegradable non-viral NV is reported. We show that our novel NVs can achieve a regulated/functional reduction of TDP-43 expression. In vitro, the novel NV formulations showed efficacy in reducing the TDP-43 mRNA and protein expression levels comparable to a gold standard cell culture siRNA transfection system such as Lipofectamine®. Interestingly, NV formulations resulted in a higher reduction of SGs than the classical lipofectamine-based system while achieving equal or lower TDP-43 silencing. In addition, NVs were found to accelerate the disassembly of TDP-43-containing SGs. These results provide the first evidence that polymeric nanovectors can potentially address the challenge of treating TDP-43 proteinopathies by achieving therapeutic effects at lower TDP-43 silencing levels.
In conclusion, we have shown that NVs can be used as a siRNA delivery system to achieve the controlled and functional reduction of TDP-43 expression in in vitro cell models. These results provide the first evidence for using NVs as a novel tool for optimizing therapeutic strategies aimed at directly silencing/downregulating TDP-43 to treat TDP-43-proteinopathies, including ALS and FTD.
Data availability
The data presented in this study are available in the article.Conflicts of interest
There are no conflicts to declare.Acknowledgements
This study was supported by “Tecnopolo per la medicina di precisione” (TecnoMed Puglia) – Regione Puglia: DGR No. 2117 del 21/11/2018; EU funding within the MUR PNRR “National Center for Gene Therapy and Drugs based on RNA Technology” (Project No. CN00000041 CN3 RNA); Hub Life Science – Terapia Avanzata (LSH – TA) PNC-E3-2022-23683269 within EU funding within the PNC Italian Health Ministry; EU funding within the PNC Italian Health Ministry PNRR-MR1-2022-12376725, “Preclinical Development of Gene Therapy for Dystrophic Epidermolysis Bullosa”; PRIN PNRR 2022 – P2022EPK9B “Nanodelivery of Slpi Prevents Inflammatory-associated UC Development in the Spontaneous Model Winnie”, funded by European Union – Next Generation EU; Project “Biotecnologia, Bioinformatica e Sviluppo farmaceutico” per la creazione di un hub delle scienze della vita, piano operativo salute (Piano di Sviluppo e Coesione del Ministero della Salute 2014-2020), TRAIETTORIA 4, AZIONE 4.1 – Cod. T4-AN-01; AIRC project under IG 2021 – ID. 26328 project – P.I. Cortese Barbara.References
- W. Robberecht and T. Philips, Nat. Rev. Neurosci., 2013, 14, 248–264 CrossRef CAS PubMed.
- N. Riva, T. Domi, L. Pozzi, C. Lunetta, P. Schito, E. G. Spinelli, S. Cabras, E. Matteoni, M. Consonni, E. D. Bella, F. Agosta, M. Filippi, A. Calvo and A. Quattrini, J. Neurol., 2024, 271, 4693–4723 CrossRef PubMed.
- P. J. Shaw, J. Neurol., Neurosurg. Psychiatry, 2005, 76, 1046 CrossRef CAS PubMed.
- S.-C. Ling, M. Polymenidou and D. W. Cleveland, Neuron, 2013, 79, 416–438 CrossRef CAS PubMed.
- M. Neumann, D. M. Sampathu, L. K. Kwong, A. C. Truax, M. C. Micsenyi, T. T. Chou, J. Bruce, T. Schuck, M. Grossman, C. M. Clark, L. F. McCluskey, B. L. Miller, E. Masliah, I. R. Mackenzie, H. Feldman, W. Feiden, H. A. Kretzschmar, J. Q. Trojanowski and V. M.-Y. Lee, Science, 2006, 314, 130–133 CrossRef CAS PubMed.
- A. Aulas and C. Vande Velde, Front. Cell. Neurosci. DOI:10.3389/fncel.2015.00423.
- M. J. Winton, L. M. Igaz, M. M. Wong, L. K. Kwong, J. Q. Trojanowski and V. M.-Y. Lee, J. Biol. Chem., 2008, 283, 13302–13309 CrossRef CAS PubMed.
- C. Fallini, G. J. Bassell and W. Rossoll, Hum. Mol. Genet., 2012, 21, 3703–3718 CrossRef CAS PubMed.
- A. M. Krecic and M. S. Swanson, Curr. Opin. Cell Biol., 1999, 11, 363–371 CrossRef CAS PubMed.
- Y. M. Ayala, P. Zago, A. D'Ambrogio, Y.-F. Xu, L. Petrucelli, E. Buratti and F. E. Baralle, J. Cell Sci., 2008, 121, 3778–3785 CrossRef CAS PubMed.
- E. Buratti, L. De Conti, C. Stuani, M. Romano, M. Baralle and F. Baralle, FEBS J., 2010, 277, 2268–2281 CrossRef CAS PubMed.
- C. Colombrita, E. Zennaro, C. Fallini, M. Weber, A. Sommacal, E. Buratti, V. Silani and A. Ratti, J. Neurochem., 2009, 111, 1051–1061 CrossRef CAS PubMed.
- L.-Y. Liqun and A. Bilgutay, PLoS One, 2010, 5, 1–15 Search PubMed.
- C. M. Dewey, B. Cenik, C. F. Sephton, D. R. Dries, P. Mayer III, S. K. Good, B. A. Johnson, J. Herz and G. Yu, Mol. Cell. Biol., 2011, 31, 1098–1108 CrossRef CAS PubMed.
- J. Meyerowitz, S. J. Parker, L. J. Vella, D. C. H. Ng, K. A. Price, J. R. Liddell, A. Caragounis, Q.-X. Li, C. L. Masters, T. Nonaka, M. Hasegawa, M. A. Bogoyevitch, K. M. Kanninen, P. J. Crouch and A. R. White, Mol. Neurodegener., 2011, 6, 57 CrossRef CAS PubMed.
- Y. Zhu, L. Zhu, X. Wang and H. Jin, Cell Death Dis., 2022, 13, 644 CrossRef CAS PubMed.
- G. M. Traber and A.-M. Yu, J. Pharmacol. Exp. Ther., 2023, 384, 133–154 CrossRef CAS PubMed.
- C. Selvam, D. Mutisya, S. Prakash, K. Ranganna and R. Thilagavathi, Chem. Biol. Drug Des., 2017, 90, 665–678 CrossRef CAS PubMed.
- K. A. Whitehead, R. Langer and D. G. Anderson, Nat. Rev. Drug Discovery, 2009, 8, 129–138 CrossRef CAS PubMed.
- C. R. Joshi, V. Labhasetwar and A. Ghorpade, J. Neuroimmune Pharmacol., 2017, 12, 51–83 CrossRef PubMed.
- S. R. Youngren, R. K. Tekade, B. Gustilo, P. R. Hoffmann and M. B. Chougule, BioMed Res. Int., 2013, 2013, 858946 Search PubMed.
- L. Aagaard and J. J. Rossi, Adv. Drug Delivery Rev., 2007, 59, 75–86 CrossRef CAS PubMed.
- S. Almutiri, M. Berry, A. Logan and Z. Ahmed, Sci. Rep., 2018, 8, 10707 CrossRef PubMed.
- A. Majowicz, D. Salas, N. Zabaleta, E. Rodríguez-Garcia, G. González-Aseguinolaza, H. Petry and V. Ferreira, Mol. Ther., 2017, 25, 1831–1842 CrossRef CAS PubMed.
- H. Yin, R. L. Kanasty, A. A. Eltoukhy, A. J. Vegas, J. R. Dorkin and D. G. Anderson, Nat. Rev. Genet., 2014, 15, 541–555 CrossRef CAS PubMed.
- T. Nakamura, M. Kuroi, Y. Fujiwara, S. Warashina, Y. Sato and H. Harashima, Sci. Rep., 2016, 6, 37849 CrossRef CAS PubMed.
- T. Kasuya, S. Hori, A. Watanabe, M. Nakajima, Y. Gahara, M. Rokushima, T. Yanagimoto and A. Kugimiya, Sci. Rep., 2016, 6, 30377 CrossRef CAS PubMed.
- Y. Patil and J. Panyam, Int. J. Pharm., 2009, 367, 195–203 CrossRef CAS PubMed.
- C. Guido, M. Testini, S. D'Amone, B. Cortese, M. Grano, G. Gigli and I. E. Palamà, Adv. Mater., 2021, 2, 310–321 RSC.
- G. Maiorano, C. Guido, A. Russo, A. Giglio, L. Rizzello, M. Testini, B. Cortese, S. D’Amone, G. Gigli and I. E. Palamà, Pharmaceutics, 2022, 14, 1310 CrossRef CAS PubMed.
- H. Wang, S. Zhang, J. Lv and Y. Cheng, VIEW, 2021, 2, 20200026 CrossRef CAS.
- K. J. Kauffman, M. J. Webber and D. G. Anderson, J. Controlled Release, 2016, 240, 227–234 CrossRef CAS PubMed.
- Y. Lee, M. Jeong, J. Park, H. Jung and H. Lee, Exp. Mol. Med., 2023, 55, 2085–2096 CrossRef CAS PubMed.
- J. D. Tousignant, A. L. Gates, L. A. Ingram, C. L. Johnson, J. B. Nietupski, S. H. Cheng, S. J. Eastman and R. K. Scheule, Hum. Gene Ther., 2000, 11, 2493–2513 CrossRef CAS PubMed.
- M. Jäger, S. Schubert, S. Ochrimenko, D. Fischer and U. S. Schubert, Chem. Soc. Rev., 2012, 41, 4755–4767 RSC.
- S. Manna, A. Seth, P. Gupta, G. Nandi, R. Dutta, S. Jana and S. Jana, ACS Biomater. Sci. Eng., 2023, 9, 2181–2202 CrossRef CAS PubMed.
- B. Scheicher, A.-L. Schachner-Nedherer and A. Zimmer, Eur. J. Pharm. Sci., 2015, 75, 54–59 CrossRef CAS PubMed.
- S. Jamwal, B. Ram, S. Ranote, R. Dharela and G. S. Chauhan, Int. J. Biol. Macromol., 2019, 123, 968–978 CrossRef CAS PubMed.
- V. Ceña and P. Játiva, Nanomedicine, 2018, 13, 1513–1516 CrossRef PubMed.
- C. Guido, C. Baldari, G. Maiorano, A. Mastronuzzi, A. Carai, C. Quintarelli, B. De Angelis, B. Cortese, G. Gigli and I. E. Palamà, Diagnostics, 2022, 12, 173 CrossRef CAS PubMed.
- Z. Wu, J. Chen, Y. Sun, De Zhao, M. Shen, L. Huang, Q. Xu, Y. Duan and Y. Li, J. Biomed. Nanotechnol., 2018, 14, 1816–1825 CrossRef CAS PubMed.
- H. Kasai, K. Inoue, K. Imamura, C. Yuvienco, J. K. Montclare and S. Yamano, J Nanobiotechnology, 2019, 17, 11 CrossRef PubMed.
- K. Huppi, S. E. Martin and N. J. Caplen, Mol. Cell, 2005, 17, 1–10 CrossRef CAS PubMed.
- Y. M. Ayala, L. De Conti, S. E. Avendaño-Vázquez, A. Dhir, M. Romano, A. D'Ambrogio, J. Tollervey, J. Ule, M. Baralle, E. Buratti and F. E. Baralle, EMBO J., 2011, 30, 277–288 CrossRef CAS PubMed.
- P. Tziortzouda, L. Van Den Bosch and F. Hirth, Nat. Rev. Neurosci., 2021, 22, 197–208 CrossRef CAS PubMed.
- A. Koyama, A. Sugai, T. Kato, T. Ishihara, A. Shiga, Y. Toyoshima, M. Koyama, T. Konno, S. Hirokawa, A. Yokoseki, M. Nishizawa, A. Kakita, H. Takahashi and O. Onodera, Nucleic Acids Res., 2016, 44, 5820–5836 CrossRef CAS PubMed.
- S. E. Avendaño-Vázquez, A. Dhir, S. Bembich, E. Buratti, N. Proudfoot and F. E. Baralle, Genes Dev., 2012, 26, 1679–1684 CrossRef PubMed.
- D. S. W. Protter and R. Parker, Trends Cell Biol., 2016, 26, 668–679 CrossRef CAS PubMed.
- H. Glauninger, C. J. Wong Hickernell, J. A. M. Bard and D. A. Drummond, Mol. Cell, 2022, 82, 2544–2556 CrossRef CAS PubMed.
- H. Mahboubi and U. Stochaj, Biochim. Biophys. Acta, Mol. Basis Dis., 2017, 1863, 884–895 CrossRef CAS PubMed.
- Y. Khalfallah, R. Kuta, C. Grasmuck, A. Prat, H. D. Durham and C. Vande Velde, Sci. Rep., 2018, 8, 7551 CrossRef PubMed.
- M. Y. Fang, S. Markmiller, A. Q. Vu, A. Javaherian, W. E. Dowdle, P. Jolivet, P. J. Bushway, N. A. Castello, A. Baral, M. Y. Chan, J. W. Linsley, D. Linsley, M. Mercola, S. Finkbeiner, E. Lecuyer, J. W. Lewcock and G. W. Yeo, Neuron, 2019, 103, 802–819 CrossRef CAS PubMed.
- A. Ratti, V. Gumina, P. Lenzi, P. Bossolasco, F. Fulceri, C. Volpe, D. Bardelli, F. Pregnolato, A. Maraschi, F. Fornai, V. Silani and C. Colombrita, Neurobiol. Dis., 2020, 145, 105051 CrossRef CAS PubMed.
- S. Hofmann, N. Kedersha, P. Anderson and P. Ivanov, Biochim. Biophys. Acta, Mol. Cell Res., 2021, 1868, 118876 CrossRef CAS PubMed.
- A. Babazadeh, S. L. Rayner, A. Lee and R. S. Chung, Ageing Res. Rev., 2023, 92, 102085 CrossRef CAS PubMed.
- A. K. Walker, K. J. Spiller, G. Ge, A. Zheng, Y. Xu, M. Zhou, K. Tripathy, L. K. Kwong, J. Q. Trojanowski and V. M.-Y. Lee, Acta Neuropathol., 2015, 130, 643–660 CrossRef CAS PubMed.
- T. Takeuchi, K. Maeta, X. Ding, Y. Oe, A. Takeda, M. Inoue, S. Nagano, T. Fujihara, S. Matsuda, S. Ishigaki, K. Sahashi, E. N. Minakawa, H. Mochizuki, M. Neya, G. Sobue and Y. Nagai, Mol. Ther. – Nucleic Acids, 2023, 31, 353–366 CrossRef CAS PubMed.
- S. J. Barmada, A. Serio, A. Arjun, B. Bilican, A. Daub, D. M. Ando, A. Tsvetkov, M. Pleiss, X. Li, D. Peisach, C. Shaw, S. Chandran and S. Finkbeiner, Nat. Chem. Biol., 2014, 10, 677–685 CrossRef CAS PubMed.
Footnote |
| † Electronic supplementary information (ESI) available. See DOI: https://doi.org/10.1039/d4nr03159h |
| This journal is © The Royal Society of Chemistry 2024 |