
 Open Access Article
 This Open Access Article is licensed under a Creative Commons Attribution-Non Commercial 3.0 Unported Licence
Influence of the catalyst surface chemistry on the electrochemical self-coupling of biomass-derived benzaldehyde into hydrobenzoin†
Li
Gong
ab,
Shiling
Zhao
 c,
Jing
Yu
ad,
Junshan
Li
e,
Jordi
Arbiol
dh,
Tanja
Kallio
f,
Mariano
Calcabrini
g,
Paulina R.
Martínez-Alanis
*a,
Maria
Ibáñez
g and
Andreu
Cabot
*ah
c,
Jing
Yu
ad,
Junshan
Li
e,
Jordi
Arbiol
dh,
Tanja
Kallio
f,
Mariano
Calcabrini
g,
Paulina R.
Martínez-Alanis
*a,
Maria
Ibáñez
g and
Andreu
Cabot
*ah
aCatalonia Institute for Energy Research – IREC Sant Adrià de Besòs, Barcelona 08930, Spain. E-mail: pmartinez@irec.cat; acabot@irec.cat
bUniversity of Barcelona, Barcelona 08028, Spain
cSchool of Petrochemical Engineering, Lanzhou University of Technology, Lanzhou 730050, China
dCatalan Institute of Nanoscience and Nanotechnology (ICN2), CSIC and BIST, Campus UAB, Bellaterra, 08193 Barcelona, Spain
eInstitute of Advanced Study, Chengdu University, Chengdu 610106, China
fDepartment of Chemistry and Materials Science, Aalto University School of Chemical Engineering, P.O. Box 16100, FI-00076 Aalto, Finland
gIST Austria, Am Campus 1, Klosterneuburg 3400, Austria
hICREA, Pg. Lluís Companys 23, 08010 Barcelona, Spain
First published on 12th July 2024
Abstract
The electroreduction of biomass-derived benzaldehyde (BZH) provides a potentially cost-effective route to produce benzyl alcohol (BA). This reaction competes with the electrochemical self-coupling of BZH to hydrobenzoin (HDB), which holds significance as a biofuel. Herein, we demonstrate the selectivity towards one or the other product strongly depends on the surface chemistry of the catalyst, specifically on its ability to adsorb hydrogen, as showcased with Cu2S electrocatalysts. We particularly analyze the effect of surface ligands, oleylamine (OAm), on the selective conversion of BZH to BA or HDB. The effect of the electrode potential, electrolyte pH, and temperature are studied. Results indicate that bare Cu2S exhibits higher selectivity towards BA, while OAm-capped Cu2S promotes HDB formation. This difference is explained by the competing adsorption of protons and BZH. During the BZH electrochemical conversion, electrons first transfer to the C in the C![[double bond, length as m-dash]](https://www.rsc.org/images/entities/char_e001.gif) O group to form a ketyl radical. Then the radical either couples with surrounding H+ to form BA or self-couple to produce HDB, depending on the H+ availability that is affected by the electrocatalyst surface properties. The presence of OAm inhibits the H adsorption on the electrode surface therefore reducing the formation of high-energy state Had and its combination with ketyl radicals to form BA. Instead, the presence of OAm promotes the outer sphere reaction for obtaining HDB.
O group to form a ketyl radical. Then the radical either couples with surrounding H+ to form BA or self-couple to produce HDB, depending on the H+ availability that is affected by the electrocatalyst surface properties. The presence of OAm inhibits the H adsorption on the electrode surface therefore reducing the formation of high-energy state Had and its combination with ketyl radicals to form BA. Instead, the presence of OAm promotes the outer sphere reaction for obtaining HDB.
1. Introduction
Addressing the environmental crisis requires a transition to clean and zero-carbon energies in both supply and consumption, as well as the adoption of sustainable and efficient chemical synthesis methods.1,2 Electrocatalysis plays a crucial role by allowing precise control over reaction conditions and promoting the use of mild, sustainable, and energy-efficient processes.3–10 This approach enables the fine-tuning of reaction products through adjustable parameters, such as the electrode potential and current density, facilitating the eco-friendly synthesis of complex molecules with unprecedented efficiency.11–13 In particular, the electrocatalytic reduction of organic compounds is a field of significant interest with broad application potential.Despite the high economic potential and clean characteristics of electrocatalytic organic reduction processes, their industrial application in the valorization of biomass-derived feedstocks is not widely extended. This is due to their notable complexity and challenging optimization, which arises from the intricate nature of organic compounds and the involvement of multi-step electron transfer mechanisms and various intermediates. As an example in this direction, the electroreduction of biomass-derived benzaldehyde (BZH) provides a fascinating route for the selective production of benzyl alcohol (BA), a versatile compound widely utilized in the pharmaceutical and fine chemical industries.14–16 Moreover, the electrochemical self-coupling of BZH to hydrobenzoin (HDB) holds significance as a potential biofuel production route.17,18 Both processes, the production of BA and HDB occurring at around 0 V vs. RHE, compete with the hydrogen evolution reaction (HER, 0 V vs. RHE). As shown in Scheme 1, the first elementary step in both reactions involves the protonation of CO in BZH, which facilitates the posterior acquisition of one electron from the electrode to form a radical intermediate.18–20
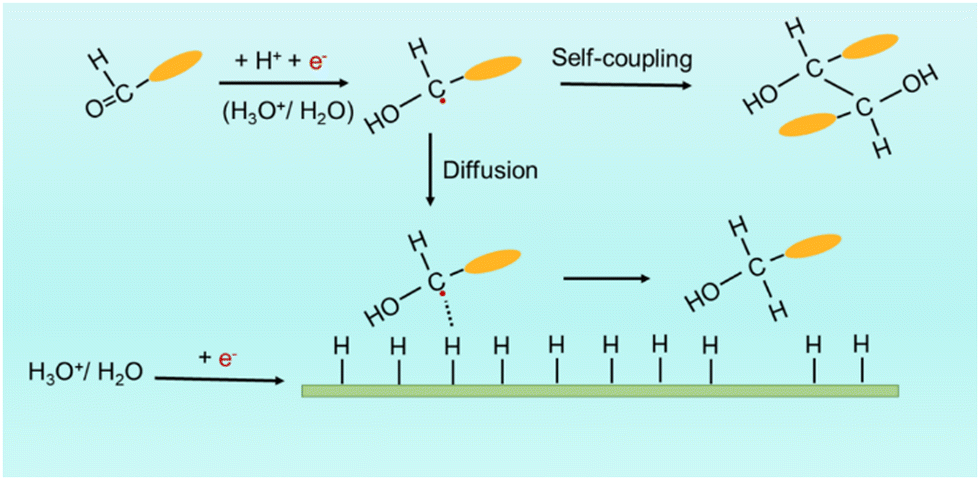 | ||
| Scheme 1 Two pathways for the BZH electroreduction, to BA or HDB. The orange ellipsoid represents the benzene ring. Red spots represent electrons provided by the electrode that is represented here by a green bar. | ||
In acid media:
| phCHO + H3O+ → ph − HCO − H3O+ |
| ph − HCO − H3O+ + e− → ph(OH)HC˙ + H2O |
In alkaline media:
| phCHO + H2O → ph − HCO − H2O |
| ph − HCO − H2O + e− → ph(OH)HC˙ + OH− |
After the protonation and electron transfer steps, either the dimerization of two radicals in solution to produce HDB or the combination of the radical with an adsorbed hydrogen (Had) in a Langmuir–Hinshelwood (L–H) scheme to obtain BA takes place. While the electroreduction of BZH to HDB is an outer-sphere reaction, i.e. does not involve surface adsorption,21–25 BA production depends on the Had availability on the catalyst surface:
| In acid media: H3O+ + e− + * → *H + H2O |
| In alkaline media: H2O + e− + * → *H + OH− |
To maximize HDB selectivity, current catalyst design strategies primarily focus on materials with high HER overpotentials such as Hg, Pb, In, and Cd.22,26–29 However, beyond concerns of metal toxicity and cost, this strategy has intrinsic limitations. Increasing the negative voltage or temperature to accelerate the reaction raises the Fermi level on the catalyst surface, resulting in more adsorbed hydrogen protons concentrating on the solution side of the electrical double layer (EDL). This, in turn, promotes the hydrogenation of ketyl radicals leading to the formation of BA.
Beyond material selection, the rational design and engineering of the catalyst surface chemistry is a powerful strategy to promote selectivity. More specifically, the modification of the electronic energy levels of the catalyst surface using functional groups such as –OH and –SOOH,30,31 as well as larger organic groups such as aromatic thiols, have been shown to favor specific reaction mechanisms.32–34 Besides modifying the electronic energy levels, the presence of surface species can also adjust selectivity by tailoring the surface adsorption properties. As an example, lipophilic species can enhance the gathering of organic substances at the catalyst surface. In this direction, Baik's group demonstrated an increase in selectivity by promoting the Suzuki–Miyaura cross-coupling reaction with organic monolayers self-assembled at the electrode surface.35 Besides, Li's group tailored the interfacial environments of Pb electrodes using quaternary alkyl ammonium cations to control the selectivity of BZH to BA or HDB. They showed that the longer the chain length and the higher the cation concentration, the higher the selectivity towards HDB.26
Herein, we modify the surface of Cu2S nanoparticles (NPs) by adding a monolayer of unsaturated fatty amines, specifically oleylamine (OAm), and explore its effect on the electrocatalytic conversion of BZH to either BA or HDB. Cu was selected taking into account its exceptional ability for radical generation.27 We investigate the effect of voltage and temperature on the reaction selectivity at pH 5.2 and pH 9.0. We further explore the involved electroreduction reaction pathways aiming to unveil the rate-determining steps and gain insight into the parameters determining the reaction selectivity. Our final goal is to enable a more rational design of electrocatalyst for the selective electroreduction of biomass-derived BZH.
2. Experimental
2.1 Materials
Copper(II) acetylacetonate (Cu(acac)2, Sigma Aldrich, 97%), oleylamine (OAm, Aladdin Reagent, 70%), dodecanethiol (DDT, Sigma Aldrich, 98%), N,N-dimethylformamide (DMF, Sigma Aldrich, anhydrous, 99.8%), methanol (CH3OH, Letslab, 96%), ethanol (CH3CH2OH, Letslab, 96%), benzaldehyde (C7H6O, Sigma Aldrich), benzyl alcohol (C7H8O, Sigma Aldrich), benzoic acid (C7H6O2, Sigma Aldrich), and hydrobenzoin (C14H14O2, Sigma Aldrich) were used as purchased, without further purification.2.2 Cu2S preparation
Cu2S NPs were produced following a modified version of a previously reported procedure.35 Briefly, in a three-neck flask equipped with a reflux condenser, a mixture of Cu(acac)2 (1.56 g, 0.6 mmol), DDT (20 mL), and OAm (40 mL) was deaerated with nitrogen at 120 °C for 20 min. After the nitrogen purging step, the mixture exhibited a light brownish-yellow color. Then, the solution was heated to 200 °C at a constant heating rate of 8 °C min−1 and kept at this temperature for 60 min. During this time, the solution becomes turbid, and the color deepens to a brown-black indicating the occurrence of the chemical reaction. Then, the mixture was cooled down to room temperature. The material was washed with hexane/methanol, separated by centrifugation (9000 rpm, 10 min), and finally dispersed in hexane.2.3 Ligands removal
The ligands used to control the Cu2S NP growth were removed using an annealing step.36 The dried Cu2S NP powder was annealed for 2 h under an Ar flow inside a tube furnace at 400 °C, reached using a heating rate of 10 °C min−1.2.4 Materials characterization
High-resolution transmission electron microscopy (HRTEM) and high-angle annular dark field (HAADF) images were acquired in a Tecnai F20 microscope operated at 200 kV. Energy dispersive spectroscopy (EDS) spectra were obtained in a double-corrected and monochromated Thermo Fisher Spectra 300 microscope operated at 200 kV. Powder X-ray diffraction (XRD) patterns were collected at 40 kV and 40 mA with Cu Kα radiation (λ = 1.5406 Å). Fourier-transformed infrared (FT-IR) spectra of the unsupported samples were recorded on an Alpha Bruker spectrometer. X-Ray photoelectron spectroscopy (XPS) was conducted on a ThermoFisher (ESCALAB 250Xi) system with Mono Al Kα radiation. The vacuum of the analysis chamber was approximately 2 × 10⁻⁹ mbar. The energy, voltage, and beam current were 1486.6 eV, 16 kV, and 15 mA, respectively. XPS spectra were corrected to the position of the C 1s peak at 284.6 eV.2.5 Product identification and conversion and selectivity quantification
High-performance liquid chromatography (HPLC) analysis of the organics was carried out on an Agilent 1200 series apparatus at 25 °C. The HPLC was equipped with an ultraviolet-visible detector and a 4.6 mm × 150 mm Shim-pack GWS 5 μm C18 column. The eluting solvents of A: 5 mM ammonium formate aqueous solution; and solution B: acetonitrile was used. The eluent was 60% solution B and 40% solution A for 11 min. The flow rate was 0.5 mL s−1. The injection amount was 1 μl. Calibration curves of standard chemicals were employed to determine and quantify the products. The total conversion and selectivities were calculated using the following equations: | (1) |
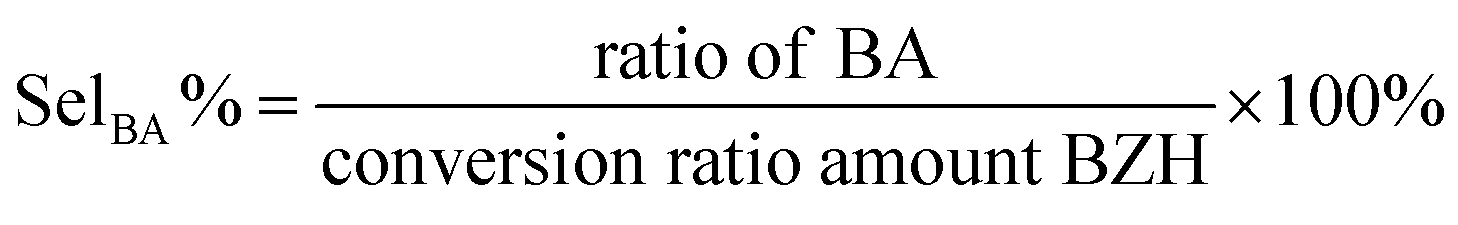 | (2) |
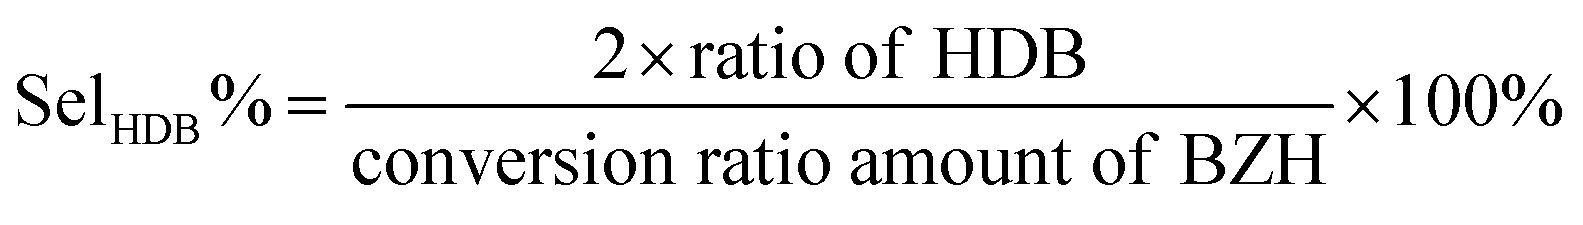 | (3) |
2.6 Electrocatalytic tests
The electrochemical performance of the electrocatalyst was evaluated on a Corrtest CS2350 EIS bipotentiostat (2-channel, Wuhan Corrtest Instrument Corp. Ltd) using a 3-electrode system in an H-cell reactor divided by a Nafion 117 proton exchange membrane. The working electrode was prepared as follows: 9 mg powder was dispersed into 500 μL H20, 420 μL methanol, and 80 μL 5% Nafion solution. For activity, conversion, and selectivity determination, the catalyst was supported on a carbon cloth used as working electrodes. 1000 μL ink solution was dropped on 2 × 3 cm2 carbon cloth (∼1.5 mg cm−2) that was then cut into 1.5 × 1 cm2 pieces. When testing, an electrode area of 1 × 1 cm2 was immersed into the solution. To determine activation energies, 6 μL ink solution was dropped on a glassy carbon working electrode (d = 0.15 cm, ∼0.7 mg cm−2) and let dry. Platinum mesh and Ag/AgCl (KCl saturated) were used as counter and reference electrodes, respectively. Cyclic voltammetry (CV) and linear sweep voltammetry (LSV) results were calibrated with Nernst eqn (4) to the reference hydrogen electrode (RHE) without iR correction. The temperature effects were neglected when setting the parameters for I–t curves.| ERHE = E + 0.0591 × pH + EθAg/AgCl | (4) |
| EθAg/AgCl(KClsaturated) = [0.197 − 0.0007 (T − 25)] V | (5) |
Two electrolytes were tested to explore the influence of the pH. A sodium acetate–acetic acid solution (pH = 5.2), and a potassium carbonate–potassium bicarbonate solution (pH = 9.0). LSV was tested in the range 0.5 V to −1.0 V (vs. RHE). Electrochemical impedance spectroscopy (EIS) was tested at −0.7 V vs. RHE. For the I−t curve, −0.4 V, −0.8 V, −1.0 V (vs. RHE) was applied as a constant voltage.
3. Results and discussion
Cu2S and Cu2S–OAm electrocatalysts were prepared at 200 °C using a one-pot synthetic reaction followed by post-treatment (see details in the Experimental section, Fig. 1a). DDT was employed as the source of S and solvent and OAm was used as an additional solvent and surface ligand. After 1 h reaction at 200 °C, Cu2S–OAm was obtained by centrifugation. Cu2S was obtained by annealing the Cu2S–OAm powder at 400 °C under an Ar atmosphere.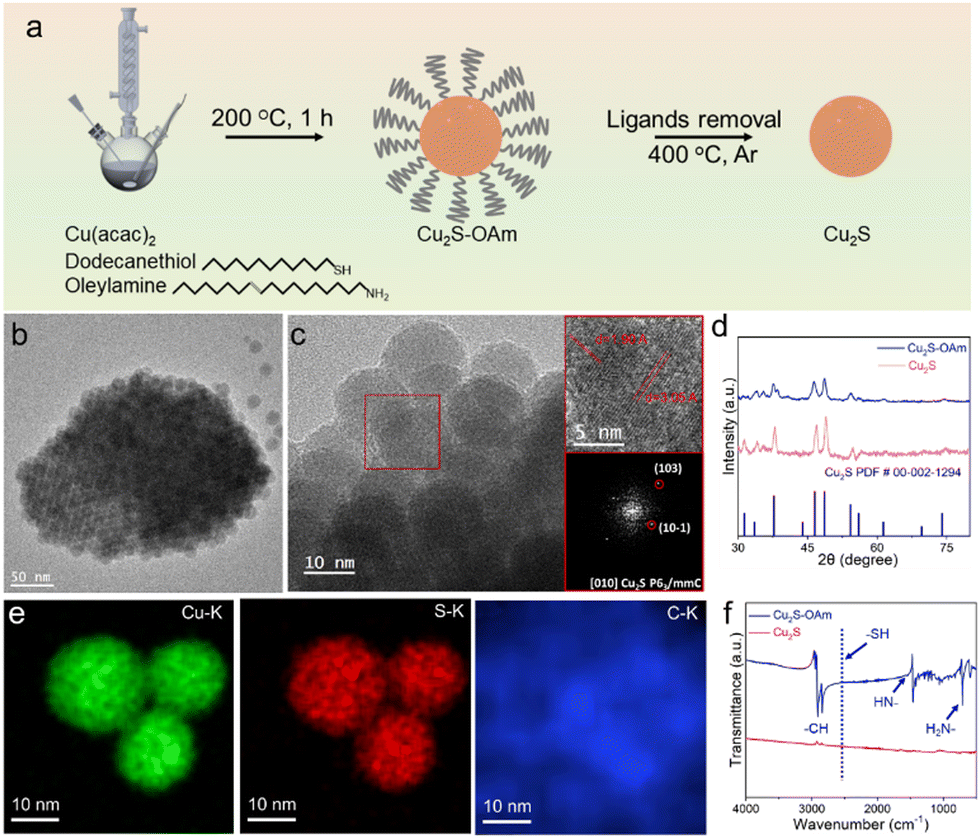 | ||
| Fig. 1 (a) Scheme of the procedure used to prepare Cu2S–OAm and Cu2S. (b) TEM and (c) HRTEM images and indexed power spectrum of Cu2S–OAm NPs. From the crystalline domain, the Cu2S lattice fringe distances were measured to be 0.1902 nm, 0.3057 nm, at 80.46° which is interpreted as the hexagonal Cu2S phase, visualized along its [010] zone axis. (d) STEM-EDS chemical composition maps of Cu2S–OAm NPs; (e) XRD patterns of Cu2S and Cu2S–OAm. (f) FT-IR spectra of Cu2S and Cu2S–OAm. | ||
Fig. 1b shows the Cu2S–OAm NPs to have spherical geometry and an average size of 10 ± 2 nm. HRTEM micrographs of Cu2S–OAm reveal their hexagonal crystal phase, space group P63mmC, with a = b = 3.95 Å and c = 6.75 Å (Fig. 1c), which was consistent with XRD analysis results (PDF#00-02-1294, Fig. 1d). HAADF intensity profiles and STEM-EDS chemical composition maps show a homogeneous dispersion of Cu and S within the Cu2S–OAm particles that are surrounded by a carbon-based shell (Fig. 1e and Fig. S1, ESI†). The carbon shell is discerned by the stronger carbon signal detected at the border of the particle and it is associated with the presence of OAm at the NP surface.
To remove OAm ligands from the NP surface, the material was annealed at 400 °C under an Ar atmosphere. The removal of the stabilizing ligands resulted in increased surface energy that, combined with the relatively high processing temperature, led to NP aggregation and additional growth into Cu2S particles with irregular morphologies (Fig. S2a, ESI†). Yet, the hexagonal crystal phase of Cu2S was maintained as shown by XRD characterization (Fig. 1d). EDS analysis confirmed the Cu2S composition to be close to the stoichiometric Cu![[thin space (1/6-em)]](https://www.rsc.org/images/entities/char_2009.gif) :S = 2:1 (Fig. S2e, ESI†). Besides, HAADF intensity profiles and STEM-EDS elemental maps showed no evidence of an organic layer surrounding the Cu2S particles, confirming the surface ligand removal (Fig. S2, ESI†). The complete ligand removal was further verified using FT-IR analysis (Fig. 1f). The FT-IR spectrum of Cu2S–OAm displays the signal corresponding to the –NH bending vibration at 1619 cm−1 and –NH2 wagging vibration at 721 cm−1, which indicates the presence of OAm molecules on the Cu2S surface bond to the surface Cu by the amine polar groups to form OAm/Cu complex. Besides, the FT-IR spectrum of Cu2S–OAm does not show the band at 2577 cm−1 associated with the stretching vibration of S–H. This result indicates the lack of free alkylthiol and Cu thiolate complexes, i.e. the absence of DDT on the surface of the Cu2S–OAm NPs.35,37 Peak signals at around 3000 cm−1 corresponds to the stretching vibration of both saturated and unsaturated C–H. On the other hand, the FT-IR spectrum of Cu2S displayed no fingerprint associated with the presence of OAm or DDT, proving the successful ligand removal during the annealing process.
:S = 2:1 (Fig. S2e, ESI†). Besides, HAADF intensity profiles and STEM-EDS elemental maps showed no evidence of an organic layer surrounding the Cu2S particles, confirming the surface ligand removal (Fig. S2, ESI†). The complete ligand removal was further verified using FT-IR analysis (Fig. 1f). The FT-IR spectrum of Cu2S–OAm displays the signal corresponding to the –NH bending vibration at 1619 cm−1 and –NH2 wagging vibration at 721 cm−1, which indicates the presence of OAm molecules on the Cu2S surface bond to the surface Cu by the amine polar groups to form OAm/Cu complex. Besides, the FT-IR spectrum of Cu2S–OAm does not show the band at 2577 cm−1 associated with the stretching vibration of S–H. This result indicates the lack of free alkylthiol and Cu thiolate complexes, i.e. the absence of DDT on the surface of the Cu2S–OAm NPs.35,37 Peak signals at around 3000 cm−1 corresponds to the stretching vibration of both saturated and unsaturated C–H. On the other hand, the FT-IR spectrum of Cu2S displayed no fingerprint associated with the presence of OAm or DDT, proving the successful ligand removal during the annealing process.
The survey and high-resolution XPS spectra are displayed in Fig. S3 (ESI†) and Fig. 2, respectively. The Cu 2p XPS spectrum of Cu2S–OAm displays a unique doublet, at 932.1 eV (Cu 2p3/2), associated with Cu(I) within the Cu2S lattice.35 In contrast, the Cu 2p XPS spectrum of Cu2S displays two doublets and additional satellite peaks. The first doublet, at 932.1 eV (Cu 2p3/2), is associated with Cu(I) within the Cu2S lattice. The second doublet, at 934.3 eV (Cu 2p3/2), and the satellites are related to the presence of a significant amount of Cu(II) at the Cu2S surface. This second component is associated with the oxidation of Cu(I) after ligand removal. The S 2p XPS spectrum of Cu2S–OAm shows one doublet at 161.5 eV (S 2p3/2) which is assigned to S ions coordinated to Cu within the Cu2S lattice. A second minor component is observed at lower binding energies, 160.9 eV (S 2p3/2), which we associate with sulfur next to OAm-bond metal ions. After the ligand removal, the S 2p XPS spectrum of Cu2S shows just one doublet associated with S ions within the Cu2S lattice. This component is redshifted by around 0.4 eV, which indicates a higher electron concentration around the surface S within the Cu2S sample.
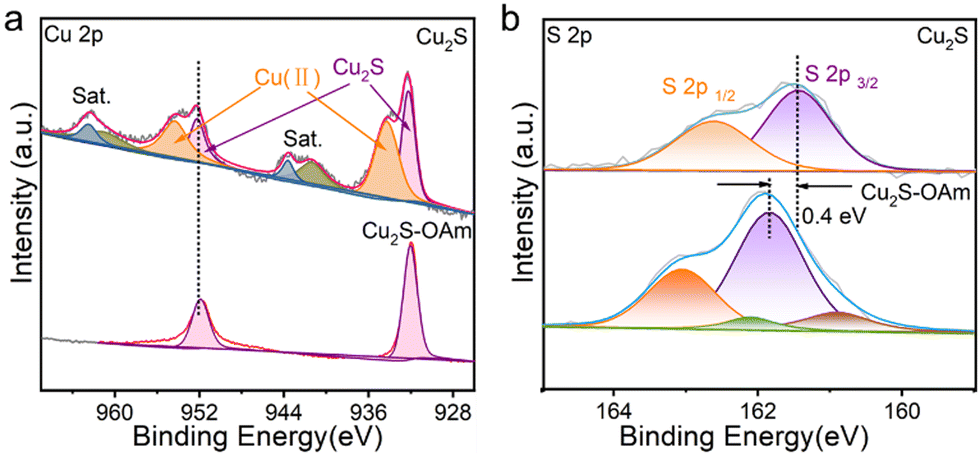 | ||
| Fig. 2 High-resolution Cu 2p (a) and S 2p (b) XPS spectra of Cu2S and Cu2S–OAm. | ||
The electrochemical properties of Cu2S and Cu2S–OAm particles supported on glassy carbon were initially tested in acidic conditions, within a 1 M sodium acetate–acetic acid electrolyte (pH = 5.2) with and without 20 mM BZH. Lower pH values were not considered as pH values below 5.2 might cause CO cleavage of BZH to toluene or other side products. Fig. 3a displays the LSV curves obtained in a three-electrodes H-cell reactor. In acidic conditions, without BZH, electrons are only transferred to H+ to form Had, thus the measured current densities in the absence of BZH correspond to the HER. We observe that the Cu2S–OAm electrode displays a significantly lower HER activity, with a higher overpotential and lower current densities at all applied voltages than the Cu2S electrode. This result is consistent with the presence of OAm partially inhibiting Had formation and HER. In the presence of BZH, electrons can be also transferred to C in ph-HCO-H3O+ to form a ketyl radical. The subsequent step, after the electron transfer process, involves the combination of the ketyl radical and Had into BA or the combination of ketyl radicals into BZH, involving no additional charge transfer. For both electrodes, the addition of BZH in the electrolyte results in a current increase at low negative potentials, below the HER onset potential. This implies that ketyl radicals are readily formed at lower negative voltages than Had and H2, at ca. −0.3 V vs. RHE in both electrodes. For the Cu2S–OAm electrode, the current density in the presence of BZH is systematically higher than in its absence, at all potentials tested, which reflects a promoted ketyl radical generation over the partially inhibited Had formation and H2 evolution. As for the Cu2S electrode, while at low negative potentials, the current density is higher in the presence of BZH, as the applied potential increases, the HER-related current in the absence of BZH overcomes the combination of the current density associated with the BZH reaction and the HER in the presence of BZH. Thus the presence of BZH partially inhibits the HER in this material, potentially as a result of the ketyl radical reaction with Had, reducing its concentration, or through the adsorption of ph-HCO-H3O+ or the ketyl radical on the Cu2S surface thus occupying Had adsorption sites.
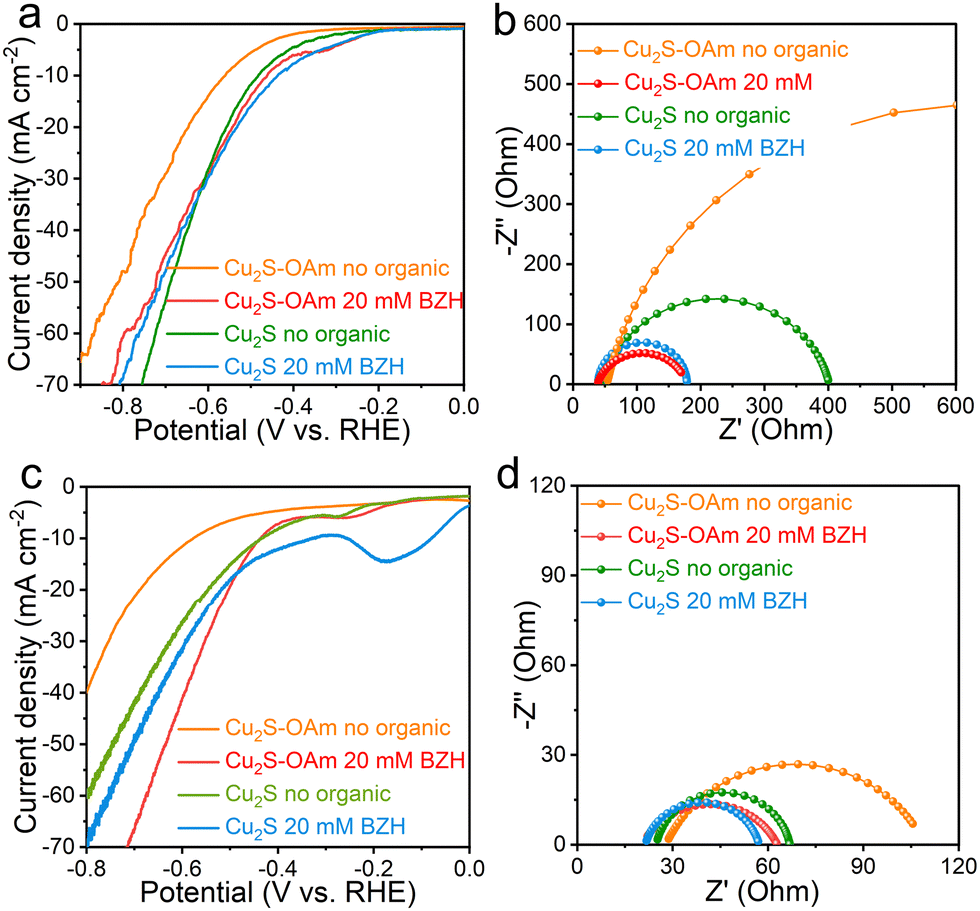 | ||
| Fig. 3 (a) LSV curves and (b) Nyquist plots at −0.7 V vs. RHE of Cu2S–OAm and Cu2S in 1 M sodium acetate–acetic acid electrolyte (pH = 5.2) with and without BZH at room temperature; (c) LSV curves and (d) Nyquist plot at −0.7 V vs. RHE of Cu2S–OAm and Cu2S in 1 M potassium carbonate–potassium bicarbonate electrolyte (pH = 9) with or without BZH at room temperature. | ||
LSV curves depend on charge transfer frequency. They are influenced by mass transport in the electrode and solution, the intrinsic catalytic properties and the number of available adsorption and reaction sites. Thus processes that do not involve charge transfer but potentially blocking/releasing reaction sites such as the ketyl radical conversion to BA through reaction with a Had play also an important role. EIS spectra were used for a more precise characterization of the charge transfer mechanisms, without the involvement of site density and occupancy.
EIS spectra of the two electrodes at −0.7 V vs. RHE in the presence and absence of BZH show one semicircle associated with the impedance of the charge transfer from the electrode surface to the electrolyte species (Rct). The Rct of Cu2S–OAm in the absence of BZH is significantly larger than that of Cu2S, which is consistent with the inhibition of the H+ adsorption and H2 evolution being related not to a lower site density but to a larger barrier for electron transfer to H+ in solution probably related to the long OAm chains. We observe the series resistance (Rs) to slightly decrease in the presence of BZH, which is related to an increase of the electrolyte conductivity in the presence of the generated ph-HCO-H3O+ and ketyl radicals. Besides, both, Cu2S and especially Cu2S–OAm electrodes show much smaller Rct values in the presence of BZH. This is consistent with LSV data for Cu2S–OAm but it is in contrast with LSV data for Cu2S. The smaller Rct is associated with the easier electron transfer from the electrode to BZH and formation of ketyl radical than to H+ to form Had. This result, combined with LSV data, shows the slower kinetics detected in the presence of BZH to be related to the BZH radical conversion to BA instead of the ketyl radical formation. The charge transfer resistance of Cu2S–OAm in the presence of BZH is slightly smaller than that of Cu2S, which is surprising taking into account the presence of OAm hindering charge transfer to species in solution. We associate these results with the hydrophobic surface of Cu2S–OAm that leads to an enrichment of BZH, facilitating electron transfer to ph-HCO-H3O+. Also, the possibility of partial electron transfer to OAm in Cu2S–OAm cannot be ruled out.
In an acidic solution, under an applied voltage, the OAm of the Cu2S–OAm surface may accept electrons and could be also replaced by H+.38 Therefore, the stability of the Cu2S and Cu2S–OAm electrode in 1 M sodium acetate–acetic acid electrolyte (pH = 5.2) was further analyzed (Fig. S4, ESI†). The repetitive CV curves showed Cu2S to have good stability both with and without BZH. In contrast, the current density obtained from the Cu2S–OAm electrode was not constant. It increased in an electrolyte containing 20 mM BZH and decreased in the pure electrolyte. These results indicate that the OAm ligand undergoes slight reaction/substitution. Still, after more than 20 cycles, the effect of OAm on the Cu2S–OAm electrode is clearly noticed (Fig. S5, ESI†).
Results obtained in alkaline conditions, using glassy carbon with 1 M potassium carbonate–potassium bicarbonate electrolyte (pH = 9.0), are displayed in Fig. 3d and f. In these conditions, due to the significant suppression of HER, the concentration of ketyl radicals is expected to increase, resulting in an enhancement of their self-coupling. Indeed, in the absence of BZH, a clear decrease in the HER-related current densities is observed for both electrode materials. LSV curves show the current densities to significantly increase when adding BZH into the system for Cu2S–OAm (Fig. 3d), displaying a similar onset potential as in acidic conditions, but providing overall lower current densities at higher negative voltages due to the lower HER contribution. For Cu2S, current densities show a much slighter variation in the presence of BZH, as in the acidic case.
EIS spectra of the two electrodes in basic conditions at −0.7 V vs. RHE are displayed in Fig. 3f. A notable decrease of Rct is noticed in alkaline conditions compared with acidic ones in the absence of BZH, associated with the enhancement of radical–radical coupling. At low pH, the hydrogen binding strength is lower due to the surrounding hydronium ions,39 which facilitates the formation of Had that combines with the ketyl radicals to produce benzyl alcohol. As the pH increases, the formation of Had requires overcoming a higher energy barrier. Thus radicals are more inclined to undergo self-coupling, which further accelerates the charge transfer and radical formation. With the introduction of BZH, both electrodes display similar tendencies as in acidic conditions, with a notable decrease of the Rct attributed to the formation of ketyl radicals.
As observed from the CV curves (Fig. S6, ESI†), the performance of the Cu2S electrode was stable both with and without BZH (Fig. S6a and b, ESI†). In contrast, the current density increased for Cu2S–OAm electrodes in the pure electrolyte, indicating moderate stability in these conditions, potentially due to ligand displacement with –OH.38 This instability was not observed in the presence of BZH (Fig. S7, ESI†), which indicates a smooth and efficient transfer of charge to BZH.
To quantify the reaction products, additional electrocatalytic measurements were carried out with the materials supported on CC using a constant reaction time of 20 min. Different pH, voltage, and temperature conditions were tested to evaluate the effect of these parameters on the BZH conversion and product selectivity.
Fig. 4 shows the effect of the applied potential on the BZH conversion and selectivity. Under acidic conditions (Fig. 4a), at a low voltage of −0.4 V vs. RHE, both Cu2S and Cu2S–OAm catalysts exhibit relatively low BZH conversion (∼5%), and notable selectivity towards BA, especially Cu2S. This result is attributed to the hydrogen bonding to the catalyst surface, forming Cu–H bonds at low negative voltages. Then, this H is combined with ketyl radical.40 As the negative voltage increases, the conversion increases. Additionally, as increasing the voltage, the selectivity of the two electrodes towards the conversion of BZH into BA first decreases and then increases again. The voltage increase elevates the electrochemical potential at the electrode-solution interface, augmenting the formation of Had, thereby bolstering BA selectivity. As expected, Cu2S–OAm exhibited higher selectivity to HDB at all voltages due to the inhibited formation of Had. The slight decrease in HDB selectivity obtained for Cu2S–OAm at high voltage may be related to the partial OAm reaction/replacement from the Cu2S surface.
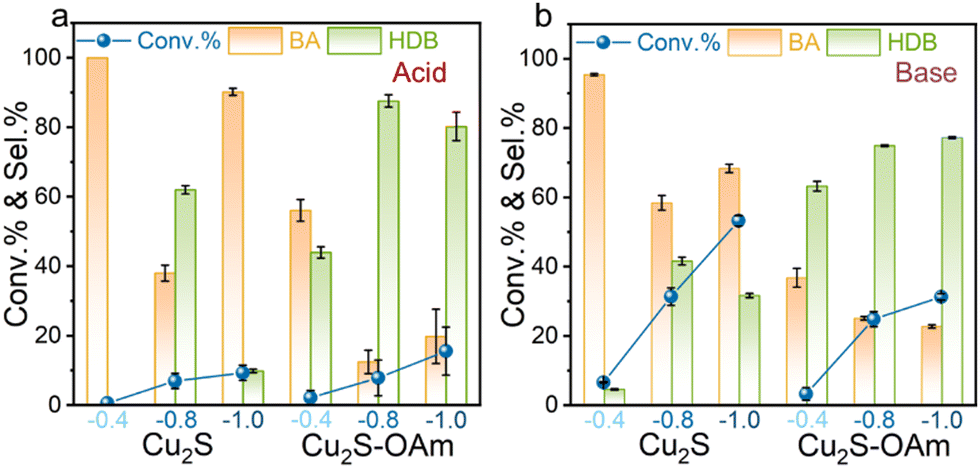 | ||
| Fig. 4 BZH conversion and selectivity toward BA and HDB after 20 min reaction on Cu2S and Cu2S–OAm electrodes at 0.4, −0.8, −1.0 V vs. RHE, 25 °C in (a) 1 M sodium acetate–acetic acid solution (pH = 5.2) with 20 mM BZH; (b) 1 M potassium carbonate–potassium bicarbonate solution (pH = 9.0) with 20 mM BZH. | ||
Under basic conditions (Fig. 4b), a substantial increase in BZH conversion is measured, but the selectivity trends with the applied voltage remain unchanged. Notably, the selectivity of Cu2S–OAm towards the conversion of BZH into HDB increases with the voltage, which is consistent with good catalyst stability.
The reactant concentration effect was also analyzed. The results are summarized in Table S1 (ESI†). It can be observed that the BZH conversion is slightly increased with higher reactant concentration within the same reaction time on different pH and the same electrode materials, while the selectivity towards BA or HDB shows no significant change on the same electrode materials.
A temperature increase also results in an elevation of the material surface Fermi level thus leading to a decrease of the charge transfer resistance and the formation of additional Had. Therefore, a similar dependence to that obtained for the voltage is expected. The difference lies in that the temperature also accelerates the mass transfer efficiency in the solution. At −0.8 V vs. RHE, the Cu2S selectivity towards BA increased with temperature both in acid and alkaline conditions owing to the higher Had formed. The Cu2S selectivity towards BA is higher under acidic conditions compared to alkaline in the whole temperature range tested. For Cu2S–OAm, the selectivity towards HDB decreased with temperature in acidic conditions, owing to the Had increase. However, the HDB selectivity increased with temperature under alkaline conditions (Fig. 5).
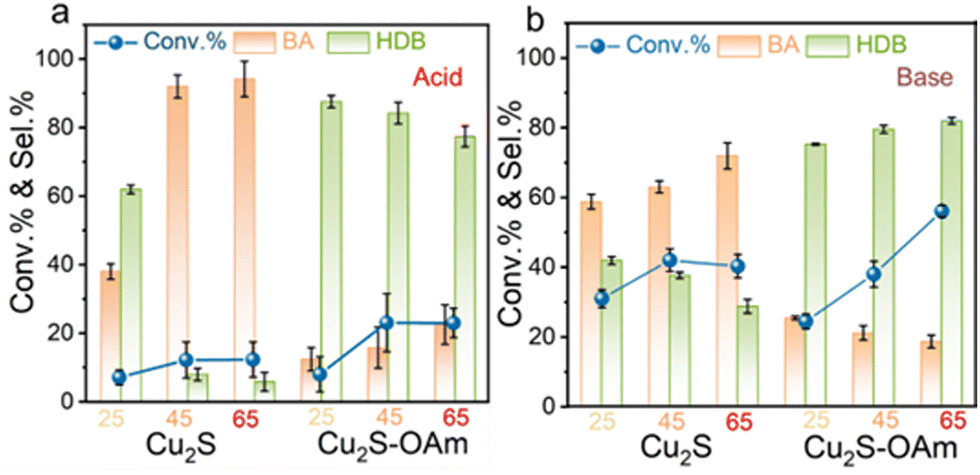 | ||
| Fig. 5 BZH conversion and selectivity toward BA and HDB after 20 min reaction on Cu2S and Cu2S–OAm electrodes at −0.8 vs. RHE, 25 °C, 45 °C or 65 °C in (a) 1 M sodium acetate–acetic acid solution (pH = 5.2) with 20 mM BZH; (b) 1 M potassium carbonate–potassium bicarbonate solution (pH = 9.0) with 20 mM BZH. | ||
To further understand the effect of temperature on mass transfer and the acceleration of the reaction rate, EIS measurements at different temperatures were carried out on the catalysts supported on glassy carbon. From these results, the corresponding activation energy barriers were calculated (Fig. 6 and Fig. S8, ESI†). As pH increased, the reaction energy barrier in Cu2S decreased from 70 kJ mol−1 to 44 kJ mol−1. In contrast, the energy barrier in Cu2S–OAm increased from 46 kJ mol−1 to 61 kJ mol−1. These results imply the higher sterical barriers for the formation of Had to combine with the hydroxyl carbon of the intermediate ketyl radical in alkaline than in acidic conditions, while BZH can combine with H+ in acidic conditions to form ketyl radical more easily than in alkaline.
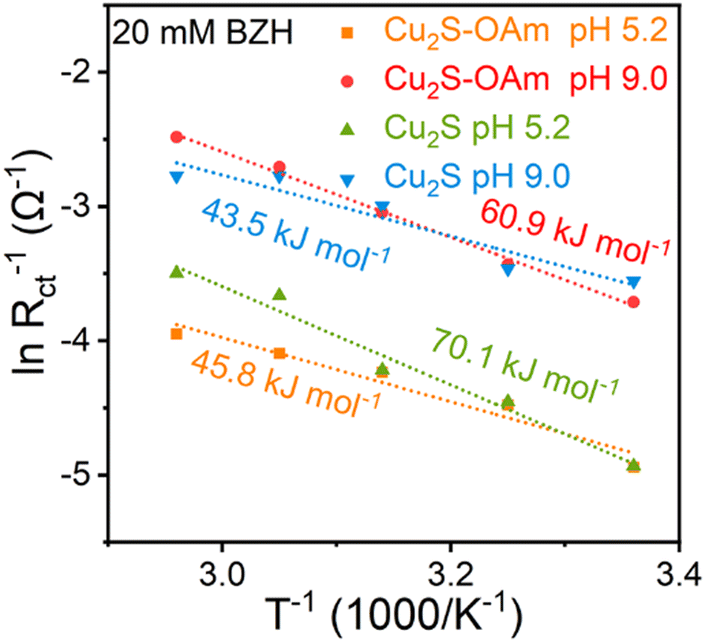 | ||
| Fig. 6 Activation energies calculated from the Nyquist plot. | ||
Based on the above results, it is clear that a high selectivity for obtaining HDB by BZH electrochemical reduction can be achieved by adjusting the pH, applied voltages, catalyst components and catalyst surface properties. The energy barrier for the formation of the high-energy intermediate species Had increases as the pH increases, leading to a decrease in the concentration of Had on the catalyst surface, thereby increasing the chances of radical dimerization for the formation of HDB. For catalysts with exposed active sites, applying a higher voltage leads to surface electron accumulation, causing enrichment of H+ on the EDL solution side, and increasing the possibility of forming Had and BA. Thus, blocking the active sites of the catalyst surface with organic ligands to prevent the formation of Had can improve the selectivity of HDB independently of pH.
4. Conclusions
In summary, Cu2S–OAm and Cu2S were synthesized using a one-pot synthetic approach and a post-treatment process. By comparing their electrocatalytic performance in the electrochemical reduction of BZH, we conclude that OAm prevents the organic substrate and the H proton from reaching the Cu2S active sites. Consequently, hydrogen cannot become activated to combine with ketyl radicals to form BA. At the same time, the organic BZH and its ketyl radicals concentrate near the OAm ligands on the catalyst surface due to their similar polarity, thus promoting selectivity and conversion towards forming HDB.Author contributions
L. Gong: conceptualization and writing – original draft; Shiling Zhao and Tanja Kallio: investigation; Jing Yu, Jordi Arbiol and Junshan Li: formal analysis; Paulina R. Martínez-Alanis: supervision and funding acquisition and writing – review & editing; Mariano Calcabrini and Maria Ibáñez: methodology; Andreu Cabot: supervision and writing – review & editing.Data availability
The data supporting this article have been included as part of the ESI.†Conflicts of interest
There are no conflicts to declare.Acknowledgements
L. Gong and J. Yu thank the China Scholarship Council for the scholarship support. ICN2 acknowledges funding from Generalitat de Catalunya 2021SGR00457. This study is part of the Advanced Materials programme and was supported by MCIN with funding from European Union NextGenerationEU (PRTR-C17.I1) and by Generalitat de Catalunya. The authors thank support from the project NANOGEN (PID2020-116093RB-C43), funded by MCIN/AEI/10.13039/501100011033/and by “ERDF A way of making Europe”, by the “European Union”. ICN2 is supported by the Severo Ochoa program from Spanish MCIN/AEI (Grant No.: CEX2021-001214-S) and is funded by the CERCA Programme/Generalitat de Catalunya. Part of the present work has been performed in the framework of Universitat Autònoma de Barcelona Materials Science PhD program. Authors acknowledge the use of instrumentation as well as the technical advice provided by the Joint Electron Microscopy Center at ALBA (JEMCA). ICN2 acknowledges funding from Grant IU16-014206 (METCAM-FIB) funded by the European Union through the European Regional Development Fund (ERDF), with the support of the Ministry of Research and Universities, Generalitat de Catalunya. ICN2 is founding member of e-DREAM.41Notes and references
- G. Zeng, Q. Sun, S. Horta, S. Wang, X. Lu, C. Y. Zhang, J. Li, J. Li, L. Ci, Y. Tian, M. Ibáñez and A. Cabot, Adv. Mater., 2024, 36, 2305128 CrossRef CAS PubMed.
- C. Huang, J. Yu, C. Li, Z. Cui, C. Zhang, C. Zhang, B. Nan, J. Li, J. Arbiol and A. Cabot, Adv. Funct. Mater., 2023, 33, 2305624 CrossRef CAS.
- U. Sanyal, K. Koh, L. C. Meyer, A. Karkamkar and O. Y. Gutiérrez, J. Appl. Electrochem., 2021, 51, 27–36 CrossRef CAS.
- Y. P. Wijaya, K. J. Smith, C. S. Kim and E. L. Gyenge, Green Chem., 2020, 22, 7233–7264 RSC.
- S. A. Akhade, N. Singh, O. Y. Gutiérrez, J. Lopez-Ruiz, H. Wang, J. D. Holladay, Y. Liu, A. Karkamkar, R. S. Weber, A. B. Padmaperuma, M.-S. Lee, G. A. Whyatt, M. Elliott, J. E. Holladay, J. L. Male, J. A. Lercher, R. Rousseau and V.-A. Glezakou, Chem. Rev., 2020, 120, 11370–11419 CrossRef CAS PubMed.
- K. Li and Y. Sun, Chem. – Eur. J., 2018, 24, 18258–18270 CrossRef CAS PubMed.
- J. Li, L. Li, X. Ma, X. Han, C. Xing, X. Qi, R. He, J. Arbiol, H. Pan, J. Zhao, J. Deng, Y. Zhang, Y. Yang and A. Cabot, Adv. Sci., 2023, 10, 2300841 CrossRef CAS PubMed.
- J. Li, X. Tian, X. Wang, T. Zhang, M. C. Spadaro, J. Arbiol, L. Li, Y. Zuo and A. Cabot, Inorg. Chem., 2022, 61, 13433–13441 CrossRef CAS PubMed.
- Z. Zhang, L. Bian, H. Tian, Y. Liu, Y. Bando, Y. Yamauchi and Z.-L. Wang, Small, 2022, 18, 2107450 CrossRef CAS PubMed.
- M. Luo, J. Yang, X. Li, M. Eguchi, Y. Yamauchi and Z.-L. Wang, Chem. Sci., 2023, 14, 3400–3414 RSC.
- J. Li, L. Li, X. Ma, J. Wang, J. Zhao, Y. Zhang, R. He, Y. Yang, A. Cabot and Y. Zhu, Nano Res., 2024, 17, 2328–2336 CrossRef CAS.
- J. Li, L. Li, X. Ma, X. Han, C. Xing, X. Qi, R. He, J. Arbiol, H. Pan, J. Zhao, J. Deng, Y. Zhang, Y. Yang and A. Cabot, Adv. Sci., 2023, 10, 2300841 CrossRef CAS PubMed.
- Z. J. Schiffer and K. Manthiram, Joule, 2017, 1, 10–14 CrossRef.
- J. T. Bhanushali, I. Kainthla, R. S. Keri and B. M. Nagaraja, ChemistrySelect, 2016, 1, 3839–3853 CrossRef CAS.
- D. C. Cantu, A. B. Padmaperuma, M.-T. Nguyen, S. A. Akhade, Y. Yoon, Y.-G. Wang, M.-S. Lee, V.-A. Glezakou, R. Rousseau and M. A. Lilga, ACS Catal., 2018, 8, 7645–7658 CrossRef CAS.
- C. Xu, E. Paone, D. Rodríguez-Padrón, R. Luque and F. Mauriello, Chem. Soc. Rev., 2020, 49, 4273–4306 RSC.
- M. T. Bender, X. Yuan, M. K. Goetz and K.-S. Choi, ACS Catal., 2022, 12, 12349–12368 CrossRef CAS.
- J. Yu, P. Zhang, L. Li, K. Li, G. Zhang, J. Liu, T. Wang, Z.-J. Zhao and J. Gong, Nat. Commun., 2022, 13, 7909 CrossRef CAS PubMed.
- S. Huang, B. Gong, Y. Jin, P. H. L. Sit and J. C.-H. Lam, ACS Catal., 2022, 12, 11340–11354 CrossRef CAS.
- L. C. Meyer, U. Sanyal, K. A. Stoerzinger, K. Koh, J. L. Fulton, D. M. Camaioni, O. Y. Gutiérrez and J. A. Lercher, ACS Catal., 2022, 12, 11910–11917 CrossRef CAS.
- X. H. Chadderdon, D. J. Chadderdon, J. E. Matthiesen, Y. Qiu, J. M. Carraher, J.-P. Tessonnier and W. Li, J. Am. Chem. Soc., 2017, 139, 14120–14128 CrossRef CAS PubMed.
- H. Liu, D. M. Patel, Y. Chen, J. Lee, T.-H. Lee, S. D. Cady, E. W. Cochran, L. T. Roling and W. Li, ACS Catal., 2022, 12, 14072–14085 CrossRef CAS.
- J. Anibal and B. Xu, ACS Catal., 2020, 10, 11643–11653 CrossRef CAS.
- P. Nilges and U. Schröder, Energy Environ. Sci., 2013, 6, 2925–2931 RSC.
- T. Guena and D. Pletcher, Acta Chem. Scand., 1998, 52, 23–31 CrossRef CAS PubMed.
- X. H. Chadderdon, D. J. Chadderdon, J. E. Matthiesen, Y. Qiu, J. M. Carraher, J. P. Tessonnier and W. Li, J. Am. Chem. Soc., 2017, 139, 14120–14128 CrossRef CAS PubMed.
- J. Anibal, A. Malkani and B. Xu, Catal. Sci. Technol., 2020, 10, 3181–3194 RSC.
- L. Gong, C. Y. Zhang, J. Li, G. Montaña-Mora, M. Botifoll, T. Guo, J. Arbiol, J. Y. Zhou, T. Kallio, P. R. Martínez-Alanis and A. Cabot, ACS Appl. Mater. Interfaces, 2024, 16, 6948–6957 CrossRef CAS PubMed.
- L. Gong, C. Y. Zhang, X. Mu, X. Han, J. Li, J. Arbiol, J. Y. Zhou, T. Kallio, P. R. Martnez-Alanis and A. Cabot, J. Chem. Eng., 2024, 479, 147612 CrossRef CAS.
- J. Wu, D. Liang, X. Song, T. Liu, T. Xu, S. Wang and Y. Zou, J. Energy Chem., 2022, 71, 411–417 CrossRef CAS.
- K. Koh, U. Sanyal, M.-S. Lee, G. Cheng, M. Song, V.-A. Glezakou, Y. Liu, D. Li, R. Rousseau, O. Y. Gutierrez, A. Karkamkar, M. Derewinski and J. A. Lercher, Angew. Chem., 2020, 59, 1501–1505 CrossRef CAS PubMed.
- F. Wang and S. S. Stahl, Acc. Chem. Res., 2020, 53, 561–574 CrossRef CAS PubMed.
- R. Cheng, Y. Min, H. Li and C. Fu, Nano Energy, 2023, 115, 108718 CrossRef CAS.
- J. Heo, H. Ahn, J. Won, J. G. Son, H. K. Shon, T. G. Lee, S. W. Han and M.-H. Baik, Science, 2020, 370, 214–219 CrossRef CAS PubMed.
- A. Tang, S. Qu, K. Li, Y. Hou, F. Teng, J. Cao, Y. Wang and Z. Wang, Nanotechnology, 2010, 21, 285602 CrossRef PubMed.
- Y. Zhang, C. Xing, Y. Liu, M. C. Spadaro, X. Wang, M. Li, K. Xiao, T. Zhang, P. Guardia, K. H. Lim, A. O. Moghaddam, J. Llorca, J. Arbiol, M. Ibáñez and A. Cabot, Nano Energy, 2021, 85, 105991 CrossRef CAS.
- A. Shavel, M. Ibáñez, Z. Luo, J. De Roo, A. Carrete, M. Dimitrievska, A. Genç, M. Meyns, A. Pérez-Rodríguez, M. V. Kovalenko, J. Arbiol and A. Cabot, Chem. Mater., 2016, 28, 720–726 CrossRef CAS.
- L. Lu, B. Lou, S. Zou, H. Kobayashi, J. Liu, L. Xiao and J. Fan, ACS Catal., 2018, 8, 8484–8492 CrossRef CAS.
- I. K. M. Yu, F. Deng, X. Chen, G. Cheng, Y. Liu, W. Zhang and J. A. Lercher, Nat. Commun., 2022, 13, 7154 CrossRef CAS PubMed.
- B. M. Tackett, D. Raciti, A. R. Hight Walker and T. P. Moffat, J. Phys. Chem. Lett., 2021, 12, 10936–10941 CrossRef CAS PubMed.
- R. Ciancio, R. E. Dunin-Borkowski, E. Snoeck, M. Kociak, R. Holmestad, J. Verbeeck, A. I. Kirkland, G. Kothleitner and J. Arbiol, Microsc. Microanal., 2022, 28, 2900–2902 CrossRef.
Footnote |
| † Electronic supplementary information (ESI) available. See DOI: https://doi.org/10.1039/d4ya00334a |
| This journal is © The Royal Society of Chemistry 2024 |