
Self-propelling bacteria-based magnetic nanoparticles (BacMags) for targeted magnetic hyperthermia therapy against hypoxic tumors†
Tashmeen
Kaur
 and
Deepika
Sharma
*
and
Deepika
Sharma
*
Institute of Nano Science and Technology, Knowledge City, Sector 81, Mohali, Punjab-140306, India. E-mail: deepika@inst.ac.in
First published on 14th March 2024
Abstract
Magnetic hyperthermia-based cancer therapy (MHCT) holds great promise as a non-invasive approach utilizing heat generated by an alternating magnetic field for effective cancer treatment. For an efficacious therapeutic response, it is crucial to deliver therapeutic agents selectively at the depth of tumors. In this study, we present a new strategy using the naturally occurring tumor-colonizing bacteria Escherichia coli (E. coli) as a carrier to deliver magnetic nanoparticles to hypoxic tumor cores for effective MHCT. Self-propelling delivery agents, “nano-bacteriomagnets” (BacMags), were developed by incorporating anisotropic magnetic nanocubes into E. coli which demonstrated significantly improved hyperthermic performance, leading to an impressive 85% cell death in pancreatic cancer. The in vivo anti-cancer response was validated in a syngeneic xenograft model with a 50% tumor inhibition rate within 20 days and a complete tumor regression within 30 days. This proof-of-concept study demonstrates the potential of utilizing anaerobic bacteria for the delivery of magnetic nanocarriers as a smart therapeutic approach for enhanced MHCT.
 Deepika Sharma | Dr Deepika Sharma serves as an Assistant Professor (Scientist-D) at the Institute of Nano Science and Technology (INST) in India, specializing in innovative cancer therapies. Her expertise spans magnetic hyperthermia, bacterial-mediated nano-therapy, and the utilization of natural bio-actives with anti-cancer properties. A Ph.D. graduate in Biotechnology from Punjabi University, Dr Sharma's contributions to the field are documented in more than 36 publications with more than 1700 citations in esteemed journals such as Trends in Biotechnology, ACS Applied Materials & Interfaces, Nanoscale, Biomaterial Advances, etc. She is an active member of the Indian Association of Cancer Research (IACR). Beyond academia, Dr Sharma pursues interests such as paragliding and hiking. |
1. Introduction
Solid tumors are the most prevalent and deadly form of cancer worldwide. Hypoxia, resulting from the rapid growth of tumors exceeding the oxygen supply and the obstruction of the blood flow by abnormal blood vessels, is a common feature in many solid tumors.1 The hypoxic tumor microenvironment poses a significant challenge to cancer chemotherapy as it reduces the susceptibility of cancer cells to anticancer drugs. Moreover, the limited effectiveness of current nanocarriers, such as liposomes, micelles and polymeric nanoparticles, in reaching hypoxic regions further compounds this problem. These nanocarriers face several targeting limitations, including dependency on systemic circulation, lack of a propulsive force to penetrate beyond diffusion limits, and the absence of sensory-based displacement capabilities to target the hypoxic zones.2–5 Consequently, it is important to find alternative strategies, including the use of a natural agent with appropriate characteristics for targeting solid tumors.To increase the therapeutic effectiveness of nanocarriers in hypoxic tumor zones, efforts have been made to produce hypoxic zone-targeting agents with propulsive properties. Flagellated bacteria which exhibit self-propulsion in response to environmental, physical and chemical stimuli represent promising candidates as hypoxia targeting self-propelling agents.6–8 Notably, several facultative and obligate anaerobes have a natural preference for growing and colonizing hypoxic and acidic tumor environments, thereby prompting attempts to engineer bacteria, such as Escherichia coli,9,10Bifidobacterium,11,12 and Salmonella,13,14 as controllable nanorobotic vehicles to deliver therapeutic payloads for solid tumor treatment.15
On the other hand, magnetic hyperthermia-based cancer therapy (MHCT) relies on the ability of magnetic nanoparticles (MNPs) to induce heat in response to an external alternating current magnetic field (AMF).16,17 The oscillation of magnetic moments in MNPs generates a localized temperature rise, selectively killing heat-sensitive tumor cells with minimal adverse effects on healthy cells.18,19 However, the use of MNPs in cancer therapeutics presents various challenges. Many MNPs exhibit poor heating efficiency within biosafety limits represented by Hergt's biosafety parameters (product of frequency (f) and field amplitude (H), i.e., H × f value <5 × 10⁹ A m−1 s−1).20,21 Additionally, the ineffective penetration of MNPs into hypoxic tumor cores due to pathological pressure gradients, such as excessively high interstitial fluid pressure and solid tissue pressure, poses a significant obstacle to MHCT.22,23 Therefore, it is necessary to develop alternative strategies utilizing MNPs capable of delivering efficient heat at tumor depths.24
Recent studies have focussed on strategies to enhance the hyperthermic performance of MNPs by regulating their physical properties such as tuning the size, magnetization and shape of MNPs.17,25,26 Synthesizing nanoparticles with various structural morphologies allows control over shape anisotropy, improving hysteresis losses and the specific absorption rate (SAR) for hyperthermia. For example, magnetic nanorods have shown higher hyperthermic efficacy due to their high aspect ratio.27 However, limited effort has been made to address the poor penetration of MNPs inside deep tumor depths.
As an alternative approach, in the last few years, a few groups have initiated to investigate the possibility of utilizing magnetotactic bacteria (MTB) as hyperthermic agents.28–30 These studies have mainly focused on assessing the hyperthermic response of either the magnetosomes isolated from Magnetospirillum gryphiswaldense MSR-1 and Magnetospirillum magneticum strain AMB-1 or the whole intact cells of the magnetotactic bacterium, analyzing their uptake by cancer cells and investigating the cytotoxic potential of MTB post-hyperthermia session in agar phantom models or in vitro models. The initial results have been fascinating and a few in vivo studies have also demonstrated the efficacy of utilizing these bacteria for MHCT. However, the implementation of MTB in cancer therapy poses certain challenges. MTBs are difficult to isolate from complex environments and difficult to grow and maintain in laboratories. Furthermore, MTB suspensions are reported to have a low concentration of magnetosomes, leading to insufficient heat generation/anti-tumor response.31 Tuning the magnetic behaviour of MTB through the control of the biomineralization process of magnetosomes is another significant challenge with the use of MTB for hyperthermia therapy.32
Therefore, in this study, we propose a workaround to overcome the limitations of conventional MHCT by utilizing facultative anaerobic bacteria, E. coli, to deliver MNPs to hard-to-reach tumor hypoxic cores. The use of E. coli negates the above-mentioned limitations of MTB as E. coli is a highly studied well-known model organism that is easily culturable, a part of human flora, and does not require complex culturing conditions. The use of tumor-homing properties of E. coli enables deep penetration into tumors, while anisotropic-shaped MNPs offer high heating efficiency. Similar to our study, a group of researchers used probiotic bacteria Lactobacillus fermentum or Bifidobacteria breve as bioplatforms to densely arrange maghemite nanoparticles on their external surfaces, thus obtaining artificial magnetic bacteria that demonstrate room temperature magnetic behaviour on application of a high magnetic field and good viability.33 However, a comprehensive study to investigate the MHCT potential of such artificial magnetic bacteria is missing.
Thus, in this work, we carried out a detailed investigation by engineering E. coli to fabricate MNPs of two different morphologies with an aim to evaluate the MHCT potential of these hybrid nanovectors as effective delivery and therapeutic agents for cancer therapy (Scheme 1). In vitro studies in 3D tumor spheroids demonstrated that the resulting hybrid bacteria-based magnetic nanoparticle system (BacMags) not only assists in accessing tumor cores, but also synergizes with the superior heating efficiency of anisotropic MNPs, resulting in an increased heat rise and subsequent ROS production yielding an assertive anticancer response for MHCT. In vivo studies in C57BL/6 mice further confirmed the safety and efficacy of the BacMag-mediated hyperthermia approach.
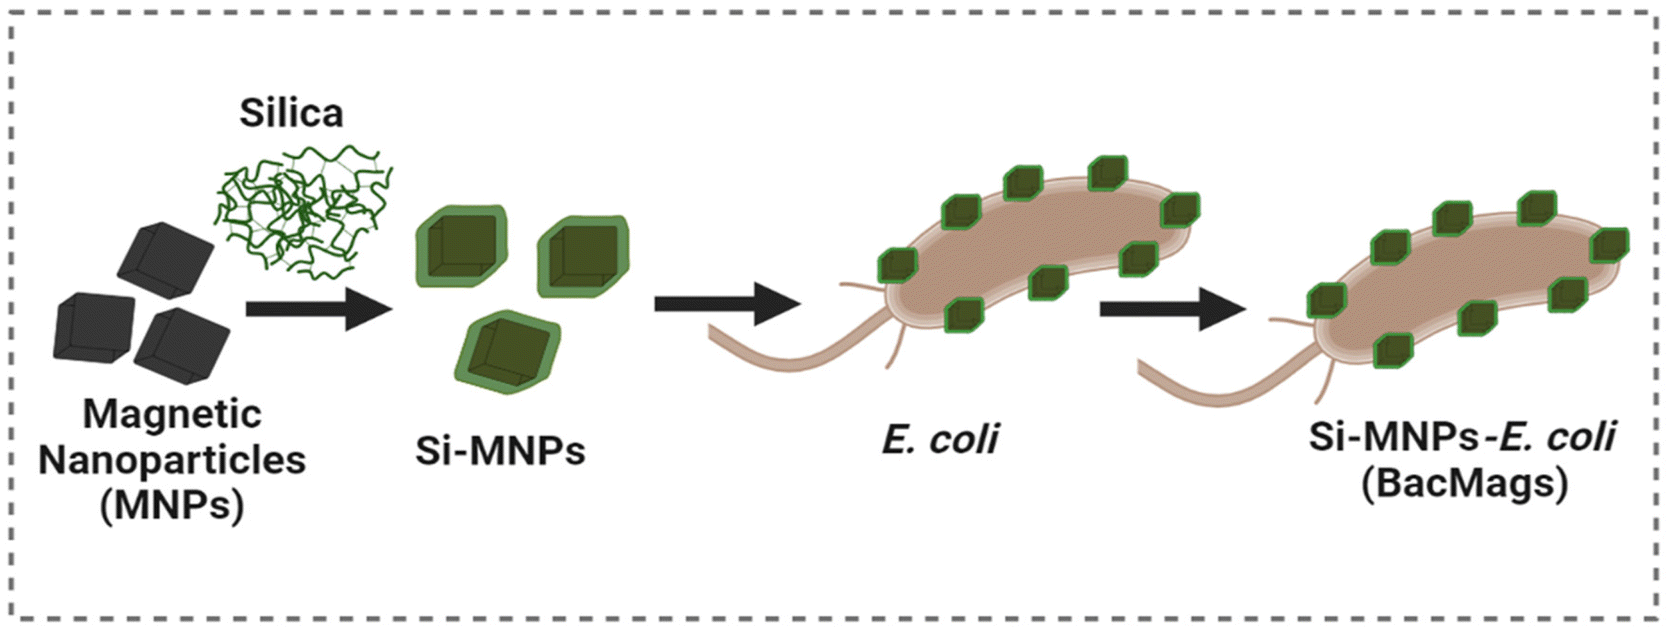 | ||
| Scheme 1 Schematic illustration of the combination of E. coli with Si-MNPs for MHCT. | ||
2. Results and discussion
2.1. Characterization of MNPs and their biocompatibility
Prior to the preparation of BacMags, silica-coated MNPs with two different morphologies, spherical (Si-NSs) (Fig. 1a) and cubical (Si-NCs) (Fig. 1e), were synthesised by hydrothermal and co-precipitation methods, respectively, to be utilised as a cargo for the delivery by E. coli. The morphology and hydrodynamic size of MNPs were confirmed using transmission electron microscopy (TEM) and dynamic light scattering (DLS). TEM analysis revealed the spherical shape of Si-NSs with a mean size of 40.6 ± 7.2 nm and a uniform coating thickness of ∼4.2 nm (Fig. 1a and b). The cubical morphology of Si-NCs was observed with a mean size of 67.9 ± 4.8 nm and a coating thickness of ∼5 nm (Fig. 1e and f). The mean size of the Si-NSs and Si-NCs was calculated using ImageJ software from the size distribution histograms of the MNPs obtained from the respective TEM images (Fig. 1i and j).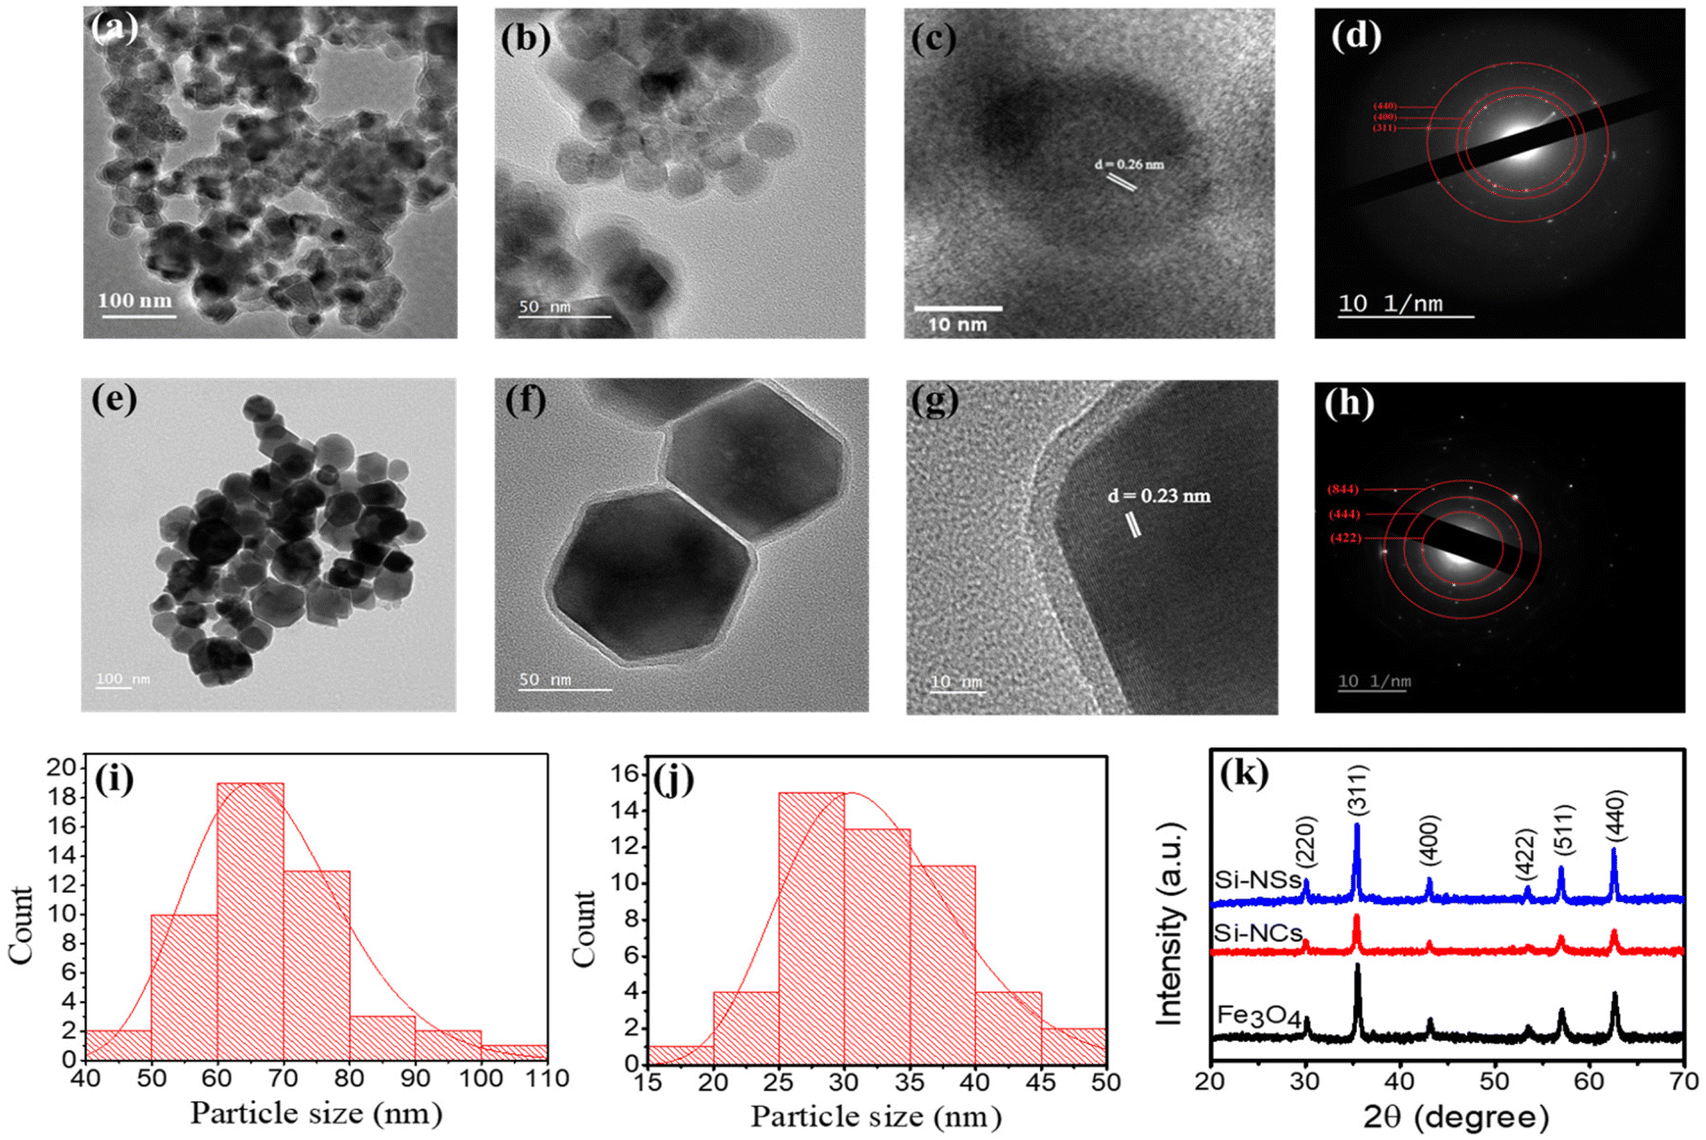 | ||
| Fig. 1 Characterization of the synthesised MNPs: (a–c) and (e–g) TEM images of Si-NSs and Si-NCs, respectively, at different scales; (d) and (h) SAED patterns and (i) and (j) size distribution histograms of Si-NSs and Si-NCs, respectively; and (k) XRD patterns of uncoated Fe3O4 and silica-coated MNPs. | ||
The average hydrodynamic size as observed from the DLS measurements was found to be 161.2 ± 13.0 nm for Si-NSs and 193.4 ± 7.1 nm for Si-NCs (Fig. S1a and b†). Furthermore, the d-spacing calculated from the HR-TEM (Fig. 1(c and g)) of 0.26 nm for Si-NSs and 0.22 nm for Si-NCs corresponds to the 311 and 222 planes of Fe3O4, respectively.34–36 The distinct rings in the SAED patterns (Fig. 1d and h) demonstrated the crystalline character of the synthesised Si-MNPs. The presence of the 311, 400, and 440 planes in Si-NSs and the 422, 444, and 844 planes in Si-NCs further confirmed the development of Fe3O4 MNPs.37,38
The crystallite structure of the MNPs was determined to be Fe3O4 by XRD analysis (Fig. 1k). The peak positions and relative intensities matched well with the standard Fe3O4 powder XRD data, confirming the presence of Fe3O4 without any impurities of other iron oxide phases. The zeta potential of the MNPs exhibited a decrease from −13.0 mV to −34 ± 3.2 mV and from −15.0 mV to −37.0 ± 2.1 mV for Si-NSs and Si-NCs, respectively, after silica functionalization. These findings suggest successful silica coating on both types of MNPs, which is crucial for maintaining their stability in blood circulation (Fig. S1c†).39,40
To further confirm the elemental composition and states of elements in the MNPs, XPS analysis was conducted in the 0–1350 eV region. The survey spectrum of both MNPs indicated the presence of Fe, O and Si elements (Fig. S1d†). Additionally, the high-resolution XPS spectra of Fe 2p and O1s for MNPs revealed characteristic peaks corresponding to Fe+2 and Fe+3 ions, as well as O−2 and O−1 species respectively, confirming the formation of Fe3O4 (Fig. S1e–h†). The silica coating on the MNPs was verified using FTIR analysis (Fig. S1i†). Strong bands attributed to the asymmetric vibrations and in-and out-of-plane bending of Si–O–Si were observed at 1050 and 960 cm−1. Another prominent band at 1225 cm−1 indicated the presence of Si–OH bonds. Furthermore, the band at 570 cm−1 could be attributed to the Si–Fe–O bond, providing additional evidence for the successful silica coating on the MNPs.41,42,44
After confirming the physical properties of the MNPs, their biocompatibility was assessed using the MTT assay on the normal murine fibroblast cell line L929 (Fig. S2†). Both Si-NSs and Si-NCs demonstrated biocompatibility within the tested concentration range from 62.5 to 1000 μg ml−1 for 24 h, indicating their suitability for use as a therapy module.
2.2. Calorimetric hyperthermia profile of MNPs
To evaluate the calorimetric magnetic hyperthermic potential of the Si-MNPs for the preparation of BacMags, the optimum frequency and strength of the AMF were determined. Aqueous Si-MNP (Si-NS) suspensions at a concentration of 1 mg ml−1 were exposed to various frequencies and field strengths (Fig. S3a and b†). Among all the combinations tested, a magnetic field strength–frequency combination of 375 Oe and 165 kHz was chosen for in vitro experiments, as this combination resulted in a heating profile that fell within the hyperthermic window with the specific absorption rate (SAR) of 107 W g−1. Importantly, this combination also adhered to the biosafety Hf value (Fig. S3c and d†).21 It is crucial to note that high values of frequency and AMF amplitude can potentially cause damage to healthy tissues due to the heat generated by eddy currents. Therefore, MNPs should generate sufficient heat within the therapeutic Hf range. As expected, the heat response of the MNPs was dependent on the magnetic field strength and frequency, leading to an increase in SAR with a corresponding increase in H2 and f.Furthermore, the impact of concentration on the hyperthermic performance of MNPs was investigated within the range of 0.5 mg ml−1–1 mg ml−1. Fig. S3e† illustrates that temperature rise induced by Si-NCs was twice as higher as that generated by Si-NSs at all the tested concentrations. These findings suggest that the use of Si-NCs, with their enhanced temperature rise, holds promise for an improved therapeutic outcome for MHCT. This significant increase in temperature can be attributed to the higher anisotropy energy exhibited by the cube-like nanoparticles.17 Anisotropic iron oxide-based nanomaterials, including nanocubes, core–shell nanostructures, and multicore MNPs, have been previously recognized for their exceptional magnetic heating capabilities, displaying specific loss powers significantly higher than those observed with conventional iron oxide nanoparticles utilized for MHCT.
In a study by Kakwere et al., thermoresponsive cubic iron oxide nanoparticles were proposed for their potential hyperthermia and chemotherapy applications due to their excellent heat conversion efficiency.45 In a recent study conducted by our group, cubic MNPs showed the best heating performance due to their high SAR, making them promising for magneto-chemotherapy on glioma cells.17 Additionally, Espinosa et al. employed simultaneous stimulation of iron oxide nanocubes with an AMF and NIR laser irradiation, resulting in an outstanding heating efficiency at clinically acceptable irradiation doses and low iron concentrations.46
In the present study, Si-NCs exhibited higher heating efficiency compared to Si-NSs, as indicated by the higher SAR values (Fig. S3f†). This characteristic is highly desirable for MNPs intended for use in magnetic hyperthermia applications. Interestingly, increasing the concentration of MNPs did not result in a corresponding increase in SAR. Previous reports in the literature support this observation, suggesting that higher MNP concentrations can lead to increased agglomeration and reduced interparticle distance. Consequently, the power dissipation to the medium is reduced, resulting in a decrease in SAR value.45 The highest SAR value of ∼375 W g−1 was achieved for Si-NCs which was more than twice as high as that achieved for Si-NSs at a concentration of 0.5 mg ml−1 MNPs. These findings strongly suggest that Si-NCs hold great potential as hyperthermic agents for MHCT application.
2.3. Functionalization, characterization and hyperthermia profile of BacMags
After establishing the potential of the synthesised Si-MNPs as cargos for bacteria-mediated delivery for MHCT, we utilised streptavidin–biotin interaction to assemble E. coli with Si-MNPs at a concentration of 0.5 mg ml−1 MNPs (equivalent to 0.41 mg Fe ml−1 for Si-NSs and Si-0.38 mg Fe ml−1 for Si-NCs, as measured by ICP-MS). To confirm the formation of BacMags, XPS was employed as an indirect method to determine the elemental composition of E. coli, Si-MNPs (Si-NCs) and the bioconjugated BacMags. The survey spectrum of E. coli (Fig. 2a) displayed characteristic peaks for O, N, C and P which are expected to be present in natural moieties such as bacterial membranes composed of lipids and proteins,46 whereas Si-NSs and Si-NCs exhibited characteristic peaks of Fe, O and Si. In the case of BacMags, peaks corresponding to the elements present in both E. coli and Si-MNPs were observed, indicating a close proximity between the bacteria and the nanoparticles.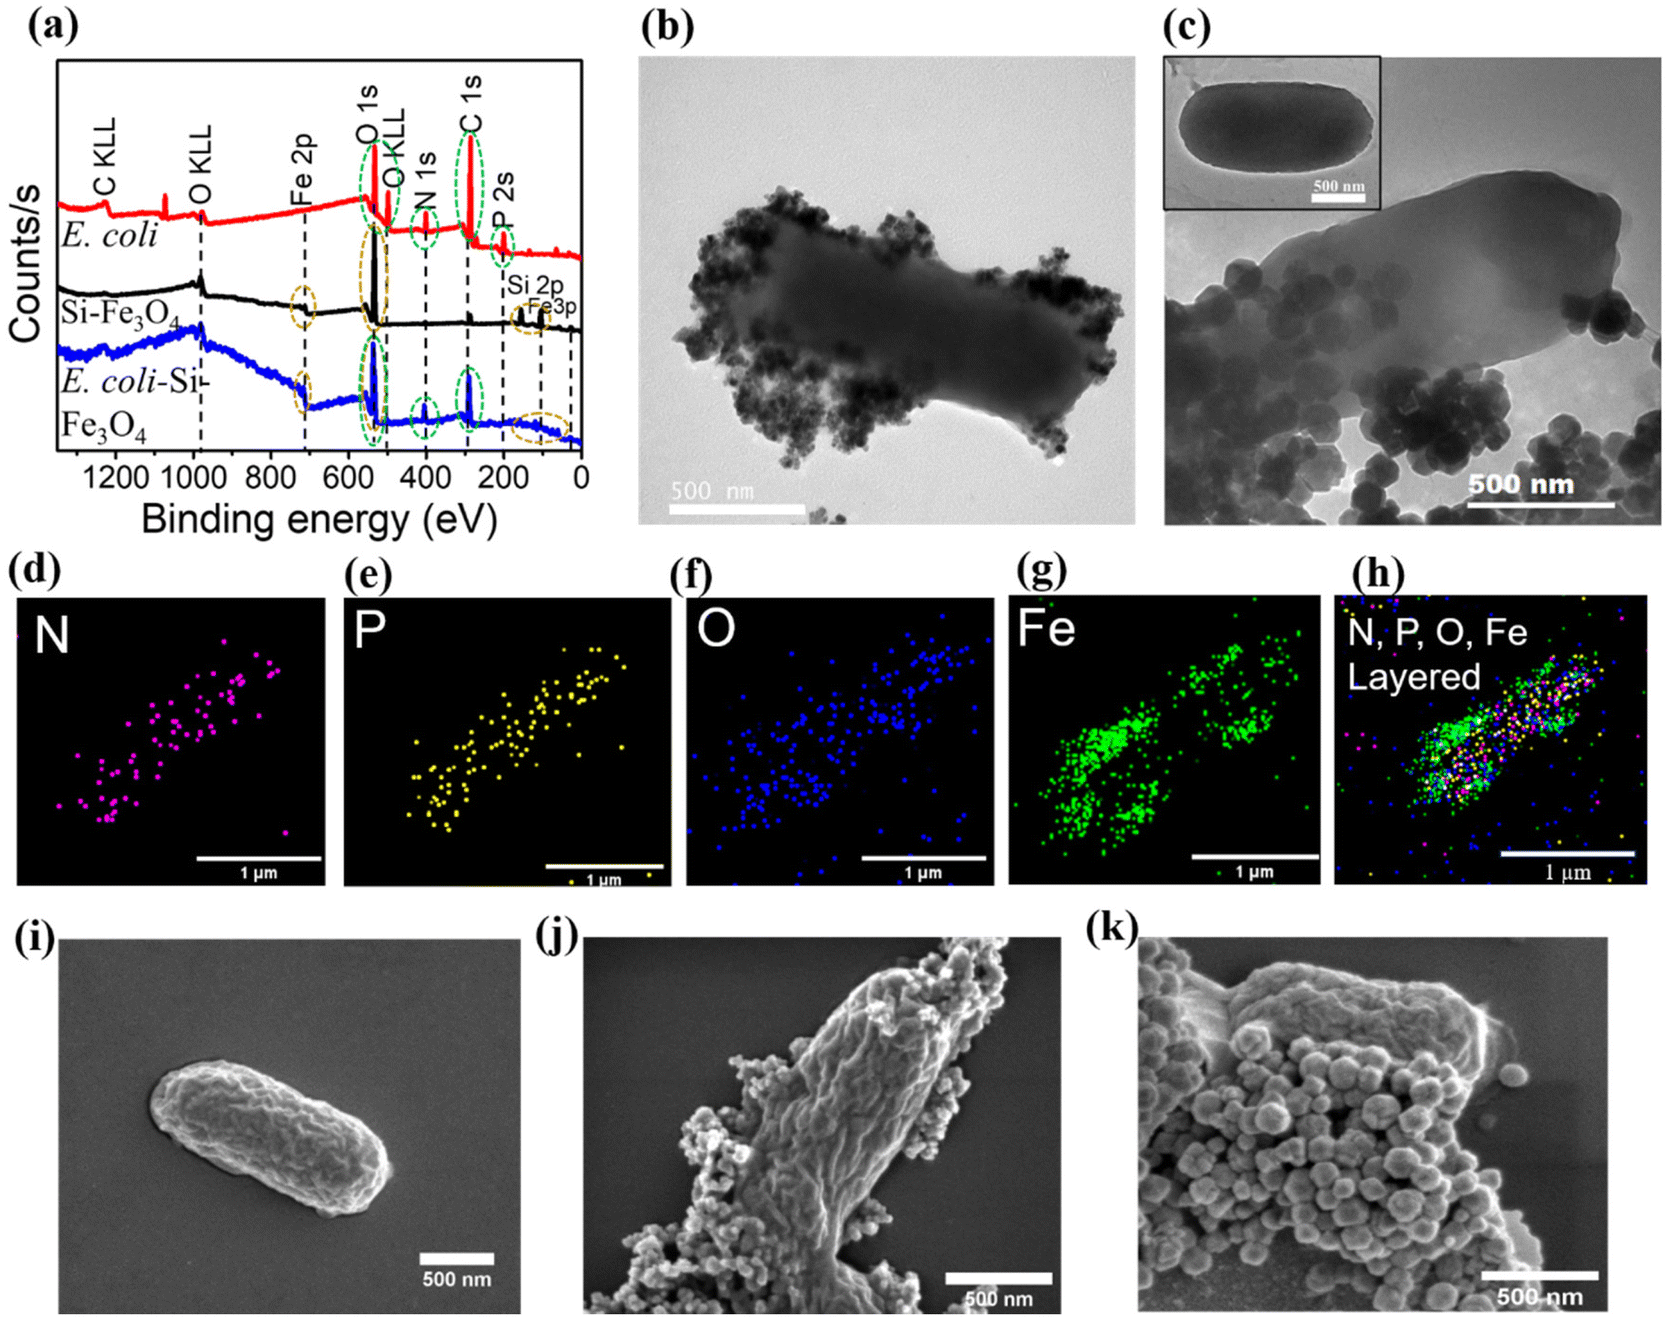 | ||
| Fig. 2 Characterization of BacMags: (a) XPS survey spectra of Si-MNPs, E. coli and BacMags; (b and c) TEM images of Si-NS-BacMag and Si-NC-BacMag, respectively, where the inset of (c) shows E. coli control; elemental mappings of (d) nitrogen, (e) phosphorus, (f) oxygen, (g) iron and (h) merged image of (d–g) of the synthesised BacMags; and SEM images of (i) E. coli, (j) Si-NS-BacMag and (k) Si-NC-BacMag. | ||
For direct visualization and confirmation of BacMag formation, confocal microscopy, TEM and SEM techniques were employed. Fig. S4† displays confocal microscopy images of the prepared BacMags, where the signal from FITC-tagged E. coli was co-localized with the rhodamine-tagged Si-MNPs (Si-NCs), suggesting the physical attachment of the MNPs with E. coli. The TEM images (Fig. 2b and c) demonstrate the successful bioconjugation of Si-NSs and Si-NCs on the surface of E. coli, respectively, while inset in Fig. 2c shows bare E. coli without the Si-MNP conjugation. Elemental mapping of BacMags (Fig. 2d–h) reveals an even distribution of the inherent elements of E. coli (N, P and O) throughout the bacterial surface. The elemental mapping of Fe on the other hand corresponds to the position of MNPs conjugated on the bacterial surface (Fig. 2g and h). The SEM image analysis (Fig. 2(i–k) ) further confirms the successful preparation of BacMags. Furthermore, the concentration of iron in the prepared BacMags was found to be 0.37 mg Fe ml−1 for Si-NS-E. coli and 0.31 mg Fe ml−1 for Si-NC-E. coli.
Following the successful formation of BacMags, it was crucial to assess whether the bioconjugation affected the living potential of E. coli; therefore, the viability of E. coli was evaluated using the colony forming assay (Fig. 3a), which indicated that there was no significant loss in bacterial viability after bioconjugation with Si-MNPs (Si-NCs). Subsequently, the magnetic hyperthermia potential of the developed BacMags was determined for both Si-NSs and Si-NCs to identify the best nanoparticle morphology for MHCT. Fig. 3b and c show that E. coli conjugated with Si-NCs exhibited a higher temperature rise of 7 ± 0.9 °C, falling within the desirable hyperthermic window (4–5 °C) compared to Si-NSs, which showed a temperature rise of only 2.5 ± 0.5 °C. This demonstrates the efficient hyperthermic potential of the anisotropic morphology of MNPs (Si-NCs) for MHCT. Therefore, Si-NC-BacMags were selected for all further experiments to evaluate their anti-tumor potential.
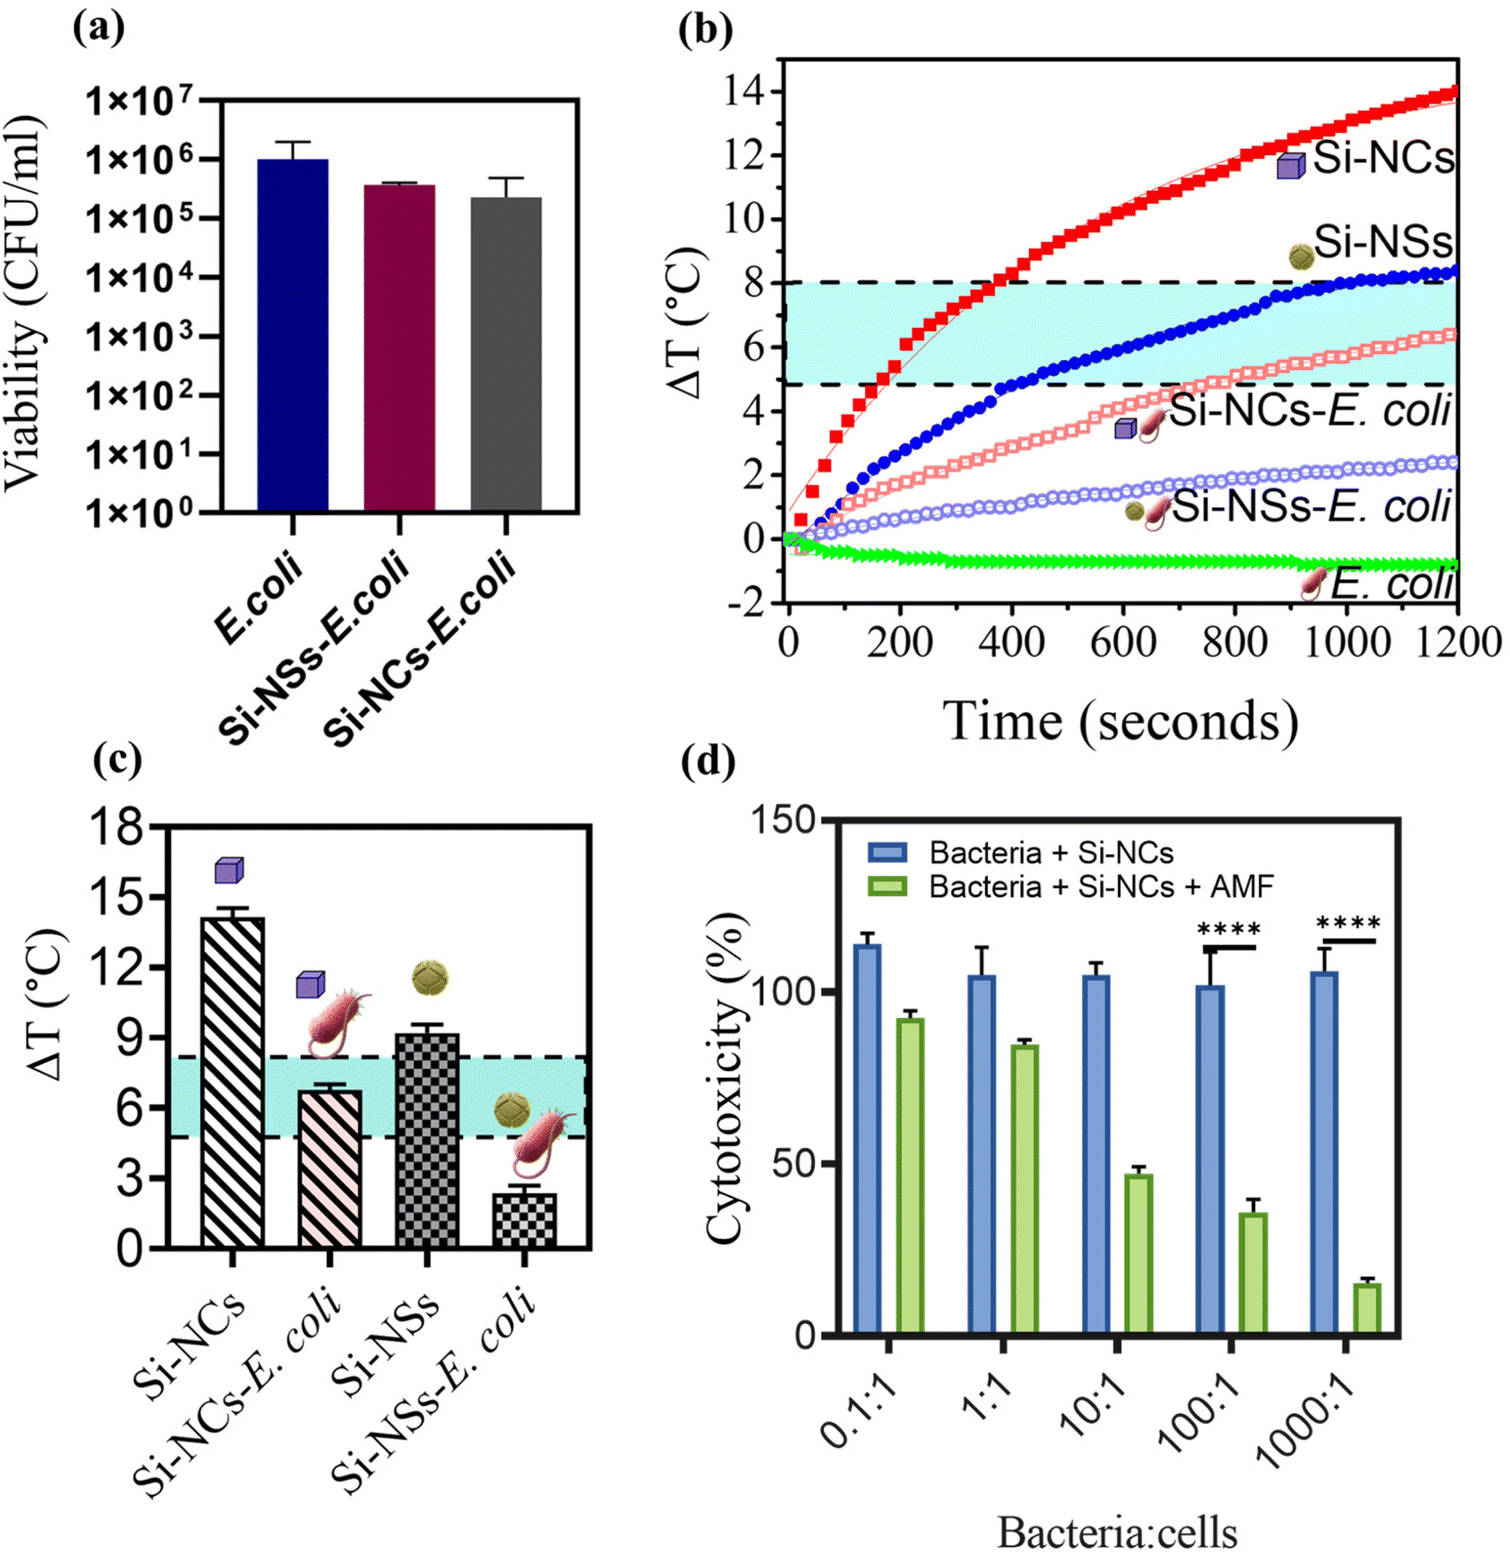 | ||
| Fig. 3 (a) Bacterial viability analysis post-fabrication with Si-NSs and Si-NCs by colony forming unit assay; (b) calorimetric hyperthermia profile of Si-MNPs and BacMags; (c) ΔT plot obtained from b; and (d) pancreatic cancer cell cytotoxicity analysis using Si-NC-BacMags. | ||
2.4. BacMags as potential anti-cancer hyperthermia agents
To investigate the therapeutic efficacy of the designed bacterial nano-vector, the cytotoxicity of Si-NC-BacMags at various concentrations was assessed via the MTT assay on 2D monolayers of MIA-PaCa-2 human pancreatic cells such that the ratio of bacteria/cells ranged from 0.1 to 1000 bacteria per cell for 12 h. The results (Fig. 3d) demonstrate that the cells treated with BacMags without AMF application exhibited negligible cytotoxic effect. This suggests that the mere addition of E. coli or BacMags does not induce significant fatality in tumor cells. However, upon AMF application for 20 min, Si-NC-E. coli (BacMags) exhibited significant tumor cell mortality in a dose-dependent manner. The highest cancer cell death rate of 85% was observed at the highest BacMag ratio of 1000 bacteria per cell.After the hyperthermic treatment of MIA-PaCa-2 cells with Si-NC BacMags, further analysis was conducted to investigate the mechanism responsible for cell death. Cellular morphology and cytoskeleton analysis were performed using FE-SEM and confocal microscopy, respectively (Fig. 4). The cells treated with E. coli (group (ii)) or Si-NCs alone (group (iii)) exhibited an intact structural morphology, suggesting minimum damage to the cancer cells. However, the cells exposed to Si-NCs + AMF (group (iv)) and Si-NC-E. coli (BacMags) + AMF (group (v)) showed complete distortion of the cellular cytoskeleton and rounding of the cells, as observed in the corresponding FE-SEM images, compared to all the other groups. The untreated cells served as a control (group (i)). Considering the cellular damage observed in treatment groups (iv) and (v), it is important to assess the hyperthermia effect in a model more appropriate to mimic the hypoxic tumor microenvironment.
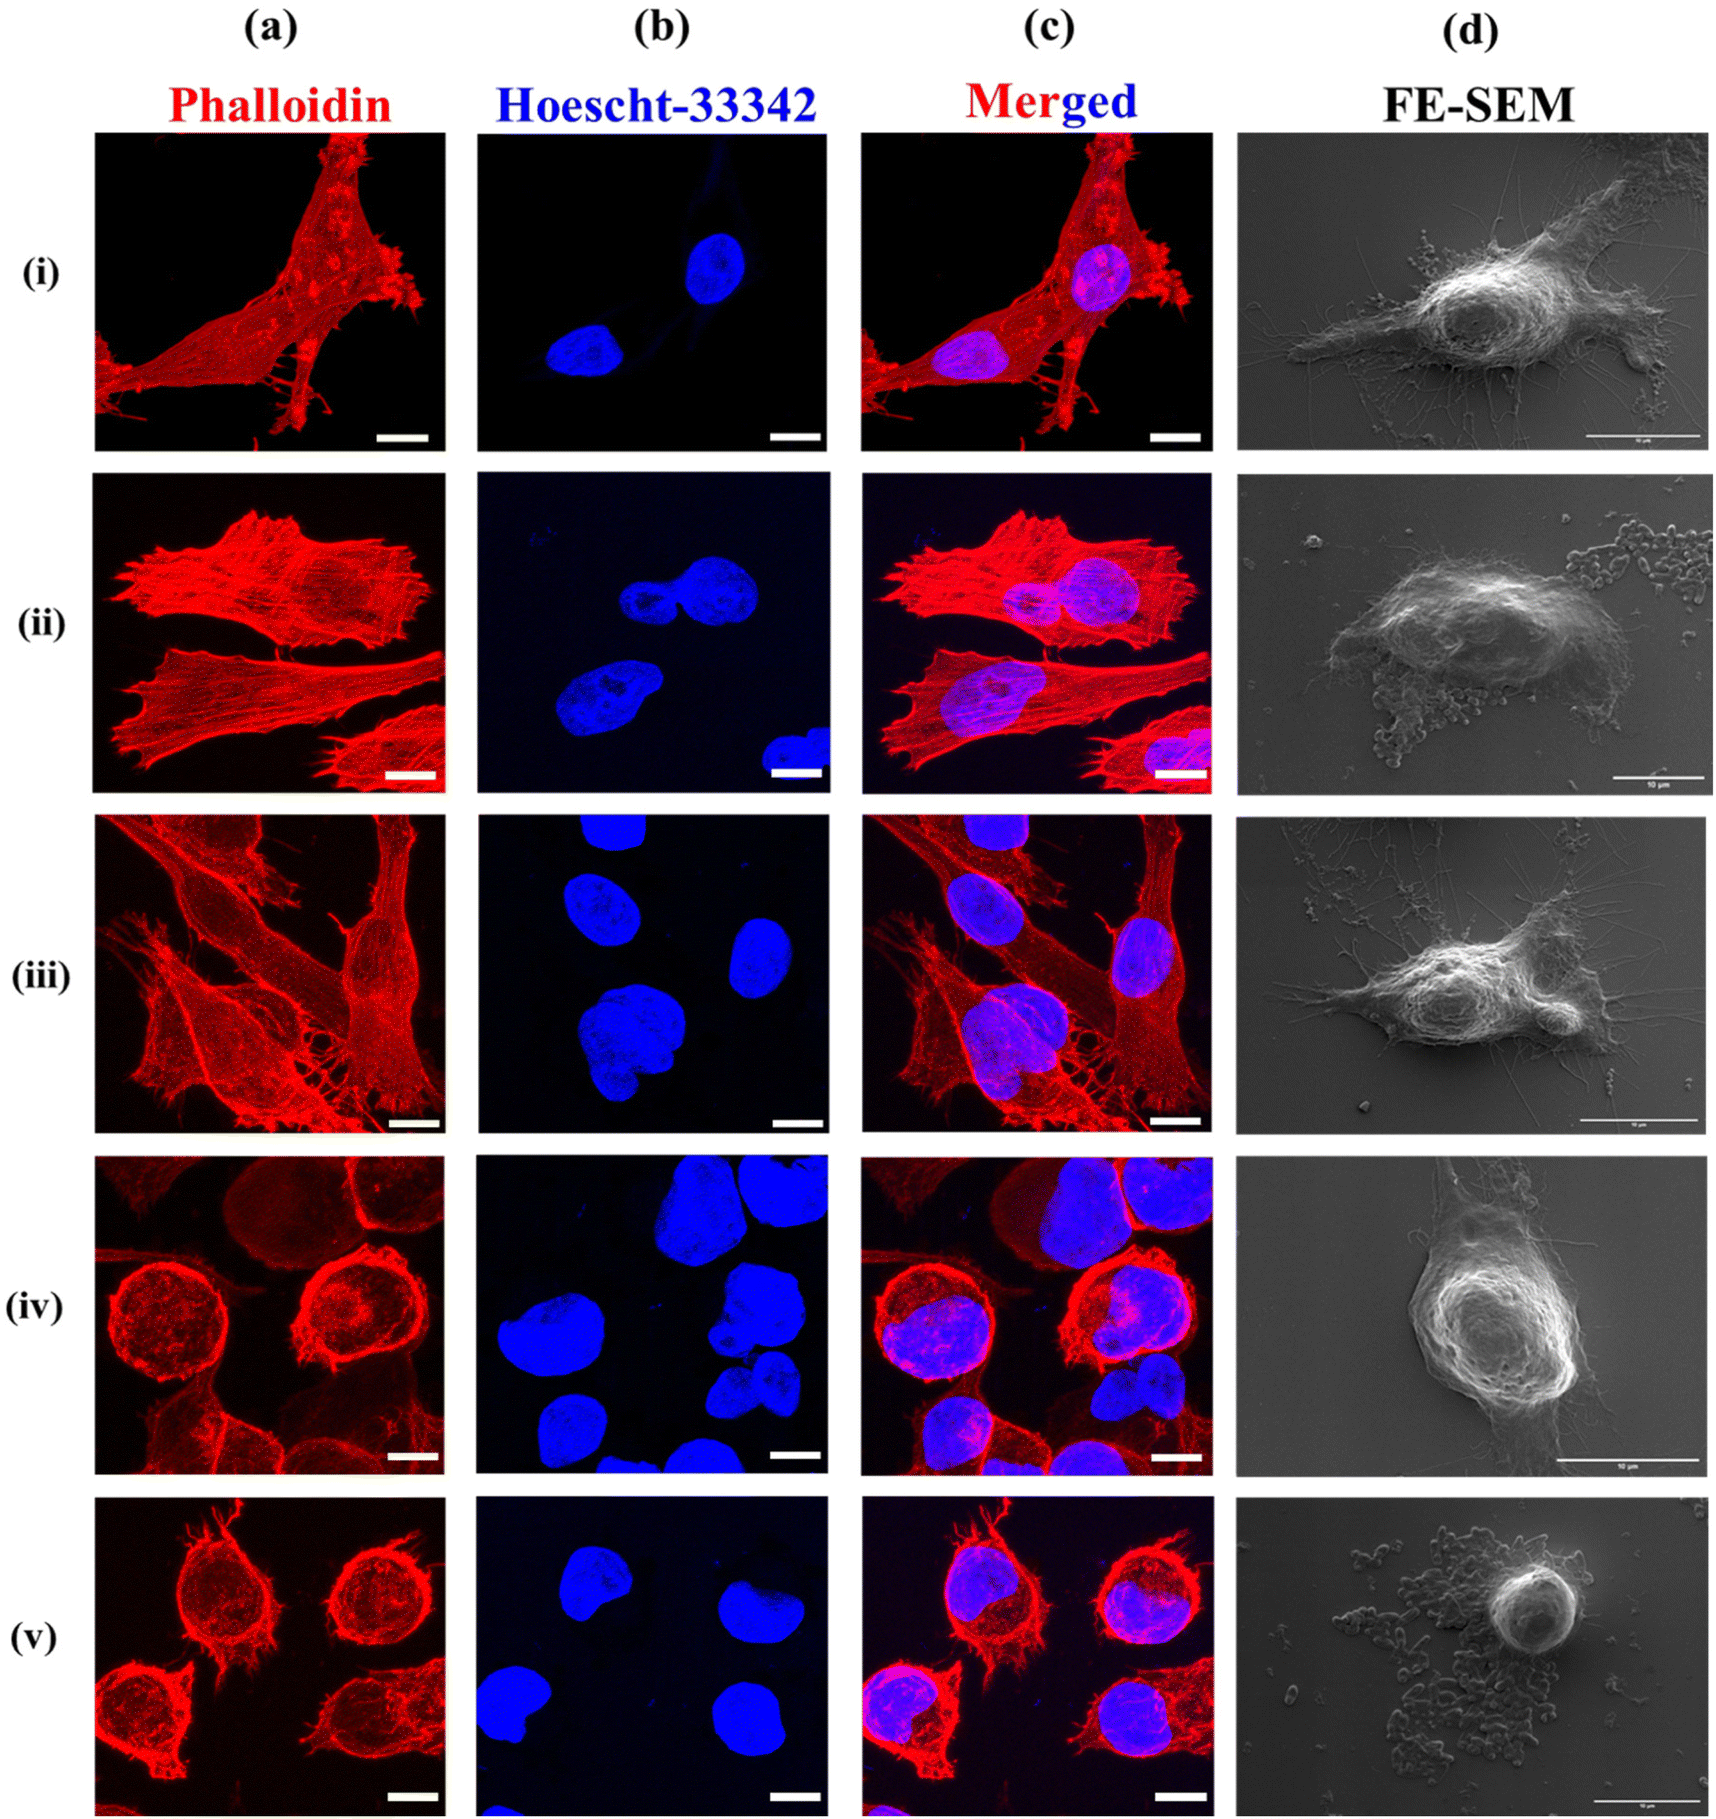 | ||
| Fig. 4 Confocal microscopy images for cellular cytoskeleton analysis: (a) TRITC-tagged phalloidin staining, (b) Hoechst-stained nuclei and (c) merged images of (a and b); and (d) FE-SEM images of the cells treated with the groups: (i) untreated control, (ii) E. coli, (iii) Si-NCs, (iv) Si-NCs + AMF and (v) Si-NC-BacMag + AMF. The scale bar for confocal microscopy images = 5 μm and FE-SEM images = 10 μm. | ||
In this regard, 3D multicellular tumor spheroids (3D-MCTSs), which possess a complex cellular architecture and a proliferative-to-necrotic cellular gradient, provide a promising model for studying anaerobic E. coli penetration into anoxic-hypoxic nutrient-depleted tumor cores.47 Therefore, 3D-MCTSs were developed using fibroblast L929 cells and Mia-Pa-Ca-2 pancreatic cancer cells to consider the influence of the extracellular matrix (ECM) under in vivo circumstances.48 Fig. S5a† illustrates the representative image, where FITC-tagged BacMags were incubated with 3D-MCTSs to evaluate their tumor-seeking ability within the hypoxic spheroid cores. The green signal obtained from the inner of 3D-MCTSs, in contrast to the blue signal from Hoechst -stained nuclei which remained at the periphery due to the inability of the stain to enter the 3D-MCTS core, suggests that BacMags were able to drift inside the spheroids rather than being on the surface. Furthermore, 2.6 × 10⁸ CFU ml−1 bacteria, quantified on disintegrating the 3D-MCTSs (Fig. S5b†) confirmed the presence of bacteria inside the 3D-MCTSs. These findings demonstrate the suitability of Si-NC-BacMags as efficient nanocarriers for hyperthermia therapy of hypoxic solid tumors.
Following hyperthermia treatment, a live/dead investigation was conducted in both 2D monolayers and 3D-MCTSs to explore the role of bacteria in delivering the therapeutic cargo (Si-NCs) inside the central hypoxic cores of tumors. From Fig. 5a, it is evident that our hyperthermia treatment regime is effective not only in inducing cancer cell death in 2D monocultures but also in causing significant cell death in the 3D-MCTSs. In group (v), a significantly higher number of propidium iodide-stained dead cells were observed inside the 3D cores compared to group (iv), where the dead cells were predominantly located on the periphery of the spheroids due to the inability of Si-NCs to reach the hypoxic cores without the guidance of the bacterial nanocarrier.
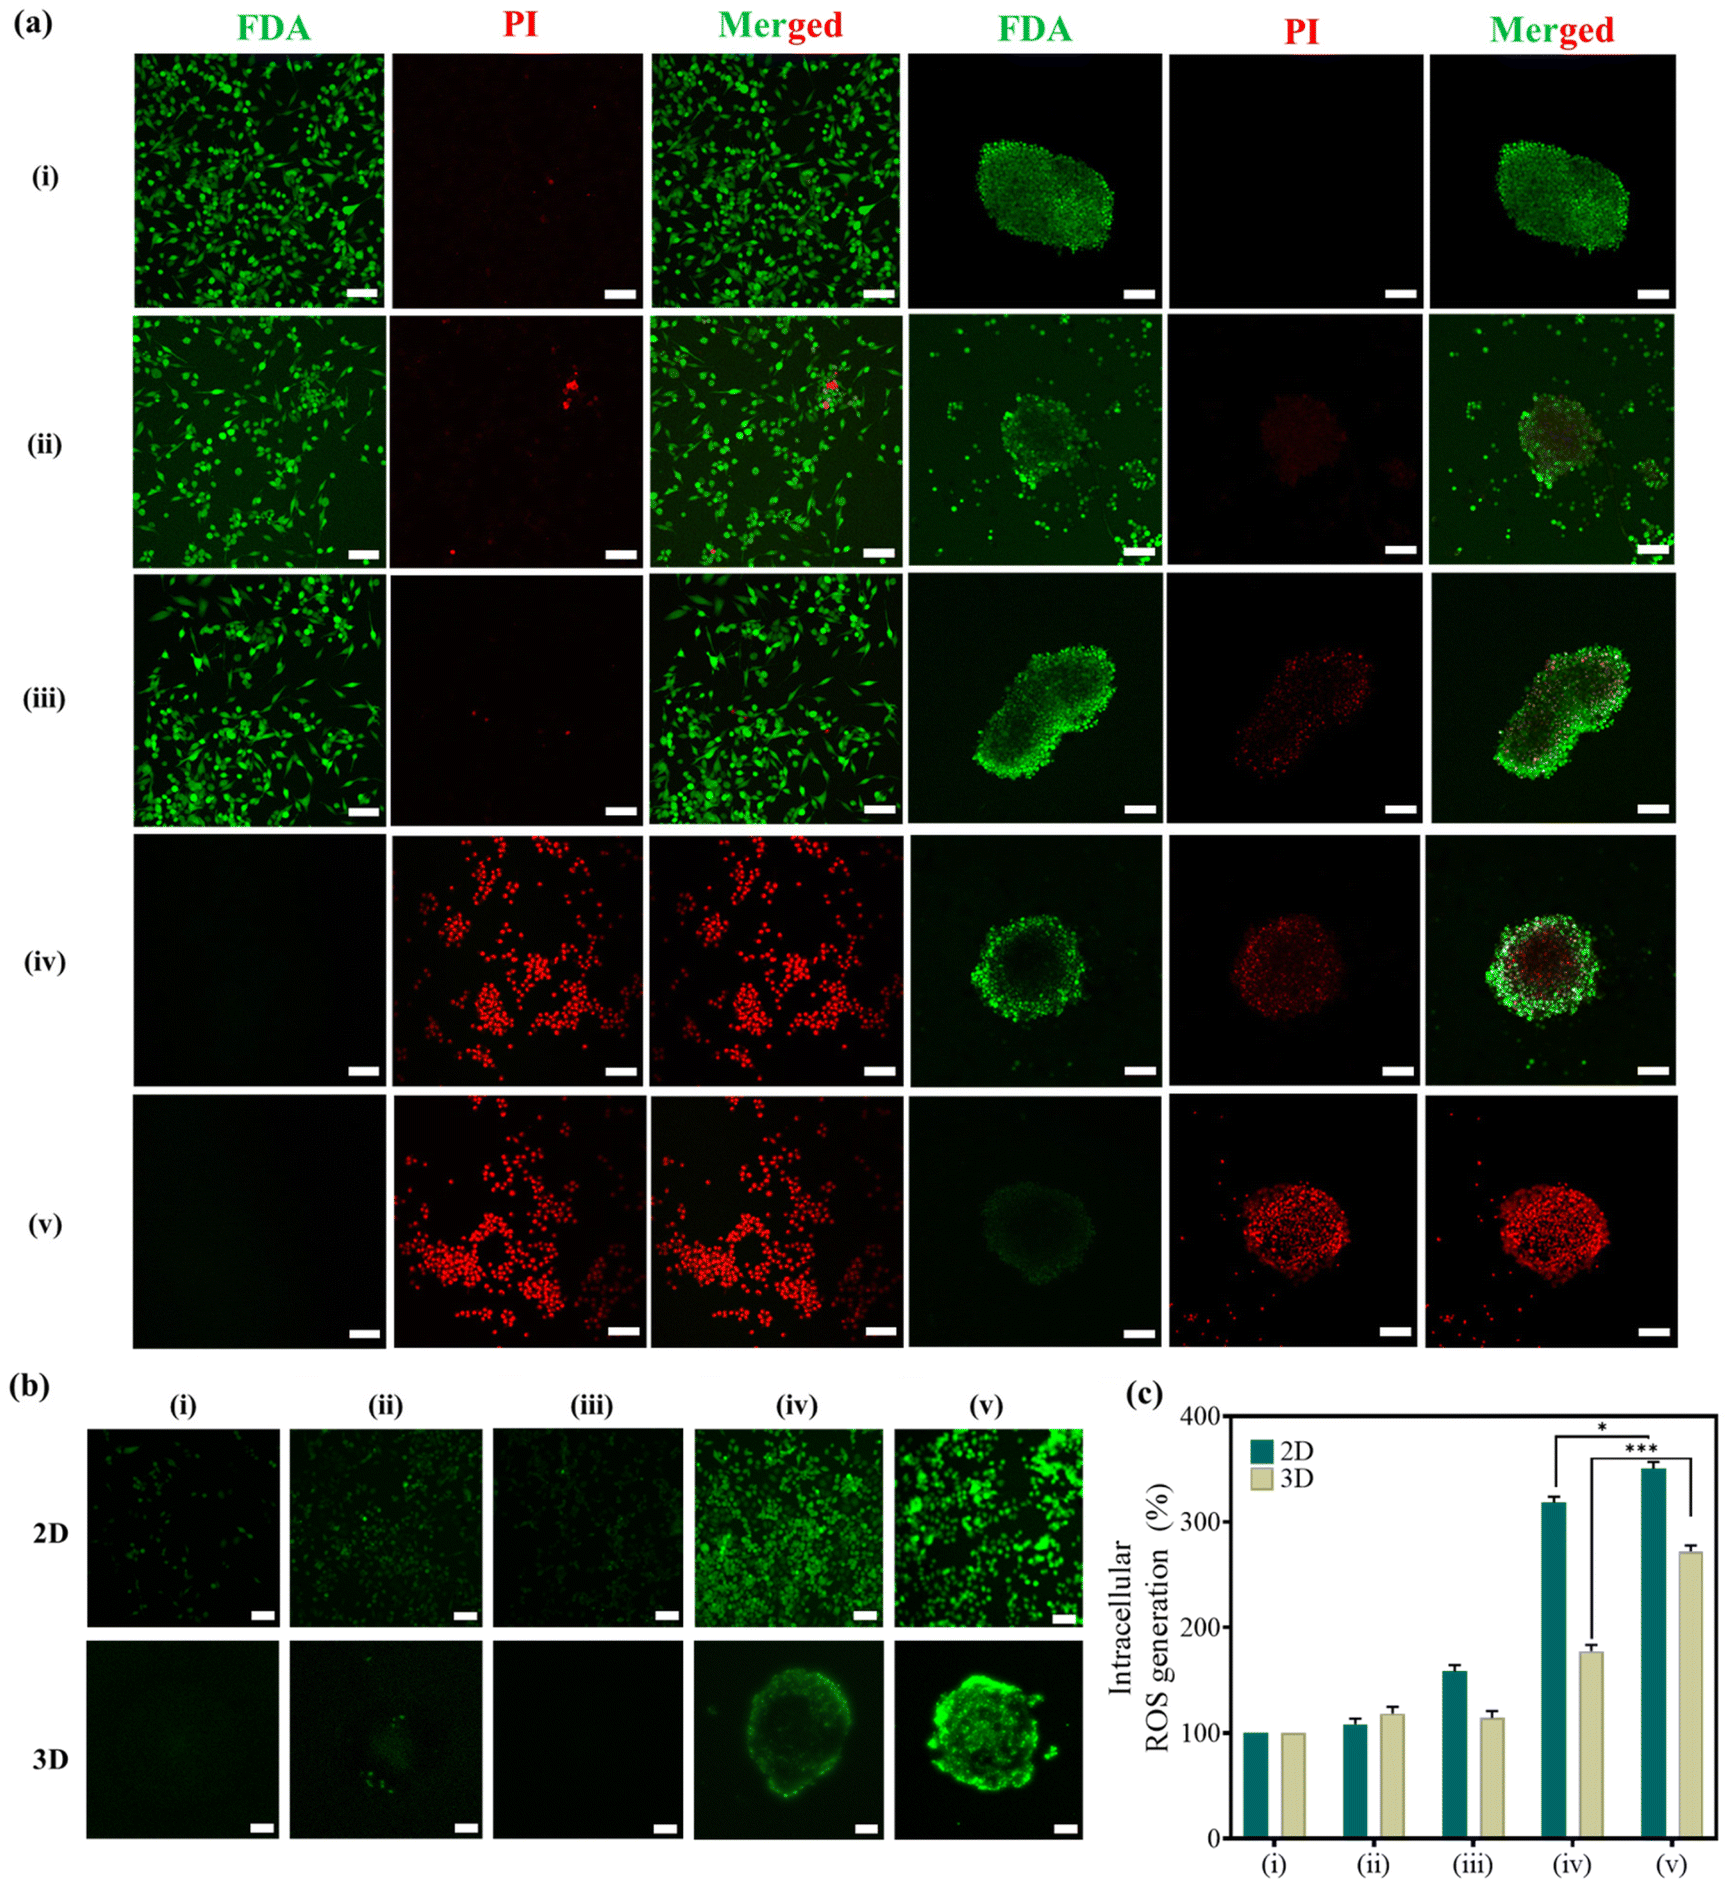 | ||
| Fig. 5 Confocal microscopy images: (a) live/dead assay in 2D monolayers and 3D-MCTSs of FDA-stained live cells, PI-stained dead cells and their corresponding merged images; (b) qualitative ROS analysis and (c) quantitative ROS analysis in 2D monolayers and 3D-MCTSs utilising DC-FHDA staining of cells/MCTSs treated with the groups:(i) untreated control, (ii) E. coli, (iii) Si-NCs, (iv) Si-NCs + AMF and (v) Si-NC-BacMag + AMF. The scale bar = 100 μm. | ||
Additionally, MNPs under heat stress can convert endogenous H2O2 present inside the tumor microenvironment into highly toxic hydroxyl radicals (˙OH), leading to massive apoptosis in tumors.49,50 Considering the excellent capability of Fe3O4-based nanoparticles to catalyze Fenton-like reactions, oxidative stress was further evaluated post-hyperthermia therapy using the DCFH-DA-based ROS assay in 2D monolayers and 3D-MCTSs both qualitatively and quantitatively. Cancer cells exposed to MHCT exhibited significant ROS generation when grown as 2D monolayers, given their relatively simple cellular organisation. For 3D-MCTSs, the level of ROS generated was lower than that observed in 2D monolayers in all the groups owing to the complex cellular organization of spheroids replicating the tumor microenvironment.47 However, it is noteworthy that in 3D-MCTSs (Fig. 5b), the maximum green fluorescence signal corresponding to DCFH-DA was detected towards the center of the spheroids only in group (v) as compared to all the other groups. The level of ROS was quantitated to be 95% enhanced in group (v) as compared to Si-NCs exposed to an AMF, which correlates well with the higher cell death observed in the live/dead assay in the corresponding treatment group. This signifies the crucial role played by tumor-targeting E. coli in providing the desired therapeutic outcome within the deep tumor core.
Before assessing the use of Si-NC-BacMags in vivo, we determined the hemocompatibility of the E. coli-loaded nanoparticles by the hemolysis assay (Fig. S6†).51 Both Si-NCs and Si-NC-BacMags showed no detrimental effect on the RBCs as the hemolysis rate was determined to be 0.96% for Si-NCs and 0.97% for Si-NC-BacMags as compared to the positive control (distilled water) which showed 100% hemolysis of the RBCs, thus indicating that the Si-NC-BacMags were safe to be utilized for bio-medical applications.51
The anti-cancer potential of Si-NC-BacMags was further evaluated in an in vivo syngeneic xenograft model developed in C57BL/6 mice. Xenograft tumors were generated within 7–10 days of subcutaneous inoculation, followed by intratumoral injection of either Si-NCs or Si-NC-BacMags along with AMF exposure on two consecutive days. The detailed schematic of the experimental design is presented in Fig. 6a. On days 0 and 1, after 30 min of intratumoral injection, the mice were subjected to an AMF of 375 Oe, 165 kHz strength for 20 min. The tumor surface temperature reached over 42.5 °C and was maintained constantly between 42 and 43 °C during the MHCT sessions to induce cancer cell death (Fig. S7†). The effect of the AMF in conjugation with Si-NC-BacMags was evident, resulting in a 49% reduction in tumor volumes by day 20, progressing to complete tumor regression by day 30 in group 5 (G5) mice (Fig. 6b). In contrast, the tumor volumes of mice belonging groups 1, 2 and 3 kept on increasing and mice were sacrificed when the tumor volume exceeded 2000 mm3. Notably, the treatment with Si-NCs exposed to an AMF slightly slowed down the tumor growth in the mice of group 4, which however reached >1500 mm3 by day 45. The reduction in the tumor volume of group 4 might suggest that increasing the MNP dosage of AMF strength could give a better anti-tumor response. However, the complete tumor regression in G5 suggested that it was the Si-NC-BacMags that could most efficiently lead to the killing of the tumor cells when exposed to the optimised dosage and AMF conditions in this study. The mice in the different groups did not show any noticeable differences in body weight except in the PBS control group (G1), where the body weight increased to some extent possibly due to the increased tumor volume (Fig. 6c). This confirmed the biosafety of the MHCT sessions as well as the bacterial dosage.
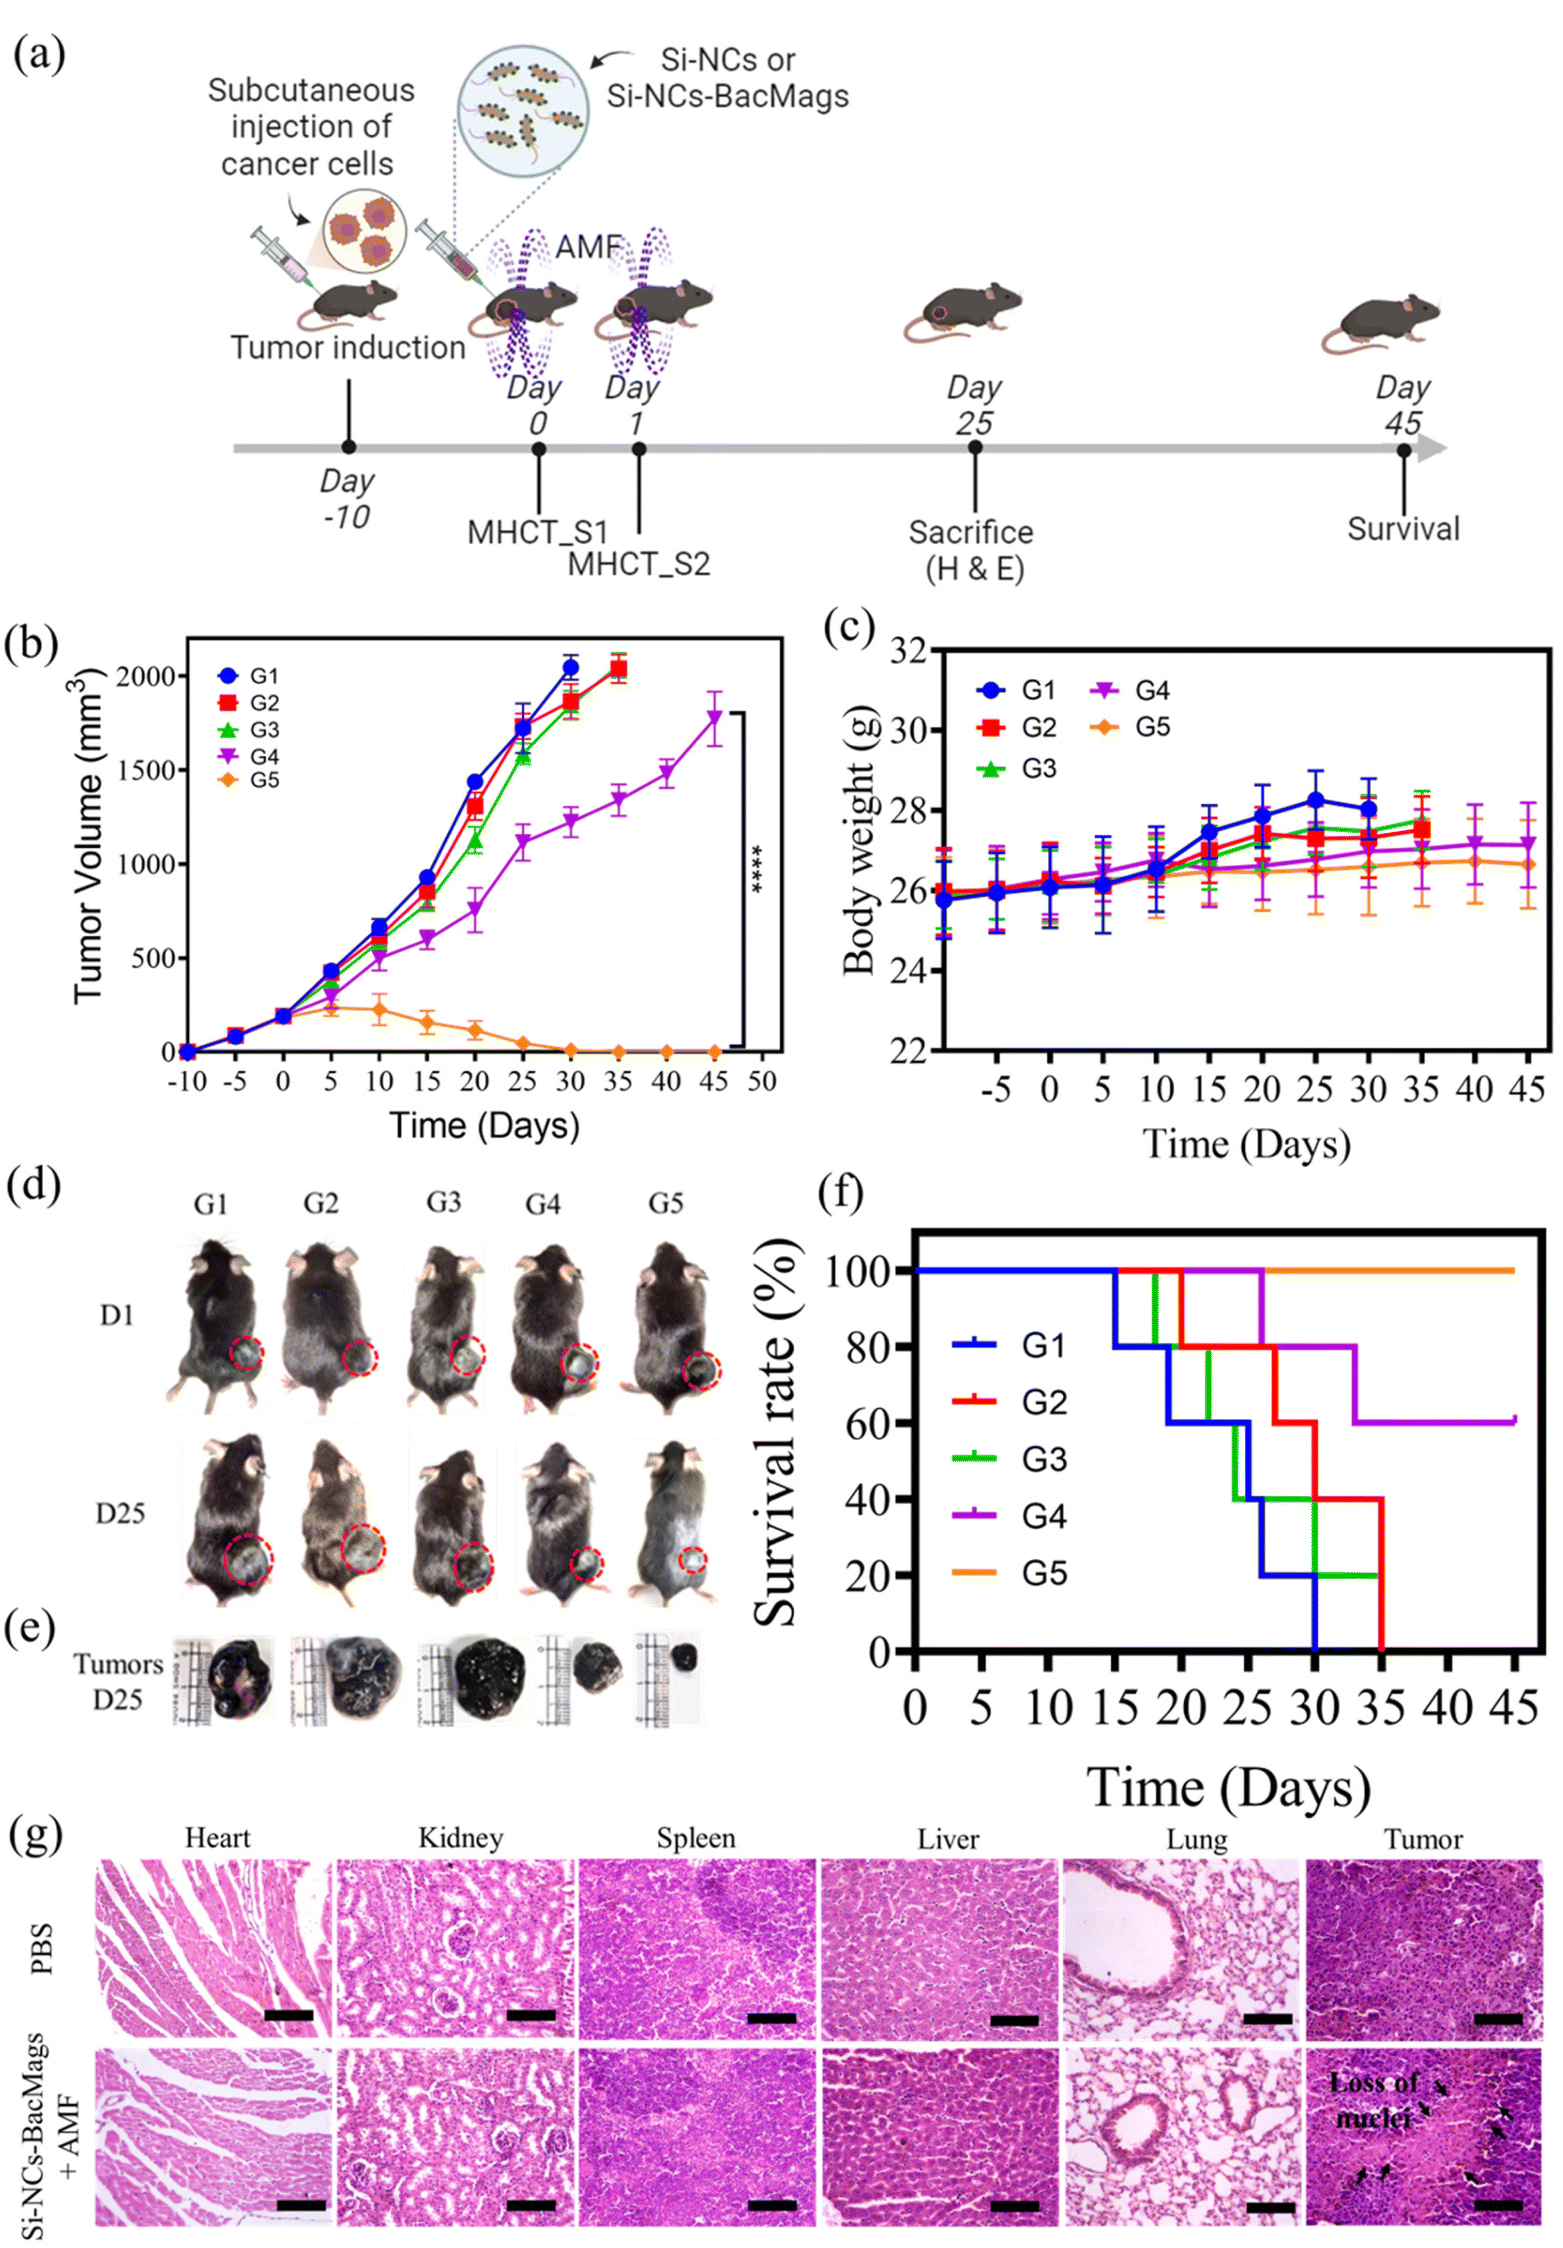 | ||
| Fig. 6 In vivo anti-tumor therapy: (a) schematic representation of the experimental procedure; (b) average tumor volume and (c) average mice body weight during the course of study; (d) digital images of mice showing the tumor size during treatment on D1 and D25, where the red dotted circles indicate the tumors; (e) digital images of the excised tumors on D25; (f) survival curves of different groups of mice 45 days post-MHCT_S1; and (g) histological staining of the vital organs and tumor tissue sections, scale bar = 100 μm. G1: PBS, G2: E. coli, G3: Si-NCs, G4: Si-NCs + AMF, and G5: Si-NC-BacMags + AMF. D denotes days. MHCT_S1 and MHCT_S2 represent magnetic hyperthermia sessions 1 and 2. | ||
Fig. 6d represents the digital images of tumor-bearing mice on day 1 and day 25, while Fig. 6e represents the harvested tumors on day 25 from all the treatment groups. As can be observed, the Si-NC-BacMags plus AMF group resulted in a significant reduction in tumor volume on day 25. The changes associated with the tumor tissue were further analyzed by performing hematoxylin and eosin (H & E) staining (Fig. 6g). The histological sections showed huge patches of enucleated stroma (marked by black arrows in G5) and disarranged tissue, signifying tumor cell death due to necrosis and apoptosis.52,53 Conversely, no evident signs of cell death were observed in the PBS control group (G1) with actively dividing cancer cells. Additionally, the H & E staining of the major organs of the mice such as the heart, kidneys, spleen, liver, and lungs did not show any pathological abnormalities, thereby confirming the good biocompatibility of the bacteria-based therapeutic approach.43,54 While all the mice in groups 1–3 (G1–G3) died within 30 days, the percentage survival of the mice in G4 and G5 was observed to be 60% and 100%, respectively, on day 45 (Fig. 6f). Taken together, Si-NC-BacMags in the presence of an AMF exhibited enhanced anti-tumor response in both in vitro and in vivo models.
3. Conclusion
In conclusion, our research has demonstrated the potential of a novel bacteria-based approach for hyperthermia therapy, addressing the limitations of conventional MHCT. Anisotropic Si-NCs demonstrated their efficacy as efficient mediators for MHCT. Moreover, the preclinical study demonstrates the crucial role of E. coli in facilitating the targeted delivery of Si-NCs to hypoxic cancer cells, thereby providing a promising proof-of-concept for hypoxia-targeted bacteria-mediated MHCT for solid tumors. These findings highlight the potential of our approach as an innovative strategy in the field of cancer treatment. Further studies and advancements in this direction hold promise for the development of effective and targeted therapies for solid tumors.4. Experimental
4.1. Materials and strains
All media components were purchased from HiMedia, India unless otherwise specified. All other chemicals and reagents used were of analytical grade procured from Sigma-Aldrich unless specified and used directly without any further purification or modifications. Escherichia coli 40 (E. coli) strain was purchased from Microbial Type Culture Collection (MTCC), Chandigarh (India).4.2. Bacterial culture conditions
E. coli was routinely grown at 37 °C overnight after inoculating with 20 μl of overnight grown culture in 10 ml of liquid Luria Broth (LB) medium under shaking conditions at 180 rpm in a shaker incubator. The overnight grown cultures were diluted in fresh liquid LB medium and cultured at 37 °C for 2–4 h. The bacterial culture was then collected by centrifugation at 3500g for 10 min and resuspended in ice-cold sterile saline to an optical density of 0.8 at 600 nm (O.D600), corresponding to 108 CFU ml−1. The concentration of bacteria was determined by serial dilution of the culture, then plating it on LB agar at 37 °C for 24 h and counting the CFUs.4.3. Synthesis of MNPs
Two different morphologies of MNPs were prepared: spheres and cubes.![[thin space (1/6-em)]](https://www.rsc.org/images/entities/char_2009.gif) :2 mmol. After degassing at RT for 30 min, the mixture was heated at 280 °C (at a rate of 5 °C min−1) under vigorous stirring for 18 h. A solution of toluene:hexane at a ratio of 4:1 was used to precipitate the oleic acid-coated iron oxide cubes and they were centrifuged at 8000 rpm for 10 min. The obtained magnetic cubes were then washed several times with chloroform.
:2 mmol. After degassing at RT for 30 min, the mixture was heated at 280 °C (at a rate of 5 °C min−1) under vigorous stirring for 18 h. A solution of toluene:hexane at a ratio of 4:1 was used to precipitate the oleic acid-coated iron oxide cubes and they were centrifuged at 8000 rpm for 10 min. The obtained magnetic cubes were then washed several times with chloroform.
On the other hand, to coat the MNPs (cubes) with silica, a reverse microemulsion method was followed. Briefly, 100 mg of MNPs were dispersed in 5 ml chloroform and sonicated for 5 min. Thereafter, 5 ml of 0.55M aqueous cetrimonium bromide (CTAB) solution was added and stirred for 30 min at RT. The oil-in-water emulsion so formed was heated at 60 °C for 10 min to evaporate the chloroform. Next, a mixture of 45 ml water and 0.3 ml of 2 M NaOH solution was added to the reaction mixture and heated at 70 °C. Thereafter, 0.5 ml TEOS, 3 ml ethyl acetate and 50 μl (3-aminopropyl) triethoxysilane (APTES) were added in sequence and stirred for 3 h. The solution so obtained was washed with acidified ethanol and water and dried in a lyophilizer.
4.4. Characterization of the synthesized MNPs
The crystallite structure and size of the MNPs were determined using a Bruker D8 Advance X-ray diffraction (XRD) system using a Cu Kα radiation source from 20 to 80° (2θ). The size, shape and size distribution profile of the synthesized MNPs were investigated using a JEOL JEM-2100 transmission electron microscope (TEM) operating at an acceleration voltage of 200 kV. The morphology of the MNPs was also confirmed using a JEOL JSM-7610 FPlus field-emission scanning electron microscope (FE-SEM). The hydrodynamic size and surface charge of the nanoparticles were measured by dynamic light scattering (DLS) and zeta potential measurements using a Malvern Zetasizer Nano-ZS, USA. Next, to determine the elemental composition and states of the elements in the MNPs, X-ray photoelectron spectroscopy (XPS) analysis was done using a K-Alpha X-ray spectrometer system, (ThermoFisher Scientific, USA). Furthermore, to confirm the biocompatible silica coating on the synthesised MNPs, Fourier Transform Infrared Spectroscopy (FTIR) measurements were done using a Bruker Vertex 70 FTIR spectrophotometer.4.5. Cell culture
The normal mouse fibroblast cell line (L929) and the human pancreatic cancer cell line (MIA-PaCa-2) were procured from National Centre for Cell Science, Pune, India. The cells were maintained in Dulbecco's modified Eagle's medium (DMEM; Hyclone) containing 1% antibiotic–antimycotic solution (HiMedia) and 10% fetal bovine serum (FBS; Gibco) at 37 °C under a humidified atmosphere with 5% CO2.:1. The plates were incubated at 37 °C for five to seven days for spheroid formation and the medium was changed every alternate day.
 | (1) |
4.6. Calorimetric hyperthermia measurements
To evaluate the potential of the synthesized MNPs for efficient magnetic hyperthermia performance, the aqueous suspensions of all the MNPs in a concentration range of 500–1000 μg ml−1 were evaluated using D5 nanomagnetic heating system (nB nanoscale Biomagnetics, Zaragoza, Spain). Various frequencies (145–387 kHz) and field amplitudes (275–420 Oe) combinations were tested to establish the best combination of these two critical parameters for obtaining the maximum hyperthermic performance. A fiber-optic thermometer probe was used to probe the temperature every 0.2 s after switching on the magnetic field. To determine the thermal performance of the MNPs, 1 mg mL−1 aqueous nanoparticle suspensions were subjected to an alternating current magnetic field (AMF) of variable frequency with a fixed field amplitude of 375 Oe and different field amplitudes with a fixed frequency of 165 kHz, respectively. To compare the effect of the morphology of MNPs on their hyperthermic performance, both spherical and cubical shaped MNPs were tested for their hyperthermic potential at various concentrations of MNPs (0.5–1 mg ml−1) by subjecting them to an AMF of a magnetic field strength of 375 Oe at a frequency of 165 kHz for 20 min. The specific absorption rate (SAR) was then calculated using the equation: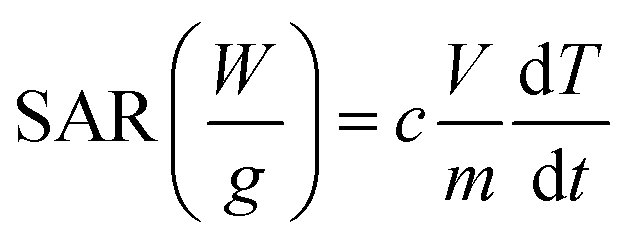 | (2) |
4.7. Surface functionalization of the synthesised MNPs or the preparation of BacMags
The BacMags were prepared by a two-step process. First, streptavidin-cy3 (Invitrogen) was bound to the Si-MNPs using EDC–NHS chemistry. Briefly, Si-MNPs (at a concentration of 0.5 mg ml−1 in water) were washed thrice in 50 mM MES buffer, pH 6.0 and sonicated to obtain a homogeneous suspension. 200 mM 1-ethyl-3-(3-dimethylaminopropyl) carbodiimide (EDC) was separately dissolved in MES buffer. Also, N-hydroxysuccinimide (NHS) (200 mM) was prepared in MES buffer. To 1 ml of the washed Si-MNPs, 24 μl of freshly prepared EDC and 240 μl of NHS were added and incubated for 30 min at RT under vigorous stirring. Thereafter, the activated Si-MNPs were washed several times and resuspended in 500 μl MES buffer. The activated Si-MNPs were then mixed with 25 μl of 100 μg ml−1 streptavidin-cy3 and incubated at RT for 6–8 h. After the incubation period, the suspension was washed several times and resuspended in MES buffer. Next, E. coli was suspended in 1 ml of sterile MES to a final concentration of 108 CFU ml−1 and incubated with 10 μg ml−1 (4.4 μl) of rabbit polyclonal anti-E. coli antibody conjugated with biotin (Invitrogen) for 2 h at RT with continuous stirring. The unbound antibody was removed by centrifuging twice at 2000g for 5 min. E. coli was then resuspended in 500 μl of MES buffer. Next, for the bio-assembly to take place, streptavidin-tagged Si-MNPs at various concentrations (0.25–1 mg ml−1) were co-incubated with an equal volume of biotinylated E. coli at RT for 3 h with continuous stirring. Finally, the Si-MNP-loaded E. coli, from now on referred to as ‘BacMags’ were collected by centrifugation at 3500g at 4 °C for 10 min and the pellet so obtained was washed thrice and resuspended in the appropriate buffer for each experiment.4.8. Characterization of Si-MNP-conjugated E. coli (BacMags)
The prepared BacMags were examined using confocal laser scanning microscopy, XPS, transmission electron microscopy (TEM) and scanning electron microscopy (SEM) techniques and Inductive Coupled Plasma-Mass Spectrometry (ICP-MS).For confocal microscopy analysis, E. coli was stained using BacLight Green (Invitrogen) stain as per the manufacturer's protocol before the bioconjugation procedure. Post-bioconjugation, the BacMags suspended in PBS were appropriately diluted and mounted on a clean glass slide and covered with a coverslip. The BacMags were then directly visualized by confocal laser scanning microscopy (CLSM) using a Zeiss LSM 880 confocal microscope (Carl Zeiss, Thornwood, New York). Bare E. coli (without the MNP attachment) and Si-MNPs alone served as controls.
XPS survey scan was performed to determine the formation of BacMags. The BacMags were centrifuged at 4000 rpm for 5 min, followed by fixing in ice-cold ethanol for 1 h. The pellets were suspended in ethanol and the samples were drop-cast onto clean glass slides covered with aluminium foil. The samples were then analysed using a K-Alpha X-ray spectrometer system to determine the elemental composition. E. coli and Si-MNPs served as the controls. Furthermore, to confirm the successful development of BacMags, electron microscopy analysis was carried out using a JEOL JEM-2100 transmission electron microscope (TEM) operating at an acceleration voltage of 120 kV. Bare E. coli and Si-MNPs served as controls. Before taking the TEM images, the bacterial cells and BacMags were fixed overnight in a solution of 2.5% (v/v) glutaraldehyde in PBS at 4 °C. The samples were then dehydrated in a series of ethanol/water solutions of increasing ethanol content from 30% to 100% before finally being drop-cast on carbon-coated copper grids for TEM analysis. In addition, for determining the surface morphology of BacMags, field-emission scanning electron microscopy (FE-SEM) analysis was also done. To acquire SEM images, the samples were fixed with 2.5% (v/v) glutaraldehyde and dehydrated in a series of ethanol/water solutions, as described earlier. Next, ∼10 μl of the fixed suspension was drop-cast on glass coverslips and left to air dry. The coverslips were then rinsed with ultrapure water. The samples were sputter coated with platinum prior to imaging. High-resolution SEM images were obtained using a JEOL JSM-7610 FPlus field-emission scanning electron microscope at a beam voltage of 2–5 kV, an emission current of 15 μm and a working distance of <5.3 mm.
Furthermore, the iron concentration for every sample was measured by ICP-MS (Agilent 7700 series).57 Briefly, 0.5 mg powders of Si-NSs and Si-NC-MNPs dispersed in 1 ml water and 1 ml of BacMag suspension equivalent to 108 CFU ml−1 of bacteria, i.e. Si-NS-E. coli and Si-NC-E. coli, were digested in HNO3 at 70 °C for 12 h. The digested solutions were diluted to a final volume of 5 ml with ultra-pure water. The standards were freshly prepared by serially diluting an iron standard solution in HNO3.
4.9. Colony forming assay for bacterial viability analysis
To determine the effect of bioconjugation on the viability of E. coli, the colony forming assay was performed. The prepared BacMags were serially diluted in PBS and plated on LBA for 24 h at 37 °C. The colonies so formed were counted and CFU ml−1 was calculated as per the given equation: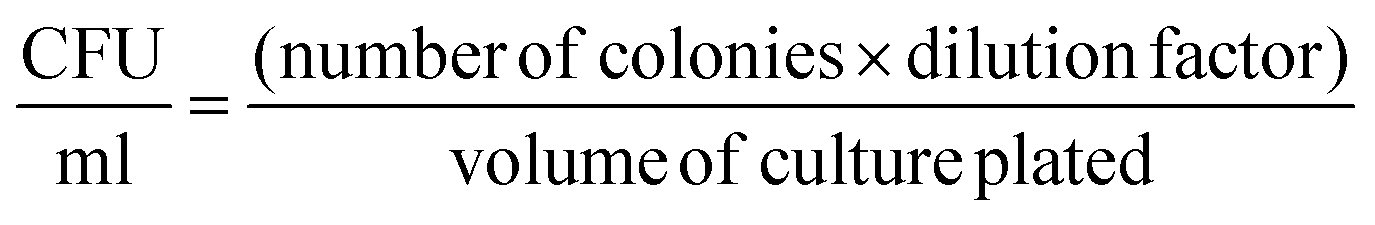 | (3) |
4.10. Calorimetric hyperthermia measurements of BacMags
The estimate the hyperthermic capability of the prepared BacMags, both spherical and cube shaped MNP-conjugated E. coli strains were subjected to an AMF with a magnetic field strength of 375 Oe at f = 165 kHz for 20 min and temperature was probed every 0.2 s using the fibre-optic thermal probe.4.11. Cell viability analysis by the MTT assay
After careful assessment of the hyperthermic potential of the BacMags in aqueous suspensions, MIA-PaCa-2 cells were subjected to the hyperthermia treatment. Briefly, 1 × 10⁴ cells per ml were seeded in 96-well culture plates and maintained at 37 °C for 24 h in 5% CO2. Then the cells were incubated with various concentrations of BacMags such that the ratio of bacteria/cells ranged from 0.1 to 1000 bacteria per cell for 12 h. The cells incubated with E. coli and with the medium alone served as controls. The assay was performed using DMEM without antibiotic–antimycotic solution throughout the experiment. The cells were then subjected to an AMF of a magnetic field strength of 375 Oe and a frequency of 165 kHz for 20 min. After treatment, MTT solution was added. 3 h post-incubation, the medium was removed, DMSO was added and absorbance was measured at 595 nm.4.12. Bacterial uptake analysis in 3D tumor spheroids
To ensure the presence of bacteria in 3D multicellular tumor spheroids, the 3D-MCTSs (constituting of ∼81000 cells) were incubated with Si-NC-BacMags at a concentration equivalent to 8 × 10⁷ CFU bacteria for 12 h so that the ratio of bacteria/cells would be ∼1000. The 3D-MCTSs were then fixed with 4% PFA for 1 h, followed by staining of cellular nuclei with DAPI for 20 min. E. coli was stained using BacLight Green (Invitrogen) stain as per the manufacturer's protocol before the bioconjugation procedure. The samples were washed in PBS and directly visualized under a confocal microscope.
4.13. Bacterial colonization quantification in 3D tumor spheroids
The 3D-MCTSs containing the bacteria were washed with PBS multiple times. After washing, the spheroids were re-suspended in 100 μl of PBS and homogenized using mechanical dissociation and repeated pipetting. The mechanical disruption was continued until all the clumps of cells dissociated into a single-cell suspension as visualized under a microscope. Thereafter, 10-fold serial dilutions of the suspension were inoculated on agar plates and colonies were counted after 24 h of incubation.584.14. Analysis of the cell death mechanism post-hyperthermia therapy
4.15. Hemocompatibility assay
To analyze the hemocompatibility of Si-NCs and Si-NC-BacMags, in vitro hemolysis assay was performed using a protocol suggested elsewhere.51 Si-NCs at a concentration equivalent to 0.38 mg Fe or Si-NC-BacMags at 9.9 × 10⁷ CFU (∼0.3 mg Fe) were washed twice and then resuspended in PBS. 1 ml of mice blood (obtained from C57BL/6 mice via the retro-orbital route) was centrifuged at 1500 rpm for 5 min to isolate the RBCs. The RBCs were then diluted with PBS to form a 2% suspension. 50 μl of the 2% suspension was added to the samples and incubated at 37 °C for 24 h. Distilled water for positive control and PBS for negative control incubated with the 2% blood suspension, respectively, served as the controls. After incubation, the absorbance of the supernatant was measured at 545 nm using a Tecan M Nano plus plate reader. The % hemolysis was calculated using the equation: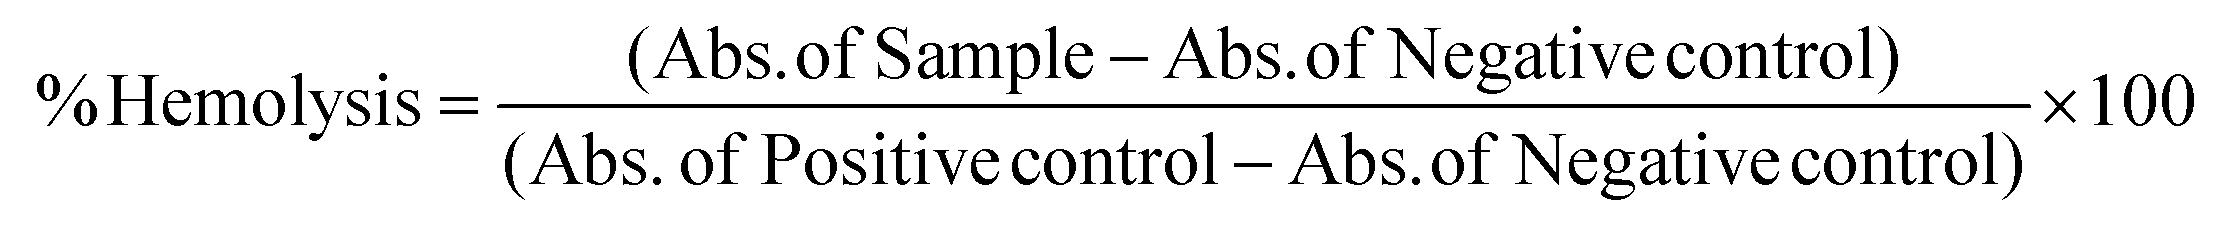 | (4) |
4.16. Evaluation of in vivo anti-tumor response
The animal experiments were performed as per the guidelines for the use and care of laboratory animals of the Indian Institute of Science Education and Research (IISER) Mohali and approved by the Institutional Animal Ethics Committee (IAEC).To establish xenograft models, B16F10 cancer cells (1 × 10⁶ cells per ml) suspended in PBS were inoculated subcutaneously into the right flanks of 4–6 weeks-old male C57BL/6 mice. The experiment started 10 days after tumor inoculation when the tumors had reached an appropriate volume of 180–200 mm3. The animals were randomly divided into five groups (n = 5 per group):
(1) Treated with PBS only – G1
(2) Treated with E. coli only – G2
(3) Treated with Si-NCs only – G3
(4) Exposed to an AMF in the presence of Si-NCs – G4
(5) Exposed to an AMF in the presence of Si-NC-BacMags – G5
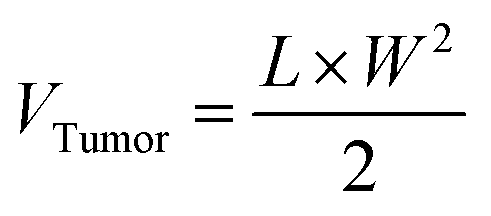
On days 1 and 2, B16F10 tumor-bearing mice were subjected to two consecutive hyperthermia sessions, MHCT_S1 and MHCT_S2, respectively, for 20 min at 43 °C each using an AMF of H = 165 Oe and f = 375 kHz strength at an interval of 24 h generated by the nanomagnetic heating system by MSI Automation (USA). In brief, 9.9 × 10⁷ CFU Si-NC-BacMags per mouse for G5 (equivalent to 0.30 mg Fe), the same amount of Si-NCs for G4 (∼0.38 mg Fe), and only E. coli for G3 were injected intratumorally before MHCT_S1. MHCT_S2 was performed on day 2 without additional dosage of MNPs. MHCT was performed 30 min after the injection to the mice. The tumor surface temperature was monitored using an optical fibre probe throughout the experiment. While for the groups (G1–G3), the mice were administered with appropriate treatments, respectively, without AMF exposure. The body weight and tumor sizes of the mice were recorded every fifth day and the tumor volume was calculated using the equation:
 | (5) |
At pre-determined time points (Fig. 6a), the mice were sacrificed and vital organs as well as tumors were harvested, measured, fixed in 4% PFA and processed for histopathological investigation. Animals were sacrificed if their tumors exceeded >2000 mm3. Paraffin sectioning of the fixed tissues was performed to obtain 5 μm-thick sections on gelatin-coated slides. Hematoxylin and Eosin (H&E) staining was performed to determine the toxicity of the appropriate treatments on the mouse tissue sections and the slides were visualized using an Olympus brightfield microscope.53
4.17. Statistics
All the experiments were performed in triplicate. One-way and two-way ANOVA analyses were performed using GraphPad Prism 8 software to determine the statistical significance between the groups. *p < 0.01, ***p = 0.0002 and ****p < 0.0001 were considered statistically significant.Author contributions
Conceptualization: TK and DS. Formal analysis, investigation, methodology, visualization, and writing – original draft: TK. Funding acquisition, project administration, resources, supervision, writing – review and editing, and validation: DS.Conflicts of interest
There are no conflicts to declare.Acknowledgements
This work was supported by CSIR-HRDG under Grant 01/3134/23/EMR-II. The authors also acknowledge the Indian Institute of Science Education and Research (IISER) Mohali for the animal house facility. We are grateful to Ms Neeta Devi for her assistance with the in vivo experiments. The schematic representative figures were created using BioRender.com.References
- A. E. Nejad, S. Najafgholian, A. Rostami, A. Sistani, S. Shojaeifar, M. Esparvarinha, R. Nedaeinia, S. Haghjooy Javanmard, M. Taherian, M. Ahmadlou, R. Salehi, B. Sadeghi and M. Manian, Cancer Cell Int., 2021, 21, 62 CrossRef PubMed.
- T. Stylianopoulos, L. L. Munn and R. K. Jain, Trends Cancer, 2018, 4, 292–319 CrossRef CAS PubMed.
- A. Sundaram, L. Peng, L. Chai, Z. Xie, J. S. Ponraj, X. Wang, G. Wang, B. Zhang, G. Nie, N. Xie, M. R. Kumar and H. Zhang, Nanoscale, 2020, 12, 21497–21518 RSC.
- M. R. Choi, K. J. Stanton-Maxey, J. K. Stanley, C. S. Levin, R. Bardhan, D. Akin, S. Badve, J. Sturgis, J. P. Robinson, R. Bashir, N. J. Halas and S. E. Clare, Nano Lett., 2007, 7, 3759–3765 CrossRef CAS PubMed.
- X. Song, L. Feng, C. Liang, K. Yang and Z. Liu, Nano Lett., 2016, 16, 6145–6153 CrossRef CAS PubMed.
- C.-H. Luo, C.-T. Huang, C.-H. Su and C.-S. Yeh, Nano Lett., 2016, 16, 3493–3499 CrossRef CAS PubMed.
- J.-X. Fan, Z.-H. Li, X.-H. Liu, D.-W. Zheng, Y. Chen and X.-Z. Zhang, Nano Lett., 2018, 18, 2373–2380 CrossRef CAS PubMed.
- T. Kaur and D. Sharma, in Advances in Applied Microbiology, ed. G. S. Makowski and S. Sariaslani, Elsevier Academic Press, Cambridge, 2023, vol. 3, pp. 91–131 Search PubMed.
- S. N. Jiang, T. X. Phan, T. K. Nam, V. H. Nguyen, H. S. Kim, H. S. Bom, H. E. Choy, Y. Hong and J. J. Min, Mol. Ther., 2010, 18, 635–642 CrossRef CAS PubMed.
- L. He, H. Yang, J. Tang, Z. Liu, Y. Chen, B. Lu, H. He, S. Tang, Y. Sun, F. Liu, X. Ding, Y. Zhang, S. Hu and L. Xia, J. Biol. Eng., 2019, 13, 58 CrossRef CAS PubMed.
- N. Ngo, K. Choucair, J. F. Creeden, H. Qaqish, K. Bhavsar, C. Murphy, K. Lian, M. T. Albrethsen, L. Stanbery, R. C. Phinney, F. C. Brunicardi, L. Dworkin and J. Nemunaitis, Future Oncol., 2019, 15, 3861–3876 CrossRef CAS PubMed.
- E. Abdolalipour, M. Mahooti, A. Salehzadeh, A. Torabi, S. R. Mohebbi, A. Gorji and A. Ghaemi, Microb. Pathog., 2020, 145, 104207 CrossRef CAS PubMed.
- B. Yu, M. Yang, L. Shi, Y. Yao, Q. Jiang, X. Li, L. H. Tang, B. J. Zheng, K. Y. Yuen, D. K. Smith, E. Song and J. D. Huang, Sci. Rep., 2012, 2, 436 CrossRef PubMed.
- Q. Hu, M. Wu, C. Fang, C. Cheng, M. Zhao, W. Fang, P. K. Chu, Y. Ping and G. Tang, Nano Lett., 2015, 15, 2732–2739 CrossRef CAS PubMed.
- M. T. Q. Duong, Y. Qin, S. H. You and J. J. Min, Exp. Mol. Med., 2019, 51, 1–15 CrossRef CAS PubMed.
- R. Gupta and D. Sharma, ACS Chem. Neurosci., 2019, 10, 1157–1172 CrossRef CAS PubMed.
- R. Gupta, T. Kaur, A. Chauhan, R. Kumar, B. K. Kuanr and D. Sharma, Biomater. Adv., 2022, 139, 213021 CrossRef CAS PubMed.
- Y. Du, X. Liu, Q. Liang, X. J. Liang and J. Tian, Nano Lett., 2019, 19, 3618–3626 CrossRef CAS PubMed.
- T. Sadhukha, L. Niu, T. S. Wiedmann and J. Panyam, Mol. Pharmaceutics, 2013, 10, 1432–1441 CrossRef CAS PubMed.
- W. J. Atkinson, I. A. Brezovich and D. P. Chakraborty, IEEE Trans. Biomed. Eng., 1984, 31, 70–75 CAS.
- I. A. Brezovich, W. J. Atkinson and M. B. Lilly, Cancer Res., 1984, 44, 4752s–4756s CAS.
- M. Overchuk and G. Zheng, Biomaterials, 2018, 156, 217–237 CrossRef CAS PubMed.
- R. Gupta, A. Chauhan, T. Kaur, B. K. Kuanr and D. Sharma, Nanoscale, 2022, 14, 17589–17606 RSC.
- P. Kowalik, J. Mikulski, A. Borodziuk, M. Duda, I. Kamińska, K. Zajdel, J. Rybusinski, J. Szczytko, T. Wojciechowski, K. Sobczak, R. Minikayev, M. Kulpa-Greszta, R. Pazik, P. Grzaczkowska, K. Fronc, M. Lapinski, M. Frontczak-Baniewicz and B. Sikora, J. Phys. Chem. C, 2020, 124, 6871–6883 CrossRef CAS PubMed.
- R. Gupta and D. Sharma, ACS Appl. Nano Mater., 2020, 3, 2026–2037 CrossRef CAS.
- R. Gupta and D. Sharma, Int. J. Hyperthermia, 2019, 36, 301–311 CrossRef CAS PubMed.
- A. Nikitin, M. Khramtsov, A. Garanina, P. Mogilnikov, N. Sviridenkova, I. Shchetinin, A. Savchenko, M. Abakumov and A. Majouga, J. Magn. Magn. Mater., 2019, 469, 443–449 CrossRef CAS.
- E. Alphandéry, S. Faure, L. Raison, E. Duguet, P. A. Howse and D. A. Bazylinski, J. Phys. Chem. C, 2011, 115, 18–22 CrossRef.
- D. Gandia, L. Gandarias, I. Rodrigo, J. Robles-García, R. Das, E. Garaio, J. Á. García, M.-H. Phan, H. Srikanth, I. Orue, J. Alonso, A. Muela and M. L. Fdez-Gubieda, Small, 2019, 15, 1902626 CrossRef CAS PubMed.
- M. L. Fdez-Gubieda, J. Alonso, A. García-Prieto, A. García-Arribas, L. Fernández Barquín and A. Muela, J. Appl. Phys., 2020, 128, 070902 CrossRef CAS.
- J. J. Jacob and K. Suthindhiran, Mater. Sci. Eng., C, 2016, 68, 919–928 CrossRef CAS PubMed.
- K. T. Silva, P. E. Leão, F. Abreu, J. A. López, M. L. Gutarra, M. Farina, D. A. Bazylinski, D. M. G. Freire and U. Lins, Appl. Environ. Microbiol., 2013, 79, 2823–2827 CrossRef CAS PubMed.
- M. Martín, F. Carmona, R. Cuesta, D. Rondón, N. Gálvez and J. M. Domínguez-Vera, Adv. Funct. Mater., 2014, 24, 3489–3493 CrossRef.
- Z. Qiu, Y. Peng, D. He, Y. Wang and S. Chen, J. Mater. Sci., 2018, 53, 12322–12333 CrossRef CAS.
- X. Hou, W. Zhang, X. Wang, S. Hu and C. Li, Sci. Bull., 2015, 60, 884–891 CrossRef CAS.
- E. Liu, H. Yuan, Z. Kou, X. Wu, Q. Xu, Y. Zhai, Y. Sui, B. You, J. Du and H. Zhai, Sci. Rep., 2015, 5, 11164 CrossRef PubMed.
- N. Torres-Gómez, O. Nava, L. Argueta-Figueroa, R. García-Contreras, A. Baeza-Barrera and A. R. Vilchis-Nestor, J. Nanomater., 2019, 2019, 7921273 Search PubMed.
- R. Das, N. Rinaldi-Montes, J. Alonso, Z. Amghouz, E. Garaio, J. A. García, P. Gorria, J. A. Blanco, M. H. Phan and H. Srikanth, ACS Appl. Mater. Interfaces, 2016, 8, 25162–25169 CrossRef CAS PubMed.
- N. Fernández-Bertólez, C. Costa, F. Brandão, G. Kiliç, J. A. Duarte, J. P. Teixeira, E. Pásaro, V. Valdiglesias and B. Laffon, Food Chem. Toxicol., 2018, 118, 13–23 CrossRef PubMed.
- A. Kunzmann, B. Andersson, C. Vogt, N. Feliu, F. Ye, S. Gabrielsson, M. S. Toprak, T. Buerki-Thurnherr, S. Laurent, M. Vahter, H. Krug, M. Muhammed, A. Scheynius and B. Fadeel, Toxicol. Appl. Pharmacol., 2011, 253, 81–93 CrossRef CAS PubMed.
- S. Dagher, A. Soliman, A. Ziout, N. Tit, A. Hilal-Alnaqbi, S. Khashan, F. Alnaimat and J. A. Qudeiri, Mater. Res. Exp., 2018, 5, 065518 CrossRef.
- D. Chen, Q. Tang, X. Li, X. Zhou, J. Zang, W.-q. Xue, J.-y. Xiang and C.-q. Guo, Int. J. Nanomed., 2012, 7, 4973–4982 CrossRef CAS PubMed.
- O. Abdel-Salam, S. Nada, N. Salem, M. S. El-Shamarka and E. Omara, Comp. Clin. Pathol., 2014, 23, 1069–1085 CrossRef CAS.
- J. Isasi, P. Arévalo, E. Martin and F. Martín-Hernández, J. Sol-Gel Sci. Technol., 2019, 91, 596–610 CrossRef CAS.
- H. Kakwere, M. P. Leal, M. E. Materia, A. Curcio, P. Guardia, D. Niculaes, R. Marotta, A. Falqui and T. Pellegrino, ACS Appl. Mater. Interfaces, 2015, 7, 10132–10145 CrossRef CAS PubMed.
- A. Espinosa, R. Di Corato, J. Kolosnjaj-Tabi, P. Flaud, T. Pellegrino and C. Wilhelm, ACS Nano, 2016, 10, 2436–2446 CrossRef CAS PubMed.
- R. Kumar, A. Chauhan, S. K. Jha and B. K. Kuanr, J. Alloys Compd., 2019, 790, 433–446 CrossRef CAS.
- X. N. Wang, M. T. Niu, J. X. Fan, Q. W. Chen and X. Z. Zhang, Nano Lett., 2021, 21, 4270–4279 CrossRef CAS PubMed.
- R. Gupta and D. Sharma, Nanoscale Adv., 2021, 3, 3663–3680 RSC.
- S. Piehler, L. Wucherpfennig, F. L. Tansi, A. Berndt, R. Quaas, U. Teichgraeber and I. Hilger, Nanomedicine, 2020, 28, 102183 CrossRef CAS PubMed.
- M. Chen, G. Deng, Y. He, X. Li, W. Liu, W. Wang, Z. Zhou, H. Yang and S. Yang, ACS Appl. Bio Mater., 2020, 3, 639–647 CrossRef CAS PubMed.
- Y. Liu, Z. Guo, F. Li, Y. Xiao, Y. Zhang, T. Bu, P. Jia, T. Zhe and L. Wang, ACS Appl. Mater. Interfaces, 2019, 11, 31649–31660 CrossRef CAS PubMed.
- L. J. Jia, H. M. Xu, D. Y. Ma, Q. G. Hu, X. F. Huang, W. H. Jiang, S. F. Li, K. Z. Jia, Q. L. Huang and Z. C. Hua, Cancer Biol. Ther., 2005, 4, 840–845 CrossRef CAS PubMed.
- J. Chen, S. Lin, D. Zhao, L. Guan, Y. Hu, Y. Wang, K. Lin and Y. Zhu, Adv. Func. Mater., 2021, 31, 2006853 CrossRef CAS.
- K. S. M. Smalley, M. Lioni, K. Noma, N. K. Haass and M. Herlyn, Expert Opin. Drug Discovery, 2008, 3, 1–10 CrossRef CAS PubMed.
- G. Lazzari, V. Nicolas, M. Matsusaki, M. Akashi, P. Couvreur and S. Mura, Acta Biomater., 2018, 78, 296–307 CrossRef CAS PubMed.
- W. Lin, Y. Liu, J. Wang, Z. Zhao, K. Lu, H. Meng, R. Luoliu, X. He, J. Shen, Z. W. Mao and W. Xia, Angew. Chem., Int. Ed., 2023, 62, e202310158 CrossRef CAS PubMed.
- T. Harimoto, Z. S. Singer, O. S. Velazquez, J. Zhang, S. Castro, T. E. Hinchliffe, W. Mather and T. Danino, Proc. Natl. Acad. Sci. U. S. A., 2019, 116, 9002–9007 CrossRef CAS PubMed.
- F. Thayyullathil, S. Chathoth, A. Hago, M. Patel and S. Galadari, Free Radical Biol. Med., 2008, 45, 1403–1412 CrossRef CAS PubMed.
Footnote |
| † Electronic supplementary information (ESI) available: DLS and zeta potential profiles, XPS spectra, FTIR spectra, cell viability analysis, calorimetric hyperthermia profiles and confocal laser scanning images of BacMags. See DOI: https://doi.org/10.1039/d3nr05082c |
| This journal is © The Royal Society of Chemistry 2024 |