
 Open Access Article
 This Open Access Article is licensed under a
 Creative Commons Attribution 3.0 Unported Licence
Tracking performance and disturbance in decentralized wastewater treatment systems with fluorescence spectroscopy†
Natalie
Mladenov
 *a,
Scott
Sanfilippo
a,
Laura
Panduro
a,
Chelsi
Pascua
a,
Armando
Arteaga
b and
Bjoern
Pietruschka
c
*a,
Scott
Sanfilippo
a,
Laura
Panduro
a,
Chelsi
Pascua
a,
Armando
Arteaga
b and
Bjoern
Pietruschka
c
aDepartment of Civil, Construction, and Environmental Engineering, San Diego State University, San Diego, CA 92182, USA. E-mail: nmladenov@sdsu.edu
bDepartamento de Estudios Urbanos y del Medio Ambiente, El Colegio de la Frontera Norte, Tijuana 22560, Mexico
cWASH R&D Centre, University of KwaZulu-Natal, Durban, South Africa
First published on 23rd April 2024
Abstract
Fluorescence spectroscopy holds promise as a rapid tracer of performance in decentralized wastewater treatment systems (DEWATS) that may reduce the monitoring burden on communities. In this study, we examined changes in chemical oxygen demand (COD), fluorescence-based indices, and parallel factor analysis (PARAFAC) modeled components under normal operation and during periods of disturbance at the time of scum removal in real decentralized treatment settings and in laboratory simulated wastewater treatment with an anaerobic baffled reactor (ABR). Amino acid-like peaks T and B and PARAFAC component C2 (with excitation/emission peak at 281/335 nm) decreased from influent to effluent due to preferential degradation of labile organic compounds, and the C2 decrease was significantly correlated (p < 0.01) with COD removal. The humification index (HIX) increased by ∼190% on average from influent to effluent during normal operation of all of the anaerobic and aerobic DEWATS evaluated in this study, further supporting the preferential removal of labile constituents during treatment. Meanwhile, a newly identified component, C3, with excitation between 410 and 420 nm and emission at 470 nm, increased under normal operation and may represent the formation of coenzyme 420 during biodegradation. Disturbance during scum removal disrupted preferential removal of peak T and resulted in a much lower change in HIX (only 24% increase) from influent to effluent. Recirculation of effluent into the influent stream was found to greatly reduce scum formation in lab-based ABRs while still maintaining a high removal of COD and peak T and producing substantial increase in HIX. The fluorescence-based indices were found to be robust indicators for tracking performance issues in DEWATS.
Water impactFluorescence indicators, including tryptophan-like and F420-like fluorophores and humification index, tracked degradation of labile organic matter in lab-scale and real world, community-scale anaerobic baffled reactors (ABRs). Recirculation of effluent in ABRs alleviated scum buildup and minimally impacted performance. The establishment of rapidly measured fluorescence indicators can reduce the burden of wastewater monitoring in decentralized systems. |
1. Introduction
Wastewater treatment systems are designed primarily for the removal of solids and organic matter; therefore, substantial attention has been paid over the years to optimizing biological oxygen demand (BOD) and chemical oxygen demand (COD) removal efficiencies in wastewater treatment systems. Fluorescence-based metrics have now been widely used to monitor performance, including organics removal, of conventional, centralized wastewater treatment systems.1–4 Using fluorescence three-dimensional excitation emission matrix (EEM) and parallel factor analysis (PARAFAC) modeling, Cohen et al.2 demonstrated that both protein-like and humic-like components were important for evaluating the efficacy of biological treatment in centralized wastewater treatment plants.There is also a motivation to better understand the use of fluorescence spectroscopy as a monitoring tool in decentralized settings. In many decentralized settings, anaerobic treatment systems are preferred because they tend to require low capital costs, low maintenance (compared to centralized, aerobic treatment facilities), low energy, and low sludge generation; although they are not able to achieve nutrient removal without additional polishing or treatment steps. While the use of fluorescence-based metrics for evaluating organic matter removal should be similar in decentralized and centralized wastewater treatment systems, there are both operational (e.g., variable hydraulic loading rates) and process-level (e.g., greater reliance on anaerobic processes) differences that motivate further study into how fluorescence-based metrics track the transformation of organic constituents in decentralized systems. Mladenov et al.5 compared changes in fluorescence peak intensities with COD removal efficiencies in a decentralized system using an anaerobic baffled reactor–anaerobic filter–constructed wetland (ABR–AF–CW) treatment train in South Africa and found that tryptophan-like fluorescence could serve as a surrogate for soluble COD (sCOD). Fluorescence-based sensors could provide early warning of failures or performance issues; however, this has been explored to a lesser extent in community or household scale wastewater treatment systems.
Although the compartmentalized configuration of ABRs makes them more resilient to shock loads, variable flow conditions, and other disturbance,6 the treatment efficiency of anaerobic wastewater treatment systems, including ABRs, can be severely impacted by scum formation,7 which may be monitored using fluorescence-based metrics. Disturbance from the buildup of fats, oils, and grease (FOG) in scum layers was recently shown to negatively impact performance of an ABR–anaerobic filter (AF) system treating domestic wastewater from a community of ∼80 homes in Durban, South Africa (Pietruschka, pers. comm.). In the ABR–AF system in South Africa, scum was observed to accumulate nearly 25 cm in one week, and its buildup necessitated weekly descumming. Manual scum removal, performed by technicians scraping and scooping scum layers, also may represent a disturbance to sludge blanket function in ABR systems. Therefore, alternative strategies for scum removal are needed, and rapid techniques for monitoring the effects of scum formation and removal on ABR system performance are warranted.
To address the aforementioned needs, the goals of this study were to: 1) determine values for fluorescence indices, components, and peak intensities in ABR treatment systems under undisturbed operation and 2) apply fluorescence-based indicators to evaluate the disturbance introduced via scum buildup, manual scum removal, and scum reduction with effluent recirculation. Fluorescence-based metrics and COD removal efficiencies were monitored under conditions of undisturbed operation and disturbance in lab-scale and real world decentralized treatment systems, including an ABR–AF system operating in Durban, South Africa and a lab-scale ABR treating real and synthetic wastewater. For comparison, the performance metrics of an aerobic, decentralized system in Tijuana, Mexico were also considered.
2. Methods
2.1. Sampling of decentralized wastewater treatment systems
Anaerobic baffled reactors are widely employed as the main biological treatment process in decentralized wastewater treatment systems (DEWATS) to treat domestic wastewater under a range of temperature regimes8,9 and in a variety of settings.10 Grab samples were collected three times per day from ABR influent and AF effluent from a community DEWATS in Durban, South Africa in July 2015 and July 2017. The treatment train is shown in ESI† data and the sampling methods and study site have been previously described.5For comparison with the anaerobic treatment provided by the ABR systems described above, samples were collected from the influent (distribution tank) and biotrickling filter effluent of an aerobic decentralized wastewater treatment plant in Tijuana, Mexico. The sampling methods and study site of this facility have been previously described in Garcia et al.11
2.2. Scum recirculation experiment
A four-chamber, lab-scale ABR with a ∼32 L capacity was operated for almost three years from 2016 to 2018. From 2016 to 2017, the ABR was employed to treat synthetic wastewater (the ESI† data lists the ingredients). The lab-scale ABR (volume of 32 L) was run 5 d per week (Monday through Friday) with continuous pumping (0.056 L min−1) for 12 h followed by ∼12 h of rest/reaction, which simulates the night-time stagnant periods in community-scale ABRs.5 For the other 2 d per week (weekends), the feed was pumped continuously for 12 h followed by 36 h of rest/reaction. Including the rest/reaction periods, the hydraulic residence time (HRT) of the ABR was approximately 36 h, and, during pumping, the upflow velocity was ∼0.12 m h−1.The synthetic wastewater fed to the ABR during 2016–2017 resulted in noticeable scum buildup (due to high fat and dairy ingredients) over time in each chamber of the lab-scale ABR. Prior to scum and water column sampling, scum layers of between 0.5 cm and ∼3 cm were removed. Then, new scum was allowed to accumulate over a 14 d period, which represented 6 feeding cycles of synthetic wastewater. On days 1, 14, and 28, scum was removed completely from each chamber, dried overnight in a drying oven at 103 deg C, and weighed. On day 42, scum was not removed, and the feed solution was altered to contain 50% synthetic wastewater and 50% recirculated treated effluent. This feeding regime was maintained for the remainder of the experiment. On days 56, 70, and 84 scum was removed completely from each chamber, dried in a drying oven at 103 deg C and weighed. Feed water samples were collected two to three times per week with effluent samples collected 36–48 h later to account for the HRT of the ABR.
2.3. Lab-scale ABR treating real wastewater
In 2018, the feed of the lab-scale ABR described above was transitioned to real, untreated, domestic wastewater transported from a local wastewater treatment plant (San Elijo Water Reclamation Facility). At the same time, a lab-scale activated sludge (AS) tank was run in parallel with the ABR. Both AS and ABR treatment systems were fed with untreated domestic wastewater from the same feed tank by peristaltic pump as described in Johnson et al.12 The new wastewater source did not produce scum buildup in the ABR, and the evaluation of these parallel systems is included for general understanding of how fluorescence-based metrics differ among aerobic and anaerobic systems.2.4. Chemical and spectroscopic analyses
Electrical conductivity and pH of the diverse wastewater samples described above were measured with an Accumet 65 pH and conductivity meter. Chemical oxygen demand (COD) concentrations were measured using HACH TNT kits and a HACH DR3900 spectrometer. Three-dimensional excitation emission matrix (EEM) spectra were acquired on ∼4 mL of filtered (through 0.7 μm nominal pore size glass fiber filter) sample placed in a 1 cm pathlength quartz cuvette and measured on a Horiba Aqualog fluorometer. Wastewater is typically a high strength, colored matrix; therefore samples with UV-vis absorbance >0.2 arbitrary units (a.u.) at 254 nm were diluted so that UV-vis absorbance remained below 0.2 to allow inner filter correction to be applied. Samples were run with an integration time of 0.25 s, an excitation range from 240 nm to 450 nm at 2.33 nm increments, and an emission range of 275 nm to 600 nm at 5 nm increments. Using Matlab, EEM data were inner-filter corrected, normalized to the Raman area, blank subtracted, and the Rayleigh first and second order scatter bands were excised.Fluorescence-based indices have proven to be robust indicators of dissolved organic matter (DOM) sources and biogeochemical processing. The fluorescence index (FI) was proposed by McKnight et al.13 to distinguish microbial and terrestrial sources of DOM. FI is calculated as the ratio of fluorescence intensities at emission wavelengths of 470 nm and 520 nm and excitation wavelength of 370 nm (as per ref. 14). Lower values of FI (∼1.3 to 1.4) are associated with DOM of terrestrial sources, while higher values (∼1.7 to 1.9) indicate microbially-derived DOM.13 FI values greater than 2.0 typically indicate wastewater-derived DOM.15 The humification index (HIX) was calculated as the ratio of peak area under the emission spectra at 435–480 nm to peak area from 300 to 345 nm obtained at an excitation wavelength of 254 nm, and denotes increased C/H ratios and greater humification of organic matter.16 The freshness index (FrI) was calculated as in ref. 17, and is the ratio of emission intensity at 380 nm divided by the emission intensity maximum observed between 420 and 435 nm, obtained at an excitation of 310 nm. Nomenclature reported for ubiquitous tyrosine-like peak B, tryptophan-like peak T, and humic-like peaks A, C, and M follows18 with peak intensity locations as follows: peak A (260/max(380![[thin space (1/6-em)]](https://www.rsc.org/images/entities/char_2009.gif) :460) nm), peak B (275/310 nm), peak T (275/340 nm), peak C (350/max(420:480) nm), peak M (312/max(380:420) nm).
:460) nm), peak B (275/310 nm), peak T (275/340 nm), peak C (350/max(420:480) nm), peak M (312/max(380:420) nm).
A parallel factor analysis model was performed using 128 corrected, lab-scale ABR and community ABR influent and effluent sample EEMs (94 EEMs from the treatment train of the community ABR in Durban, South Africa and 34 EEMs from the lab-scale ABR treating real and synthetic wastewater). The PARAFAC model was constructed using “drEEM Toolbox” (version 0.2.0)19 with MATLAB R2018a software (The MathWorks Inc.). Outliers were removed, as recommended in ref. 20, and the procedure, including examination of spectral loadings and residual analysis, was run with nonnegativity constraints. A series of models with three to seven components were evaluated (Fig. S3 and S4†), and core consistency analysis gave measurements of 98.5% for a 3-component model, 78.3% for a 4-component model, 66.4% for a 5-component model, 60.8% for a 6-component model, and 3.4% for a 7-component model. The 3-component model was the only one that validated with split-half analysis, and those results are presented here.
3. Results
3.1. Tracking ABR performance with fluorescence
Typical values for COD concentration, the FI and other fluorescence-based indices (HIX and FrI), and peak intensities (peaks A, B, T, C, and M) in diverse decentralized wastewater treatment systems, including the ABR–AF system treating domestic wastewater from a small community in South Africa and a lab-scale ABR treating synthetic and real wastewater, are given in the ESI† data. Overall, the COD removal efficiencies of ABR-based wastewater treatment systems evaluated in this study (achieving 50–80% COD removal) were consistent with those reported in other studies evaluating ABR technology for domestic wastewater treatment.5,8,21 We also found that FI values of untreated wastewater influent were typically high (>2.0 in all of our samples) and that, from influent to effluent, FI values increased by 18% on average (treatment systems with scum issues were not included), FrI did not change significantly, and the HIX increased by 190% on average during normal operation (Table 1).| Type of wastewater | Treatment type | Year of sampling | N | Percent decrease from influent to effluent of bioreactor | ||||||||
|---|---|---|---|---|---|---|---|---|---|---|---|---|
| COD | FI | FrI | HIX | Peak A | Peak B | Peak T | Peak C | Peak M | ||||
| a Values for WW treatment systems during disturbance periods are italicized. | ||||||||||||
| Domestic wastewater, South Africa | Community ABR normal operation (no scum issues) | 2015 | 8 | 55 | −6 | 5 | −80 | 39 | 68 | 60 | 9 | 28 |
| (12) | (2) | (14) | (27) | (7) | (4) | (6) | (4) | (11) | ||||
| Community ABR during scum accumulation | 2017 | 6 | 35 | −2 | −4 | −45 | 14 | 44 | 28 | −2 | 13 | |
| (2) | (1) | (1) | (7) | (4) | (5) | (4) | (4) | (6) | ||||
| Community ABR after scum removal | 2017 | 6 | 20 | −18 | 33 | −4 | −9 | 11 | 5 | −29 | −18 | |
| (20) | (14) | (42) | (42) | (30) | (24) | (25) | (26) | (31) | ||||
| “Dairy-like” synthetic wastewater | Lab ABR normal operation w/ scum | 2017 | 10 | 67 | −48 | 22 | −283 | 56 | 92 | 90 | 63 | 61 |
| (15) | (26) | (9) | (65) | (5) | (1) | (2) | (4) | (15) | ||||
| Lab ABR after scum removal | 2017 | 6 | 64 | −21 | 6 | −44 | 29 | 24 | 49 | 31 | 36 | |
| (16) | (21) | (41) | (67) | (51) | (43) | (29) | (50) | (30) | ||||
| “Dairy-like” synthetic wastewater | Lab ABR normal operation w/ scum | 2018 | 6 | 75 | −47 | 4 | −359 | 77 | 84 | 83 | 14 | 17 |
| (7) | (18) | (9) | (80) | (3) | (4) | (4) | (12) | (19) | ||||
| Lab ABR after recirculation | 2018 | 5 | 71 | −34 | 9 | −389 | 75 | 83 | 83 | 5 | 11 | |
| (6) | (9) | (6) | (69) | (4) | (5) | (4) | (8) | (11) | ||||
| Real, domestic wastewater, USA | Lab ASB | 2018 | 3 | 85 | −3 | −16 | −203 | 47 | 78 | 71 | 8 | 37 |
| (93) | (3) | (7) | (92) | (4) | (12) | (13) | (7) | (3) | ||||
| Lab ABR | 2018 | 3 | 81 | 1 | −8 | −90 | 53 | 75 | 64 | 28 | 44 | |
| (93) | (3) | (3) | (16) | (14) | (5) | (7) | (18) | (15) | ||||
| Real, domestic wastewater, Mexico | Bio-trickling filter | 2019–2020 | 5 | 59 | −5 | −2 | −123 | 64 | — | 71 | 48 | 27 |
| (2) | (6) | (5) | (37) | (9) | — | (6) | (8) | (15) | ||||
| Average of all WW treatment systems under normal operationa | — | 35 | 70 | −18 | 1 | −190 | 56 | 79 | 73 | 28 | 36 | |
| (12) | (23) | (13) | (113) | (13) | (9) | (11) | (23) | (15) | ||||
Under lab-scale ABR and community ABR treatment, EEMs contained the ubiquitous peaks B, T, A, M, and C. Tryptophan-like peak T and tyrosine-like peak B were the most pronounced in the influent samples, especially in synthetic wastewater, whereas intensities of humic-like peaks A, C, and M were much lower (Fig. 1a). Even in the real, domestic wastewater influent treated by a lab-scale ABR and community ABR (Fig. 1b and c), peaks A and C had 3 to 10 times lower intensities than peaks B and T.
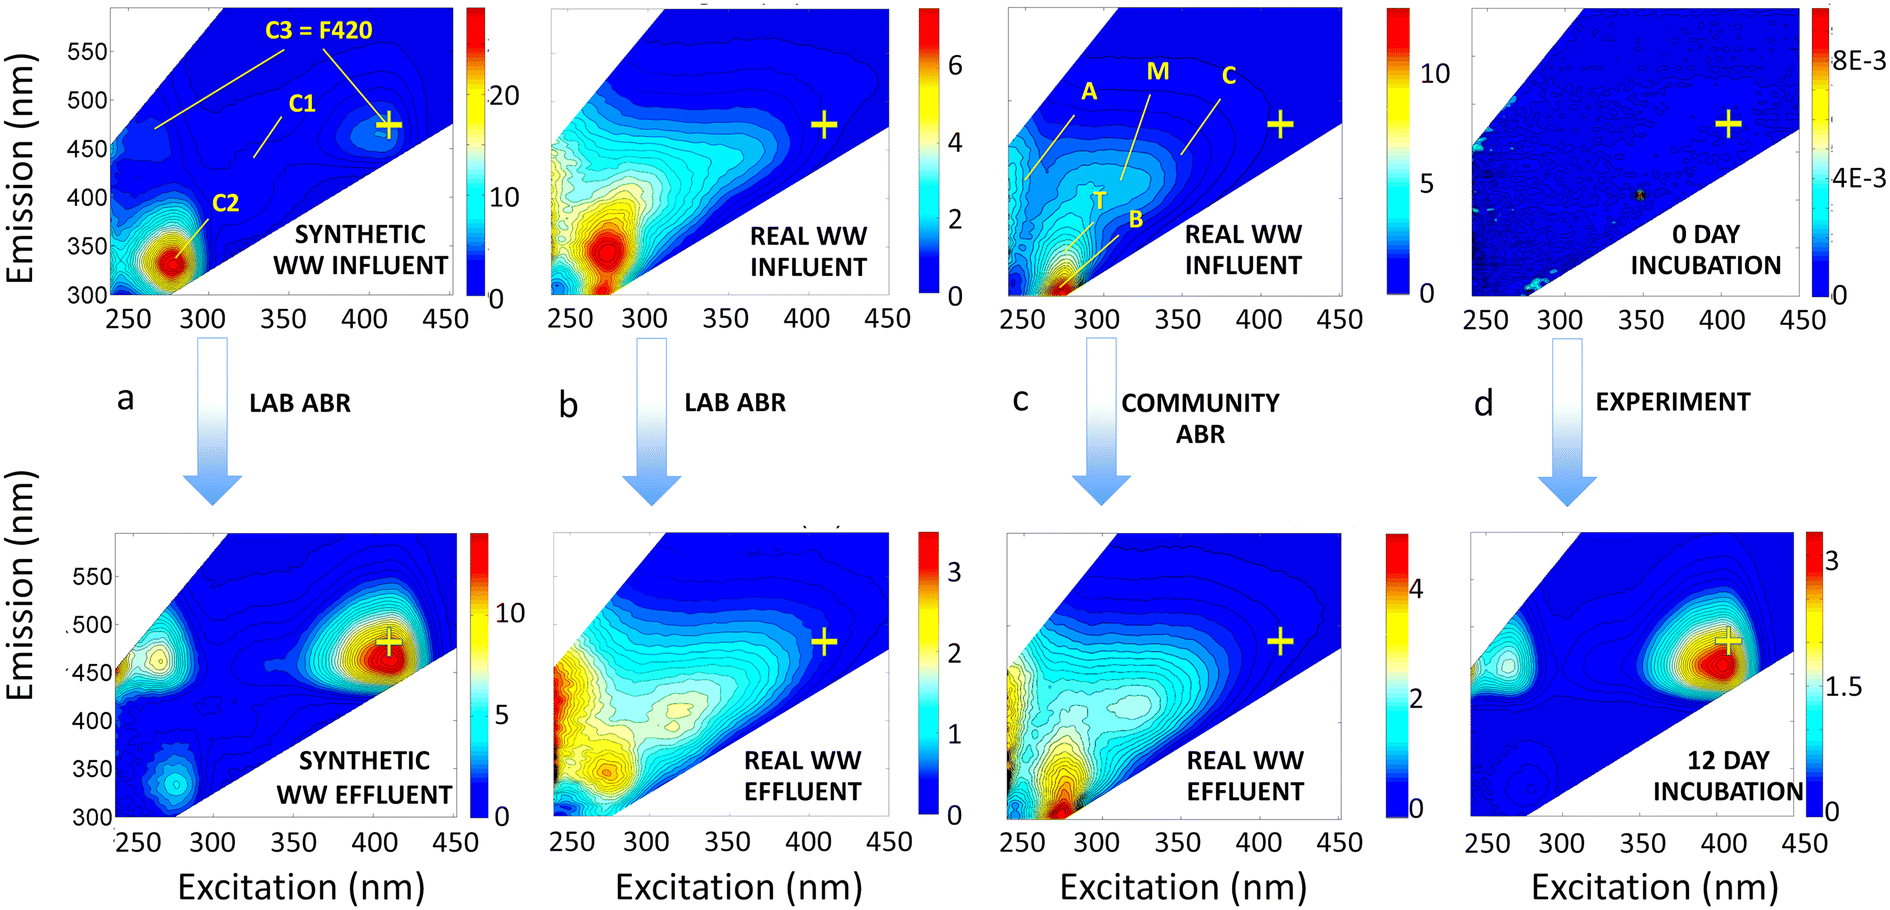 | ||
| Fig. 1 Representative EEM spectra, showing influent (top) and effluent (bottom) of a lab-scale ABR fed with synthetic wastewater (a), a lab-scale ABR fed with real domestic wastewater (b), a decentralized ABR–AF treatment plant fed by domestic wastewater from a community in South Africa (c), and a solution of glutamate and P. syringae bacteria before (top) and after (bottom) 12 d of incubation (d). Letters denote typical EEM peaks A, C, M, T, and B and “+” denotes the F420-like fluorescent peak. The locations of PARAFAC components 1–3 (C1–C3) are shown in 1a. Note, each EEM has a different colorbar scale for improved resolution of the peaks. | ||
There are also important changes to note in the fluorescence-based metrics that correspond to the COD treatment efficiencies of different biological treatment systems. Effluent EEMs showed consistent reduction of overall fluorescence, which coincided with decreases in COD concentrations of ∼70% (Table 1). Under normal operating conditions, effluent EEMs also showed substantial decreases in protein-like peaks B and T of 79% and 73%, respectively (Table 1). This large decrease in protein-like fluorescence had been previously reported for the community ABR (Mladenov et al. 2018 (ref. 5)) and attributed to preferential degradation of labile organic compounds along the treatment train. Correlation analysis of all of the treatment types and conditions listed in Table 1, showed that COD removal was correlated with a decrease in all peak fluorescence intensities but most notably with the decrease in peak T and peak B fluorescence (all peak correlations are shown in Fig. S5†), supporting that greater COD removal resulted in preferential degradation of these protein-like peaks.
Our PARAFAC model further explores the changes in dominant fluorescent components from influent to effluent. Three components were identified, with peak maxima at excitation/emission wavelengths (ex/em) of 240(335)/425 nm for C1, 281/335 nm for C2, and 410(242)/470 nm for C3 (Fig. 2). Minor emission peaks in C2 and C3 (with peak areas that were 3.7% and 1.2%, respectively, of the dominant peak) are artifacts, due to Rayleigh scatter features that could not be further excised. C1 has been described in numerous other studies18,22 as representing humic or fulvic acids or humic-like compounds. A similar component in Ishii and Boyer,23 which they called “component 3,” was also associated with humic compounds.
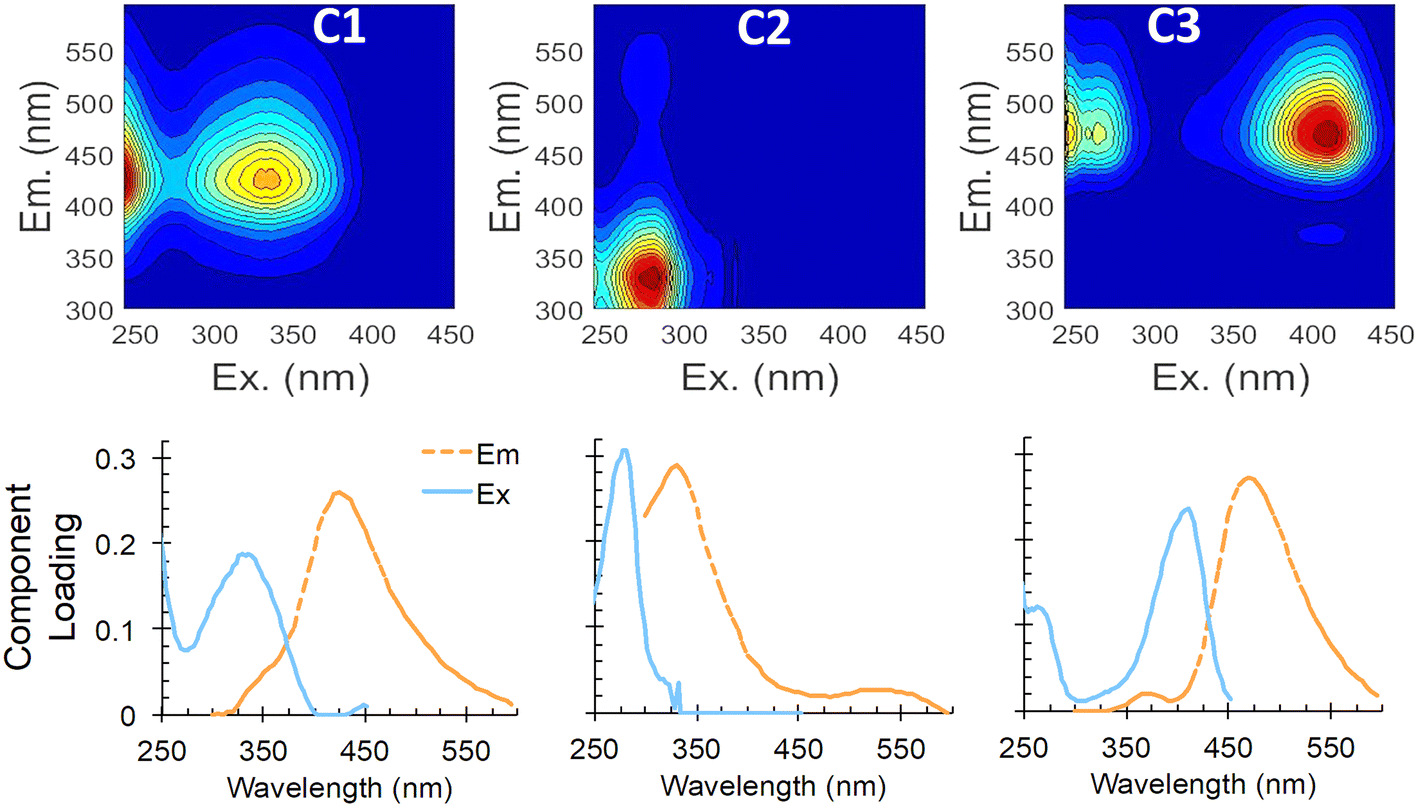 | ||
| Fig. 2 PARAFAC model results showing EEMs of components 1–3 (C1–C3; top) and two-dimensional profiles of excitation and emission curves for each component (bottom). | ||
C2 also has been widely reported22 and is associated with amino acid-like fluorescence of tyrosine and tryptophan (peaks B and T, respectively). Yang et al.24 provides a comprehensive review of PARAFAC components encountered in drinking water and wastewater treatment, and noted two common PARAFAC components, tyrosine-like component Ty and tryptophan-like component Try, that were preferentially degraded during biological treatment in multiple studies, compared to more humic-like components, which showed less degradation.
Component C3 in our PARAFAC model has not been reported in previous aquatic DOM or wastewater treatment studies, but seems to be the combination of a low excitation wavelength peak (242 nm) and a higher wavelength peak at 410–420 nm excitation, which may be due to coenzyme 420 (described later), both with emission at ∼470 nm. In our lab-scale ABR samples, C3 increased by 85% on average, while C2 decreased on average by 63%. In our real wastewater samples, the increase in C3 and decrease in C2 were less pronounced (30% increase of C3 and 15% decrease of C2; Table 1), but still notable.
3.2. Influence of scum buildup on reactor performance and fluorescence metrics
Scum formation and the weekly scum removal process (manual removal of the scum layer in each ABR chamber) had a negative impact on COD removal efficiencies in the community ABR–AF system in Durban, South Africa, which were ∼55% in 2015 under normal operating conditions and decreased to 20% in the days immediately following manual scum removal in 2017 (Table 1).The decrease in COD removal efficiencies was accompanied by changes in fluorescence indices and peak intensities after scum removal in both the community ABR and lab-scale ABR, indicating a disturbance from normal patterns. The main changes were to the HIX and peaks B and T. The HIX slightly increased after manual scum removal (by only 4% and 44% in the community ABR and lab-scale ABR, respectively, or an average of 24% in both systems), compared to the nearly 200% increase under normal operating conditions (Table 1). Peaks B and T, which normally were preferentially removed during wastewater treatment (>70% removal) underwent much lower reductions of 5% to 49% after scum removal (Table 1). Fig. S6† also shows the large decrease in peak T fluorescence that occurred in the community-scale ABR in 2015 and the much smaller change in peak T and the HIX during the scum accumulation and removal conditions in 2017.
Similarly, component C2, representative of peaks B and T, decreased only slightly in the ABR effluent after scum removal, staying at 70% of total fluorescence (or a loading of ∼0.84 RU), compared to 20% of total fluorescence (or a loading of ∼0.20 RU) before scum removal (Fig. 3). The microbially-produced component C3 (similar to co-enzyme F420), which should have increased to >60% in ABR effluent under normal conditions, only increased to ∼ 25% of the total ABR effluent fluorescence after scum removal. C1 was not significantly impacted by scum removal in terms of either loading or % of total fluorescence (Fig. 3).
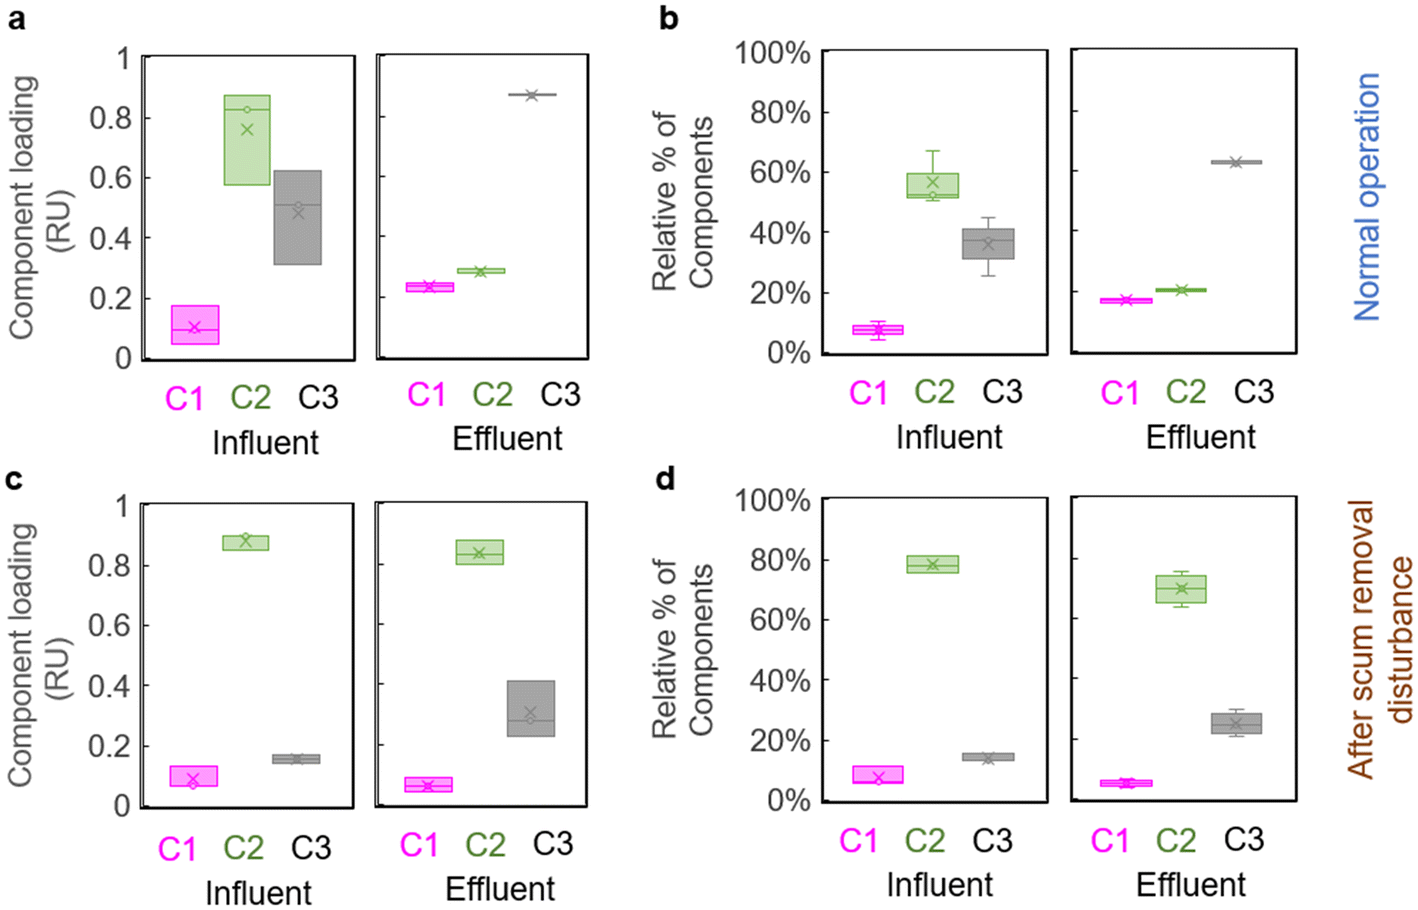 | ||
| Fig. 3 Changes in PARAFAC components during normal operation (top) and after scum removal bottom, expressed a) and c) as component loadings for C1–C3 and b) and d) as the relative amount (%) of total fluorescent loading in a lab-scale ABR treating synthetic wastewater. Influent and effluent samples are paired. The boxplot shows the distribution of data for N = 3 samples for each condition into quartiles, highlighting the mean (x). Whiskers indicate the variability outside the upper and lower quartiles. | ||
3.3. Performance characteristics of fresh and recirculated ABR treatment
Recirculation of treated wastewater was performed to create a 50% influent mixture of fresh wastewater and recirculated effluent. The 50% recirculation resulted in visible decreases in scum buildup in all four chambers of the ABR (photos included in the ESI† data), with the average monthly areal scum loading of 10.6 mg m−2 in chamber 1 reduced to just 2.8 mg m−2 after recirculation (Fig. 4a). Overall, the average monthly mass of scum in the ABR (sum of all four chambers) decreased from 8.91 g to 2.56 g under recirculation conditions (Fig. 4a).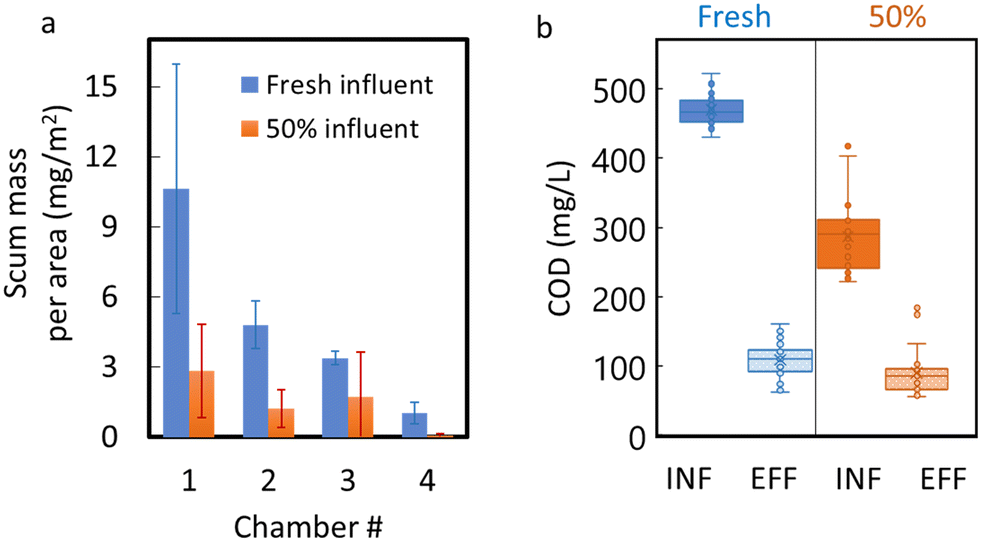 | ||
| Fig. 4 Changes in a) scum mass and b) influent and effluent COD concentrations under operation with fresh, 100% synthetic wastewater influent (blue) and under 50% recirculated (orange) effluent conditions in the lab-scale ABR. | ||
Changes in pH after recirculation were not significant (pH remained circumneutral), but the influent COD decreased significantly (p < 0.001) after recirculation, from ∼475 mg L−1 to ∼280 mg L−1 (Fig. 4b), due to dilution with recirculated effluent. The COD removal efficiency did decrease slightly under recirculation conditions (from 75% to 71%), but the decrease was not significant (p = 0.081). Also, fluorescence-based performance metrics, such as the humification index and peak A and C fluorescence intensities, did not change significantly (Table 1), indicating that recirculation did not substantially influence these performance metrics. Nevertheless, our calculations (Table S7†) show that the biodegradability of the influent was reduced after effluent recirculation ensued. A simple model, assuming first order exponential degradation of the COD concentrations, gives a decay coefficient of 0.041 h−1 for the 100% synthetic wastewater influent, but only a value of 0.032 h−1 when the treated effluent was mixed 50% with synthetic wastewater (recirculated condition).
4. Discussion
4.1. Preferential degradation of protein-like compounds in anaerobic wastewater treatment
Peak T fluorescence has been associated with living and dead cellular material and cellular exudates,3 and both Mladenov et al.5 and Sgroi et al.25 found that tryptophan-like peaks or components were significantly correlated to soluble COD, COD, or 5-day biochemical oxygen demand in the wastewater treatment systems they studied. In studies of centralized wastewater treatment systems, which employed predominantly aerobic biological treatment (activated sludge), there is general consensus that tryptophan-like or peak T fluorescent components degrade to a greater extent than humic-like fluorophores2,24,26 and peak T removal has been recommended as an indicator of biological treatment efficacy.2 These trends may be explained by two, not mutually-exclusive phenomena: 1) that there is higher removal of more labile protein-like structures (represented by peak T) and poor removal of more recalcitrant humic-like compounds (e.g., Hur et al.26) and 2) that humic-like fluorescence is produced when microbially-secreted exocellular enzymes oxidize polyphenols in wastewater into quinones, which are precursors of humic substances.27 Similarly, in a study of biomass growth phases of activated sludge, Maqbool et al.28 offered the explanation that these same changes may occur because soluble microbial products (SMPs) undergo transformation during biomass growth, with more humic-like structures being produced at the expense of freshly produced microbial products.In the present study, we show that the same patterns of decreasing tryptophan-like fluorescence and increasing humic fluorescence and HIX also hold for anaerobic treatment systems, such as the lab-scale ABR treating real and synthetic wastewater and the ABR–AF system5 treating domestic wastewater in South Africa in 2015. Indeed, HIX increased by 190% on average for all wastewater treatment systems under normal operation (Table 1). The decentralized, aerobic treatment system in Tijuana, Mexico11 also showed preferential degradation of peak T fluorescence and an increase of HIX by >120%.
PARAFAC components identified in this study, especially components C2 and C3, further demonstrated the preferential degradation of labile organic compounds. Humic-like component C3, which was always higher in ABR effluent than in influent under normal conditions, seemed to be produced when the amino acid-like component, C2, which is similar to peak T, decreased. These changes support the conclusions from peak-picking described above. Also, the reduction of amino acid-like C2 that we observed with biological treatment is in line with what was observed by Cohen et al.2 for their proteinaceous component C1, which was considered to be an indicator of biological treatment efficacy.
4.2. Performance metrics during two scum maintenance strategies
Scum buildup can have pronounced effects on the performance of wastewater treatment systems due to the presence of long chain fatty acids (LCFAs) in fats, oil, and grease (FOG), which are harder for microorganisms to break down and act as inhibitors to biodegradation.29 Seabloom et al.7 noted that as the depth of scum increases, the treatment efficiency of anaerobic treatment systems decreases. Indeed, in 2017, the community ABR became inundated with scum, with scum layer accumulation of nearly 24 cm reported in one week, which was attributed to high fat content of food in the community serviced by the decentralized wastewater treatment plant.Much like the widely used differential absorbance and fluorescence spectroscopy to evaluate performance in water and wastewater treatment processes,4,30 we found that both the directional change (increase or decrease) as well as the magnitude of the differences in the fluorescence-based metrics before and after treatment were important for evaluating the disturbance from scum buildup in the wastewater treatment systems studied here. Results from the community ABR showed that COD removal efficiencies decreased (from 55% ± 12% to between 20 and 30%) during scum buildup and immediately after scum removal (Table 1). This is consistent with the impairment of performance and release of organics into effluent that occurs in a similar technology, upflow anaerobic sludge blanket (UASB) reactors, upon scum accumulation.31
In addition, changes in the fluorescence-based metrics, HIX and peaks B and T, were affected by scum buildup and removal. Increases in the HIX and decreases in peaks B and T, still occurred, but were much smaller than during normal operation (Table 1). Fluorescence spectroscopy was effective in alerting to the impact of disturbance on the ABR treatment system and corroborated that both the buildup and removal of scum represented major disturbances to ABR performance.
Similarly, the synthetic wastewater treated in the lab-scale ABR, with its high fat and lipid content also built up substantial scum layers in each ABR chamber. Although removal of scum from chambers of the lab-scale ABR changed COD removal efficiency only slightly (from 67% removal to 64% removal), the increase of HIX (at only 44% after scum removal) and decreases in amino acid-like peaks B and T (reaching only 24% and 49%, respectively after scum removal) were much lower than before scum removal (at ∼280% increase in HIX and ∼90% decrease of both peaks B and T; Table 1), indicating reduced biodegradation of labile organic compounds in the ABR. Similarly, PARAFAC components C2 (amino acid-like) and C3 (newly produced component) underwent large changes from influent to effluent during normal operation, but exhibited only slight change after scum removal (Fig. 3), further reflecting the disturbance that scum removal produced on effluent quality.
By contrast, recirculation of treated effluent resulted in major dissipation (50–90% mass reduction) of the floating scum mass in each chamber, with no major impacts to ABR performance metrics. It should be noted that the 50% recirculation did decrease the biodegradability of the influent. A back-of-the envelope calculation (Table S6†) shows that the first order degradation coefficient estimated under 100% synthetic wastewater influent (kd = 0.041 h−1) was reduced under the 50% recirculation protocol (kd = 0.032 h−1). Nevertheless, recirculation caused the scum to dissipate and was still able to maintain high COD removal efficiency (at 71%), with only slight shifts in fluorescent peak intensities and HIX compared to those observed under normal operation (Table 2). Therefore, in ABR systems treating wastewater with high lipid content, recirculation of effluent to the influent chamber may alleviate rapid scum buildup without compromising reactor performance. The tradeoffs between pumping costs for recirculation and costs of manual scum removal should be evaluated. However, avoiding treatment system failure or interruption due to scum buildup and manual scum removal is sure to be an important consideration for addressing this ubiquitous maintenance issue.
| Constituent | Fresh | 50% recirculated | Comparison of fresh vs. recirculated | |||||||||||
|---|---|---|---|---|---|---|---|---|---|---|---|---|---|---|
| Influent | Effluent | p | N | Influent | Effluent | p | N | Influent | Effluent | |||||
| p | p | |||||||||||||
| a Bold face indicates significantly different (p < 0.05) values. | ||||||||||||||
| pH | 7.76 | ±0.27 | 7.41 | ±0.24 | 0.003 | 7.54 | ±0.32 | 7.48 | ±0.26 | 0.63 | 0.065 | 0.437 | ||
| Conductivity (μS cm−1) | 1163 | ±63.0 | 1293 | ±103 | <0.001 | 793 | ±53.0 | 813 | ±58 | 0.31 | <0.001 | <0.001 | ||
| COD (mg L−1) | 470 | ±19.7 | 109 | ±27.3 | <0.001 | 287 | ±50.2 | 90.4 | ±30.8 | <0.001 | <0.001 | 0.015 | ||
| Fluorescence index | 1.49 | ±0.09 | 2.19 | ±0.21 | <0.001 | 1.63 | ±0.07 | 2.18 | ±0.09 | <0.001 | 0.01 | 0.99 | ||
| Freshness index | 1.02 | ±0.10 | 0.97 | ±0.07 | 0.34 | 1.05 | ±0.06 | 0.95 | ±0.03 | 0.01 | 0.44 | 0.71 | ||
| Humification index | 0.16 | ±0.02 | 0.72 | ±0.12 | <0.001 | 0.22 | ±0.02 | 1.07 | ±0.07 | <0.001 | <0.001 | <0.001 | ||
| Peak A (RU) | 7.49 | ±0.57 | 1.71 | ±0.16 | <0.001 | 3.72 | ±0.44 | 0.93 | ±0.08 | <0.001 | <0.001 | <0.001 | ||
| Peak B (RU) | 22.6 | ±1.28 | 3.66 | ±0.75 | <0.001 | 7.98 | ±1.03 | 1.34 | ±0.26 | <0.001 | <0.001 | <0.001 | ||
| Peak T (RU) | 26.6 | ±1.76 | 4.56 | ±0.84 | <0.001 | 10.5 | ±1.65 | 1.70 | ±0.18 | <0.001 | <0.001 | <0.001 | ||
| Peak C (RU) | 1.14 | ±0.11 | 0.98 | ±0.19 | 0.11 | 0.58 | ±0.06 | 0.54 | ±0.02 | 0.25 | <0.001 | <0.001 | ||
| Peak M (RU) | 0 | 1.13 | ±0.13 | 0.03 | 0.70 | ±0.05 | 0.62 | ±0.05 | 0.03 | <0.001 | <0.001 | |||
In addition, the changes in peak T, HIX and fluorescent components during normal operation and disturbance support previous studies promoting fluorescence-based sensors for wastewater monitoring.5,25 In decentralized settings, where chemical analyses (e.g., COD measurements) may be cost-prohibitive or challenging to complete without staffed laboratory analytical facilities, the tracking of operational issues may be achieved using fluorescence-based sensors monitored remotely or by one technician servicing multiple DEWATS.
4.3. Formation of F420-like component resulting from biological processes
Our analyses identified a new PARAFAC component, C3, that has only been observed in studies involving anaerobic digestates,32–34 anammox reactors,35 or microbial fuel cells,36 but has not to our knowledge been reported for microbial degradation of domestic wastewater. Two fluorescent peaks are associated with C3, one with an ex/em maximum at 260/470 nm and the second with an ex/em maximum at 413–420/470 nm (Fig. 2), which is a well-resolved peak in the EEM of the lab-scale ABR effluent (Fig. 1a) and more of a shoulder in the EEMs of treated domestic wastewater (Fig. 1b and c). This fluorescent peak at ex/em of 420/470 nm has been observed widely in biosynthesis and methanogenesis studies where it represents co-enzyme F420, a deazaflavin and cofactor that catalyzes and mediates diverse redox reactions, such hydrogenotrophic methanogenesis37 and anaerobic ammonium oxidation (anammox).35 In ABR systems, the discharge of effluents with high concentrations of dissolved methane is a concern and negates some life cycle benefits of anaerobic treatment.38 Therefore, better understanding of the relationships between F420-like fluorescence and dissolved methane in ABR systems is warranted.Most recently, co-enzyme F420 has been shown to be produced by a much wider suite of organisms than previously thought, including by a number of Archaea besides methanogens,39 some actinomycetes40 and other actinobacter,41 aerobic soil bacteria,42 and even Gram-negative bacteria, such as Paraburkholderia rhizoxinica43 and Escherichia coli.44 Also, our experimental incubations of Pseudomonas syringae with glutamate, a non-fluorescent compound, in a previous study45 resulted in the striking formation of F420-like peaks within 5 d to 12 d of incubation (see representative EEM in Fig. 1d). Our observation of this peak during growth of P. syringae further adds this common Gram-negative bacterium to the list of microorganisms that may produce co-enzyme F420.
In the present study, C3 (the F420-like component) formed in most treated effluents (Fig. 1), after degradation of labile wastewater constituents (represented by reduction of protein-like fluorescence). A shoulder in the region of C3 is often visible in representative EEMs of treated effluent from centralized wastewater treatment plants;4,46 however, PARAFAC models have not yet identified a component reflecting this F420 peak. This may be due to the lower intensity of fluorescence in this region compared to the intensity of other nearby peaks (e.g., humic peak C at ex/em 350 nm/∼450 nm). Our PARAFAC model was able to distinguish C3, likely because there were a substantial number of EEMs from lab-scale ABRs in which C3 was more pronounced. Also, some studies did not measure fluorescence at excitation wavelengths >400 nm (e.g., Yang et al.24), which would preclude identification of this peak. Studies evaluating cyanobacteria and waters with algal blooms have uncovered other algal-associated peaks,47–49 but none of the algal-associated peaks are in the same spectral space as the F420-like peak.
The formation of C3 also may have an important influence on the FI, which is calculated at an excitation wavelength of 370 nm, a wavelength that may be influenced by spectral overlap of fluorescence in the C3 region. The FI of wastewater has generally been found to be higher than FI values reported in environments not influenced by wastewater or fecal pollution,50 and values >2.0 have been used to indicate wastewater contamination in a water body.51 In the present study, the increase in C3 from influent to effluent of the lab-scale ABR corresponded to an increase in the FI from 2.37 to 2.67 on average. The possible influence of C3 spectral overlap on emission at wavelengths where FI is calculated (470 nm and 520 nm) merits further study.
Conclusions
Changes in fluorescence intensities and indices were shown for normal operation and after disturbance (scum removal) of lab-scale and real wastewater treatment systems employing primarily anaerobic degradation as a biological process. In addition, our PARAFAC model identified two ubiquitous peaks associated with amino acids (C2) and humic substances (C1) and exposed a unique component, C3, that may be used to track the production of coenzyme F420 in biological wastewater treatment systems.Our results demonstrated that, under normal operation, increases in HIX as high as 190% occurred from influent to effluent, and the HIX was a robust indicator of performance. Peaks T and B and amino acid-like PARAFAC component C2 also decreased under normal operation. Therefore, the HIX, amino acid-like fluorescent peak intensities, and amino acid-like component C2 are valuable surrogates for tracking the preferential degradation of labile organic compounds, and, in turn, for evaluating DEWATS performance. The magnitude of the differences did differ among treatment systems; therefore, no set target values for HIX, peak T, or C2 are recommended here. Instead, expected values can be determined for treatment systems on a case-by-case basis. The establishment of these easily and rapidly measured fluorescence indicators can inform future real-time sensor studies, which is necessary for reducing the burden of decentralized wastewater monitoring for communities.
Conflicts of interest
There are no conflicts to declare.Acknowledgements
We are grateful to University of KwaZulu-Natal's WASH R&D Centre for access to the community-scale ABR and to the late Professor Chris Buckley, who made the research collaboration at the community-scale systems possible. Amy Bigelow, Thabiso Zikalala, Federick Pinongcos, Heather Tegley, Natalie Melgoza, Zoë Orandle, and Scelo Mncube assisted with ABR sample analyses. Lauren Steinberg, Stephanie Chao, Jade Johnson, David Aponte, and Cheyenne Graves assisted with lab-scale ABR operation and EEMs spectral acquisition. Denise Garcia assisted with fluorescence and COD analyses of Ecoparque samples. We thank Professors Monica Palomo, Gabriela Muñoz Melendez, and Lina Ojeda Revah for insights and support. Funding was provided by the US National Science Foundation grants OISE 1459370 and CBET 1705901, and publication support was provided by the William E. Leonhard Jr. Endowment to N. Mladenov.References
- N. Hudson, A. Baker and D. Reynolds, Fluorescence analysis of dissolved organic matter in natural, waste and polluted waters—a review, River Res. Appl., 2007, 23(6), 631–649 CrossRef.
- E. Cohen, G. J. Levy and M. Borisover, Fluorescent components of organic matter in wastewater: efficacy and selectivity of the water treatment, Water Res., 2014, 55, 323–334 CrossRef CAS PubMed.
- E. M. Carstea, J. Bridgeman, A. Baker and D. M. Reynolds, Fluorescence spectroscopy for wastewater monitoring: a review, Water Res., 2016, 95, 205–219 CrossRef CAS PubMed.
- M. Sgroi, P. Roccaro, G. V. Korshin, V. Greco, S. Sciuto, T. Anumol, S. A. Snyder and F. G. Vagliasindi, Use of fluorescence EEM to monitor the removal of emerging contaminants in full scale wastewater treatment plants, J. Hazard. Mater., 2017, 323, 367–376 CrossRef CAS PubMed.
- N. Mladenov, A. Bigelow, B. Pietruschka, M. Palomo and C. Buckley, Using submersible fluorescence sensors to track the removal of organic matter in decentralized wastewater treatment systems (DEWATS) in real time, Water Sci. Technol., 2018, 77(3), 819–828 CrossRef CAS PubMed.
- D. C. Stuckey, Anaerobic baffled reactor (ABR) for wastewater treatment, Environmental Anaerobic Technology: Applications and New Developments, 2010, pp. 163–184 Search PubMed.
- R. W. Seabloom, T. R. Bounds and T. L. Loudon, University curriculum development for decentralized wastewater management. NDWRCDP Report, 2005.
- M. J. Hahn and L. A. Figueroa, Pilot scale application of anaerobic baffled reactor for biologically enhanced primary treatment of raw municipal wastewater, Water Res., 2015, 87, 494–502 CrossRef CAS PubMed.
- N. Reynaud and C. A. Buckley, The anaerobic baffled reactor (ABR) treating communal wastewater under mesophilic conditions: a review, Water Sci. Technol., 2016, 73(3), 463–478 CrossRef CAS PubMed.
- BORDA, DEWATS Implementation by BORDA, BORDA, Bremen, Germany, 2017 Search PubMed.
- D. Garcia, G. Muñoz Meléndez, A. Arteaga, L. Ojeda-Revah and N. Mladenov, Greening Urban Areas with Decentralized Wastewater Treatment and Reuse: A Case Study of Ecoparque in Tijuana, Mexico, Water, 2022, 14(4), 596 CrossRef CAS.
- J. L. Johnson, N. G. Dodder, N. Mladenov, L. Steinberg, W. H. Richardot and E. Hoh, Comparison of Trace Organic Chemical Removal Efficiencies between Aerobic and Anaerobic Membrane Bioreactors Treating Municipal Wastewater, ACS ES&T Water, 2024, 4(4), 1381–1392 Search PubMed.
- D. M. McKnight, E. W. Boyer, P. K. Westerhoff, P. T. Doran, T. Kulbe and D. T. Andersen, Spectrofluorometric characterization of dissolved organic matter for indication of precursor organic material and aromaticity, Limnol. Oceanogr., 2001, 46(1), 38–48 CrossRef CAS.
- R. M. Cory, M. P. Miller, D. M. McKnight, J. J. Guerard and P. L. Miller, Effect of instrument-specific response on the analysis of fulvic acid fluorescence spectra, Limnol. Oceanogr.: Methods, 2010, 8(2), 67–78 CrossRef CAS.
- M. L. Pinney, P. K. Westerhoff and L. Baker, Transformations in dissolved organic carbon through constructed wetlands, Water Res., 2000, 34(6), 1897–1911 CrossRef CAS.
- A. Zsolnay, E. Baigar, M. Jimenez, B. Steinweg and F. Saccomandi, Differentiating with fluorescence spectroscopy the sources of dissolved organic matter in soils subjected to drying, Chemosphere, 1999, 38(1), 45–50 CrossRef CAS PubMed.
- E. Parlanti, K. Wörz, L. Geoffroy and M. Lamotte, Dissolved organic matter fluorescence spectroscopy as a tool to estimate biological activity in a coastal zone submitted to anthropogenic inputs, Org. Geochem., 2000, 31(12), 1765–1781 CrossRef CAS.
- P. G. Coble, Characterization of marine and terrestrial DOM in seawater using excitation-emission matrix spectroscopy, Mar. Chem., 1996, 51(4), 325–346 CrossRef CAS.
- K. R. Murphy, C. A. Stedmon, D. Graeber and R. Bro, Fluorescence spectroscopy and multi-way techniques. PARAFAC, Anal. Methods, 2013, 5(23), 6557–6566 RSC.
- C. A. Stedmon and R. Bro, Characterizing dissolved organic matter fluorescence with parallel factor analysis: a tutorial, Limnol. Oceanogr.: Methods, 2008, 6(11), 572–579 CrossRef CAS.
- V. Stazi and M. C. Tomei, Enhancing anaerobic treatment of domestic wastewater: State of the art, innovative technologies and future perspectives, Sci. Total Environ., 2018, 635, 78–91 CrossRef CAS PubMed.
- J. B. Fellman, E. Hood and R. G. Spencer, Fluorescence spectroscopy opens new windows into dissolved organic matter dynamics in freshwater ecosystems: A review, Limnol. Oceanogr., 2010, 55(6), 2452–2462 CrossRef CAS.
- S. K. Ishii and T. H. Boyer, Behavior of reoccurring PARAFAC components in fluorescent dissolved organic matter in natural and engineered systems: a critical review, Environ. Sci. Technol., 2012, 46(4), 2006–2017 CrossRef CAS PubMed.
- L. Yang, J. Hur and W. Zhuang, Occurrence and behaviors of fluorescence EEM-PARAFAC components in drinking water and wastewater treatment systems and their applications: a review, Environ. Sci. Pollut. Res., 2015, 22, 6500–6510 CrossRef CAS PubMed.
- M. Sgroi, P. Roccaro, G. V. Korshin and F. G. Vagliasindi, Monitoring the behavior of emerging contaminants in wastewater-impacted rivers based on the use of fluorescence excitation emission matrixes (EEM), Environ. Sci. Technol., 2017, 51(8), 4306–4316 CrossRef CAS PubMed.
- J. Hur, T. H. Lee and B. M. Lee, Estimating the removal efficiency of refractory dissolved organic matter in wastewater treatment plants using a fluorescence technique, Environ. Technol., 2011, 32(16), 1843–1850 CrossRef PubMed.
- R. Riopel, F. Caron and S. Siemann, Fluorescence characterization of natural organic matter at a northern Ontario wastewater treatment plant, Water, Air, Soil Pollut., 2014, 225, 1–7 CrossRef CAS.
- T. Maqbool, J. Cho and J. Hur, Spectroscopic descriptors for dynamic changes of soluble microbial products from activated sludge at different biomass growth phases under prolonged starvation, Water Res., 2017, 123, 751–760 CrossRef CAS PubMed.
- N. Rasit, A. Idris, R. Harun and W. A. Ghani, Effects of lipid inhibition on biogas production of anaerobic digestion from oily effluents and sludges: An overview, Renewable Sustainable Energy Rev., 2015, 45, 351–358 CrossRef CAS.
- G. V. Korshin, W. W. Wu, M. M. Benjamin and O. Hemingway, Correlations between differential absorbance and the formation of individual DBPs, Water Res., 2002, 36(13), 3273–3282 CrossRef CAS PubMed.
- J. L. Soares, M. C. Cammarota, M. L. Gutarra and I. Volschan Jr., Reduction of scum accumulation through the addition of low-cost enzymatic extract in the feeding of high-rate anaerobic reactor, Water Sci. Technol., 2019, 80(1), 67–74 CrossRef CAS PubMed.
- L. Song, D. Li, H. Fang, X. Cao, R. Liu, Q. Niu and Y. Y. Li, Revealing the correlation of biomethane generation, DOM fluorescence, and microbial community in the mesophilic co-digestion of chicken manure and sheep manure at different mixture ratio, Environ. Sci. Pollut. Res., 2019, 26, 19411–19424 CrossRef CAS PubMed.
- L. Song, Y. Song, D. Li, R. Liu and Q. Niu, The auto fluorescence characteristics, specific activity, and microbial community structure in batch tests of mono-chicken manure digestion, Waste Manage., 2019, 83, 57–67 CrossRef CAS PubMed.
- Y. Deng, W. Li, W. Ruan and Z. Huang, Applying EEM-PARAFAC analysis with quantitative real-time PCR to monitor methanogenic activity of high-solid anaerobic digestion of rice straw, Front. Microbiol., 2021, 12, 600126 CrossRef PubMed.
- M. Ruscalleda, B. Seredynska-Sobecka, B. J. Ni, E. Arvin, M. D. Balaguer, J. Colprim and B. F. Smets, Spectrometric characterization of the effluent dissolved organic matter from an anammox reactor shows correlation between the EEM signature and anammox growth, Chemosphere, 2014, 117, 271–277 CrossRef CAS PubMed.
- L. Wang, Y. Wu, Y. Zheng, L. Liu and F. Zhao, Efficient degradation of sulfamethoxazole and the response of microbial communities in microbial fuel cells, RSC Adv., 2015, 5(69), 56430–56437 RSC.
- P. Cheeseman, A. Toms-Wood and R. Wolfe, Isolation and properties of a fluorescent compound, Factor420, from Methanobacterium strain MoH, J. Bacteriol., 1972, 112(1), 527–531 CrossRef CAS PubMed.
- M. Mohammed and D. L. Sills, Coupling a rotating biological contactor with an anaerobic baffled reactor for sustainable energy recovery from domestic wastewater, Environ. Sci.: Water Res. Technol., 2022, 8(9), 1822–1835 RSC.
- C. Greening, F. H. Ahmed, A. E. Mohamed, B. M. Lee, G. Pandey, A. C. Warden, C. Scott, J. G. Oakeshott, M. C. Taylor and C. J. Jackson, Physiology, biochemistry, and applications of F420-and Fo-dependent redox reactions, Microbiol. Mol. Biol. Rev., 2016, 80(2), 451–493 CrossRef CAS PubMed.
- J. D. Selengut and D. H. Haft, Unexpected abundance of coenzyme F420-dependent enzymes in Mycobacterium tuberculosis and other actinobacteria, J. Bacteriol., 2010, 192(21), 5788–5798 CrossRef CAS PubMed.
- G. Bashiri, J. Antoney, E. N. Jirgis, M. V. Shah, B. Ney, J. Copp, S. M. Stuteley, S. Sreebhavan, B. Palmer, M. Middleditch and N. Tokuriki, A revised biosynthetic pathway for the cofactor F420 in prokaryotes, Nat. Commun., 2019, 10(1), 1558 CrossRef PubMed.
- B. Ney, F. H. Ahmed, C. R. Carere, A. Biswas, A. C. Warden, S. E. Morales, G. Pandey, S. J. Watt, J. G. Oakeshott, M. C. Taylor and M. B. Stott, The methanogenic redox cofactor F420 is widely synthesized by aerobic soil bacteria, ISME J., 2017, 11(1), 125–137 CrossRef CAS PubMed.
- D. Braga, D. Last, M. Hasan, H. Guo, D. Leichnitz, Z. Uzum, I. Richter, F. Schalk, C. Beemelmanns, C. Hertweck and G. Lackner, Metabolic pathway rerouting in Paraburkholderia rhizoxinica evolved long-overlooked derivatives of coenzyme F420, ACS Chem. Biol., 2019, 14(9), 2088–2094 CrossRef CAS PubMed.
- D. Last, M. Hasan, L. Rothenburger, D. Braga and G. Lackner, High-yield production of coenzyme F420 in Escherichia coli by fluorescence-based screening of multi-dimensional gene expression space, Metab. Eng., 2022, 73, 158–167 CrossRef CAS PubMed.
- A. Bigelow, N. Mladenov, D. Lipson and M. Williams, Dust deposition drives microbial metabolism in a remote, high-elevation catchment, Holocene, 2020, 30(4), 589–596 CrossRef.
- G. V. Korshin, M. Sgroi and H. Ratnaweera, Spectroscopic surrogates for real time monitoring of water quality in wastewater treatment and water reuse, Curr. Opin. Environ. Sci. Health, 2018, 2, 12–19 CrossRef.
- J. A. Korak, E. C. Wert and F. L. Rosario-Ortiz, Evaluating fluorescence spectroscopy as a tool to characterize cyanobacteria intracellular organic matter upon simulated release and oxidation in natural water, Water Res., 2015, 68, 432–443 CrossRef CAS PubMed.
- Y. T. Zuo, J. Wu, S. Cheng, M. H. Cai, Y. Z. Han, W. X. Ji, Y. Li, Z. L. Huo, G. Korshin, W. T. Li and A. M. Li, Identification of pterins as characteristic humic-like fluorophores released from cyanobacteria and their behavior and fate in natural and engineered water systems, Chem. Eng. J., 2022, 428, 131154 CrossRef CAS.
- F. Sun, F. Wang, H. Jiang, Q. Huang, C. Xu, P. Yu and H. Cong, Analysis on the flocculation characteristics of algal organic matters, J. Environ. Manage., 2022, 302, 114094 CrossRef CAS PubMed.
- M. H. Lee, Y. K. Lee, M. Derrien, K. Choi, K. H. Shin, K. S. Jang and J. Hur, Evaluating the contributions of different organic matter sources to urban river water during a storm event via optical indices and molecular composition, Water Res., 2019, 165, 115006 CrossRef CAS PubMed.
- Y. Lin, E. Hu, C. Sun, M. Li, L. Gao and L. Fan, Using fluorescence index (FI) of dissolved organic matter (DOM) to identify non-point source pollution: The difference in FI between soil extracts and wastewater reveals the principle, Sci. Total Environ., 2023, 862, 160848 CrossRef CAS PubMed.
Footnote |
| † Electronic supplementary information (ESI) available. See DOI: https://doi.org/10.1039/d3ew00671a |
| This journal is © The Royal Society of Chemistry 2024 |