 Open Access Article
A facile method for monitoring sphingomyelin synthase activity in HeLa cells using liquid chromatography/mass spectrometry†
Punith M.
Sundaraswamy‡
a,
Yusuke
Minami‡
b,
Jayashankar
Jayaprakash‡
a,
Siddabasave Gowda
B. Gowda
 *ac,
Hiroyuki
Takatsu
d,
Divyavani
Gowda
c,
Hye-Won
Shin
d and
Shu-Ping
Hui
*c
aGraduate School of Global Food Resources, Hokkaido University, Kita-9, Nishi-9, Kita-Ku, Sapporo 060-0809, Japan. E-mail: gowda@gfr.hokudai.ac.jp
bGraduate School of Health Sciences, Hokkaido University, Kita-12, Nishi-5, Kita-ku, Sapporo 060-0812, Japan
cFaculty of Health Sciences, Hokkaido University, Kita-12, Nishi-5, Kita-ku, Sapporo 060-0812, Japan. E-mail: keino@hs.hokudai.ac.jp; Tel: +81-11-706-3693
dGraduate School of Pharmaceutical Sciences, Kyoto University, Kyoto 606-8501, Japan
First published on 2nd May 2024
Abstract
Sphingomyelin synthase (SMS) is a sphingolipid-metabolizing enzyme involved in the de novo synthesis of sphingomyelin (SM) from ceramide (Cer). Recent studies have indicated that SMS is a key therapeutic target for metabolic diseases such as fatty liver, type 2 diabetes, atherosclerosis, and colorectal cancer. However, very few SMS inhibitors have been identified because of the limited sensitivity and selectivity of the current fluorescence-based screening assay. In this study, we developed a simple cell-based assay coupled with liquid chromatography/tandem mass spectrometry (LC-MS/MS) to screen for SMS inhibitors. HeLa cells stably expressing SMS1 or SMS2 were used for the screening. A non-fluorescent unnatural C6-Cer was used as a substrate for SMS to produce C6-SM. C6-Cer and C6-SM levels in the cells were monitored and quantified using LC-MS/MS. The activity of ginkgolic acid C15:1 (GA), a known SMS inhibitor, was measured. GA had half-maximal inhibitory concentrations of 5.5 μM and 3.6 μM for SMS1 and SMS2, respectively. To validate these findings, hSMS1 and hSMS2 proteins were optimized for molecular docking studies. In silico analyses were conducted to assess the interaction of GA with SMS1 and SMS2, and its binding affinity. This study offers an analytical approach for screening novel SMS inhibitors and provides in silico support for the experimental findings.
1. Introduction
Sphingolipids are a major class of lipids that, comprises various metabolites with diverse functions. Changes in the biological processes of sphingolipids are associated with metabolic syndromes, including obesity, dyslipidemia, insulin resistance, cardiovascular problems, and type 2 diabetes mellitus.1 Sphingomyelin (SM) is a sphingolipid metabolite produced by the transfer of phosphorylcholine from phosphatidylcholine to ceramide (Cer) in a reaction catalyzed by sphingomyelin synthase (SMS).2 Mammalian SMSs exist in three isoforms: SMS1, SMS2, and SMSr.3 SMS1 and SMS2 share 57% sequence similarity and have identical enzyme activities4 but different subcellular locations.5 SM production is catalyzed by SMS1 in the Golgi apparatus and by SMS2 on the plasma membrane.2,5,6Recent, studies in mice have shown that SMS deficiency prevents the advancement of atherosclerosis,7 insulin resistance,8,9 and obesity,9 while in vitro inhibition of SMS attenuated endotoxin-mediated macrophage inflammation and the development of atherosclerosis.10 SM accumulation is commonly observed in metabolic diseases such as fatty liver disease,11 colorectal cancer,12 and coronary artery disease.13 Hence, SMS may serve as a therapeutic target for the development of novel treatments for metabolic diseases, and the discovery of SMS inhibitors is a promising strategy for achieving this goal.
A cell-based method coupled with high-performance liquid chromatography (HPLC) to detect fluorescent substrates and products is a widely used assay method to screen for SMS inhibitors.14 Natural inhibitors such as malabaricone C15 and ginkgolic acid (GA)16 have been discovered using this assay method. Despite the assay being rapid, its sensitivity is poor, interference peaks often occur in the HPLC chromatogram, and the results are not quantitative. LC-MS/MS has a higher sensitivity and selectivity than HPLC. Efforts have been made to identify SMS inhibitors through virtual screening combined with an LC-MS/MS approach.4,17 Although this previous LC-MS/MS-based method allows the quantitation of SMS activity, it is time-consuming, involves complex steps, and does not provide in silico insights.4 Reports on improved methods to screen for SMS inhibitors using in vitro and in silico approaches are limited. In this study, we aimed to establish a cell-based assay coupled with LC-MS/MS to screen for novel SMS inhibitors and to provide an in silico method to validate the inhibition potential through molecular docking and dynamic simulation studies.
2. Materials and methods
2.1. Materials
Liquid chromatography/mass spectrometry (LC/MS)-grade solvents including isopropanol, chloroform, and methanol were purchased from Wako Pure Chemical Industries, Ltd (Osaka, Japan). Ammonium acetate (1 mol L−1, eluent additive for LC/MS) was purchased from Sigma-Aldrich (St Louis, MO, USA). C6-Cer (d18:1/6:0) and C6-SM (d18:1/6:0) were purchased from Avanti Polar Lipids, Inc. (Alabaster, USA). Protease inhibitor cocktail (EDTA-free) was purchased from Nacalai Tesque, Inc. (Kyoto, Japan). GA C15:1 was purchased from Nagara Science Co. Ltd (Gifu. Japan). Bovine serum albumin (BSA) was purchased from Thermo Fisher Scientific (Tokyo, Japan).2.2. Targeted analysis of C6-Cer and C6-SM by LC-MS/MS
Selected reaction monitoring channels for C6-Cer and C6-SM were established using a TSQ quantum access triple quadrupole mass spectrometer in positive ionization mode (Thermo Fisher Scientific, Inc., Waltham, MA, USA). The optimized ion source parameters were as follows: spray voltage: 3500 V, vaporizer temperature: 270 °C, capillary temperature: 300 °C, sheath gas (nitrogen): 30 psi, auxiliary gas (nitrogen): 40 psi, and collision gas (argon): 1.5 mTorr. Separation was achieved using an ultra-fast LC system (Shimadzu Corp., Kyoto, Japan) equipped with a Hypersil GOLD C8 column (50 mm × 2.1 mm, 6 μm; Thermo Fisher Scientific Inc.). The oven and sample tray temperatures were maintained at 40 °C and 4 °C, respectively. The mobile phases were A: 10 mM CH3COONH4 with 0.1% acetic acid, B: isopropanol, and C: methanol. The gradient elution was set as follows: 0–1 min (30% B, 30% C), 1–3 min (40% B, 50% C), 3–7 min (20% B, 70% C), 7–8 min (100% C), 8–10 min (30% B, 30% C), and re-equilibration for 2 min. The flow rate was 0.4 mL min−1.2.3 Plasmids
cDNAs encoding full-length SMS1 and SMS2 were obtained by RT-PCR from total RNA of HeLa cells. To obtain cDNA encoding SMS2, a sense primer (5′-GCCGGATCCACCatggatatcatagagacagcaaaac-3′) and an antisense primer (5′-CGGGTCGACggtcgatttctcattgtcttcacc-3′) were used. To obtain cDNA encoding SMS1, a sense primer (5′-gactgcctgctgtctgccagtac-3′) and an antisense primer (5′-gttcttagcacttcggacaatttgtc-3′) were used, and the PCR product was re-amplified using a sense primer (5′-GCCGGATCCACCatgaaggaagtggtttattggtcac-3′) and an antisense primer (5′-CGGCTCGAGtgtgtcattcaccagccggctg-3′) to generate a restriction enzyme site. Both PCR products were introduced into a pMXs-puro expression vector with a C-terminal FLAG-His6 tag. The pMXs-puro vector and pEF-gag-pol plasmid were kind gifts from Toshio Kitamura (The University of Tokyo). The pCMV-VSVG-RSV-Rev plasmid was a kind gift from Hiroyuki Miyoshi (RIKEN BioResource Center).2.4 Establishment of cells stably expressing SMS
HeLa cells stably expressing C-terminally FLAG-tagged hSMS1 and hSMS2 were established according to a previously reported method.18 In brief, the pMXs-puro-derived vector for the expression of FLAG-tagged hSMS was co-transfected with pEF-gag-pol and pCMV-VSVG-RSV-Rev into HEK293T cells for retroviral production. The retroviruses were concentrated and used to infect HeLa cells to establish stable cell lines. Infected cells were selected in a medium containing puromycin (1 μg mL−1). A mixed population of drug-resistant cells was used for further analyses.2.5. Immunoblot and immunofluorescence analyses
Immunoblot analysis was conducted as previously reported.18 Cells were lysed in lysis buffer (20 mM HEPES (pH 7.4), 150 mM NaCl, 1 mM EDTA, and 1% Nonidet P-40) containing a protease inhibitor mixture (Nacalai Tesque) at 4 °C for 30 min. The lysates were centrifuged at maximum speed in a microcentrifuge at 4 °C for 20 min to remove cellular debris. The lysates were incubated in SDS sample buffer containing β-mercaptoethanol at 37 °C for 2 h and subjected to SDS-PAGE and immunoblot analysis using mouse anti-DYKDDDDK (1E6) (Wako, Osaka, Japan) and anti-β-actin (C4) (Santa Cruz, Dallas, TX, USA) antibodies. Horseradish peroxidase-conjugated secondary antibodies were purchased from Jackson ImmunoResearch Laboratories (West Grove, PA, USA). The immunoblots were developed using ImmunoStar reagents (Wako) and recorded on an ImageQuant 800 (GE Healthcare, Chicago, IL, USA). Immunofluorescence was analyzed as previously described19 and visualized using an Axiovert 200MAT microscope (Carl Zeiss, Thornwood, NY, USA). Monoclonal rabbit anti-ATP1A1 (EP1845Y) was purchased from Abcam (Cambridge, UK) and monoclonal mouse anti-GM130 was purchased from BD Biosciences (Franklin Lakes, NJ, USA). Alexa Fluor-conjugated secondary antibodies were from purchased Invitrogen (Waltham, MA, USA).2.6. Cell culture and protein assay
HeLa/hSMS1 and HeLa/hSMS2 cells were maintained in an incubator at 37 °C under a humidified atmosphere of 5% CO2 in minimal essential medium (MEM) supplemented with 10% (v/v) fetal bovine serum and 1% penicillin–streptomycin–neomycin mixture (all reagents were sourced from Thermo Fisher Scientific, Tokyo, Japan). To determine the cellular protein content, the cells were pelleted by centrifugation (1000 rpm, 10 min) and stored at −80 °C until use. In a 15 mL tube, 1 mL of 20 mM Tris buffer (pH 7.5) was added to the cell pellet, and the tube was vortexed. Then, 25 μL of the cell lysate was transferred into a 96-well plate in triplicate. To each well, 200 μL of a reaction reagent, consisting of a 50![[thin space (1/6-em)]](https://www.rsc.org/images/entities/char_2009.gif) :
:![[thin space (1/6-em)]](https://www.rsc.org/images/entities/char_2009.gif) 1 mixture of reagent A and reagent B from the Bicinchoninic protein assay kit (Thermo Fisher Scientific), was added. The plate was incubated at 37 °C for 30 min, and the absorbance at 562 nm was measured using a Wallac 1420 ARVO Mx plate reader. To construct a calibration curve, a BSA solution with a concentration of 2000 μg mL−1 was serially diluted to concentrations of 2000, 1000, 100, 10, 1, and 0.1 μg mL−1 using PBS. The absorbance of the BSA standards was measured as described above. The protein contents in the cell pellets were determined based on the calibration curve.
1 mixture of reagent A and reagent B from the Bicinchoninic protein assay kit (Thermo Fisher Scientific), was added. The plate was incubated at 37 °C for 30 min, and the absorbance at 562 nm was measured using a Wallac 1420 ARVO Mx plate reader. To construct a calibration curve, a BSA solution with a concentration of 2000 μg mL−1 was serially diluted to concentrations of 2000, 1000, 100, 10, 1, and 0.1 μg mL−1 using PBS. The absorbance of the BSA standards was measured as described above. The protein contents in the cell pellets were determined based on the calibration curve.
2.7. In vitro SMS assay
In vitro SMS activity was assayed as previously reported,14 with a modification. Lysis buffer (20 mM Tris-HCl, pH 7.5, containing protease inhibitor mixture) was added to HeLa/hSMS1 and HeLa/hSMS2 cell pellets and the samples were sonicated for 5 s. Cell lysates with protein concentrations of 0.1 μg μL−1, 0.5 μg μL−1, 0.75 μg μL−1, and 1.0 μg μL−1 respectively, were prepared. One hundred microliters of each cell lysate with known protein concentration was transferred to a 1.5 mL Eppendorf tube in quadruplicate and 1 μL of C6-Cer (5 μM in ethanol) was added. The quadruplicate mixtures were incubated at 37 °C for 5, 30, 60, and 120 min, respectively. Then, the enzymatic reaction was stopped by adding 350 μL of a chloroform/methanol solution (2![[thin space (1/6-em)]](https://www.rsc.org/images/entities/char_2009.gif) :
:![[thin space (1/6-em)]](https://www.rsc.org/images/entities/char_2009.gif) 1, v/v). The mixtures were vortexed (1300 rpm, 10 min) and centrifuged (15
1, v/v). The mixtures were vortexed (1300 rpm, 10 min) and centrifuged (15![[thin space (1/6-em)]](https://www.rsc.org/images/entities/char_2009.gif) 000 rpm, 5 min), and the lower chloroform layer was transferred to a new Eppendorf tube. The chloroform extracts were dried under a vacuum using a centrifuge evaporator at 4 °C. The residue was redissolved in 100 μL of methanol, vortexed, and centrifuged (15
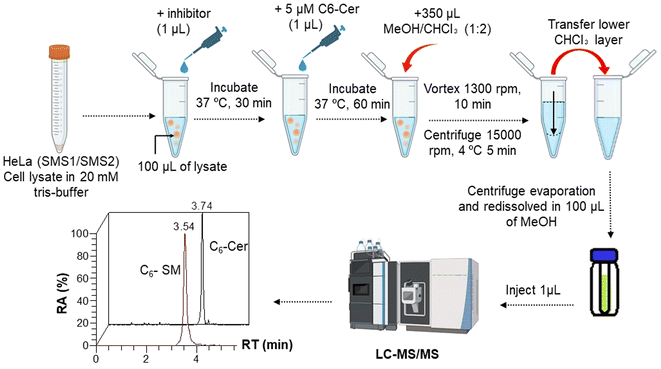
000 rpm, 5 min), and the lower chloroform layer was transferred to a new Eppendorf tube. The chloroform extracts were dried under a vacuum using a centrifuge evaporator at 4 °C. The residue was redissolved in 100 μL of methanol, vortexed, and centrifuged (15![[thin space (1/6-em)]](https://www.rsc.org/images/entities/char_2009.gif) 000 rpm, 5 min), and the centrifugate was transferred into an LC vial for subsequent analysis. After optimization of the protein concentration and incubation, the experiments were conducted in the presence of a GA C15:1 at various concentrations. The detailed workflow of the SMS activity assay with or without inhibitor is shown in Fig. 1. The limit of detection, limit of quantification, extraction recovery, matrix effect (in cell lysates), and accuracy of the method were determined, and the results were provided in the ESI Table S1.† The LC-MS/MS raw data were processed using Xcalibur 2.2 software, and the peak intensities of C6-Cer and C6-SM were exported. The percentage of inhibition was calculated using the following equations:
000 rpm, 5 min), and the centrifugate was transferred into an LC vial for subsequent analysis. After optimization of the protein concentration and incubation, the experiments were conducted in the presence of a GA C15:1 at various concentrations. The detailed workflow of the SMS activity assay with or without inhibitor is shown in Fig. 1. The limit of detection, limit of quantification, extraction recovery, matrix effect (in cell lysates), and accuracy of the method were determined, and the results were provided in the ESI Table S1.† The LC-MS/MS raw data were processed using Xcalibur 2.2 software, and the peak intensities of C6-Cer and C6-SM were exported. The percentage of inhibition was calculated using the following equations:2.8. Methods for in silico analysis of SMS
3. Results and discussion
3.1. Detection of the SMS substrate (C6-Cer) and product (C6-SM) by LC-MS/MS and its stable expression in HeLa cells
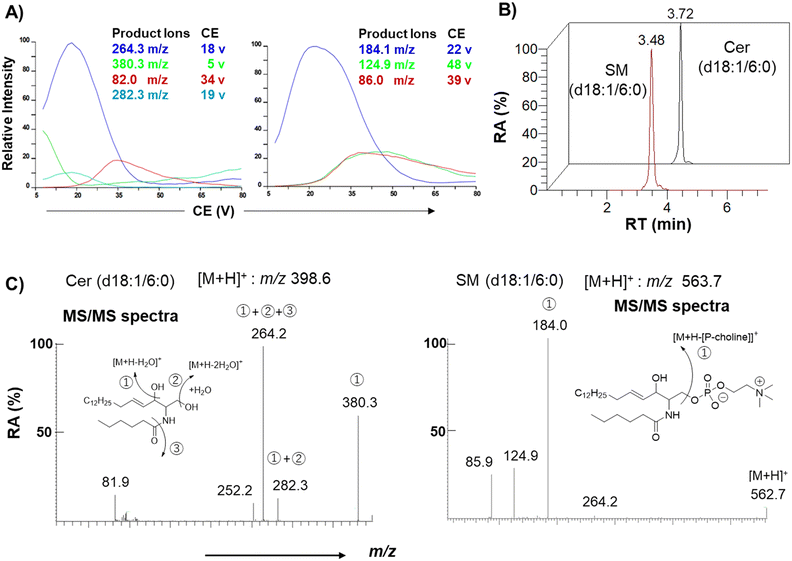
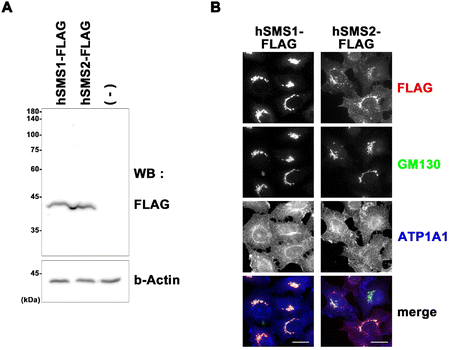
Authentic standards C6-Cer (i.e., Cer (d18:1/6:0)) and C6-SM (i.e., SM (d18:1/6:0)) were selected as a substrate and product of SMS, respectively, to monitor their activity in cell lysates. Ceramides with shorter acyl chains have faster enzymatic reaction rates; hence, the unnatural C6-Cer was selected as a substrate for both SMS1 and SMS2. Using a triple-quadrupole mass spectrometer, the selected reaction monitoring (SRM) channels were optimized for C6-Cer and C6-SM. Elution of C6-Cer and C6-SM was achieved within 4 min using a reverse-phase C8 column coupled with an LC system. The SRM optimization curves, extracted ion chromatograms, and MS/MS spectra of C6-Cer and C6-SM are shown in Fig. 2. C6-Cer and C6-SM ionized to yield [M + H]+ product ions of m/z 398.6 and m/z 563.7, respectively. The optimization curves (Fig. 2A) show that m/z 264.3 and m/z 184.1 were the most intense product ions of C6-Cer and C6-SM, which eluted at 3.72 and 3.48 min respectively (Fig. 2B). The MS/MS spectra of C6-Cer and C6-SM and their fragmentation patterns are shown in Fig. 2C. These MS/MS spectra are similar to those of Cer and SM with different acyl chains, as reported in our previous study.29A previous study utilized (6-((N-(7-nitrobenz-2-oxa-1,3-diazol-4-yl)amino)hexanoyl)sphingosine) C6-NBD-Cer and C6-NBD-SM as a fluorescence substrate and product, respectively, to monitor the in vitro activity of SMS with an HPLC fluorescence detector.14 However, fluorescent-based detection methods are less sensitive than LC/MS.30 Chen et al.4 previously used LC-MS/MS to monitor SMS1 and SMS2 activities based on C6-Cer and C6-SM levels. The authors overexpressed SMS1 and SMS2 in HEK293 cells and established the first quantitative method for SMS activity. However, their method is time-consuming and requires large amounts of protein. To establish a functional biochemical system, we opted to express recombinant SMS1 and SMS2 proteins in HeLa cells. These recombinant proteins had a FLAG tag at their C-terminus, allowing us to monitor their expression levels. Immunoblot and immunofluorescence analyses were conducted to confirm the stable expression of hSMS1 and hSMS2 in HeLa cells (Fig. 3). Both SMS1 (413 amino acids) and SMS2 (365 amino acids) were detected as proteins with an approximate molecular weight of 40 kDa (Fig. 3A). SMS1-FLAG was exclusively detected in the Golgi complex, whereas SMS2-FLAG was observed in the plasma membrane, as described previously,2,5,6 as well as in the Golgi complex (Fig. 3B). Findings in a previous study that also stably expressed SMS1/SMS2 in human HeLa cells31 support our results.
3.2. In vitro evaluation of SMS activity using the natural inhibitor GA
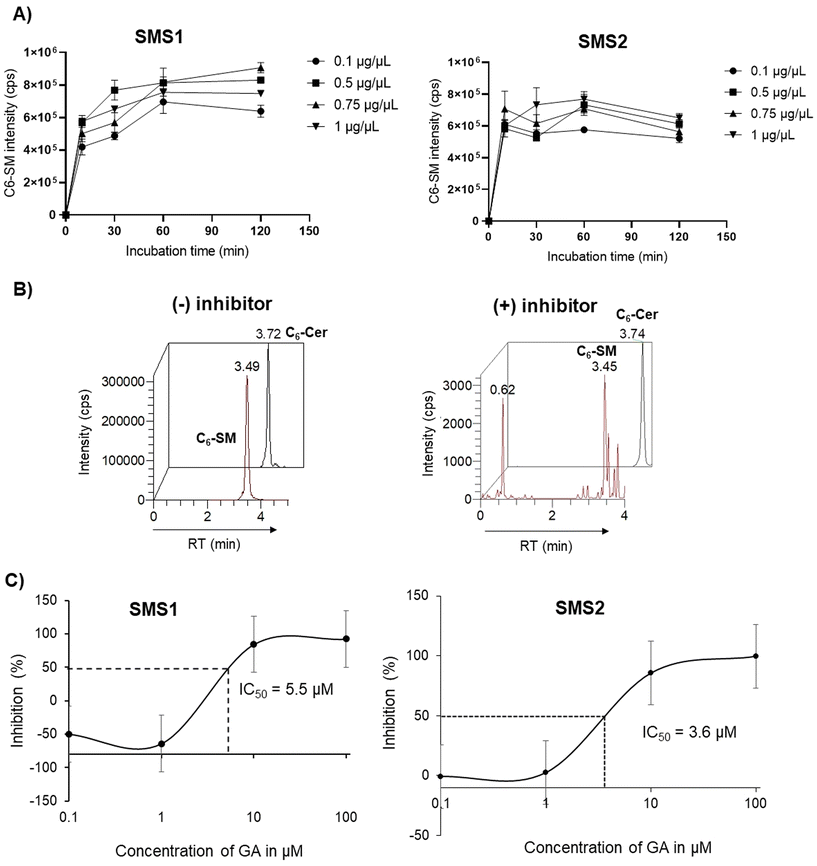
To evaluate in vitro SMS activity, the amount of protein and reaction incubation time needed to be optimized. The results of the optimization using SMS1 and SMS2 are shown in Fig. 4A. The peak intensity for the enzymatic product C6-SM slightly increased with increasing protein concentration; however, the change was not substantial. Therefore, 0.1 μg μL−1 was selected as an optimal concentration for both SMS1 and SMS2 inhibition assays. The production of C6-SM in HeLa, HeLa/SMS1, and HeLa/SMS2 cells was also examined over time, and the results are provided in ESI Fig. S1.† C6-SM was produced at higher levels in SMS-expressing cells than in HeLa control cells. C6-SM production reached a maximum after a 60 min incubation at 37 °C. Hence, 0.1 μg μL−1 of protein and a 60 min incubation were considered optimal conditions for the SMS1 and SMS2 enzymatic reactions. Zama et al.14 previously developed a cell-based assay using ZS/SMS1 and ZS/SMS2 cells and a fluorescent substrate and used a similar incubation time in their experiments. However, in a previous method using C6-NBD-Cer as a substrate for ZS/SMS1 or ZS/SMS2, the incubation time was 3 h.16 In contrast, our method using C6-Cer and HeLa/SMS2 cells requires an incubation time of 60 min, which suggests the robustness of our assay method. To perform a precise quantitative assessment of SMS activity, we employed an LC-MS/MS technique to measure C6-Cer and C6-SM levels. The ion chromatograms of C6-Cer and C6-SM with and without inhibitor (i.e., GA) are shown in Fig. 4B. The results demonstrate that C6-SM production was decreased in the presence of the inhibitor GA.GA is a potent inhibitor of both SMS1 and SMS2 isolated from Ginkgo biloba stem. Given its commercial availability and SMS inhibition potency, we tested our assay method using GA. The half-maximal inhibitory concentrations (IC50) of GA (at various concentrations) for SMS1 and SMS2 are shown in Fig. 4C. The IC50 values of GA for SMS1 and SMS2 were 5.5 μM and 3.5 μM, respectively. A previous study using the fluorescence method reported an IC50 value of 1.5 μM for both SMS1 and SMS2.16 Many factors can explain these differences, including the cell type used, SMS expression level, and method of substrate and product detection used. Despite this, the results are close to the values reported in the previous study, with 2–3-fold variations. Our assay system provides a specific and sensitive method to evaluate the structural and functional relationships of both enzymes.
3.3. In silico insights into GA as a potent inhibitor of SMS1 and SMS2
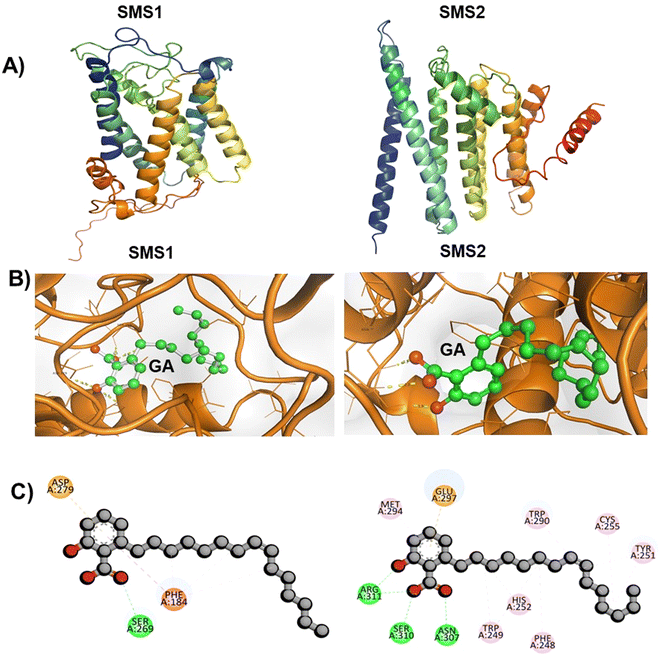
To validate the in vitro results, in silico analysis was performed to optimize the hSMS1 and hSMS2 protein structures. To our knowledge, crystal structures of hSMS1 and hSMS2 have not been reported to date. To optimize the protein structures, AlphaFold 2.2.0 was used. First, sequence analysis was performed using the gene sequences of the proteins from the National Center for Biotechnology Information (NCBI) database (https://www.ncbi.nlm.nih.gov/accessed on 2023/04/08). The gene sequence of hSMS1, with 400 residues, was compared with more than 4000 sequences, whereas that of hSMS2, with 350 residues, was compared with 3500 sequences. The detailed comparison is shown in ESI Fig. S2A.† Based on this analysis, five models were generated for each protein. Among the five models, model 5 ranked first for both proteins, with a predicted local distance difference test (pLDDT) score of 79 for SMS1 and of 73.9 for SMS2. The other models had lower pLDDT scores than model 5, as shown in ESI Fig. S2B.† The predicted template modeling score of model 5 was 0.638 for SMS1 and 0.709 for SMS2. Hence, this modeled structure was used for molecular dynamics simulation studies. Molecular dynamics were simulated for both proteins to obtain a stable conformation for up to 10 ns. The best conformational structures of SMS1 and SMS2 from these simulations (Fig. 5A) were used for molecular docking analysis. Previously, an effort has been made to optimize the hSSM1 structure using Ambalone and Yasara software.32The locations of the binding sites of GA in hSMS1 and hSMS2 are unknown. We predicted the structures of the complexes formed by GA with hSMS1 and hSMS2 by molecular docking studies using AutoDock Vina 1.5.6. GA interacted with hSMS1 and hSMS2 with binding energies of −6.6 kcal mol−1 and −8.2 kcal mol−1, respectively. The docking interaction modes were obtained using Discovery Studio Visualizer for evaluation, and the results are shown in Fig. 5B. GA interacts with the amino acid residue SER269 of hSMS1, and with ARG311, SER310, and ASN307 of SMS2 through conventional hydrogen bonding (Fig. 5C). To assess the stability of the GA-hSMS1/hSMS2 complexes, molecular dynamics simulations were carried out. The simulation revealed a good root mean square deviation for both GA-hSMS1/hSMS2 complexes, with values of 3.5 Å and 6.1 Å, respectively (as shown in ESI Fig. S3†), indicating good stability. A previous study revealed a similar unique interaction between hSMS1 protein and tricyclodecan-9-yl-xanthogentate (D609), a well-known SMS inhibitor.33 A similar strategy was used to predict small-molecule inhibitors of hSMS1 by virtual screening followed by in vitro enzymatic assays.
4. Conclusion
SMS plays a pivotal role in maintaining sphingolipid homeostasis by facilitating the conversion of Cer into SM within the framework of sphingolipid metabolism. As SMS is a potential key therapeutic target in various metabolic diseases, it is important to develop a method to monitor its levels. We developed an LC-MS/MS-based method to monitor SMS1 and SMS2 activity using C6-Cer and C6-SM as a substrate and product, respectively. In vitro and in silico studies were conducted using a known SMS inhibitor, GA. Both in vitro and in silico results supported the inhibition of hSMS1 and hSMS2 by GA. This method has the potential to be used in screens for novel SMS inhibitors.Author contributions
P. M. S.: formal analysis; validation; investigation; methodology; visualization; writing – review and editing. Y. M.: formal analysis; validation; investigation; methodology; visualization; data curation. J. J.: formal analysis; validation; investigation; methodology; visualization. H. T.: formal analysis; validation; data curation, writing – review and editing. H. W. S: formal analysis; validation; data curation, writing – review, and editing. D. G.: data curation; methodology; writing – review and editing. S. G. B. G.: conceptualization; formal analysis; validation; investigation; supervision; project administration; writing – original draft; funding acquisition. S. P. H.: Supervision; resources; writing – review and editing.Conflicts of interest
The authors have no conflict of interest to declare.Acknowledgements
This work was supported by the Japanese Society for the Promotion of Science KAKENHI Grants (21 K1481201 and 22 K1485002) and by JST SPRING (grant no. JPMJSP2119). We want to thank Prof. K. Monde and Ms Y. Suga for their valuable advice on the SMS assay. We also thank Toshio Kitamura (The University of Tokyo) and Hiroyuki Miyoshi (RIKEN BioResource Center) for providing the plasmids for retroviral infection. HeLa cell line is a kind gift from Dr Nobuhiro Nakamura (Kyoto Sangyo University).References
- S. M. Hammad and M. F. Lopes-Virella, J. Mol. Sci., 2023, 24, 14015 CrossRef CAS PubMed.
- K. Huitema, J. Van Den Dikkenberg, J. F. H. M. Brouwers and J. C. M. Holthuis, EMBO J., 2004, 23, 33–44 CrossRef CAS PubMed.
- Y. Chiang, Z. Li, Y. Chen, Y. Cao and X.-C. Jiang, Biochim. Biophys. Acta, Mol. Cell Biol. Lipids, 2021, 1866, 159017 CrossRef CAS PubMed.
- Y. Chen, D. A. Yurek, L. Yu, H. Wang, M. E. Ehsani, Y.-W. Qian, R. J. Konrad, X.-C. Jiang, M.-S. Kuo, G. Cao and J. Wang, Anal. Biochem., 2013, 438, 61–66 CrossRef CAS PubMed.
- C. Gault, L. Obeid and Y. Hannun, Adv. Exp. Med. Biol., 2010, 688, 1–23 CrossRef CAS PubMed.
- C. Yeang, S. Varshney, R. Wang, Y. Zhang, D. Ye and X.-C. Jiang, Biochim. Biophys. Acta, Mol. Cell Biol. Lipids, 2008, 1781, 610–617 CrossRef CAS PubMed.
- Z. Li, Y. Fan, J. Liu, Y. Li, C. Huan, H. H. Bui, M.-S. Kuo, T.-S. Park, G. Cao and X.-C. Jiang, Arterioscler., Thromb., Vasc. Biol., 2012, 32, 1577–1584 CrossRef CAS PubMed.
- Z. Li, H. Zhang, J. Liu, C.-P. Liang, Y. Li, Y. Li, G. Teitelman, T. Beyer, H. H. Bui, D. A. Peake, Y. Zhang, P. E. Sanders, M.-S. Kuo, T.-S. Park, G. Cao and X.-C. Jiang, Mol. Cell. Biol., 2011, 31, 4205–4218 CrossRef CAS PubMed.
- S. Mitsutake, K. Zama, H. Yokota, T. Yoshida, M. Tanaka, M. Mitsui, M. Ikawa, M. Okabe, Y. Tanaka, T. Yamashita, H. Takemoto, T. Okazaki, K. Watanabe and Y. Igarashi, J. Biol. Chem., 2011, 286, 28544–28555 CrossRef CAS PubMed.
- B. Lou, J. Dong, Y. Li, T. Ding, T. Bi, Y. Li, X. Deng, D. Ye and X.-C. Jiang, PLoS One, 2014, 9, e102641 CrossRef PubMed.
- J. Simon, A. Ouro, L. Ala-Ibanibo, N. Presa, T. C. Delgado and M. L. Martínez-Chantar, Int. J. Mol. Sci., 2019, 21, 40 CrossRef PubMed.
- J. Ecker, E. Benedetti, A. S. D. Kindt, M. Höring, M. Perl, A. C. Machmüller, A. Sichler, J. Plagge, Y. Wang, S. Zeissig, A. Shevchenko, R. Burkhardt, J. Krumsiek, G. Liebisch and K.-P. Janssen, Gastroenterology, 2021, 161, 910–923 CrossRef CAS PubMed.
- X. C. Jiang, F. Paultre, T. A. Pearson, R. G. Reed, C. K. Francis, M. Lin, L. Berglund and A. R. Tall, Arterioscler., Thromb., Vasc. Biol., 2000, 20, 2614–2618 CrossRef CAS PubMed.
- K. Zama, S. Mitsutake, K. Watanabe, T. Okazaki and Y. Igarashi, Chem. Phys. Lipids, 2012, 165, 760–768 CrossRef CAS PubMed.
- M. A. Othman, K. Yuyama, Y. Murai, Y. Igarashi, D. Mikami, Y. Sivasothy, K. Awang and K. Monde, ACS Med. Chem. Lett., 2019, 10, 1154–1158 CrossRef CAS PubMed.
- M. M. Mahadeva, Chem. Commun., 2018, 54, 12758–12761 RSC.
- X. Deng, F. Lin, Y. Zhang, Y. Li, L. Zhou, B. Lou, Y. Li, J. Dong, T. Ding, X. Jiang, R. Wang and D. Ye, Eur. J. Med. Chem., 2014, 73, 1–7 CrossRef CAS PubMed.
- H. Takatsu, K. Baba, T. Shima, H. Umino, U. Kato, M. Umeda, K. Nakayama and H.-W. Shin, J. Biol. Chem., 2011, 286, 38159–38167 CrossRef CAS PubMed.
- H.-W. Shin, N. Morinaga, M. Noda and K. Nakayama, MBoC, 2004, 15, 5283–5294 CrossRef CAS PubMed.
- D. del Alamo, D. Sala, H. S. Mchaourab and J. Meiler, eLife, 2022, 11, e75751 CrossRef CAS PubMed.
- A. Pasquadibisceglie, A. Leccese and F. Polticelli, Front. Chem., 2022, 10, 1004815 CrossRef CAS PubMed.
- M. Mirdita, K. Schütze, Y. Moriwaki, L. Heo, S. Ovchinnikov and M. Steinegger, Nat. Methods, 2022, 19, 679–682 CrossRef CAS PubMed.
- E. F. Pettersen, T. D. Goddard, C. C. Huang, E. C. Meng, G. S. Couch, T. I. Croll, J. H. Morris and T. E. Ferrin, Protein Sci., 2021, 30, 70–82 CrossRef CAS PubMed.
- I. D. Pogozheva, G. A. Armstrong, L. Kong, T. J. Hartnagel, C. A. Carpino, S. E. Gee, D. M. Picarello, A. S. Rubin, J. Lee, S. Park, A. L. Lomize and W. Im, J. Chem. Inf. Model., 2022, 62, 1036–1051 CrossRef CAS PubMed.
- K.-H. Chow and D. M. Ferguson, Comput. Phys. Commun., 1995, 91, 283–289 CrossRef CAS.
- S. Nanjundaswamy, J. Jayashankar, M. H. Chethana, R. R. A. Renganathan, C. S. Karthik, A. P. Ananda, S. Nagashree, P. Mallu and V. R. Rai, J. Mol. Struct., 2022, 1255, 132400 CrossRef CAS.
- S. Nanjundaswamy, J. Jayashankar, R. R. A. Renganathan, C. S. Karthik, L. Mallesha, P. Mallu and V. R. Rai, Microb. Pathog., 2022, 166, 105508 CrossRef CAS PubMed.
- C. S. Karthik, H. M. Manukumar, A. P. Ananda, S. Nagashree, K. P. Rakesh, L. Mallesha, H.-L. Qin, S. Umesha, P. Mallu and N. B. Krishnamurthy, Int. J. Biol. Macromol., 2018, 108, 489–502 CrossRef CAS PubMed.
- S. G. B. Gowda, K. Ikeda and M. Arita, Anal. Bioanal. Chem., 2018, 410, 4793–4803 CrossRef CAS PubMed.
- R. D. da C. C. Bandeira, T. M. Uekane, C. P. da Cunha, J. M. Rodrigues, M. H. C. de la Cruz, R. L. de O. Godoy and A. de L. Fioravante, Braz. Arch. Biol. Technol., 2013, 56, 911–920 CrossRef CAS.
- F. G. Tafesse, K. Huitema, M. Hermansson, S. van der Poel, J. van den Dikkenberg, A. Uphoff, P. Somerharju and J. C. M. Holthuis, J. Biol. Chem., 2007, 282, 17537–17547 CrossRef CAS PubMed.
- S. Piotto, L. Sessa, P. Iannelli and S. Concilio, Biochim. Biophys. Acta, Biomembr., 2017, 1859, 1517–1525 CrossRef CAS PubMed.
- Y. Li, X. Qi, H. Jiang, X. Deng, Y. Dong, T. Ding, L. Zhou, P. Men, Y. Chu, R. Wang, X. Jiang and D. Ye, Bioorg. Med. Chem., 2015, 23, 6173–6184 CrossRef CAS PubMed.
Footnotes |
| † Electronic supplementary information (ESI) available. See DOI: https://doi.org/10.1039/d4an00304g |
| ‡ These authors contributed equally to this work. |
| This journal is © The Royal Society of Chemistry 2024 |


![[double bond, length as m-dash]](https://www.rsc.org/images/entities/char_e001.gif) O and SER A:269 of SMS1 protein, conventional hydrogen bond between C
O and SER A:269 of SMS1 protein, conventional hydrogen bond between C