 Open Access Article
Creative Commons Attribution 3.0 Unported Licence
An infrared study of CO2 activation by holmium ions, Ho+ and HoO+†
Edward I.
Brewer
 ,
Alice E.
Green
 ,
Alexander S.
Gentleman
 ,
Peter W.
Beardsmore
,
Philip A. J.
Pearcy
,
Peter W.
Beardsmore
,
Philip A. J.
Pearcy
 ,
Gabriele
Meizyte
 ,
Jack
Pickering
and
Stuart R.
Mackenzie
 *
*
Department of Chemistry, University of Oxford, Physical and Theoretical Chemistry Laboratory, South Parks Road, Oxford, OX1 3QZ, UK. E-mail: stuart.mackenzie@chem.ox.ac.uk
First published on 7th September 2022
Abstract
We report a combined experimental and computational study of carbon dioxide activation at gas-phase Ho+ and HoO+ centres. Infrared action spectra of Ho(CO2)n+ and [HoO(CO2)n]+ ion–molecule complexes have been recorded in the spectral region 1700–2400 cm−1 and assigned by comparison with simulated spectra of energetically low-lying structures determined by density functional theory. Little by way of activation is observed in Ho(CO2)n+ complexes with CO2 binding end-on to the Ho+ ion. By contrast, all [HoO(CO2)n]+ complexes n ≥ 3 show unambiguous evidence for formation of a carbonate radical anion moiety,  . The signature of this structure, a new vibrational band observed around 1840 cm−1 for n = 3, continues to red-shift monotonically with each successive CO2 ligand binding with net charge transfer from the ligand rather than the metal centre.
1. Introduction
CO2 is one of the most abundant greenhouse gases in the earth's atmosphere, and its capture, sequestration or chemical transformation into industrial feedstocks and fuel is a matter of great interest. Recent reviews have shown that both metal atoms1 and extended metal surfaces2 can activate molecular CO2 effectively, the first mechanistic step in its transformation. Of particular interest to this study, Schwarz1 has highlighted the crucial role that metal ions play in CO2 reduction and the formation of new bonds involving carbon.CO2 has been shown to bind molecularly to charged metal species in at least four characteristic binding motifs: M(η1–OCO), M(η1–CO2), M[η2–(C,O)O], and M[η2–(O,O)C], representing varying degrees of molecular activation.3 The natural limit of activation, dissociative binding (or insertion reaction), leads to formation of the metal oxide and a CO molecule.4–11 Metal anions have a greater capability to activate and dissociate CO2 compared with their cationic counterparts as they are able to donate electron density into the antibonding  LUMO of CO2 molecules. This is reflected in the wider range of binding motifs for M−(CO2) species.12–22 As well as activating and dissociating CO2, metal anions have been shown to promote dimerization of CO2 forming oxalate-like structures in which two of the CO2 ligands form a single chelating ligand.18 Size-selected metal clusters provide a way to tune the degree of activation with CO2. Only larger Con− (n > 8) clusters bind CO2 at all5 whilst CO2 binds molecularly to small Ptn− clusters (n < 5) but dissociatively on larger ones.6
Metal cations necessarily donate electron density less effectively than anions and M+(CO2) binding is usually M(η1–OCO),4,23–28 dictated by the dominant charge–quadrupole interactions and σ-donation. The typical spectroscopic signature of such binding is a weak blue shift in the CO2 asymmetric stretch around 2349 cm−1.29 There are, however, notable exceptions to this η1 binding; Jiang and coworkers observed M[η2-(C,O)O] motifs in M+(CO2)7 complexes (where M = V, Cr and Mn) resulting from charge transfer from the additional ligands,26 a phenomenon also observed in other systems, such as [MgCO2(H2O)n]+ complexes.30 In rare cases, metal cations have also been shown to lead to oxalate-type structures.7 Room temperature reactivity experiments have shown that some early transition metal cations undergo direct O-atom transfer reactions with CO2.31 CO2 reacts with Ta+ cations under single-collision conditions to form TaO+ which can, in turn, react with a further CO2 to produce TaO2+.32 Direct spectroscopic evidence of dissociatively bound CO2 was observed in Ti+(CO2)n (n = 3–7), V+(CO2)5+ and inferred on Ni+(CO2)n+ (n = 1–12) complexes.7–10 Little work has been performed on CO2 reactivity with naked metal cluster cations although Tan+ (n = 1–16) clusters show size-selective reactivity towards CO2.11
Metal oxides can, in principle, provide the possibility for more interesting and extensive chemistry to occur. Duncan and co-workers have investigated structures of NiO2(CO2)n+ complexes and only found evidence of molecularly bound CO24 as did Lang and coworkers in MnxOy(CO2)z+.33 We found similar binding in TaO2(CO2)n+ and NbO2(CO2)n+.34 Jiang and co-workers, however, found evidence for {CO3} moiety formation in infrared studies of YO(CO2)n+ (n ≥ 4) complexes.35
Here we report an infrared photodissociation (IR-PD) study of gas-phase Ho(CO2)n+ and HoO(CO2)n+ ion–molecule complexes in order to elucidate the binding behaviour of CO2 to Ho+ and HoO+ ions. Like most lanthanide metals, holmium typically adopts a +3 oxidation state in solution, the result of (relatively) facile removal of electrons from outer orbitals and larger enthalpies of hydration of higher charge states. Based on their ability to stabilize higher oxidation states, Ho+ cations were selected for this work in order to investigate whether they might activate CO2 more effectively than transition metal cations.
2. Experimental/computational methods
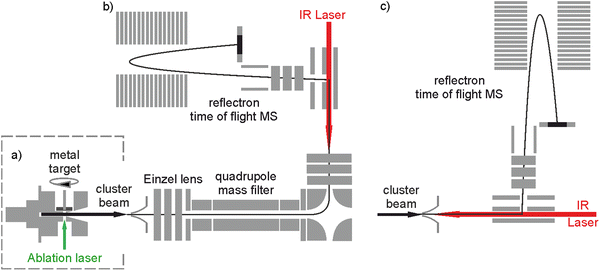
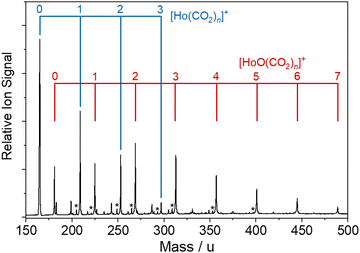
The bespoke instrument used for these experiments has been described in detail previously25,36–38 and only essential details are given here. Two conceptually different experiments have been performed and the differences are illustrated in Fig. 1. The laser ablation source, Fig. 1a is common to both experiments and is a variation of the cutaway source of Duncan and co-workers.39 Ho(CO2)n+ and [HoOm(CO2)n+] ion–molecule complexes are produced by pulsed laser ablation of a rotating holmium disc in the presence of Ar carrier gas seeded with 0.75–5% CO2. Varying partial pressures and backing pressures provides some control over the size distribution of ion–molecule complexes produced. Ablation is performed in the throat of a supersonic expansion designed to arrest metal cluster formation and promote the formation of metal ion–ligand complexes entrained within a molecular beam.Fig. 2 shows a typical time-of-flight mass spectrum of the species generated in the source. The distribution is dominated by the target Ho(CO2)n+ and [HoOm(CO2)n]+ complexes and their Ar-tagged equivalents. Here, we employ square brackets, [X], to indicate complexes for which different chemical structures are plausible. The Ho(CO2)n+ complex signal falls rapidly with increasing n with little signal apparent by n > 4. By contrast, strong [HoO(CO2)n]+ signals are observed well beyond n = 15. The holmium target, as with many metals, contains enough surface oxide to generate the oxide complexes without any additional oxidant though we cannot rule out the possibility that Ho+ ions and/or small Ho(CO2)n+ complexes react with the CO2 itself to generate the HoO+ species.
Two variants of infrared dissociation experiments have been performed. Employing the in-line arrangement in Fig. 1c, target complexes are Ar-tagged, permitting the IR-PD spectra of a wide range of complexes to be recorded simultaneously in depletion of the parent [HoOm(CO2)n–Ar]+ signal:25,34
| [HoOm(CO2)n–Ar]+ + hνIR → [HoOm(CO2)n]+ + Ar. | (1) |
In what follows, such spectra, recorded in depletion mode, are denoted [–Ar] and shown as blue data points. These spectra have been normalised to the largest fractional depletion signal in the spectrum.
We have recently added the ability to mass select the parent ion with the addition of a quadrupole mass filter as shown in Fig. 1b.36 This configuration has been used to record spectra for mass-selected ion–molecule complexes individually via loss of either a CO2 ligand or an Ar messenger depending on complex size:
| [HoOm(CO2)n]+ + hνIR → [HoOm(CO2)n−1]+ + CO2, | (2) |
| [HoOm(CO2)n–Ar]+ + hνIR → [HoOm(CO2)n]+ + Ar, | (3) |
Tuneable infrared radiation between 1650 and 2450 cm−1 is provided by a pulsed optical parametric oscillator/optical parametric amplifier (OPO/OPA, LaserVision, employing an AgGaSe2 crystal). Infrared action spectra are recorded either in parent ion depletion or daughter ion enhancement by comparing mass spectra recorded with and without infrared excitation as a function of infrared wavenumber. The data reported as cross-sections, σ where
 | (4) |
Ar-tag depletion experiments (process (1)) provide an effective way to record a consistent series of spectra for all complexes simultaneously. However, the signal-to-noise ratio of such spectra is often poor. Spectra recorded in fragment ion channels, processes (2) and (3), have better signal to noise provided a single photon is sufficient to cause ligand loss – usually the case for all but the very smallest complexes.
In order to aid the interpretation of the infrared spectra obtained, energetically low-lying structural isomers have been calculated using density functional theory (DFT) using the Gaussian 16 program40 in combination with a modified Kick3 algorithm.41,42 The UB3P86/Def2-TZVP functional/basis set was used.43,44 Other basis set and functional combinations were tested but minimal differences were found except for the relative energy ordering of some low-lying isomers and predicted vibrational band positions. Our interest here lies in better understanding the vibrational spectra recorded and thus we focus on the geometrical structures. We have not undertaken full spin–orbit calculations and structures are labelled according to their spin quantum number within a Russell–Saunders coupling scheme. Calculated vibrational frequencies have been scaled by a factor of 0.96 to better match with experiment, this number determined from the ratio of the experimental CO2 asymmetric stretch fundamental band at 2349 cm−1,29 and that calculated, 2441 cm−1. Line spectra have been convoluted with a Lorentzian function with a full width at half-maximum (FWHM) of 8 cm−1 to aid comparison with experimental spectra.
3. Results and discussion
3.1 Ho(CO2)n+ infrared spectra
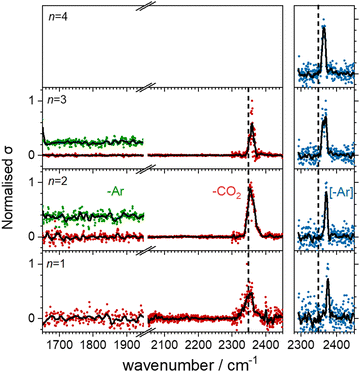
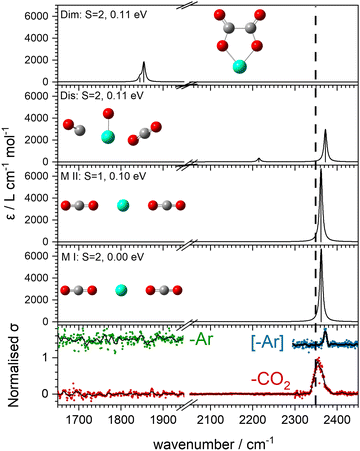
Fig. 3 shows the infrared action spectra for Ho(CO2)n+ complexes. In all cases, only a single feature is observed, between 2350 and 2400 cm−1, close to the ν3 fundamental in free CO2 and indicative of essentially unperturbed CO2 molecules bound in an M(η1–OCO) fashion.4,23–28 As well as being slightly more blue–shifted (by ca. 20 cm−1), the spectral features recorded in the [–Ar] depletion channel (blue data points, right hand panel) are markedly narrower than the same bands recorded in the –CO2 channel (red points, left hand panel). This is commonly observed, has been discussed by the Duncan group,45 and likely results from a combination of the fact that: (i) fewer IR photons are required to remove the weakly-bound Ar atom than a CO2 ligand and (ii) that the process of Ar-tagging preferentially selects the cooler complexes. The DFT simulations do not fully recover the blue-shift induced by the Ar tag and the structures with and without tags are essentially identical (see ESI†). It is interesting that the same band red-shifts slightly with increasing n in the spectra of the Ar-tagged species, while in the non-tagged complexes, the band instead shifts ca. 7 cm−1 to the blue between n = 1 and 3.Our search of the potential energy surfaces reveals different distinct binding motifs with characteristic vibrational spectra with which to compare the experimental spectra. For example, Fig. 4 shows several structures identified for the Ho(CO2)2+ complex. The global minimum structure, MI, is a quintet spin state, linear, (D∝h) structure with one strong infrared allowed band. A similar triplet state structure lies 0.1 eV higher in energy. Two additional quintet structures, Dis and Dim, lie 0.11 eV higher in energy but no experimental evidence for either of these structures is obtained. Instead, the single spectral feature, near 2350 cm−1, is assigned to structure, MI. Substantial rearrangements and/or bond breaking would be required to form structures Dim and Dis and it is likely that formation of these is kinetically hindered.
Comparisons of experimental and simulated comparisons for other complex sizes are available in the ESI.† It is clear that CO2 only binds to the bare Ho+ ion in a simple M(η1–OCO) fashion for n = 1–4 consistent with many transition metal cations investigated previously.4,23–28 This simple electrostatic binding with negligible back donation from the cation accounts for the lack of CO2 activation.
3.2 HoO(CO2)n+ infrared spectra
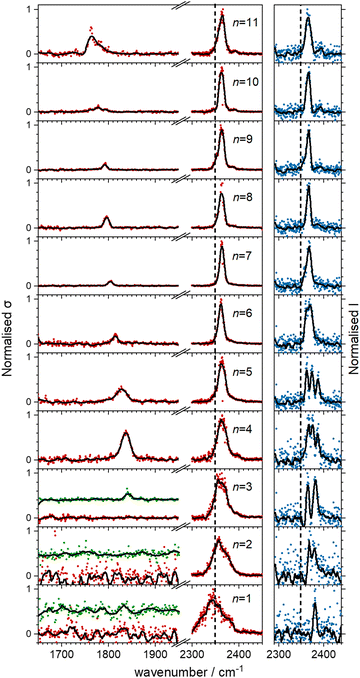
Fig. 5 shows the experimental infrared spectra of HoO(CO2)n+ (n = 1–11) with and without Ar tagging in the 1650–1950 cm−1 and 2300–2450 cm−1 regions. The signal to noise is poor in the n = 1, 2 spectra as only weak fragmentation is observed which may arise from multiple photon processes. It is an artefact of normalising spectra to the strongest spectral feature even when it is weak, that results in poor spectra in the lower wavenumber region.By contrast with the spectra of the Ho(CO2)n+ complexes, most [HoO(CO2)n]+ spectra exhibit two spectral features. All spectra exhibit features in the region of the CO2 asymmetric stretch (2350–2400 cm−1) which are assigned to simple molecular M(η1–OCO) binding. The better resolved spectra recorded in the [–Ar] depletion channel (right hand panel, Fig. 5) exhibit clear spectral structure for n = 2–6 and, as for the Ho(CO2)n+ spectra, these Ar–tagged peaks are blue shifted by around 10–15 cm−1. For n ≥ 4 complexes, additional features are observed in the 1850–1760 cm−1 in the CO2 loss channel of mass–selected complexes. This same feature is also observed in the Ar loss channel for HoO(CO2)3–Ar+. Jiang and coworkers assigned similar features in the spectrum of YO(CO2)n+ complexes, to a C–O stretch in a {CO3}δ− moiety bound in a M(η2–O,O(CO)) fashion35 and we have investigated the possibility of this type of structure in our [HoO(CO2)n]+ complexes.
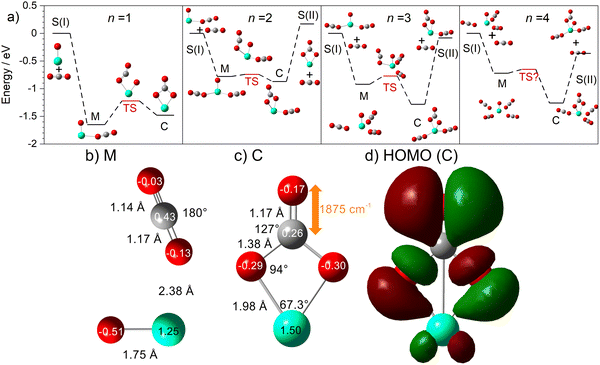
The computational potential energy surface search reveals two distinct structural motifs for each cluster size, the relative energies of which are shown in Fig. 6 for the [HoO(CO2)n]+ (n =1–4) complexes. For each complex an energetically low-lying Ho(CO3)(CO2)n−1+ type structure is calculated. These are labelled C isomers, in which C represents the presence of a carbonate radical anion like moiety  . In these structures one CO2 molecule reacts with the HoO+ forming a C2v Ho(CO3)+ sub-structure in which two O-atoms bind to the metal ion (M(η2–O,O(CO))) as observed by Jiang and co-workers in the YO+ analogues. Zhao et al. labelled this a “carbonate structure” but, according to our calculations, the charge on the {CO3} group never exceeds −1 so we prefer a “carbonate radical anion” description. Our calculations predict this structure to be the lowest energy isomer for all n >1. This Ho(CO3)+ forms a core structure to which we calculate additional CO2 molecules bind at the Ho+ centre in a M(η1–OCO) configuration.
The second type of structure found is a conventional HoO(CO2)n+ type structure in which all CO2 molecules are molecularly-bound to the Ho end of HoO+ in M(η1–OCO) fashion. These structures (M isomers) exhibit spectral bands only in the 2350–2400 cm−1 region.
In all [HoO(CO2)n]+ (n = 1–4) complexes, both M and C isomers are strongly bound, by 0.9–1.5 eV, relative to their respective dissociation limits. In n = 1, the molecularly bound isomer, M, is found to be more stable than the carbonate radical anion, C form whereas for n = 2, both structures are found to be essentially isoenergetic. For all complexes n > 2, the C isomer is markedly lower in energy than the M isomer making the presence of the Ho(CO3)+ moiety the likely dominant structural motif.
We have identified plausible barriers to the M ↔ C interconversion in the case of n = 1–3. According to Jiang,35 the formation of  proceeds via a 2 + 2 cycloaddition transition state from the molecularly-bound form. This requires a nucleophilic attack upon the carbon atom in CO2 by the electron-rich oxygen in HoO+. The transition state energy is stabilized (relative to the M isomer minimum) with increasing complex size, as the charge donated by each successive CO2 ligand is localised on the oxide, but in all cases remains submerged below any relevant dissociation threshold. We have little direct information on the internal energy distribution of our complexes but, due to the nature of the molecular beam expansion, it is not uncommon for us to see entrance channel complexes trapped behind submerged barriers on potential energy surface.
The calculated structures and charge distributions of both n = 1 isomers are shown in Fig. 6(b and c) and for larger complexes in the ESI.† For the n = 1 C isomer, significant charge is donated from the Ho atom (leaving it +1.50 e, compared with +1.41 e in the HoO+ ion) to the CO3 moiety. The terminal C![[double bond, length as m-dash]](https://www.rsc.org/images/entities/char_e001.gif) O bond length, at 1.17 Å, is almost unchanged from free CO2 but the other two C–O bonds are markedly elongated at 1.38 Å reflecting significant activation. In the M isomer the CO2 ligand donates electron density, reducing the Ho partial charge slightly to +1.25 e but with minimal effect on structure of the CO2 moiety.
O bond length, at 1.17 Å, is almost unchanged from free CO2 but the other two C–O bonds are markedly elongated at 1.38 Å reflecting significant activation. In the M isomer the CO2 ligand donates electron density, reducing the Ho partial charge slightly to +1.25 e but with minimal effect on structure of the CO2 moiety.
These potential energy surface calculations account qualitatively for the observations in Fig. 5. The lower wavenumber band, assigned to the C isomers appears persistently from n = 3 onwards by which stage the C isomer is calculated to lie significantly lower in energy than the M isomer. For the n = 3 complex itself, the band is clearly observed but only in –Ar loss from the tagged species, presumably because the CO2 binding energy exceeds the single photon energy. For similar reasons, we cannot exclude the presence of the carbonate radical anion for n = 1, 2 but there is no direct spectroscopic evidence for it.
It is noteworthy that CO2 loss is the only fragmentation channel observed in the untagged species. At no point was loss of CO3 observed for any species, this threshold lying at considerably higher energy.
In the CO2 loss spectra in Fig. 5 (red data points) the main bands around 2350 cm−1 narrows considerably between n = 1 and n = 4. The smaller complexes have higher ligand binding energies reflecting direct binding to the metal centre in the inner coordination shell. As a result more infrared photons are required to cause fragmentation. Beyond n = 4, CO2 molecules bind more weakly in a second solvation shell (see structures in the ESI†) and single photon absorption leads to facile ligand loss.
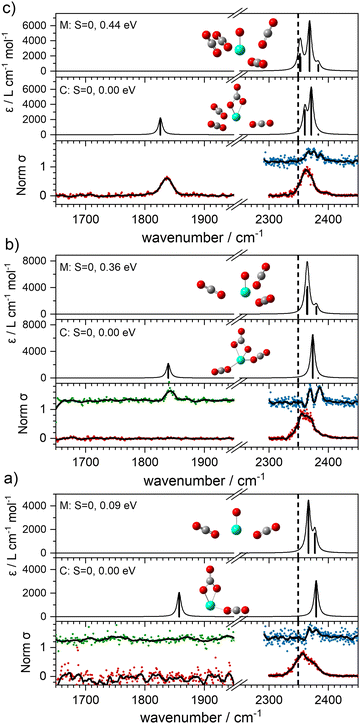
With this qualitative understanding of the action spectra on the basis of expected structures, Fig. 7 shows a comparison of experimental and simulated spectra for the [HoO(CO2)n]+ (n = 2–4) complexes based on the M and C isomers predicted. The main 2330–2380 cm−1 band is of limited use in identifying the structure as almost all calculated isomeric forms contain one or more molecularly-bound CO2 with ν3 fundamental band in this region (M(η1–OCO)). By contrast, the band between 1850 and 1900 cm−1 is a clear and unambiguous signature of the C isomer in each case and is clearly visible in the spectra of the n = 3, 4 complexes. This spectral band arises from the unique C![[double bond, length as m-dash]](https://www.rsc.org/images/entities/char_e001.gif) O stretch in
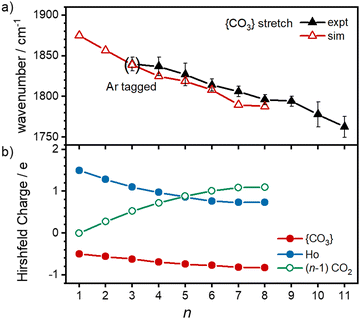
O stretch in  as shown by the vectors in Fig. 6c. As seen in Fig. 5, this band red shifts approximately linearly with increasing complex size from 1840 cm−1 (n = 3 complex) to 1760 cm−1 by n = 11 (see Fig. 8).
It is tempting to interpret two partially resolved peaks in the [–Ar] depletion spectrum (blue data points) of the [HoO(CO2)2]+ complex (at 2367 and 2378 cm−1, bottom panel, Fig. 7a) as the two components of the CO2 stretches in the M isomer (at 0.09 eV). This would be consistent with the absence of any band to the red, even in the –Ar loss daughter channel despite the calculated Ar binding of only 0.23 eV. It is dangerous, however, to draw conclusions from the absence of a band and we cannot rule out the possibility of both M and C isomers being present in the beam.
The –Ar loss spectrum (in green) of the tagged HoO(CO2)3+ complex (Fig. 7b) provides the first unambiguous evidence for the presence of the {CO3} moiety, its presence reproduced well in the simulated spectrum of the putative global minimum structure around 1850 cm−1. The calculated Ar binding energy to this complex is only 0.12 eV making it an ideal tag. Similarly, the two resolved features in the Ar depletion spectrum (blue) at 2364 cm−1 and 2382 cm−1 can be interpreted as a combination of both the M and C isomers with the latter not observed in the –CO2 daughter channel due to the higher CO2 binding energy (see Fig. 6). The signature of the {CO3} moiety is observed in the spectrum of all complexes n ≥ 4, though this doesn’t mean the presence of the M isomer can be ruled out. Several complexes (notably n = 4, 5, 6) exhibit detailed structure in the [–Ar] depletion spectra around the CO2 ν3 fundamental which could be interpreted as indicating the presence of multiple isomers and we have often seen such examples in our ablation source. Equally this structure could indicate different Ar binding sites and/or a reduction in symmetry. For complexes n ≥ 7, only one, narrow feature is seen in the [–Ar] depletion spectra suggesting a dominance of a single isomeric form.
The characteristic {CO3} stretch red-shifts as additional CO2 ligands bind (Fig. 5 and 8). Rather than reflecting increasing donation from the holmium atom, calculations show that this instead arises from increasing σ-donation from successive CO2 ligand addition. This serves to further activate the terminal C![[double bond, length as m-dash]](https://www.rsc.org/images/entities/char_e001.gif) O bond, reduce the net charge on the Ho atom from 1.7 e (n = 1) to +1.3 e (n = 8) and reduce the barrier to M ↔ C isomer interconversion.
O bond, reduce the net charge on the Ho atom from 1.7 e (n = 1) to +1.3 e (n = 8) and reduce the barrier to M ↔ C isomer interconversion.
4. Conclusions
Infrared action spectra of CO2 binding to gas-phase Ho+ ions reveals weak interactions with minimal perturbation of the CO2 structure consistent with previous studies of CO2 binding to atomic cations. Each CO2 ligand undergoes σ donation towards the Ho+ ion making subsequent CO2 coordination weaker and no complexes beyond n = 4 were observed for Ho(CO2)n+. CO2 binds to HoO+ both molecularly and forms a radical carbonate anion structure the latter being the more stable form for [HoO(CO2)n]+ (n ≥ 2). The σ donation from the CO2 ligands results in electron density being localised on the oxygen atom rather than the Ho+ making it susceptible to attack via the electrophilic carbon in the CO2 ligands forming . This structural motif is clearly identifiable by its signature C
![[double bond, length as m-dash]](https://www.rsc.org/images/entities/char_e001.gif) O stretch between 1750 and 1850 cm−1 depending on the number of ligands attached. Each successive CO2 ligand donates additional charge which ends up localised in this moiety activating the terminal C
O stretch between 1750 and 1850 cm−1 depending on the number of ligands attached. Each successive CO2 ligand donates additional charge which ends up localised in this moiety activating the terminal C![[double bond, length as m-dash]](https://www.rsc.org/images/entities/char_e001.gif) O. In this sense, the degree of activation is controllable and in this regard [HoO(CO2)n]+ complexes behave very similarly to the YO(CO2)n+ complexes reported by Jiang and coworkers.35
O. In this sense, the degree of activation is controllable and in this regard [HoO(CO2)n]+ complexes behave very similarly to the YO(CO2)n+ complexes reported by Jiang and coworkers.35
Conflicts of interest
There are no conflicts to declare.Acknowledgements
This work was funded by EPSRC Programme Grant EP/T021675 held jointly between the University of Oxford and Heriot Watt University. EIB is grateful to Somerville College, Oxford for his Thatcher Scholarship and AEG to Magdalen College, Oxford for her Leon and Iris Beghian Scholarship. PAJP and GM are grateful to University College and Worcester College, respectively for financial support.References
- H. Schwarz, Coord. Chem. Rev., 2017, 334, 112–123 CrossRef CAS.
- U. J. Etim, C. Zhang and Z. Zhong, Nanomaterials, 2021, 11, 3265 CrossRef CAS.
- L. G. Dodson, M. C. Thompson and J. M. Weber, Annu. Rev. Phys. Chem., 2018, 69, 231–252 CrossRef CAS PubMed.
- N. R. Walker, G. A. Grieves, R. S. Walters and M. A. Duncan, Chem. Phys. Lett., 2003, 380, 230–236 CrossRef CAS.
- A. Yanagimachi, K. Koyasu, D. Y. Valdivielso, S. Gewinner, W. Schöllkopf, A. Fielicke and T. Tsukuda, J. Phys. Chem. C, 2016, 120, 14209–14215 CrossRef CAS.
- A. E. Green, J. Justen, W. Schollkopf, A. S. Gentleman, A. Fielicke and S. R. Mackenzie, Angew. Chem., Int. Ed., 2018, 57, 14822–14826 CrossRef CAS PubMed.
- A. M. Ricks, A. D. Brathwaite and M. A. Duncan, J. Phys. Chem. A, 2013, 117, 11490–11498 CrossRef CAS PubMed.
- X. P. Xing, G. J. Wang, C. X. Wang and M. F. Zhou, Chin. J. Chem. Phys., 2013, 26, 687–693 CrossRef CAS.
- A. M. Ricks, A. D. Brathwaite and M. A. Duncan, J. Phys. Chem. A, 2013, 117, 11490–11498 CrossRef CAS.
- N. R. Walker, R. S. Walters, G. A. Grieves and M. A. Duncan, J. Chem. Phys., 2004, 121, 10498–10507 CrossRef CAS.
- N. Levin, J. T. Margraf, J. Lengyel, K. Reuter, M. Tschurl and U. Heiz, Phys. Chem. Chem. Phys., 2022, 24, 2623–2629 RSC.
- A. D. Boese, H. Schneider, A. N. Gloss and J. M. Weber, J. Chem. Phys., 2005, 122, 154301 CrossRef PubMed.
- B. J. Knurr and J. M. Weber, J. Am. Chem. Soc., 2012, 134, 18804–18808 CrossRef CAS PubMed.
- B. J. Knurr and J. M. Weber, J. Phys. Chem. A, 2013, 117, 10764–10771 CrossRef CAS.
- B. J. Knurr and J. M. Weber, J. Phys. Chem. A, 2014, 118, 4056–4062 CrossRef CAS PubMed.
- B. J. Knurr and J. M. Weber, J. Phys. Chem. A, 2014, 118, 8753–8757 CrossRef CAS PubMed.
- B. J. Knurr and J. M. Weber, J. Phys. Chem. A, 2014, 118, 10246–10251 CrossRef CAS.
- M. C. Thompson, J. Ramsay and J. M. Weber, Angew. Chem., Int. Ed., 2016, 55, 15171–15174 CrossRef CAS PubMed.
- M. C. Thompson, L. G. Dodson and J. M. Weber, J. Phys. Chem. A, 2017, 121, 4132–4138 CrossRef CAS PubMed.
- M. C. Thompson, J. Ramsay and J. M. Weber, J. Phys. Chem. A, 2017, 121, 7534–7542 CrossRef CAS PubMed.
- L. G. Dodson, M. C. Thompson and J. M. Weber, J. Phys. Chem. A, 2018, 122, 2983–2991 CrossRef CAS PubMed.
- M. C. Thompson and J. M. Weber, J. Phys. Chem. A, 2018, 122, 3772–3779 CrossRef CAS.
- Z. Zhao, X. T. Kong, D. Yang, Q. Q. Yuan, H. Xie, H. J. Fan, J. J. Zhao and L. Jiang, J. Phys. Chem. A, 2017, 121, 3220–3226 CrossRef CAS PubMed.
- R. S. Walters, N. R. Brinkmann, H. F. Schaefer and M. A. Duncan, J. Phys. Chem. A, 2003, 107, 7396–7405 CrossRef CAS.
- A. Iskra, A. S. Gentleman, A. Kartouzian, M. J. Kent, A. P. Sharp and S. R. Mackenzie, J. Phys. Chem. A, 2017, 121, 133–140 CrossRef CAS PubMed.
- D. Yang, X. Kong, H. Zheng, M. Su, Z. Zhao, H. Xie, H. Fan, W. Zhang and L. Jiang, J. Phys. Chem. A, 2019, 123, 3703–3708 CrossRef CAS PubMed.
- G. Gregoire, J. Velasquez and M. A. Duncan, Chem. Phys. Lett., 2001, 349, 451–457 CrossRef CAS.
- G. Gregoire, N. R. Brinkmann, D. van Heijnsbergen, H. F. Schaefer and M. A. Duncan, J. Phys. Chem. A, 2003, 107, 218–227 CrossRef CAS.
- G. Herzberg, Molecular Spectra and Molecular Structure, Volume II: Infrared and Raman Spectra of Polyatomic Molecules, Krieger Publishing Company, Malabar, FL, USA, 1991 Search PubMed.
- E. Barwa, T. F. Pascher, M. Ončák, C. van der Linde and M. K. Beyer, Angew. Chem., Int. Ed., 2020, 59, 7467–7471 CrossRef CAS.
- G. K. Koyanagi and D. K. Bohme, J. Phys. Chem. A, 2006, 110, 1232–1241 CrossRef CAS PubMed.
- R. Wesendrup and H. Schwarz, Angew. Chem., Int. Ed. Engl., 1995, 34, 2033–2035 CrossRef CAS.
- N. Zimmermann, T. M. Bernhardt, J. M. Bakker, R. N. Barnett, U. Landman and S. M. Lang, J. Phys. Chem. A, 2020, 124, 1561–1566 CrossRef CAS PubMed.
- A. Iskra, A. S. Gentleman, E. M. Cunningham and S. R. Mackenzie, Int. J. Mass Spectrom., 2019, 435, 93–100 CrossRef CAS.
- Z. Zhao, X. Kong, Q. Yuan, H. Xie, D. Yang, J. Zhao, H. Fan and L. Jiang, Phys. Chem. Chem. Phys., 2018, 20, 19314–19320 RSC.
- A. E. Green, R. H. Brown, G. Meizyte and S. R. Mackenzie, J. Phys. Chem. A, 2021, 125, 7266–7277 CrossRef CAS PubMed.
- E. M. Cunningham, A. S. Gentleman, P. W. Beardsmore, A. Iskra and S. R. Mackenzie, J. Phys. Chem. A, 2017, 121, 7565–7571 CrossRef CAS PubMed.
- E. M. Cunningham, A. E. Green, G. Meizyte, A. S. Gentleman, P. W. Beardsmore, S. Schaller, K. M. Pollow, K. Saroukh, M. Förstel, O. Dopfer, W. Schöllkopf, A. Fielicke and S. R. Mackenzie, Phys. Chem. Chem. Phys., 2021, 23, 329–338 RSC.
- M. A. Duncan, Rev. Sci. Instrum., 2012, 83, 041101 CrossRef PubMed.
- M. J. Frisch, G. W. Trucks, H. B. Schlegel, G. E. Scuseria, M. A. Robb, J. R. Cheeseman, G. Scalmani, V. Barone, G. A. Petersson, H. Nakatsuji, X. Li, M. Caricato, A. V. Marenich, J. Bloino, B. G. Janesko, R. Gomperts, B. Mennucci, H. P. Hratchian, J. V. Ortiz, A. F. Izmaylov, J. L. Sonnenberg, D. Williams, F. Ding, F. Lipparini, F. Egidi, J. Goings, B. Peng, A. Petrone, T. Henderson, D. Ranasinghe, V. G. Zakrzewski, J. Gao, N. Rega, G. Zheng, W. Liang, M. Hada, M. Ehara, K. Toyota, R. Fukuda, J. Hasegawa, M. Ishida, T. Nakajima, Y. Honda, O. Kitao, H. Nakai, T. Vreven, K. Throssell, J. A. Montgomery Jr., J. E. Peralta, F. Ogliaro, M. J. Bearpark, J. J. Heyd, E. N. Brothers, K. N. Kudin, V. N. Staroverov, T. A. Keith, R. Kobayashi, J. Normand, K. Raghavachari, A. P. Rendell, J. C. Burant, S. S. Iyengar, J. Tomasi, M. Cossi, J. M. Millam, M. Klene, C. Adamo, R. Cammi, J. W. Ochterski, R. L. Martin, K. Morokuma, O. Farkas, J. B. Foresman and D. J. Fox, Gaussian 16 Revision C.01, Gaussian, Inc., Wallingford CT, 2016 Search PubMed.
- M. A. Addicoat and G. F. Metha, J. Comput. Chem., 2009, 30, 57–64 CrossRef CAS PubMed.
- M. A. Addicoat, S. Fukuoka, A. J. Page and S. Irle, J. Comput. Chem., 2013, 34, 2591–2600 CrossRef CAS PubMed.
- F. Weigend and R. Ahlrichs, Phys. Chem. Chem. Phys., 2005, 7, 3297–3305 RSC.
- J. P. Perdew, Phys. Rev. B: Condens. Matter Mater. Phys., 1986, 33, 8822–8824 CrossRef.
- N. R. Walker, R. S. Walters and M. A. Duncan, New J. Chem., 2005, 29, 1495–1503 RSC.
Footnote |
| † Electronic supplementary information (ESI) available: Structural information on calculated isomeric forms; comparison of experimental and simulated spectra for additional complex sizes; potential energy surface details. See DOI: https://doi.org/10.1039/d2cp02862j |
| This journal is © the Owner Societies 2022 |

