
 Open Access Article
 This Open Access Article is licensed under a Creative Commons Attribution-Non Commercial 3.0 Unported Licence
Negative X-ray expansion in cadmium cyanide†
Chloe S.
Coates
 ab,
Claire A.
Murray
c,
Hanna L. B.
Boström
ad,
Emily M.
Reynolds
ae and
Andrew L.
Goodwin
*a
ab,
Claire A.
Murray
c,
Hanna L. B.
Boström
ad,
Emily M.
Reynolds
ae and
Andrew L.
Goodwin
*a
aInorganic Chemistry Laboratory, South Parks Road, Oxford, OX1 3QR, UK. E-mail: andrew.goodwin@chem.ox.ac.uk; Tel: +44 1865 272137
bDepartment of Chemistry, Lensfield Road, Cambridge, UK
cDiamond Light Source, Harwell Campus, Didcot, Oxfordshire OX11 0DE, UK
dNanochemistry Department, Max Planck Institute for Solid State Research, Heisenbergstr. 1, Stuttgart, 70569, Germany
eISIS Facility, STFC Rutherford Appleton Laboratory, Didcot, Oxfordshire OX11 0QX, UK
First published on 12th February 2021
Abstract
Cadmium cyanide, Cd(CN)2, is a flexible coordination polymer best studied for its strong and isotropic negative thermal expansion (NTE) effect. Here we show that this NTE is actually X-ray-exposure dependent: Cd(CN)2 contracts not only on heating but also on irradiation by X-rays. This behaviour contrasts that observed in other beam-sensitive materials, for which X-ray exposure drives lattice expansion. We call this effect ‘negative X-ray expansion’ (NXE) and suggest its origin involves an interaction between X-rays and cyanide ‘flips’; in particular, we rule out local heating as a possible mechanism. Irradiation also affects the nature of a low-temperature phase transition. Our analysis resolves discrepancies in NTE coefficients reported previously on the basis of X-ray diffraction measurements, and we establish the ‘true’ NTE behaviour of Cd(CN)2 across the temperature range 150–750 K. The interplay between irradiation and mechanical response in Cd(CN)2 highlights the potential for exploiting X-ray exposure in the design of functional materials.
New conceptsIn this communication we have identified and quantified the phenomenon of negative X-ray expansion. To the best of our knowledge this represents the first systematic study of X-ray expansion dose effects in an inorganic functional material; we define the X-ray expansion coefficient σ to quantify the effect. Whilst the study X-ray radiation effects is well-established in the field of macromolecular crystallography (MX), it is only starting to be explored in functional inorganic materials and small molecules. In MX the unit cell parameter expands almost linearly with applied dose. We use precise measurement of the exposure times to extract the dose dependence of negative X-ray expansion in cadmium cyanide, we define the X-ray expansion coefficient σ and calculate σ for previously-reported data for proteins. The insights and methodologies presented here act as a starting point for future systematic studies of X-ray induced effects in functional materials and the use X-rays as a design tool in their own right, for example to access functional materials phases that are otherwise inaccessible via traditional (e.g. heat) treatment alone, or indeed to engineer functionality on the nanoscale via lithographic techniques. |
1 Introduction
That X-rays can affect the structure, and therefore functionality, of materials is well established. In macromolecular crystallography, the phenomenology of ‘radiation damage’ is a mature and important field.1–3 Conversely, discussions about radiation damage in small molecule crystallography are rarer and only starting to be identified.4,5 X-ray-induced effects are somewhat less well studied in conventional inorganic systems, despite being implicated in a number of interesting phenomena. Examples include decomposition,6–8 conductivity enhancement,9–13 colour changes,14 spin-crossover,15 charge transfer,16,17 cell-parameter changes,18 crystallisation,19 and amorphisation.20,21X-ray irradiation has been found to induce changes in the resistivity of magnetoresistive manganites (A1−x3+Bx2+MnO3).9–11 In Pr0.7Ca0.3MnO3 this metal–insulator (and ferromagnetic to antiferromagnetic) transition occurs below 200 K and involves charge ordering of the Mn3+/Mn4+ cations. Upon application of a magnetic field this converts to a conducting state, which is preserved even upon removal of the field. Analogous effects are observed with X-rays; a decrease in intensity of the charge-ordering reflection occurs as the sample is irradiated. Beyond electronic transitions, amorphous thin films of BaTiO3—which resist crystallisation on heating above 600 K—are seen to crystallise upon irradiation with high-energy (24 keV) synchrotron radiation.22 This is rationalised in terms of crystallisation arising from strain fields due to defects that are generated by X-ray-induced bond breaking. Other studies also document the coupling between X-ray exposure and elastic properties: X-ray irradiation of Barluenga's reagent (Br(Coll)2BF4, Coll = 2,4,6-trimethylpyridine) suppresses the diffuse scattering, which is thought to emerge from short-range correlations between rotational configurations of the Br(Coll)2+ and BF4− moieties.5,23 And X-ray exposure with Cu Kα over a period of six hours led to crystallisation of sucrose from amorphous mixtures in ‘Jello’.19
A relatively universal consequence of X-ray-matter interactions is volume expansion of the crystal lattice. In protein crystallography, where the effect has been studied particularly carefully, there is an almost linear dependence of the unit cell volume on the dose of X-ray irradiation.24,25 The X-ray dose is routinely monitored in protein crystallography experiments, and is measured in the S.I. unit of Grays (1 Gy = 1 J kg−1). A typical synchrotron experiment deposits energy on the order of MGy, and the ‘Henderson limit’—which dictates the approximate maximum dose a typical protein crystal can withstand and still diffract—is 20 MGy. In ref. 25 the X-ray induced expansion is quantified by 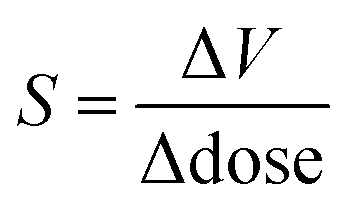 with values of around 0.02 Å3 Gy−1, which corresponds to a volume change of ∼0.3% per MGy of radiation.
The focus of this study is cadmium cyanide, Cd(CN)2, a cubic coordination polymer best studied for its large and isotropic negative thermal expansion (NTE)—the counterintuitive property in which there is a volume reduction with increasing temperature.26,27 It has an ostensibly extremely simple cubic structure with Pn![[3 with combining macron]](https://www.rsc.org/images/entities/char_0033_0304.gif) m symmetry, consisting of two interpenetrating cristobalite frameworks.28 The structure is shown in Fig. 1(E). Crystallographically the cyanides exhibit head-to-tail disorder. However, locally, their orientations are highly correlated: each Cd binds preferentially to two C and two N in an ice-like fashion, and cyanide reorientation enables sampling of degenerate ice-like states.29–31 Below 150 K there is a symmetry lowering phase transition that is of particular interest both in terms of the NTE—since the symmetry of the low temperature phase reflects the key phonons implicated in the NTE response27—and also in terms of the correlated disorder: the phase transition is conspicuously absent for all ab initio studies which ignore the disorder of the cyanides.32,33 Recent neutron diffraction measurements of 114Cd(CN)2 reported a low temperature phase with I41/amd symmetry, whereas previous X-ray measurements of single crystals were inconclusive and the difficulty in determining a space group attributed to twinning.26,30,31
m symmetry, consisting of two interpenetrating cristobalite frameworks.28 The structure is shown in Fig. 1(E). Crystallographically the cyanides exhibit head-to-tail disorder. However, locally, their orientations are highly correlated: each Cd binds preferentially to two C and two N in an ice-like fashion, and cyanide reorientation enables sampling of degenerate ice-like states.29–31 Below 150 K there is a symmetry lowering phase transition that is of particular interest both in terms of the NTE—since the symmetry of the low temperature phase reflects the key phonons implicated in the NTE response27—and also in terms of the correlated disorder: the phase transition is conspicuously absent for all ab initio studies which ignore the disorder of the cyanides.32,33 Recent neutron diffraction measurements of 114Cd(CN)2 reported a low temperature phase with I41/amd symmetry, whereas previous X-ray measurements of single crystals were inconclusive and the difficulty in determining a space group attributed to twinning.26,30,31
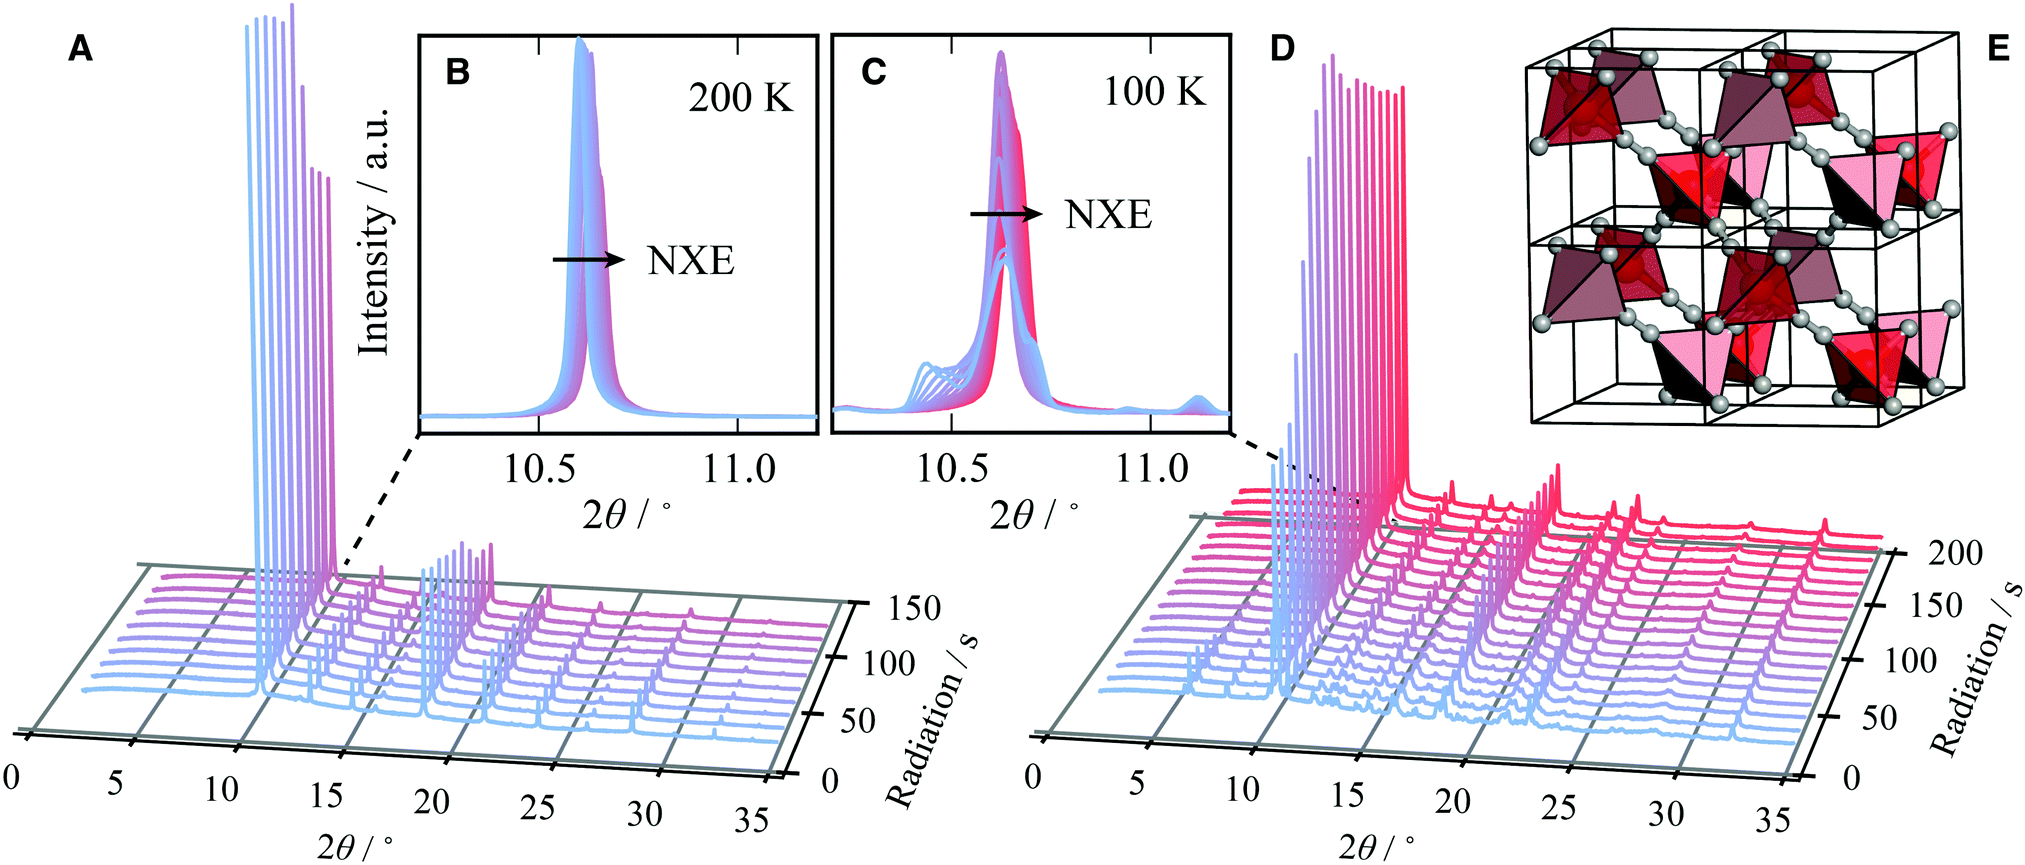 | ||
| Fig. 1 Negative X-ray expansion: the evolution of a series of diffraction patterns (λ = 0.82507 Å) for a sample of Cd(CN)2, held at (A and B) 200 K and (C and D) 100 K, as a function of X-ray exposure (blue to red). (A) At 200 K Cd(CN)2 adopts cubic Pnm symmetry and increasing irradiation results in contraction of the unit cell, as seen in (B) the (110) peak moves to progressively larger values of 2θ. (D) With minimal X-ray exposure at 100 K (blue) Cd(CN)2 has undergone a symmetry-lowering phase transition. On increasing exposure these additional peaks coalesce and those of cubic Cd(CN)2 are restored. X-ray exposure reverses the phase transition. (E) Cd(CN)2 crystallises with Pnm symmetry where tetrahedrally coordinated Cd centres (red/pink to highlight interpenetration frameworks) are connected by disordered cyanide ions (C/N grey spheres). | ||
There is surprising inconsistency in the literature regarding the magnitude of the thermal expansion coefficient, αV = ∂![[thin space (1/6-em)]](https://www.rsc.org/images/entities/char_2009.gif) lnV/∂T, with values across the entire range −35 > αV > −61.2 MK−1 reported from X-ray diffraction measurements.26,30 Consequently, we sought to re-evaluate the nature of the low temperature phase transition using powder X-ray diffraction. It soon became clear that X-rays were unsuitable for unbiased determination of temperature-dependent structural behaviour, owing to X-ray-induced structural effects; these form the basis of this paper. In particular, we show that X-ray radiation leads to unit cell expansion, as well as phase transition reversal and phase selection in Cd(CN)2. We term the unusual property of contraction on X-ray irradiation ‘negative X-ray expansion’ (NXE)—by analogy to NTE. The opportunities for tuning material properties with X-rays and the implications for the study of materials using synchrotron X-ray diffraction are discussed.
lnV/∂T, with values across the entire range −35 > αV > −61.2 MK−1 reported from X-ray diffraction measurements.26,30 Consequently, we sought to re-evaluate the nature of the low temperature phase transition using powder X-ray diffraction. It soon became clear that X-rays were unsuitable for unbiased determination of temperature-dependent structural behaviour, owing to X-ray-induced structural effects; these form the basis of this paper. In particular, we show that X-ray radiation leads to unit cell expansion, as well as phase transition reversal and phase selection in Cd(CN)2. We term the unusual property of contraction on X-ray irradiation ‘negative X-ray expansion’ (NXE)—by analogy to NTE. The opportunities for tuning material properties with X-rays and the implications for the study of materials using synchrotron X-ray diffraction are discussed.
2 Methods
Polycrystalline samples of Cd(CN)2 were synthesised by slow evaporation as reported previously.26,30 Large single crystals were extracted from the solution manually, dried and ground to a polycrystalline powder using a mortar and pestle. Synchrotron powder diffraction data were collected at the high-resolution powder diffraction beamline, I11, at Diamond Light Source. Individual data sets were collected using a Mythen2 Position Sensitive Detector (PSD) with two 5-second scans separated by an angular shift in detector position of 2.5°. The wavelength and intrinsic peak-shape parameters were refined against a known Si 640c NIST standard. Variable temperature (100–500 K) measurements were performed with sample heating from an Oxford Cryostreams attachment. Higher temperature measurements (500–750 K) made use of a Cyberstar hot-air blower attachment. For variable exposure experiments, the exposure time was estimated using a custom-written I11 script, which extracted the opening and closing times of the experimental shutter. In this way the radiation doses applied were carefully controlled by controlling the exposure time of the sample. The width of the primary beam is 2.5 mm; thus a horizontal translation of the capillary 2.5 mm enables pristine Cd(CN)2 to be irradiated for measurements within the same capillary. Pawley refinements to determine the unit cell parameters were carried out in Topas Academic version 4.1.343 Results
3.1 Negative X-ray expansion
We start by showing the effects of X-ray exposure on the structure of ambient temperature cadmium cyanide. Fig. 1(A) shows a waterfall plot of sequential diffraction patterns of a sample of Cd(CN)2, collected at 200 K. The data are characterised by few, well separated, reflections. This is consistent with the expected cubic symmetry, and the data can be refined using the space-group Pnm with lattice parameter a ∼6.3 Å.26,28,35 A magnified view of the (110) reflection at 2θ ∼10.5° is shown in the inset. The cubic phase is maintained with increasing X-ray exposure.
It is evident that increasing X-ray irradiation is causing a contraction of the unit cell; the diffraction peaks progressively shift towards higher values of 2θ, as seen most clearly for the (110) reflection on the inset. We will come to show that this is not a local heating effect. Whereas in macromolecular crystallography the expectation is that beam damage results in unit cell expansion,24 we see that the opposite is true for Cd(CN)2. This is consistent with a previous observation for isostructural Zn(CN)2 where X-ray irradiation at high pressure resulted in unit cell contraction and eventual amorphisation.20 We term this unusual effect of shrinking with increasing irradiation negative X-ray expansion, to highlight the similarities between the unusual temperature-dependent behaviour of these materials and their response to irradiation. The negative thermal expansion in cadmium cyanide is driven by low energy phonons with negative Grüneisen parameters, and this therefore suggests a degree of X-ray–phonon coupling in this material. Similar negative X-ray expansion was observed in the Prussian blue analogue Rb0.7Mn1.15II[FeIIICN6]·2H2O owing to X-ray-induced electronic, and spin transitions as well as in the zeolitic-imidazolate framework (ZIF) materials ZIF-4, ZIF-62 and ZIF-zni, prior to their amorphisation under irradiation.18,21
Pristine cadmium cyanide displays both negative X-ray expansion as well as phase transition suppression at 100 K. A pristine sample of cadmium cyanide was cooled to 100 K, below the phase transition temperature of ∼135 K,26,30,31 and held at 100 K for two minutes to allow for thermal equilibration. The diffraction pattern of pristine cadmium cyanide at 100 K is shown in blue in Fig. 1(C and D). There is clear evidence of a symmetry-lowering phase transition with both peak-splitting of the cubic reflections (see 2θ ∼10.5° and additional peak intensity appearing in between the cubic Bragg peaks for 2θ ∼5°). We were not able to solve the structure of Cd(CN)2 present in this diffraction pattern, which does not correspond to the low temperature I41/amd phase identified using neutron diffraction in ref. 31. The ice-like correlated disorder in this material is likely to lead to a large configurational degeneracy, and this suggests that there may be multiple competing low temperature phases.36 Likewise the long timescale of cyanide reorientations—implicated in the Pnm–I41/amd transition reported in ref. 31—raises the possibility we are observing kinetic products in this experiment. Further exploration of this low temperature phase from an experimental and computational point of view will form the basis of a future report. We note simply that the disorder introduces additional complexity and that the phase behaviour is likely to be extremely dependent on synthesis—and experimental—conditions, which were indeed different for the Cd(CN)2 samples prepared in ref. 31 (ammoniacal synthesis from Hg(CN)2 and Cd metal) and those synthesised here (aqueous).
3.2 Phase transition
Variation in the diffraction pattern for a given sample was then followed as a function of X-ray exposure, as shown in Fig. 1(C). The sample was cooled to 100 K and irradiated continuously over a period of ∼200 seconds. After about one hundred seconds of X-ray exposure, there is a clear ascent in symmetry between the initial pattern collected with zero X-ray exposure (blue) and that collected after 200 s (red), which is consistent with the simple cubic diffraction pattern of the Pnm cell [cf.Fig. 1(A)]. What is remarkable here is that X-ray irradiation is able to reverse the phase transition that is observed on cooling. Typically ‘beam damage’ as a result of X-ray irradiation leads to loss of diffraction intensity.1,37,38 In this case the intensity appears not to decrease but to accumulate in fewer reflections until they correspond to those of the Pnm phase after around 100 seconds of X-ray irradiation. Once the phase transition back to the cubic phase is complete, continuous irradiation again leads to negative X-ray expansion.
3.3 Is the response to X-rays a localised heating effect?
Having established that increasing X-ray exposure leads to unit cell contraction in Cd(CN)2, in an effect analogous to increasing temperature, it is perhaps natural to question whether it is, in fact, a thermal effect. The variation in the lattice parameter with X-ray exposure was determined for temperatures between 160 and 110 K, for a sample containing a mixture of Cd(CN)2 and KMn[Ag(CN)2]3 as a temperature standard. KMn[Ag(CN)2]3 is a coordination polymer with extreme anisotropic thermal expansion by virtue of its wine-rack-like topology. The thermal expansion coefficients (αa = +61(2) MK−1 and αc = −60(3) MK−1)39 are three times larger in magnitude than the linear thermal expansion in Cd(CN)2 (αa = −20.4 MK−1)26 so it is expected that any thermal effects would be visible in the variation of lattice parameters. The sample was held at 110 K and the X-ray exposure—corresponding to the number of seconds for which the shutter was open—recorded for each diffraction pattern. At each temperature an initial s of radiation was applied to enable comparison of the
 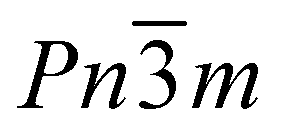 phase in each case. This protocol was then repeated at temperatures in 10 K intervals up to 160 K. At each temperature the capillary was translated such that a pristine sample of Cd(CN)2 was irradiated. The lattice parameter as a function of exposure was refined via Pawley analysis of the diffraction data [see ESI†].
The relative change in lattice parameters on increasing X-ray exposure for both compounds at each temperature is shown in Fig. 2. One would expect the change in unit cell parameters to be clearly visible for KMn[Ag(CN)2]3 if the increased X-ray exposure were generating an increase in temperature. At all temperatures, increasing X-ray exposure has a negligible effect on the lattice parameters of KMn[Ag(CN)2]3 compared to a change in length of up to 0.3% for Cd(CN)2; from this observation two conclusions can be drawn. Firstly, KMn[Ag(CN)2]3 is structurally unaffected by X-ray exposure. And secondly, the change in unit cell metrics on X-ray exposure in Cd(CN)2 cannot be attributed to a heating effect caused by X-ray absorption, consistent with existing studies.40,41 The change in lattice parameters is nonetheless significant: irradiation with X-rays for a period of ∼200 seconds is equivalent to a temperature increase of around 150 K.
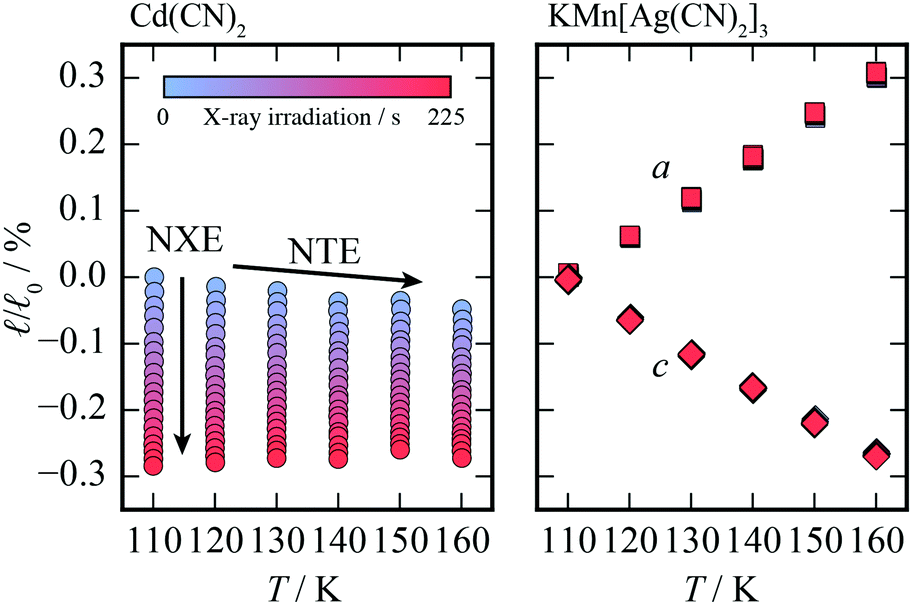 | ||
Fig. 2 The relative changes in the lattice parameters (![[small script l]](https://www.rsc.org/images/entities/i_char_e146.gif) , where 0 is the relevant lattice parameter with minimal X-ray exposure at 110 K) of Cd(CN)2 and KMn[Ag(CN)2]3 as a function of X-ray exposure from blue to red (∼200 seconds) with λ = 0.82507 Å. Whilst the lattice parameter of the former is seen to shrink as a function as a function of exposure at all temperatures, those of the latter show no change, as seen by the overlapping symbols, eliminating the possibility of local heating as a mechanism for the negative X-ray expansion in Cd(CN)2. , where 0 is the relevant lattice parameter with minimal X-ray exposure at 110 K) of Cd(CN)2 and KMn[Ag(CN)2]3 as a function of X-ray exposure from blue to red (∼200 seconds) with λ = 0.82507 Å. Whilst the lattice parameter of the former is seen to shrink as a function as a function of exposure at all temperatures, those of the latter show no change, as seen by the overlapping symbols, eliminating the possibility of local heating as a mechanism for the negative X-ray expansion in Cd(CN)2. | ||
It is possible to quantify the dependence of the unit cell parameter on radiation dose, in direct analogy to the thermal expansion coefficient. In ref. 25 the authors use  . This parameter, however, measures the absolute volume change for a given dose, which does not facilitate comparison between systems. We suggest instead the use of the volume X-ray expansion coefficient σV where;
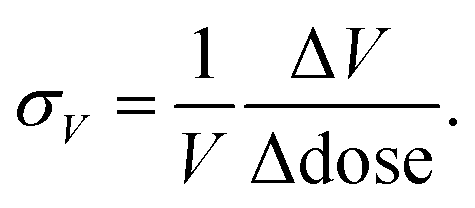 | (1) |
The dose rate of radiation experienced by the sample can be estimated using RADDOSE-3D, a programme first developed for single-crystal macromolecular samples, and more recently adapted to quantify dose rates for small molecule crystallography (still single crystal) and for small-angle scattering (SAXS) measurements.42–44 The dose rate was calculated to be 13 407 Gy s−1, taking into account the attenuation by the borosilicate capillary (10 μm), the beam type (top-hat), and the beam dimensions (0.8 × 2.5 mm2). σV for Cd(CN)2 at 110 K after 225 seconds of irradiation is therefore σV ∼−2.98 GGy−1, which is of the same order of magnitude as that of the protein in ref. 25 only negative; further details of the derivation are given as ESI.† Thus Cd(CN)2 shows a comparable magnitude of response to X-rays as a large, flexible protein only in contraction rather than expansion. Moreover, σV ∼−2.98 GGy−1 is likely to severely underestimate the true X-ray expansion coefficient, since this assumes 100% packing density of the sample in the capillary; a more appropriate assumption would be ∼50% packing density, which would lower the absorption of X-rays by the sample and therefore the average dose.
3.4 Temperature-dependent X-ray effects
It was also observed that the specific temperature at which the sample is irradiated—and the order in which these stimuli are applied—can also affect the structural properties of cadmium cyanide. A distinct type of phase selection occurs if the sample is irradiated prior to cooling. Cd(CN)2 was measured at 300 K, then cooled to 100 K and left to equilibrate for two minutes before being translated by 2.5 mm in order to measure pristine Cd(CN)2. A diffraction pattern was measured at this position before translation back to the original position where the ambient data collection had taken place. The resulting diffraction patterns for one sample are shown in Fig. 3, in black, blue and red respectively. Remarkably the two datasets at 100 K are quite different. Irradiation prior to cooling appears to suppress certain low-temperature reflections, whilst having a negligible effect on others (see 2θ ∼5° vs. 2θ ∼8°, for example). Clearly there is a degree of symmetry lowering in both cases: the phase transition is not suppressed completely. This experiment was repeated for three different samples [see ESI†] and in all three cases the same reflections are suppressed by irradiation with X-rays at room temperature. Moreover, these changes are robust with respect to annealing at higher temperature. Interestingly, the diffraction pattern that is observed with prior irradiation at room temperature can be indexed and refined as a single phase with I41/amd symmetry, as identified in ref. 31.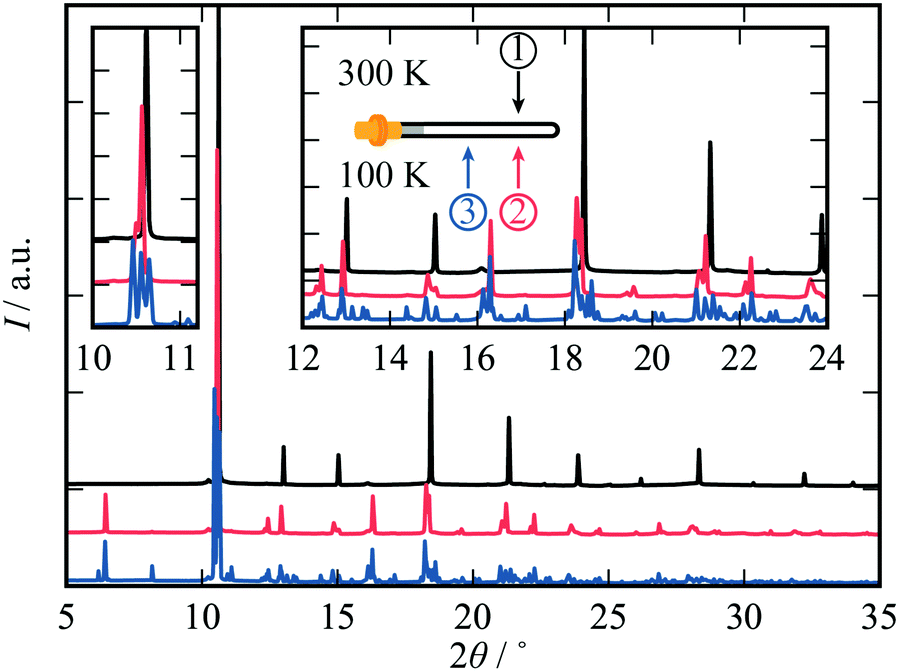 | ||
| Fig. 3 Diffraction patterns (λ = 0.82484 Å) collected for a sample of Cd(CN)2 at 300 K (black) and in the same position at 100 K (red) and at 100 K having been translated (blue = minimal prior exposure). The nature of the phase transition is clearly affected by irradiation prior to cooling. | ||
So what are the possible mechanisms by which X-rays might interact with Cd(CN)2? It is known from X-ray studies in macromolecular systems that high energy incoming (primary) electrons lead to the ejection of secondary electrons, which are now thermalised according to the Boltzmann distribution; this can help explain the parallels here with temperature-dependent behaviour.1,45 In the case of Cd(CN)2, it was shown in ref. 31 that NTE arises in part due to a cyanide ordering mechanism driven by cyanide reorientation (as well as more conventional NTE low energy phonons like transverse vibrations of Cd–CN–Cd moieties and framework breathing modes). The cyanide reorientation itself is driven by spin-ice physics: in which the Cd centre preferentially binds to two C and two N of the cyanide ions, mimicking the two-in-two-out ices rules that govern proton or spin configurations in water and spin ice respectively. The key point here is that the spin-ice physics results in a manifold of degenerate correlated disordered states. The configurational landscape is navigated via migration of local violations of the ice rules—these defects are the effective magnetic monopoles of spin-ices. The energy barrier associated with such a violation in Cd(CN)2—a cyanide flip—was calculated here to be Δ ∼8800 ± 600 K ∼1 eV. We suggest that X-ray induced cyanide flipping might enable sampling of the spin-ice manifold that would be prohibitively slow for thermally-induced excitations alone.
We further speculate that it is not coincidental that Cd(CN)2 displays both correlated disorder and X-ray susceptibility, in contrast here to the well-ordered KMn[Ag(CN)2]3 which is structurally unaffected. We draw a parallel between the shallow energy surface between ice-like states in Cd(CN)2 and those of proteins. Of other reported functional materials with unusual responses to X-rays many show either correlated disorder or some magnetic or electronic instability.9,11,12,15,18,22,46 X-ray irradiation melts the charge order in the colossal magnetoresistance material Pr0.7Ca0.3MnO3 and induces an insulator–metal transition.9 A similar reduction in resistivity is observed in the spinel CuIr2S4 where X-ray irradiation disorders the lattice dimerisation pattern, preserving the orientation of the dimers whilst destroying the translational long-range order.12 These are but two examples, but the prospect of post-synthetic control of correlated disorder states and the desired properties deserves further systematic attention, particularly the idea that in this way we may access states that are inaccessible by temperature(/pressure) alone.
3.5 The true thermal expansion coefficient for cadmium cyanide
That X-ray irradiation should lead to contraction of the unit cell may help explain previous experimental discrepancies in the reported values of the thermal expansion coefficient by a factor of two (αV = −61.2(12) MK−1 in ref. 26 or αV = −36.3(19) MK−1 in ref. 30): the observed effects will have included contributions from both NTE and NXE at once. Numerous factors will affect the measured value of αV, including the rate and spacing of measurements as well as the direction of measurements with temperature; if measured on heating, for example, one might expect αV to be larger as the compound effects of NXE and NTE lead to a larger-than-expected contraction of the unit cell. Therefore we resolved to determine a NXE-free thermal expansion coefficient for Cd(CN)2, also extending our measurements over a broader temperature range than that used in previous studies. We measured X-ray diffraction patterns on heating between 150 K and 750 K, with the sample translated for each temperature point to irradiate a pristine Cd(CN)2 sample. The sample showed no signs of decomposition; Cd(CN)2 is stable up to at least 750 K. The lattice parameters were obtained via Pawley refinements and αV obtained using linear strain calculations as implemented in PASCal [see ESI† for fits to data].47 These data are plotted as crosses in Fig. 4(A) and the resulting thermal expansion coefficient for minimal X-ray exposure determined to be αV = −55(2) MK−1. Also plotted in Fig. 4(A) are data from ref. 26, 30 and 31 for comparison; note the variation in slopes, which may be attributable to NXE contributions to the apparent thermal expansion behaviour.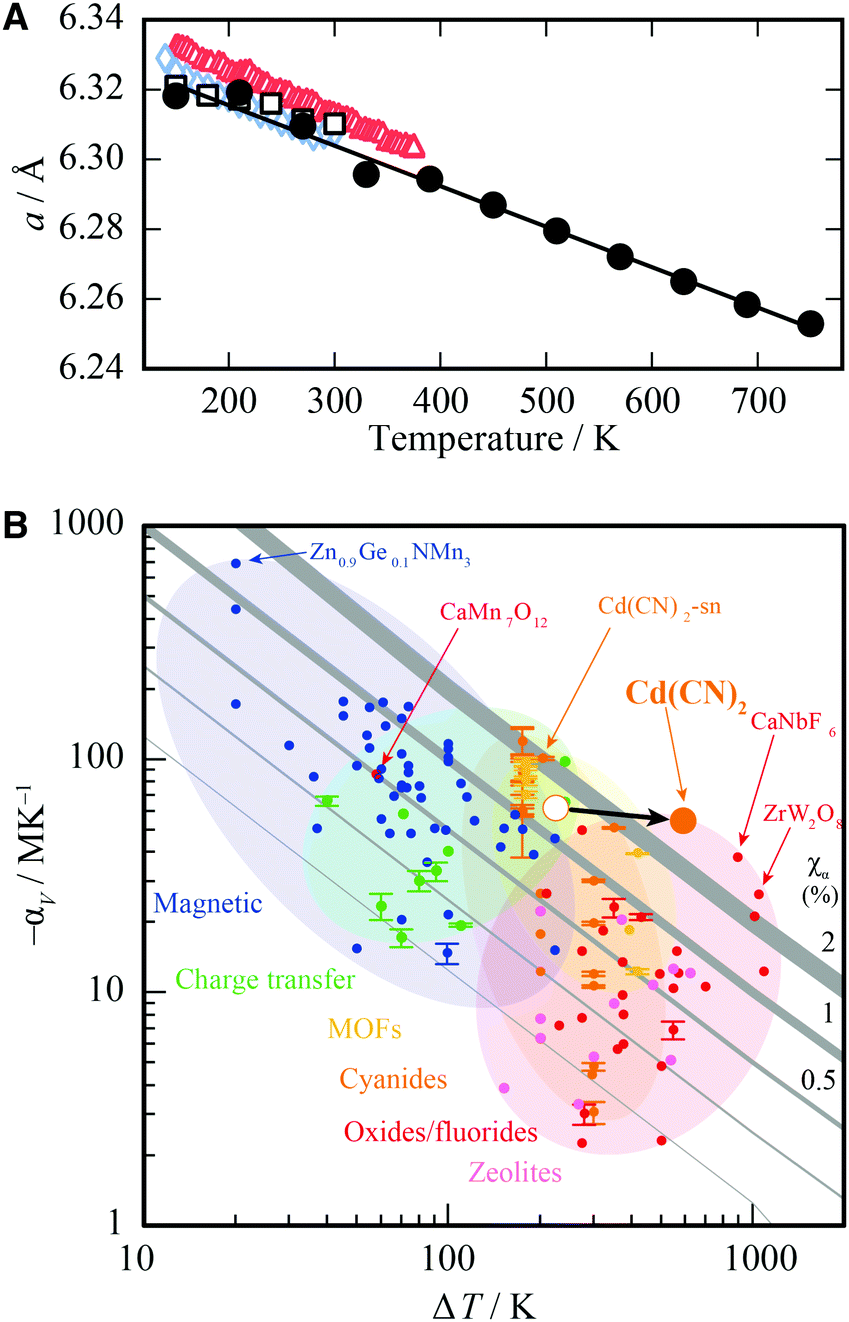 | ||
| Fig. 4 (A) The cubic lattice parameter, a, of cadmium cyanide collected on heating between 150 K and 750 K for minimal X-ray irradiation, shown as black circles (errors are smaller than the circles). Previously reported data are included for comparison to illustrate the concomitant effects of thermal expansion and X-ray expansion, shown as red triangles (ref. 26), black squares (ref. 30) and blue diamonds (ref. 31) The NXE-minimised thermal expansion coefficient is αV = −55(2) MK−1. (B) The Ashby plot of ref. 48 comparing the magnitudes and temperature ranges of NTE for different families of materials, where the NTE capacity χα = ΔV/V is maximised in the top right corner. The new value of αV reported here places Cd(CN)2 alongside CaNbF6 as the material with the largest NTE capacity. | ||
We turn now to discuss the newly revised value of αV and the extended temperature range over which Cd(CN)2 displays NTE. Cadmium cyanide is most studied in the context of negative thermal expansion materials. Typically NTE materials can be divided into two main classes depending on the mechanism by which NTE is enabled.48 The first class, to which Cd(CN)2 belongs, consists of materials in which NTE is driven by low-energy, volume-reducing phonons and is characterised by modest thermal expansion coefficients (αV ∼−20 MK−1) over extended temperature ranges sometimes spanning hundreds of Kelvin. The second class is one in which NTE is driven by an electronic or magnetic instability; such materials have colossal values of αV up to values above −400 MK−1, this time over a more limited temperature range O(∼10 K). Cadmium cyanide is remarkable both for the magnitude of its isotropic NTE, but also for the temperature range over which this NTE is maintained. In ref. 48 we collated NTE data for a large number of isotropic NTE materials in order to compare the different systems according to their NTE capacity, χα, where χα = ΔV/V = −αVΔT, in an effort to help the materials scientist categorise and select a particular type of NTE material for a given application. These data are reproduced in Fig. 4B with the position of Cd(CN)2 updated with the results reported here (χα = 3.3%). It now joins the small group of materials, including CaNbF6 and the canonical ZrW2O8 with capacities greater than 2%.49–52
4 Conclusion
To conclude, X-ray radiation has a profound impact on the structure and dynamics of Cd(CN)2, including negative X-ray expansion, phase selectivity and hysteresis effects, depending on the thermal and radiation history. These observations are able to explain previous disagreements in the thermal expansion coefficient, α. We determine the true NXE-free αV = −55(2) MK−1, and demonstrate that Cd(CN)2 displays NTE over a large temperature range of 600 K between 150 K and 750 K. The true range may well be higher; our measurements did not extend beyond 750 K, but Cd(CN)2 had not decomposed by that temperature.The observations made here for Cd(CN)2 form part of a broader collection of X-ray-induced effects in functional materials. Whilst ‘radiation damage’ appears to be universal in macromolecular systems, this is not the case for inorganic materials. It could be argued that the observation of X-ray-induced functionality in inorganic systems is often serendipitous, with important ramifications: for some materials the structural behaviour, and therefore interpretations, are influenced by X-rays but the effects attributed to other stimuli. So in the first instance we would like to understand how to minimise X-ray induced effects such that the intrinsic structural behaviour can be studied.
There remain many open questions: the precise mechanism by which X-rays interact with the structure of cadmium cyanide is unclear. Indeed, why are some materials susceptible to X-ray exposure and others not? In this study for example, KMn[Ag(CN)2]3 was unaffected by radiation under the same conditions as Cd(CN)2. Both are flexible, cyanide-containing materials, but Cd(CN)2 is extremely sensitive to radiation and KMn[Ag(CN)2]3 is not. Simultaneous spectroscopy and X-ray studies will prove valuable in this regard: UV-Vis measurements to ascertain whether radical formation plays a role; in situ Raman or IR spectroscopy to probe changes in bonding with irradiation; EXAFS measurements to understand the effect on local coordination, amongst other techniques. Persistent X-ray-induced effects might also be analysed offline with the above methods, as well as further (113Cd) NMR or neutron scattering measurements. Moreover there is scope for systematic studies—reminiscent of those conducted in macromolecular crystallography, albeit on single crystals as opposed to polycrystalline samples—on the effect of dose, dose rate, X-ray energy, flux, beam-size and temperature. As our understanding of material–X-ray interactions improves, we can start to use X-ray radiation as a design tool in its own right (as opposed to simply a diagnostic one); recent experiments in the X-ray lithography of Metal–Organic framework (MOF) thin films are an exciting new application in that space.53 The systematic studies employed here to identify the negative X-ray expansion in cadmium cyanide are an important starting point.
Conflicts of interest
There are no conflicts to declare.Acknowledgements
The synchrotron diffraction measurements were carried out at the Diamond Light Source (I11 Beamline). We are extremely grateful for the award of a Block Allocation Grant (EE18786) and beamtime EE17375. The authors are grateful to Arkadiy Simonov (Zurich) for useful discussions and to Simon Cassidy and Daniel Woodruff (Oxford) for assistance with X-ray diffraction measurements. This research was funded by the Leverhulme Trust (Grant RPG-2015-292) and the ERC Grant COMPLEXORDER (788144). This project has received funding from the European Union Horizon 2020 research and innovation program under the Marie-Sklodowska-Curie grant agreement 641887 (DEFNET).References
- E. F. Garman, Acta Crystallogr., Sect. D: Biol. Crystallogr., 2010, 66, 339–351 CrossRef CAS.
- C. C. F. Blake and D. C. Phillips, Proceedings of the Symposium on the Biological Effects of Ionizing Radiation at the Molecular Level, Int. Atomic Energy Agency, Vienna, 1962, pp. 183–191 Search PubMed.
- J. R. Helliwell, J. Cryst. Growth, 1988, 90, 259–272 CrossRef CAS.
- J. Christensen, P. N. Horton, C. S. Bury, J. L. Dickerson, H. Taberman, E. F. Garman and S. J. Coles, IUCrJ, 2019, 6, 703–713 CrossRef CAS.
- L. C. F. Morgan, Y. Kim, J. N. Blandy, C. A. Murray, K. E. Christensen and A. L. Thompson, Chem. Commun., 2018, 54, 9849–9852 RSC.
- M. Pravica, L. Bai, D. Sneed and C. Park, J. Phys. Chem. A, 2013, 117, 2302–2306 CrossRef CAS.
- D. Goldberger, E. Evlyukhin, P. Cifligu, Y. Wang and M. Pravica, J. Phys. Chem. A, 2017, 121, 7108–7113 CrossRef CAS.
- E. Evlyukhin, E. Kim, D. Goldberger, P. Cifligu, S. Schyck, P. F. Weck and M. Pravica, Phys. Chem. Chem. Phys., 2018, 20, 18949–18956 RSC.
- V. Kiryukhin, D. Casa, J. P. Hill, B. Keimer, A. Vigliante, Y. Tomioka and Y. Tokura, Nature, 1997, 386, 813–815 CrossRef.
- D. E. Cox, P. G. Radaelli, M. Marezio and S.-W. Cheong, Phys. Rev. B, 1998, 57, 3305–3314 CrossRef CAS.
- V. Kiryukhin, Y. J. Wang, F. C. Chou, M. A. Kastner and R. J. Birgeneau, Phys. Rev. B, 1999, 59, R6581–R6584 CrossRef CAS.
- H. Ishibashi, T. Y. Koo, Y. S. Hor, A. Borissov, P. G. Radaelli, Y. Horibe, S.-W. Cheong and V. Kiryukhin, Phys. Rev. B, 2002, 66, 144424 CrossRef.
- M. Pravica, D. Popov, S. Sinogeikin, D. Sneed, G. Guardala and Q. Smith, Appl. Phys. Lett., 2013, 103, 224103 CrossRef.
- C. Chen, J.-K. Sun, Y.-J. Zhang, X.-D. Yang and J. Zhang, Angew. Chem., 2017, 129, 14650–14654 CrossRef.
- D. Papanikolaou, S. Margadonna, W. Kosaka, S.-I. Ohkoshi, M. Brunelli and K. Prassides, J. Am. Chem. Soc., 2006, 128, 8358–8363 CrossRef CAS.
- K. Ishiji, M. Deguchi, N. Nakajima, T. Matsuda, H. Tokoro, S. Ohkoshi and T. Iwazumi, J. Phys.: Conf. Ser., 2009, 148, 012046 CrossRef.
- Y. Sekine, M. Nihei, R. Kumai, H. Nakao, Y. Murakami and H. Oshio, Chem. Commun., 2014, 50, 4050–4052 RSC.
- S. Margadonna, K. Prassides and A. N. Fitch, J. Am. Chem. Soc., 2004, 126, 15390–15391 CrossRef CAS.
- G. Susich, A. O. King and L. M. Dogliotti, Science, 1959, 130, 567–568 CrossRef CAS.
- S. H. Lapidus, G. J. Halder, P. J. Chupas and K. W. Chapman, J. Am. Chem. Soc., 2013, 135, 7621–7628 CrossRef CAS.
- R. N. Widmer, G. I. Lampronti, N. Casati, S. Farsang, T. D. Bennett and S. A. T. Redfern, Phys. Chem. Chem. Phys., 2019, 21, 12389–12395 RSC.
- Y. Feldman, V. Lyahovitskaya, G. Leitus, I. Lubomirsky, E. Wachtel, V. A. Bushuev, G. Vaughan, Z. Barkay and Y. Rosenberg, Appl. Phys. Lett., 2009, 95, 051919 CrossRef.
- Y. Kim, E. J. Mckinley, K. E. Christensen, N. H. Rees and A. L. Thompson, Cryst. Growth Des., 2014, 14, 6294–6301 CrossRef CAS.
- J. Murray and E. Garman, J. Synchrotron Radiat., 2002, 9, 347–354 CrossRef CAS.
- R. B. G. Ravelli, P. Theveneau, S. McSweeney and M. Caffrey, J. Synchrotron Radiat., 2002, 9, 355–360 CrossRef CAS.
- A. L. Goodwin and C. J. Kepert, Phys. Rev. B, 2005, 71, 140301 CrossRef.
- M. T. Dove and H. Fang, Rep. Prog. Phys., 2016, 79, 066503 CrossRef.
- B. F. Hoskins and R. Robson, J. Am. Chem. Soc., 1990, 112, 1546–1554 CrossRef CAS.
- S. i. Nishikiori, C. I. Ratcliffe and J. A. Ripmeester, Can. J. Chem., 1990, 68, 2270–2273 CrossRef.
- V. E. Fairbank, A. L. Thompson, R. I. Cooper and A. L. Goodwin, Phys. Rev. B, 2012, 86, 104113 CrossRef.
- C. S. Coates, M. Baise, A. Simonov, J. W. Makepeace, A. G. Seel, R. I. Smith, H. Y. Playford, D. A. Keen, R. Siegel, A. Schmutzler, J. Senker, B. Slater and A. L. Goodwin, 2019, arXiv:1904.05749.
- J. W. Zwanziger, Phys. Rev. B, 2007, 76, 052102 CrossRef.
- P. Ding, E. J. Liang, Y. Jia and Z. Y. Du, J. Phys.: Condens. Matter, 2008, 20, 275224 CrossRef.
- A. A. Coelho, TOPAS-Academic, version 4.1 (Computer Software), 2007 Search PubMed.
- E. Shugam and H. Zhdanov, Acta Physiochim, URSS, 1945, vol. 20, pp. 247–252 Search PubMed.
- J.-L. Kuo, J. V. Coe, S. J. Singer, Y. B. Band and L. Ojamäe, J. Chem. Phys., 2001, 114, 2527–2540 CrossRef CAS.
- J. M. Holton, J. Synchrotron Radiat., 2009, 16, 133–142 CrossRef CAS.
- O. Carugo and K. D. Carugo, Trends Biochem. Sci., 2005, 30, 213–219 CrossRef CAS.
- A. B. Cairns, A. L. Thompson, M. G. Tucker, J. Haines and A. L. Goodwin, J. Am. Chem. Soc., 2012, 134, 4454–4456 CrossRef CAS.
- M. Witala, J. Han, A. Menzel and K. Nygård, J. Appl. Crystallogr., 2014, 47, 2078–2080 CrossRef CAS.
- E. H. Snell, H. D. Bellamy, G. Rosenbaum and M. J. van der Woerd, J. Synchrotron Radiat., 2007, 14, 109–115 CrossRef CAS.
- O. B. Zeldin, M. Gerstel and E. F. Garman, J. Appl. Crystallogr., 2013, 46, 1225–1230 CrossRef CAS.
- C. S. Bury, J. C. Brooks-Bartlett, S. P. Walsh and E. F. Garman, Protein Sci., 2018, 27, 217–228 CrossRef CAS.
- J. C. Brooks-Bartlett, R. A. Batters, C. S. Bury, E. D. Lowe, H. M. Ginn, A. Round and E. F. Garman, J. Synchrotron Radiat., 2017, 24, 63–72 CrossRef CAS.
- M. Weik, R. B. Ravelli, G. Kryger, S. McSweeney, M. L. Raves, M. Harel, P. Gros, I. Silman, J. Kroon and J. L. Sussman, Proc. Natl. Acad. Sci. U. S. A., 2000, 97, 623–628 CrossRef CAS.
- H. L. B. Boström, A. B. Cairns, L. Liu, P. Lazor and I. E. Collings, Dalton Trans., 2020, 49, 12940–12944 RSC.
- M. J. Cliffe and A. L. Goodwin, J. Appl. Crystallogr., 2012, 45, 1321–1329 CrossRef CAS.
- C. S. Coates and A. L. Goodwin, Mater. Horiz., 2019, 6, 211–218 RSC.
- J. C. Hancock, K. W. Chapman, G. J. Halder, C. R. Morelock, B. S. Kaplan, L. C. Gallington, A. Bongiorno, C. Han, S. Zhou and A. P. Wilkinson, Chem. Mater., 2015, 27, 3912–3918 CrossRef CAS.
- B. R. Hester, J. C. Hancock, S. H. Lapidus and A. P. Wilkinson, Chem. Mater., 2017, 29, 823–831 CrossRef CAS.
- J. S. O. Evans, T. A. Mary, T. Vogt, M. A. Subramanian and A. W. Sleight, Chem. Mater., 1996, 8, 2809–2823 CrossRef CAS.
- T. A. Mary, J. S. O. Evans, T. Vogt and A. W. Sleight, Science, 1996, 272, 90–92 CrossRef CAS.
- M. Tu, B. Xia, D. E. Kravchenko, M. L. Tietze, A. J. Cruz, I. Stassen, T. Hauffman, J. Teyssandier, S. De Feyter, Z. Wang, R. A. Fischer, B. Marmiroli, H. Amenitsch, A. Torvisco, M. D. J. Velásquez-Hernández, P. Falcaro and R. Ameloot, Nat. Mater., 2021, 20, 93–99 CrossRef CAS.
Footnote |
| † Electronic supplementary information (ESI) available. See DOI: 10.1039/d0mh01989e |
| This journal is © The Royal Society of Chemistry 2021 |