
 Open Access Article
 This Open Access Article is licensed under a Creative Commons Attribution-Non Commercial 3.0 Unported Licence
Nanorheology of living cells measured by AFM-based force–distance curves†
Pablo D.
Garcia‡
,
Carlos R.
Guerrero‡
and
Ricardo
Garcia
 *
*
Instituto de Ciencia de Materiales de Madrid, CSIC, c/ Sor Juana Inés de la Cruz 3, 28049 Madrid, Spain. E-mail: r.garcia@csic.es
First published on 15th April 2020
Abstract
Mechanobiology aims to establish functional relationships between the mechanical state of a living a cell and its physiology. The acquisition of force–distance curves with an AFM is by far the dominant method to characterize the nanomechanical properties of living cells. However, theoretical simulations have shown that the contact mechanics models used to determine the Young's modulus from a force–distance curve could be off by a factor 5 from its expected value. The semi-quantitative character arises from the lack of a theory that integrates the AFM data, a realistic viscoelastic model of a cell and its finite-thickness. Here, we develop a method to determine the mechanical response of a cell from a force–distance curve. The method incorporates bottom-effect corrections, a power-law rheology model and the deformation history of the cell. It transforms the experimental data into viscoelastic parameters of the cell as a function of the indentation frequency. The quantitative agreement obtained between the experiments performed on living fibroblast cells and the analytical theory supports the use of force–distance curves to measure the nanorheological properties of cells.
1. Introduction
The atomic force microscope (AFM) has found a variety of applications in molecular and cell biology.1 Those applications range from the generation of sub-200 nm spatial resolution maps of the stiffness of mammalian cells2–5 to the sub-5 nm mapping of the flexibility of single proteins6 or the time-resolved imaging of protein interactions and processes.7Several AFM experiments have shown a correlation between the local stiffness of a cell with its physiological and/or pathological state.2,8–19 In general, AFM studies are strengthening our understanding of the role of mechanical properties in cell development, differentiation and physiology.
AFM methods such as force-volume,20 AFM-based microrheology,21 strain22 and creep relaxation23 or multifrequency24,25 have been applied to characterize the mechanical response of cells. Force-volume is by far the most common AFM-based method to generate spatially-resolved stiffness maps of cells.1,3,20,26–28
Force-volume is based on the acquisition of force–distance curves (FDC) (approach and retraction sections) on each point of the cell surface.1,20 The force–distance curve obtained by approaching the tip towards the surface (approach) might differ from the curve obtained during tip's withdrawal (retraction). In the following a FDC always includes approach and retraction sections.
AFM measurements require to culture a cell on a solid support. Common solid supports are made of glass, plastic or very thin mica layers. Those supports are far more stiffer than a mammalian cell is. For example, the Young's modulus of a glass cover slip is about 50 GPa while the Young's modulus of a fibroblast cell is about 1 kPa. This is, a mammalian cell is about seven orders of magnitude softer than the solid support. The effect of this Young's modulus mismatch on the force measured in a FDC experiment is enhanced by the finite-thickness of cell (2–15 μm).
The combination of the cell's softness, its finite-thickness and the rigidity of solid support has given rise to the bottom-effect artefact during the acquisition of a FDC.29–32 This artefact makes cells to appear stiffer than they are. This effect, if it is not corrected, introduces significant quantitative errors in the determination of the Young's modulus of a cell.31
Chadwick and co-workers were the first to point out that the force applied by an AFM probe on an adherent cell resting on a rigid support is influenced by the stiffness of the solid support.29,30 The first bottom-effect correction was deduced for an elastic material indented by an spherical probe.29 Bottom-effect corrections have been generalized to any axisymmetric probes.31 Ros and co-workers have developed an approximate bottom-effect correction for the determination of the Young's modulus that is valid for rigid and soft supports.32
A bottom-effect correction theory gives the force as a series of terms that depend on the indentation, contact area and cell's thickness. Bottom-effect correction models have been validated by using finite element model simulations on elastic materials.31,32 However, an earlier bottom-effect correction model developed for a conical tip acting on an elastic material30 fails to agree with the simulations and other models.31,32
Living cells show a variety of viscoelastic phenomena which remain insufficiently understood.33–47 This lack of understanding has fundamental and practical implications. The accuracy of Young's modulus measurements determined without considering viscoelastic effects is highly questionable. Finite element method simulations have shown that the Young's modulus of a viscoelastic material deduced by using an elastic contact mechanics model could be off by a factor 5 from its expected value.43 The incertitudes associated with the calibration of the force constant or the determination of the contact point have been minimized by the using some standardized calibration protocols.47–49
In a previous contribution we have proposed a bottom-effect correction model for a 3D Kelvin–Voigt (kV) viscoelastic material.43 The 3D-KV model was based on using the contact area determined from Hertz's contact mechanics. It has been established that Hertz's model overestimates the contact area for a viscoelastic material during the tip's retraction.43 Therefore, Garcia and Garcia model43 is only valid to determine mechanical properties during the approach section of a FDC.
Raman and co-workers50 applied a simplified version of the correspondence principle to combine Dimitriadis et al. bottom-effect correction29 into Ting's model.51,52 Their approach enables to calculate numerically the force versus the indentation for the approach and retraction sections of the FDC. The validity of Raman's method remains to be demonstrated. Janshoff and co-workers incorporated Ting's considerations into a model to determine viscoelastic parameters from a FDC.53 Janshoff's model does not include bottom-effect corrections.
Here, we develop an analytical method to transform force–distance curves into the intrinsic viscoelastic parameters of a finite-thickness living cell deposited on a rigid support. The method is based on the application of the correspondence principle between elastic and viscoelastic deformations, Ting's method to determine the force as a function of the deformation history and bottom-effect correction algorithms.
The method provides, for a conical probe, an analytical equation of the force as a function of the indentation. The method is valid for the approaching and retraction sections of a FDC. The theory has been deduced for several viscoelastic models, in particular, power-law rheology. The comparison between the theory and the experiments performed on fibroblast cells leads to three relevant results. First, we provide an analytical method to transform force–distance curves into nanorheological properties of cells. Second, a power-law rheology model describes quantitatively the viscoelastic properties of a single living cell under time-varying compressive forces up to 5 kHz. Third, sharper tips are less prone to bottom-effect artefacts than blunter tips.
2. Theory of force–distance curves for finite-thickness viscoelastic materials
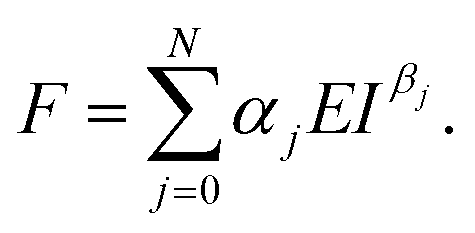
Fig. 1a shows a model to describe an AFM experiment performed on a cell resting on a rigid support. The cells is modeled as a finite-thickness viscoelastic layer. The goal is to obtain analytical expressions of the force F as a function of the indentation I for the tip's approach and withdrawal from the sample. This problem is divided in three steps. The determination force–distance curve exerted on a semi-infinite elastic medium, its extension to describe a semi-infinite viscoelastic material and the introduction finite-thickness effects.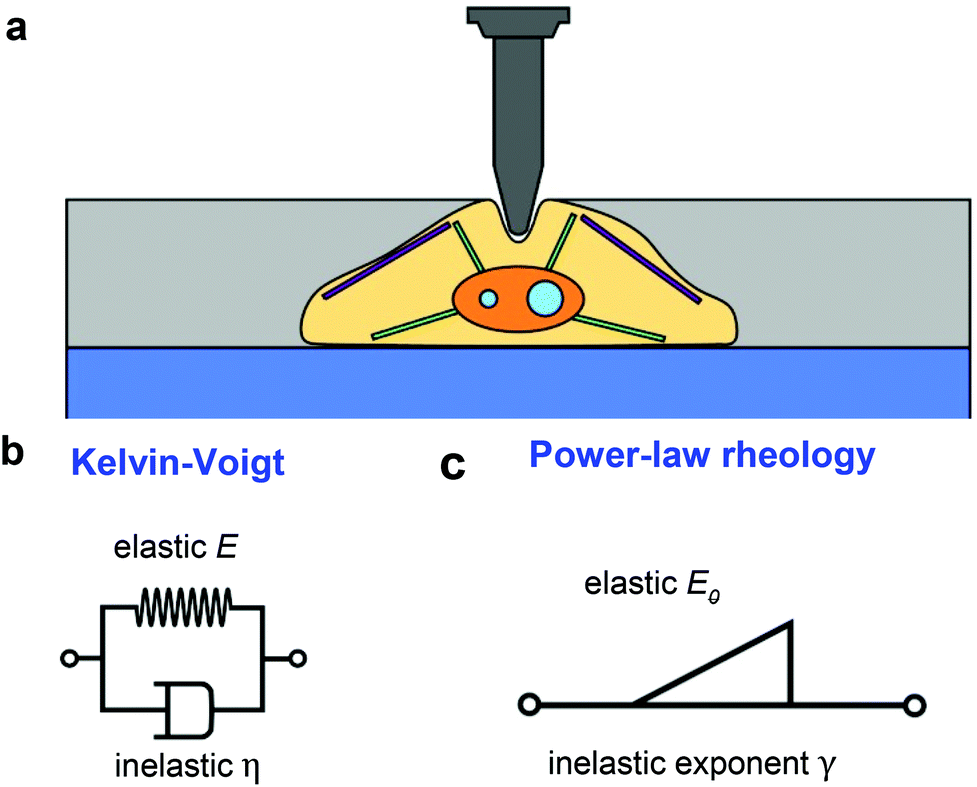 | ||
| Fig. 1 (a) Scheme of an AFM tip-cell interface. (b) Mechanical analogue of the Kelvin–Voigt model of a viscoelastic material: a spring in parallel with a dashpot. (c) Scheme of a power-law rheology model of a viscoelastic material. This model has two parameters, E0 is the apparent Young's modulus and γ parameterizes the dissipative effects; γ = 0 describes an elastic system and γ = 1 describes a Newtonian liquid. | ||
The problem concerning the determination of the force exerted by a spherical probe on a semi-infinite elastic material is quite old.54 Sneddon generalized Hertz and Boussinesq's considerations for any axisymmetric indenter55,56 with the following expression,
| F = αEIβ | (1) |
The expression of the force exerted by an axisymmetric probe on a finite-thickness and elastic material is given by31
 | (2) |
The coefficients αj and βj could depend on the geometry of the probe or indenter and on the finite-thickness of the material (cell). A description of the terms that appear in eqn (2) can be found in ref. 31.
2.1. Force–distance curves: approach
Eqn (1) and (2) describe the forces and deformations experienced by an elastic system under the application of an external load. Lee and Radok57 developed a method to transform the expression deduced for a semi-infinite elastic system into the force for its equivalent viscoelastic system. This method is known as the viscoelastic correspondence principle. Their methodology applied to eqn (2) gives a time-dependent force43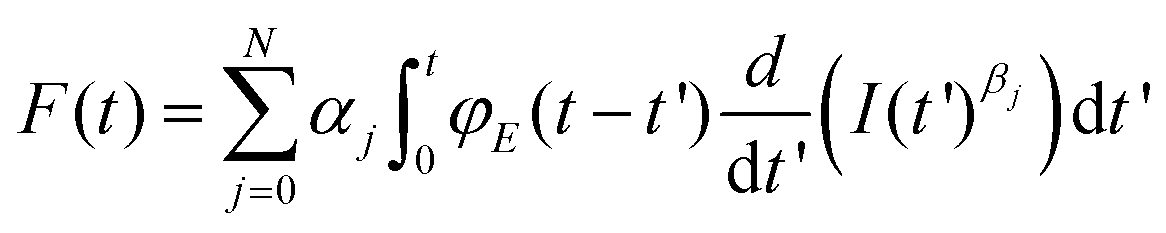 | (3) |
In what follows we consider two viscoelastic models, the Kelvin–Voigt model (kV)58 (Fig. 1b) and the power-law rheology model33 (Fig. 1c).
The relaxation function for the Kelvin–Voigt's model is given by43,58
| φKV = E + 3ηGδ(t) | (4) |
The relaxation function for the power-law rheology model (PLR) is given by33
 | (5) |
In what follows we deduce the analytical solutions of eqn (3) to determine the force exerted by a conical tip (half-angle θ) on either, KV (Fig. 1b) and PLR (Fig. 1c) finite-thickness materials. Conical tips are very common in AFM measurements performed on living cells. Therefore, this geometry does not restrict the experimental implications of the theory. We also assume that the FDCs are performed at a constant velocity v (triangular waveform) (Fig. 2).
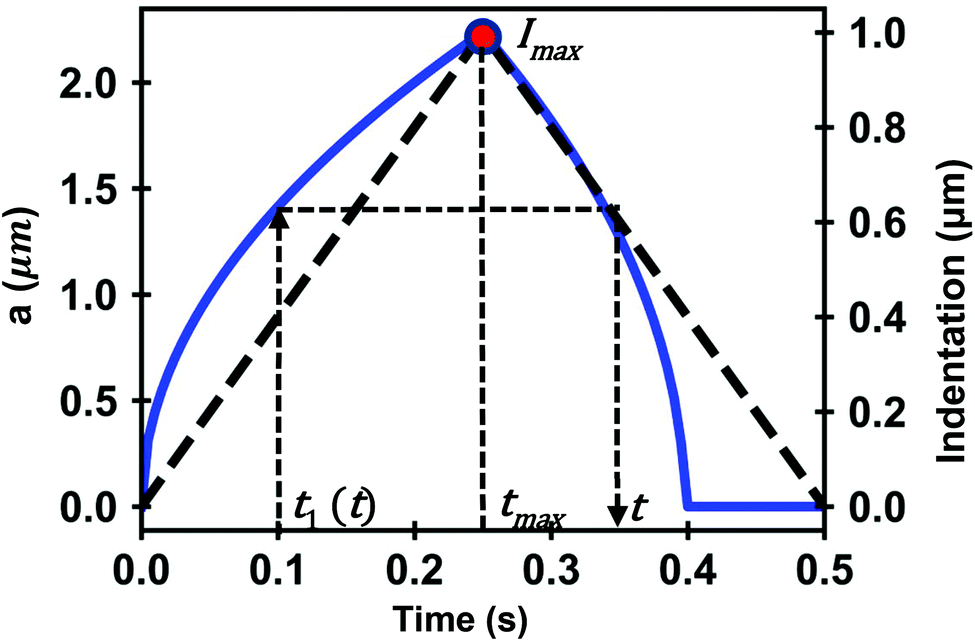 | ||
| Fig. 2 Simulation of the contact radius as a function of time on a PLR material. The dashed line (dark) shows the shape of the triangular waveform; t1 (approach) and t (retraction) are times of the FDC curve that have the same contact area; tmax is the time at which the maximum indentation is reached. Parameters of the simulation, E0 = 4 kPa, γ = 0.3, h = 6 μm and R (tip radius) = 5 μm. | ||
For a KV model it has been shown that43
 | (6) |
The combination of eqn (3) and (5) leads to an expression for the force as a function of time for a PLR material
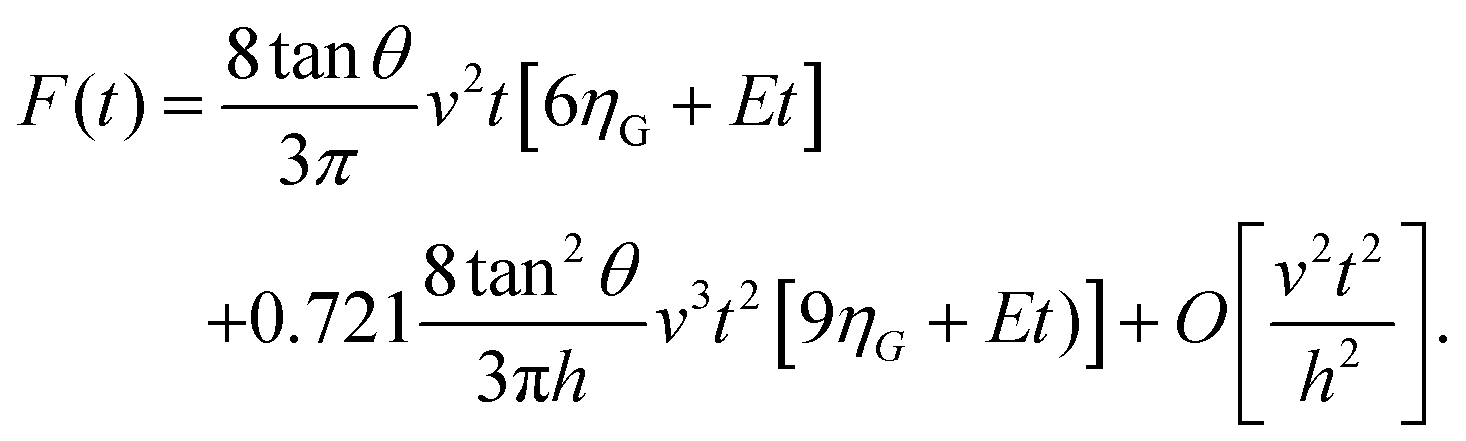
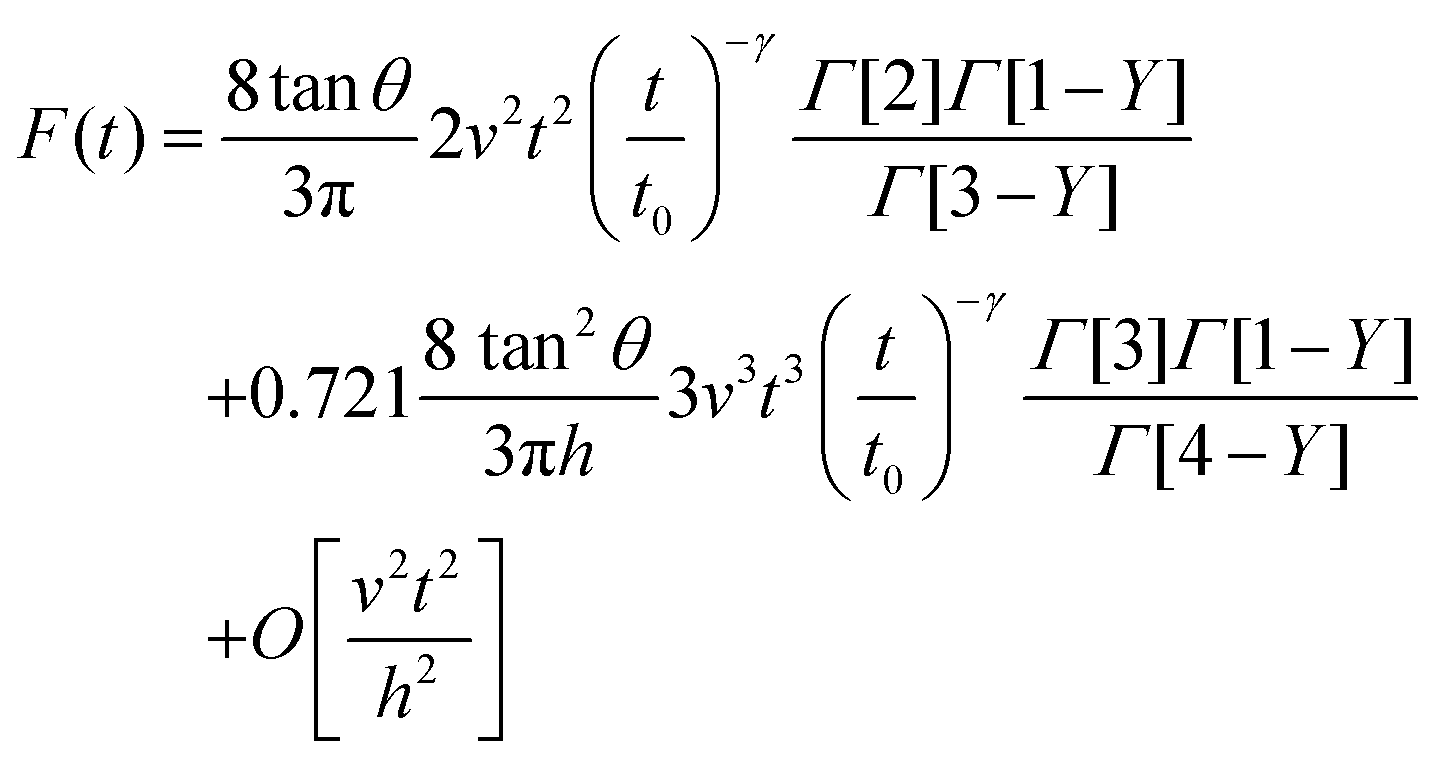 | (7) |
The above expressions show that the force depends on the finite-thickness of the cell h. The step-by-step process to deduce the above equations is described in the ESI.† We note that the above expressions are only valid to determine the force exerted by the tip during the approach, this is, for t < tmax where tmax is the time at which the maximum indentation Imax is reached (Fig. 2).
2.2. Force–distance curves: retraction
Lee and Radok's theory57 is only valid to describe an experiment where the contact area increases monotonically with time, this is, for the approach section of a FDC. Ting's method overcomes the above limitation.51,52Ting's method assumes that for a given time t of the retraction curve there is an equivalent time t1(t) in the approach curve that has the same contact area. The key feature of the method is that the force at time t can be obtained from eqn (3) by replacing the upper limit of the integral from t to t1(t). This requires to solve the integral equation which links the current time t1 with a previous time t51 (Fig. 3)
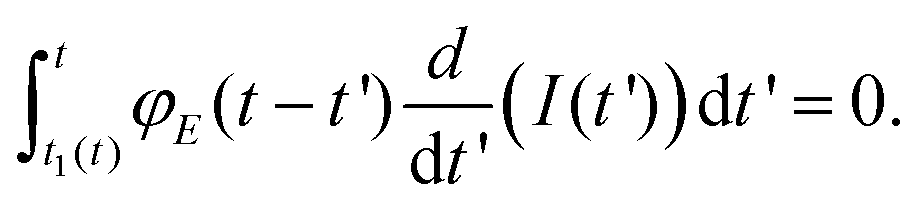 | (8) |
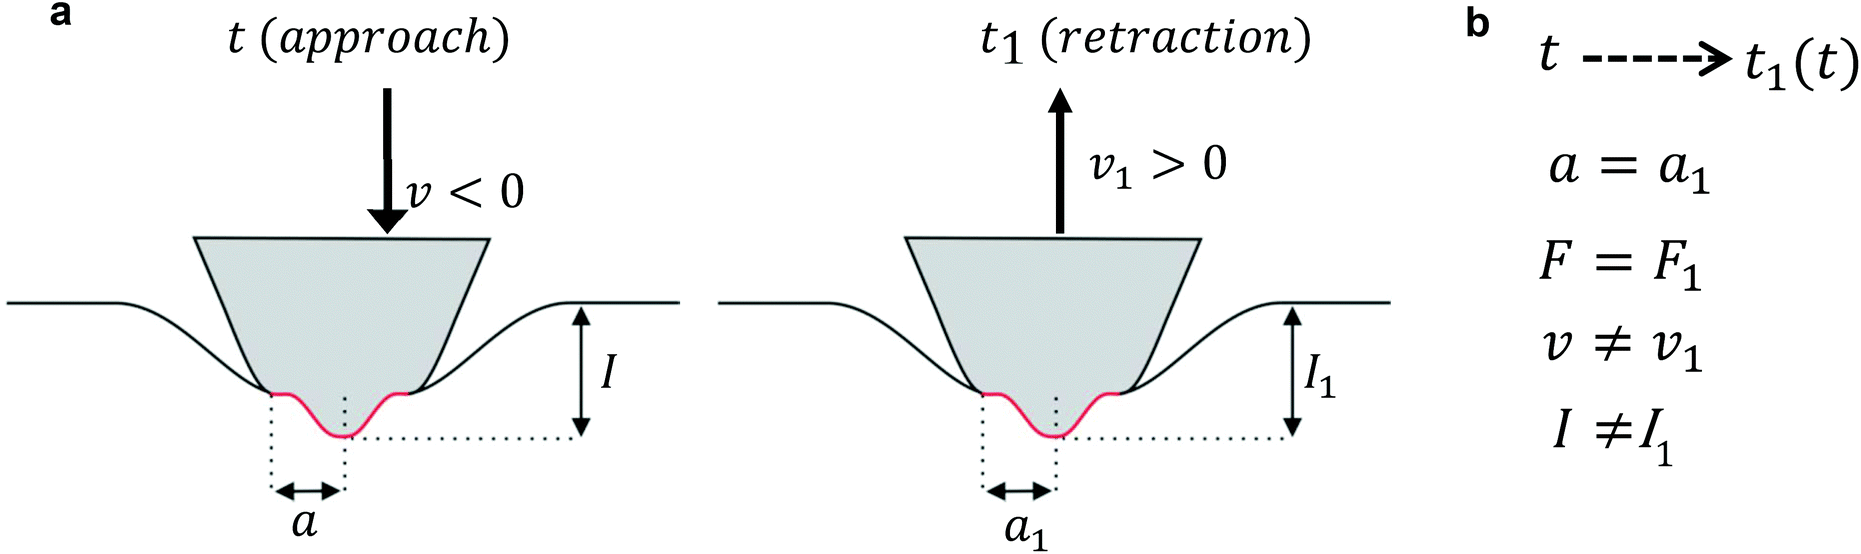 | ||
| Fig. 3 Scheme used to determine the force as a function of the indentation for a finite-thickness viscoelastic material. (a) In the left panel, the tip moves towards the cell (approach). In the right panel, the tip moves away from the cell (retraction). (b) Summary of Ting's model assumptions to determine the force as a function of the indentation while the tip's is withdrawn from the cell at a time t (retraction) based on the force measured at a previous time t1(t) during the approach. F is the force exerted on the cell, a is the contact radius, v is the velocity and I is the indentation. | ||
The above equation is valid for any geometry of the tip because it does not depend on the coefficients αj and βj. Eqn (8) can be solved for both KV and PLR relaxation functions by assuming a constant velocity during the indentation (I = vt).
For KV we deduce
| t1(t) = v(2tmax − t − τ) | (9) |
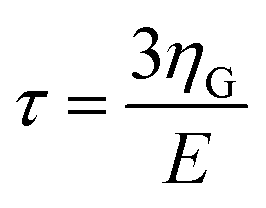 is the KV relaxation time.43
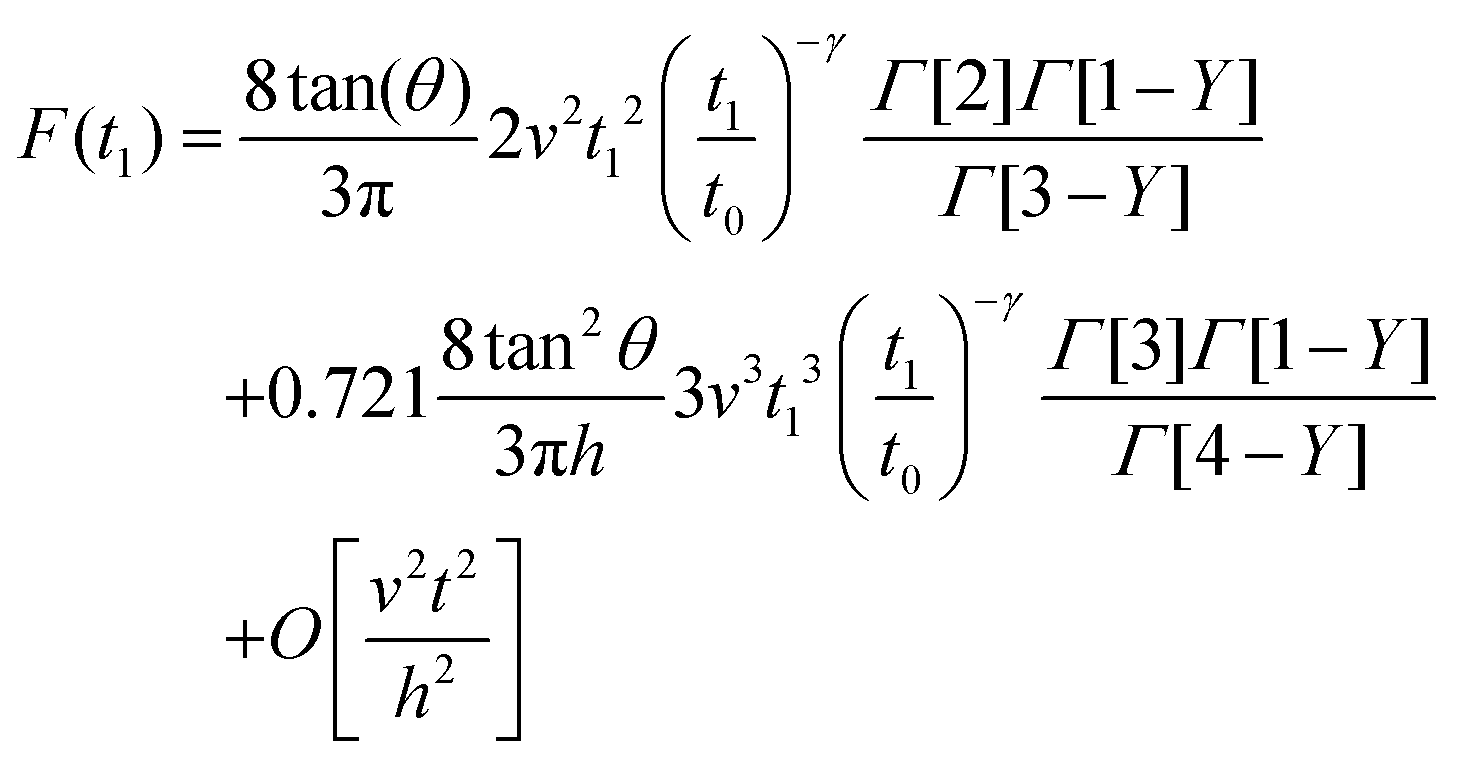
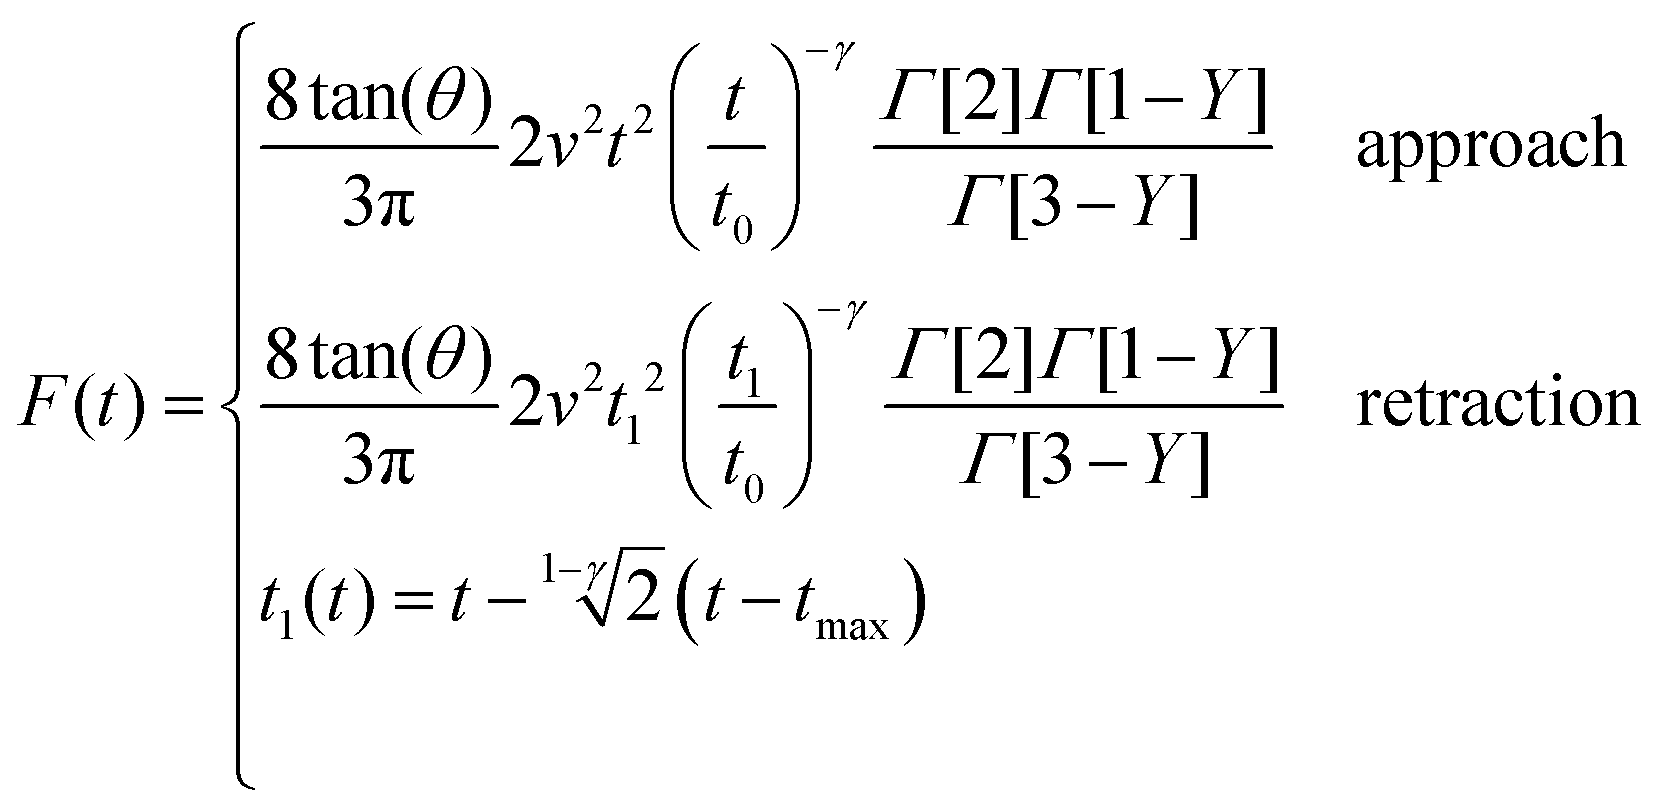
For the PLR we obtain
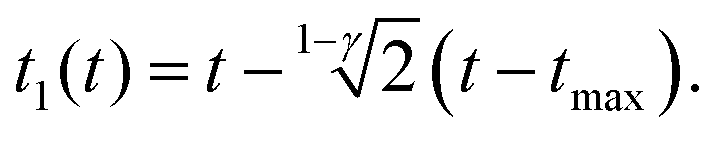 | (10) |
An alternative expression to eqn (10) was deduced in ref. 53. We note that eqn (9) and (10) do not depend on the tip's geometry nor on the sample thickness.
By integrating eqn (3) with the relaxation function (eqn (4)) and t1 given by eqn (9) we obtain the dependence of the force with the indentation while the tip is withdrawn (t > tmax) from a KV viscoelastic material,
 | (11) |
Eqn (6) (t < tmax) and 11 (t > tmax) provide the complete expression of the force (approach and retraction) as a function of the indentation for a finite-thickness KV viscoelastic material.
By integrating eqn (3) with the relaxation function (eqn (5)) and t1 given by eqn (10) we obtain the dependence of the force with the indentation while the tip is withdrawn (t > tmax) from a PLR viscoelastic material,
 | (12) |
Eqn (7) for the approach (t ≤ tmax) and eqn (12) for the retraction (t > tmax) provide the complete expression of the force as a function of the indentation for a finite-thickness PLR viscoelastic material.
3. Materials and methods
3.1. Cell culture and sample preparation
NIH 3T3 fibroblasts (Sigma-Aldrich) were cultured at 37 °C in Dulbecco's modified Eagle's medium–DMEM (Gibco Life Technologies, Paisley, UK). The medium has been supplemented with 2 mM L-glutamine (Sigma-Aldrich, Missouri, USA), 10% calf Serum–CS (Gibco Life Technologies) and 1% penicillin/streptomycin at controlled humidity (90%). The CO2 concentration is kept at 5%. The cell culture process was carried out in a 60 mm Petri dish (Thermo Fisher Scientific, Massachusetts, USA). The cells were extracted from the incubator after reaching an approximately 50% confluence of cells. At this point, the initial cell culture medium was exchanged by Leibobitz's L-15 medium (Thermo Fisher Scientific) in order to maintain the pH at a value of 7.4–7.7 during the AFM experiments.3.2. AFM-based force–distance curves
AFM measurements were performed in a commercial instrument, JPK NanoWizard 3 (JPK Instruments AG, Berlin, Germany), mounted on an Axio Observer D1 inverted microscope (Carl Zeiss, Oberkochen, Germany). The measurements were performed on living cells in the aforementioned buffer. The temperature was kept constant at 37° by using a temperature controller (BioCell™, JPK Instruments AG).We have used AC40TS cantilevers (Bruker, Camarillo, CA, USA) with a nominal spring constant of 0.09 N m−1 and a conical tip shape with an estimated half-opening angle of 18°. In order to obtain reliable and quantitative data from the AFM experiments, the cantilever spring constant k was calibrated by using the thermal tuning method. This method is implemented in the software of the microscope.
The tip–sample distance was modulated by applying a triangular waveform. This implies that the velocity of the tip is constant except at the turning points. The force–distance curves were taken by using a closed-loop feedback circuit in the z-piezo axis. The piezo z-displacement was readjusted with a capacitive sensor. The FDC were obtained by applying a maximum force of 3.0 nN. The total piezo displacement was set at 5 μm while the maximum indentation was between 1 and 2 μm. The baseline region far from the cell surface was used to determine the contact point. The tip-cell contact point was determined by using the ratio of variances method. The cell's thickness h (distance between the upper surface of the cell and the rigid substrate) was determined from an AFM topography image of the cell acquired before the FDC data.
The experimental force–distance curves were obtained on a region of 10 × 10 μm2 located on the central part of the cell. The region was divided in 64 sub-regions and a FDC was measured on each sub-region. The measurements were repeated on 20 cells. Data sampling rate was set at 5 kHz for the 10 μm s−1 experiments. It was increased linearly with the tip velocity to reach 150 kHz for the 300 μm s−1 experiments.
4. Results and discussion
4.1. Mechanical model of a living cell
Several FDC experiments have revealed that the approach and retraction sections of force–distance curves performed on mammalian cells do not overlap.3,41,50 The hysteresis observed in a FDC is either a consequence the existence of energy-dissipation processes inside a material59,60 or produced by the breaking of the plasma membrane. Force–distance curves acquired sequentially on a single cell are very reproducible,3,41 therefore, we conclude that the hysteresis is dominated by dissipative processes occurring inside the cell.Fig. 4 shows a comparison among an experimental curve obtained on a fibroblast (NIH 3T3) and the corresponding curves obtained by using, respectively, the KV and PLR models. The experiment was performed on a single position of the cell above the nucleus. Fig. 4a shows the dependence of the force on time and Fig. 4b on indentation. The transformation from a force-time curve to a force–distance curve is straightforward once the parameters of the waveform that modulates the tip-cell distance are known (Fig. 4a). The experimental curve was fitted to KV (E = 1614 Pa, η = 25 Pa s) and PLR (E0 = 572 Pa, γ = 0.42) models. In both cases, a conical tip with a half-angle of θ = 18° was used The PLR model reproduces very well both sections of the FDC. The KV model gives a good fitting during the approach but it fails to reproduce the retraction section of the FDC. The force shows a jump discontinuity when the tip reaches the maximum indentation and the direction of the velocity is reversed (retraction). This result is an artefact of the KV model because in this model where the viscous force is proportional to the velocity. At I = Imax the velocity changes sign which causes the jump discontinuity. It indicates that the KV model is unsuitable to describe the retraction section of a FDC. In addition, the KV model cannot describe stress relaxation processes. Therefore, in the following sections, the discussion is focused on presenting the results obtained by using the PLR model.
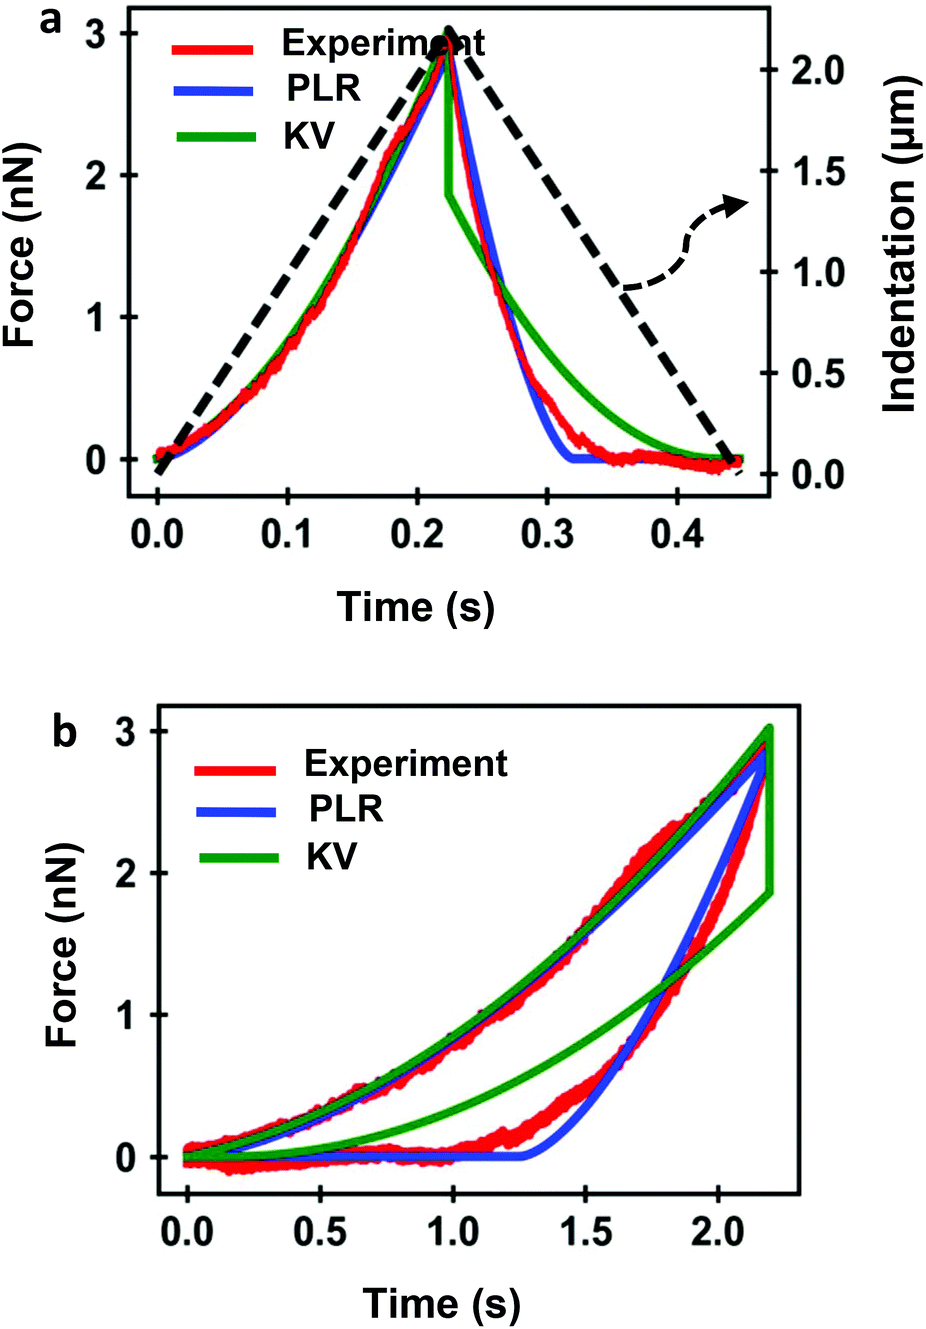 | ||
| Fig. 4 (a) Experimental force-time curve obtained on a living NIH 3T3 fibroblasts (red). The PLR (blue) and KV (green) are the theoretical curves. The indentation is plotted as a dashed line. The tip velocity was 10 μm s−1. (b) Corresponding force–distance curve. Parameters PLR, E0 = 572 Pa, γ = 0.42; parameters KV, E0 = 1614 Pa, η = 25 Pa s; the cell's thickness is measured experimentally, h = 6.2 μm. | ||
4.2. Nanorheology of living cells from force–distance curves
Fig. 5 shows the experimental and theoretical FDCs obtained by varying the tip's speed from 10 μm s−1 to 300 μm s−1. In these experiments, tip-cell contact times range from 8 ms (300 μm s−1) to 500 ms (10 μm s−1). For all the tip's velocities, the quantitative agreement obtained between experiment and theory is excellent for both approach and retraction sections. The experimental FDCs are fitted to the constitutive equations (eqn (7) and (12)) to determine the viscoelastic parameters of the cell. The agreement is quite remarkable because the PLR model has just two fitting parameters, the apparent Young's modulus and the exponent. The agreement supports the validity of the analytical bottom-effect theory and the PLR model to describe the properties of NIH 3T3 fibroblasts.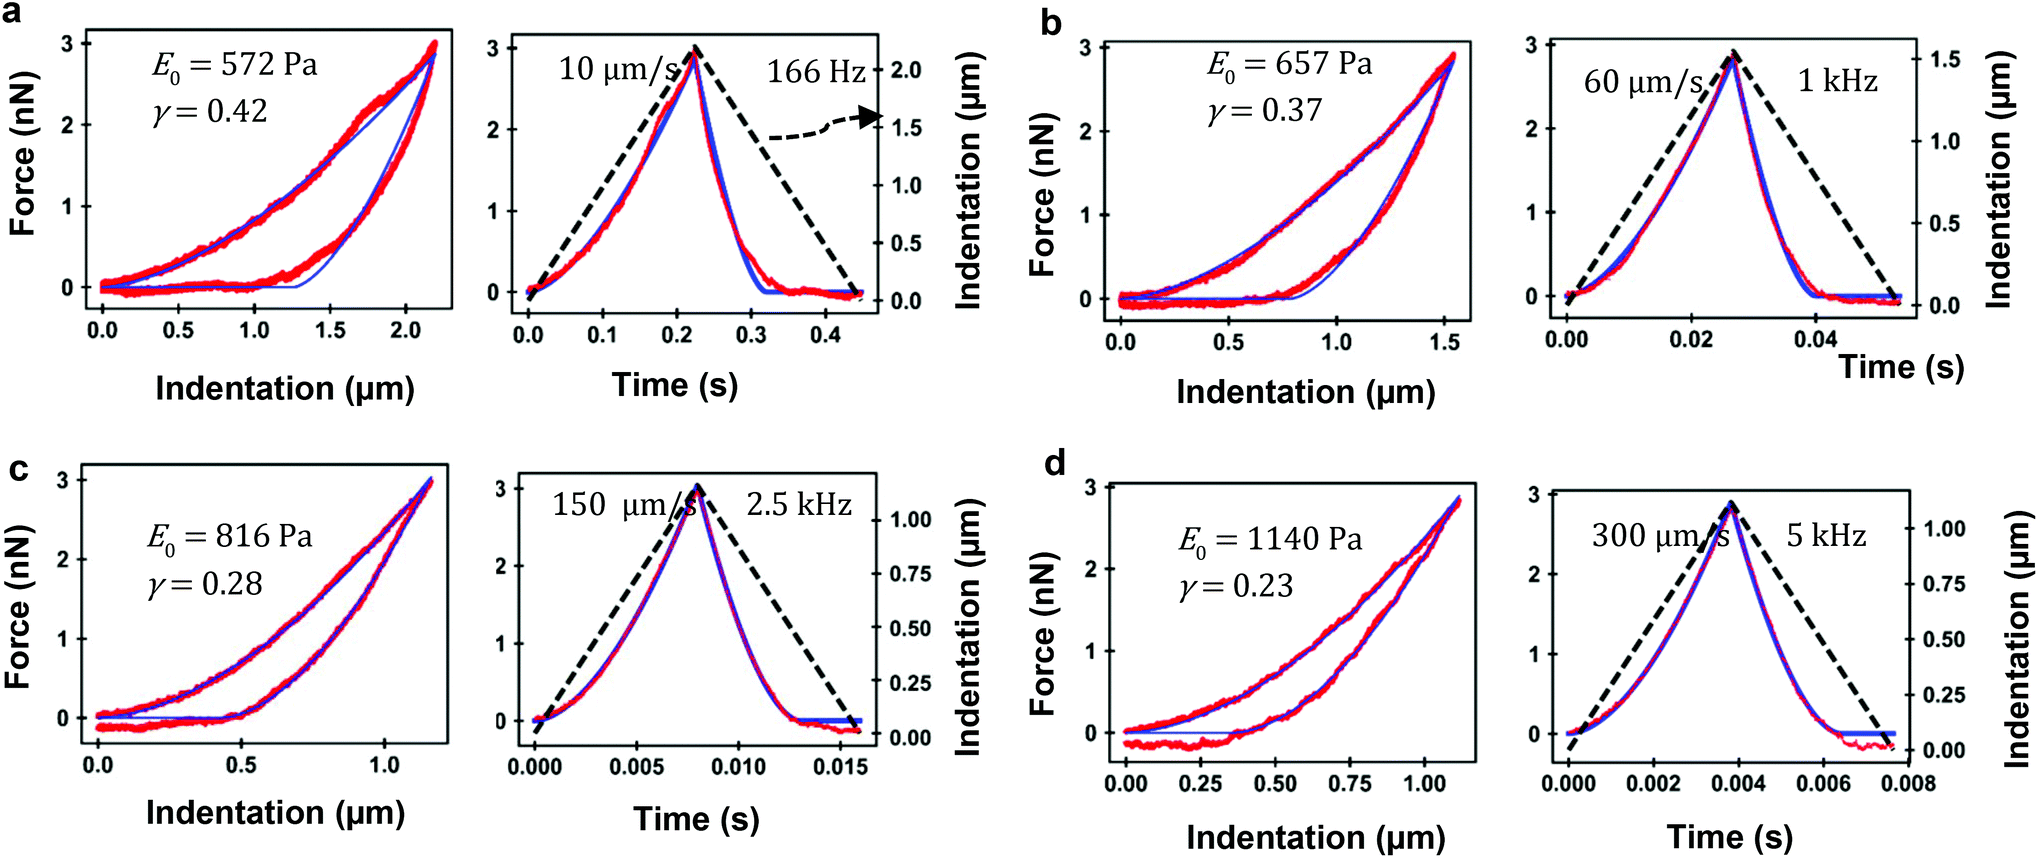 | ||
| Fig. 5 FDC-based microrheology. (a) Force–distance (left) and force-time (right) curves for a tip velocity of 10 μm s−1 (equivalent frequency of 166 Hz). (b) Force–distance (left) and force-time (right) for a tip velocity of 60 μm s−1 (1 kHz). (c) Force–distance (left) and force-time (right) for a tip velocity of 150 μm s−1 (2.5 kHz). (d) Force–distance (left) and force-time (right) for a tip velocity of 300 μm s−1 (5 kHz). The values of PLR model are plotted. Experiments performed on a NIH 3T3 fibroblasts. Red curves (experiments) and blue curves (theory). The dashed line (black) shows the filtered waveform of the tip's displacement during tip-cell contact (indentation). Tip of onical half-angle 18° and h = 6.2 μm. | ||
Fig. 6 shows the dependence of the values of E0 and γ averaged over 20 cells as function of the velocity. The apparent Young's modulus shows a very small decrease from 600 Pa to 550 between 10 and 60 μm s−1. For higher velocities, it increases monotonically from this 550 ± 140 Pa to 1300 ± 480 Pa (Fig. 6a and c). The power-law exponent γ remains constant for low velocities (10–50 μm s−1). At higher tip's velocities it decreases from 0.38 ± 0.03 to 0.23 ± 0.04 (Fig. 6b and d). The trends observed in the Young's modulus and in the exponent at high velocities (>60 μm s−1) underline an stiffening of the NIH 3T3 cells.
 | ||
| Fig. 6 Dependence of the PLR parameters with the tip's velocity. (a) Box-plot representation of E0 as a function of the velocity. (b) Box-plot representation of γ as function of the tip's velocity. Data obtained from 20 different cells. (c) Median values of the apparent Young's modulus. (d) Median values of the power-law exponent. Each dot is the median value of a box-plot that includes measurements on 20 different NIH 3T3 fibroblasts. The grey area marks the values of the median ± mean absolute deviation. | ||
From the above results, it can be concluded that for tip-cell velocities in the 10–60 μm s−1 range, the microrheological properties of NIH 3T3 fibroblast cells can be described by a single power-law model. However, for higher velocities, both E0 and γ show significant changes. The changes of the PLR parameters are consistent with the variety of solid components inside the cytoplasm. Those components actin cytoskeleton, microtubules, intermediate filaments or smaller proteins might have different dissipative interactions with the cytosol.
To complete the development of a FDC-based nanorheology requires to transform the above velocities into equivalent frequencies of a sinusoidal motion. An equivalent frequency is deduced from the contact time, tip's velocity and indentation (see ESI†). A velocity of 10 μm s−1 has an equivalent frequency 166 Hz while a velocity of 300 μm s−1 is equivalent to 5 kHz.
It is not straightforward to compare the FDC-nanorheology experiments and AFM-oscillatory microrheology data because they explore different regions of the cell, have different experimental set-ups and measure different quantities. In fact, the difficulty to compare data from different microrheology methods is rather general.35 Nonetheless, we note that AFM-oscillatory microrheology experiments report the existence of several viscoelastic regimes with different power-law exponents.40,61 In addition, experiments performed with other microrheology methods have also reported the existence of several power-law exponents.62
4.3. Bottom-effect artefact: the influence of the sharpness of the tip
The influence of the rigid support stiffness on the force measured by AFM on a mammalian cell is an unavoidable consequence of the cell's finite-thickness and softness. Furthermore, the influence of the rigid support is magnified by using tips with large contact radius.To illustrate the bottom-effect artefact and the role of the tip's radius (half-cone angle) we have compared the FDCs generated by the present theory and the fittings obtained by using a semi-infinite PLR theory. The force as function of time exerted on a semi-infinite PLR material is given by
 | (13) |
Fig. 7a and b show the force determined by the analytical bottom-effect PLR theory (eqn (7) and (12)) as a function of time (indentation) for two conical tips of, respectively, half-cone angles of 20° and 40°. In the simulations, the finite-thickness PLR material has an apparent Young's modulus E0 = 1 kPa and a power-law exponent of γ = 0.3. The thickness is of h = 2 μm. For the same indentation, the force applied by the 40° tip is always larger than the force applied by the 20° tip.
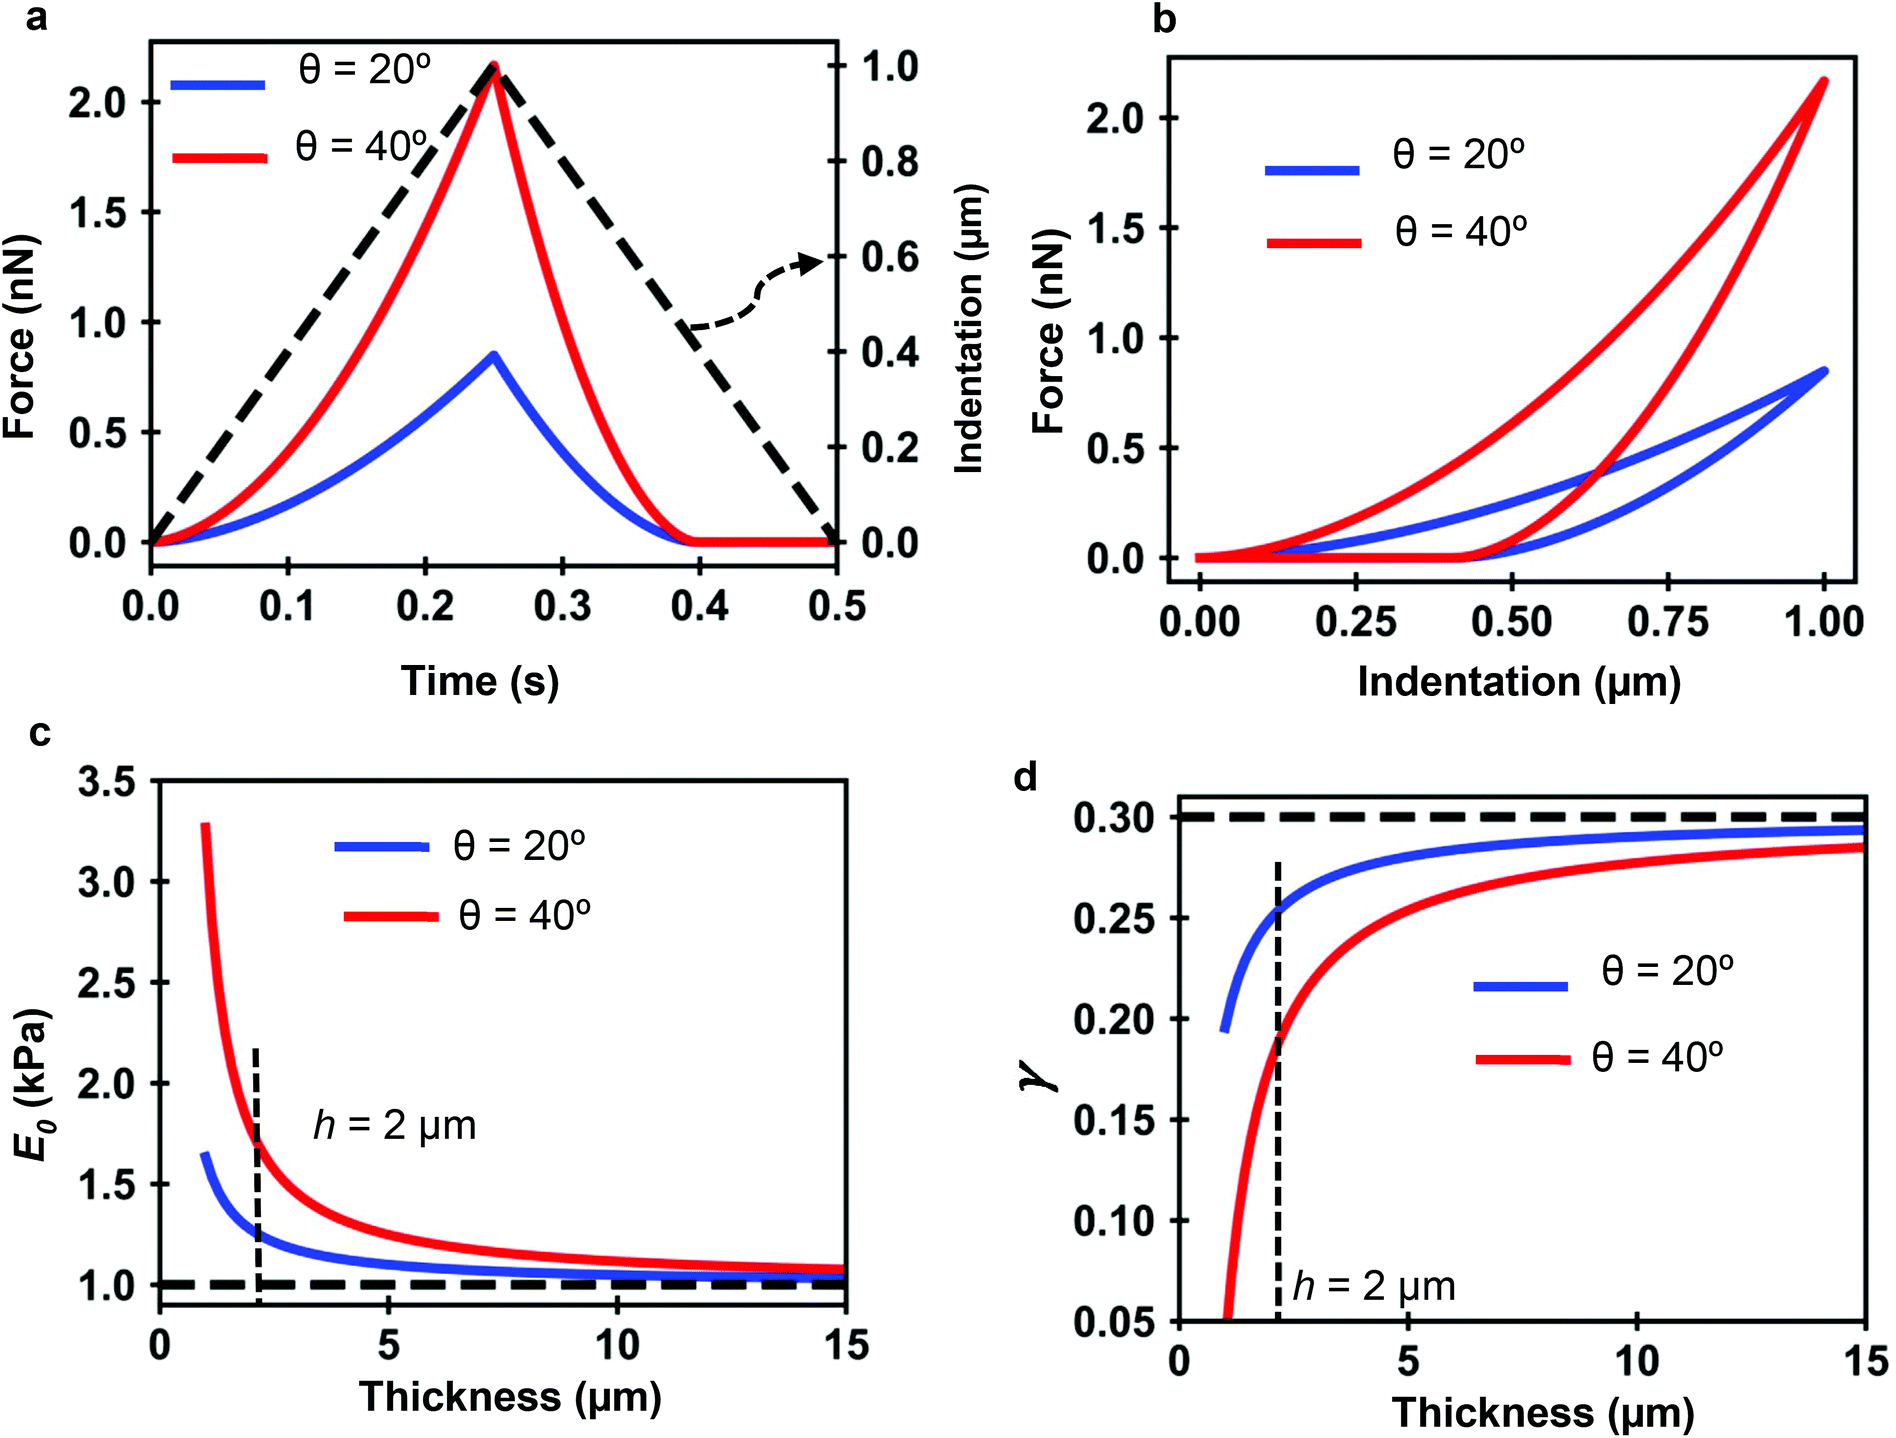 | ||
| Fig. 7 PLR simulations for two conical tips. (a) Force-time curves. The dashed line shows the waveform of the indentation. Conical tips of half-angles 20° (blue) and 40° (red); h = 2 μm. Tip velocity of 4 μm s−1. (b) Corresponding force–distance curves. (c) Apparent elastic modulus value as a function of the thickness. (d) Apparent power-law exponent dependence on the thickness. The apparent PLR parameters have been determined by fitting the FDCs generated with the analytical finite-thickness theory (eqn (7) and (12)) with the expressions describing a semi-infinite material (eqn (13)). | ||
Fig. 7c shows that by increasing the thickness of the material, the apparent Young's modulus obtained by fitting the FDC with the semi-infinite PLR theory decreases and converges to the true value (E0 = 1 kPa). The simulations show that the influence of the rigid support decreases by using sharper tips. For a conical tip of θ = 20°, the effect of the rigid support is negligible for thicknesses above 8 μm (Imax = 1 μm). To reach the same result for a tip of θ = 40° requires to increase the thickness of the material to 15 μm.
Similarly Fig. 7d shows that the exponent increases by increasing the thickness h until it reaches the true value of the material. The apparent viscosity the material, this is the one determined by using a semi-infinite theory, is reduced by the rigidity of the support. This is an artefact introduced by using viscoelastic model that does not consider bottom-effect corrections. For the same thickness, the effect of the solid support on the apparent viscoelastic parameters decreases by decreasing the tip's half angle. This result indicates that sharper tips should be used to measure nanomechanical properties of cells. This counter-intuitive result challenges a recommendations given to perform measurements of the elastic modulus of cells.47,63
The above results can be explained by eqn (7) and (12). The first term in both equations is proportional to tan![[thin space (1/6-em)]](https://www.rsc.org/images/entities/char_2009.gif) θ. This term carries exclusively information on the conical shape and on the viscoelastic properties of the material but not on its finite-thickness. The second term is proportional to the ratio between tan2θ and the cell thickness h. Therefore, the 2nd term carries information on the finite-thickness of the layer and of the presence of a solid support. The existence of force terms that depend on the ratio between the tangent θ (contact radius for an spherical tip) and the thickness is the key feature of analytical bottom-effect correction theories with independence of being developed for elastic29,31,32 or viscoelastic materials.43
θ. This term carries exclusively information on the conical shape and on the viscoelastic properties of the material but not on its finite-thickness. The second term is proportional to the ratio between tan2θ and the cell thickness h. Therefore, the 2nd term carries information on the finite-thickness of the layer and of the presence of a solid support. The existence of force terms that depend on the ratio between the tangent θ (contact radius for an spherical tip) and the thickness is the key feature of analytical bottom-effect correction theories with independence of being developed for elastic29,31,32 or viscoelastic materials.43
5. Conclusions
AFM-based force–distance curves are widely used to generate spatially-resolved maps of some elastic parameters such as the Young's modulus or stiffness. However, in the context of cell's nanomechanics, FDC measurements have two main limitations. First, finite element method simulations have shown that the Young's modulus values could be off by a factor 2 to 10 from their expected values. Second, force–distance curves have been deemed unsuitable to perform nano and microrheological measurements.The mismatch that exists between the values of the elastic parameters measured by FDCs and the expected values stems from a combination of factors. One source of error comes from the use of semi-infinite elastic contact mechanics models to describe the mechanical properties of a mammalian cell. Another limiting factor is the lack of a theory to process FDC measurements based on a realistic viscoelastic model of a cell.
We have developed an analytical method to describe the forces and deformations experienced by a cell cultured on a rigid support. The method incorporates a power-law rheology model of the cell. This viscoelastic model provides a realistic description of the mechanical response of a mammalian cell. The theory enables to determine the force applied on a cell as a function of its thickness and the indentation depth.
The theory is based on the application of the reciprocal theorem to relate pressures and deformations for different geometries, the viscoelastic correspondence principle, the deformation history of the cell and a set of boundary conditions involving a cell adhered onto a rigid support.
The analytical expressions show that the force exerted on a cell is increased by the presence of the solid support. This result is an unavoidable consequence of the boundary conditions existing in AFM experiments. Despite of this effect, the theory enables to recover the viscoelastic properties of a cell with independence of the stiffness of the rigid support.
The theoretical force–distance curves are compared with experiments performed on living fibroblasts cells. The comparison shows that for a triangular waveform, the Kelvin–Voigt model introduces a discontinuity in the force at the maximum indentation which is not observed experimentally. On the other hand, there is a satisfactory quantitative agreement between the experiments and the theory based on a power-law rheology model.
The quantitative agreement is more remarkable because the power-law theology model has just two fitting parameters, the apparent Young's modulus and the power-law exponent. Those parameters enable to fit both sections of the FDC curves (approach and retraction). The value of the parameters depend on the effective indentation frequency. A cell is a heterogeneous and complex system with a variety of solid elements in an aqueous fluid. The above dependencies might be explained by the size of the solid elements that dominate the viscoelastic processes at a given frequency. The smaller the solid element, the shorter the relaxation time.
We show also that the cell's mechanical parameters deduced by fitting a force–distance curve with a semi-infinite viscoelastic model are far from the expected values. The discrepancies are reduced by increasing the thickness of the material or by using sharper tips.
In summary, we have developed an analytical theory to measure the viscoelastic properties of living cells from AFM-based force–distance curves. The theory incorporates the finite-thickness of the cell, a power-law rheology model and the cell's deformation history. Experiments performed on living fibroblast cells confirm the validity of the theory. This method will enable to overcome the semi-quantitative character of force-volume experiments on cells. In the process, it will enable to extend the use of force–distance curves to measure the nanorheological response of a cell.
Conflicts of interest
There are no conflicts of interest to declare.Acknowledgements
Fruitful discussions with J. Garcia-Sanchez and F. M. Espinosa are acknowledged. We thank the financial support from the European Research Council ERC–AdG–340177 (3DNanoMech), Ministerio de Economía y Competitividad MAT2016-76507-R and Comunidad de Madrid S2018/NMT-4443 (Tec4Bio-CM).References
- Y. F. Dufrêne, T. Ando, R. Garcia, D. Alsteens, D. Martinez-Martin, A. Engel, C. Gerber and D. J. Müller, Imaging Modes of Atomic Force Microscopy for Application in Molecular and Cell Biology, Nat. Nanotechnol., 2017, 12, 295–307 CrossRef PubMed.
- N. Mandriota, C. Friedsam, J. A. Jones-Molina, K. Tatem, D. E. Ingber and O. Sahin, Cellular Nanoscale Stiffness Patterns Governed by Intracellular Forces, Nat. Mater., 2019, 18, 1071–1077 CrossRef CAS PubMed.
- P. D. Garcia, C. R. Guerrero and R. Garcia, Subsurface Imaging of Cell Organelles by Force Microscopy, ACS Nano, 2019, 13, 9629–9637 CrossRef PubMed.
- M. Shibata, T. Uchibashi, T. Ando and R. Yasuda, Long-tip high-speed force microscopy for nanometer-scale imaging of live cells, Sci. Rep., 2015, 5, 8724 CrossRef CAS PubMed.
- F. Eghiaian, A. Rigato and S. Scheuring, Structural, Mechanical, and Dynamical Variability of the Actin Cortex in Living Cells, Biophys. J., 2015, 108, 1330–1340 CrossRef CAS PubMed.
- A. P. Perrino and R. Garcia, How soft is a single protein? The stress–strain curve of antibody pentamers with 5 pN and 50 pm resolutions, Nanoscale, 2016, 8, 9151–9158 RSC.
- T. Ando, High-Speed Atomic Force Microscopy Coming of Age, Nanotechnology, 2012, 23, 062001 CrossRef PubMed.
- C. Rotsch and M. Radmacher, Drug-Induced Changes of Cytoskeletal Structure and Mechanics in Fibroblasts: An Atomic Force Microscopy Study, Biophys. J., 2000, 78, 520–535 CrossRef CAS PubMed.
- R. Vargas-Pinto, H. Gong, A. Vahabikashi and M. Johnson, The Effect of the Endothelial Cell Cortex on Atomic Force Microscopy Measurements, Biophys. J., 2013, 105, 300–309 CrossRef CAS PubMed.
- J. R. Ramos, J. Pabijan, R. Garcia and M. Lekka, The Softening of Human Bladder Cancer Cells Happens at an Early Stage of the Malignancy Process, Beilstein J. Nanotechnol., 2014, 5, 447–457 CrossRef PubMed.
- C. Kronlage, M. Schäfer-Herte, D. Böning, H. Oberleithner and J. Fels, Feeling for Filaments: Quantification of the Cortical Actin Web in Live Vascular Endothelium, Biophys. J., 2015, 109, 687–698 CrossRef CAS PubMed.
- S. Karsch, D. Kong, J. Großhans and A. Janshoff, Single-Cell Defects Cause a Long-Range Mechanical Response in a Confluent Epithelial Cell Layer, Biophys. J., 2017, 113, 2601–2608 CrossRef CAS PubMed.
- M. Krieg, G. Fläschner, D. Alsteens, B. M. Gaub, W. H. Roos, G. J. L. Wuite, H. E. Gaub, C. Gerber, Y. F. Dufrene and D. J. Müller, Atomic force microscopy-based mechanobiology, Nat. Rev. Phys., 2019, 1, 41–57 CrossRef.
- R. Garcia, Intracellular forces from stiffness, Nat. Mater., 2019, 18, 1037–1038 CrossRef CAS PubMed.
- M. Lekka, J. Pogoda, O. Gostek, S. Klymenko, J. Prauzner-Bechcicki, J. Wiltowska- Zuber, J. Jaczewska, J. Lekki and Z. Stachura, Cancer cell recognition – Mechanical phenotype, Micron, 2012, 43, 1259–1266 CrossRef PubMed.
- M. Plodinec, M. Loparic, C. A. Monnier, E. C. Obermann, R. Zanetti-Dallenbach, P. Oertle, J. T. Hyotyla, U. Aebi, M. Bentires-Alj, R. Y. H. Lim and C. Schoenenberger, The Nanomechanical Signature of Breast Cancer, Nat. Nanotechnol., 2012, 7, 757–765 CrossRef CAS PubMed.
- J. R. Staunton, B. Doss, S. M. Lindsay and R. Ros, Correlating confocal microscopy and atomic force indentation reveals metastatic cancer cells stiffen during invasion into collagen I matrices, Sci. Rep., 2016, 6, 19686 CrossRef CAS PubMed.
- J. G. Goetz, S. Minguet and I. Navarro-Lérida, et al., Biomechanical Remodeling of the Microenvironment by Stromal Caveolin-1 Favors Tumor Invasion and Metastasis, Cell, 2011, 146, 148–163 CrossRef CAS PubMed.
- A. Dominguez-Bajo, A. González-Mayorga, C. R. Guerrero, F. J. Palomares, R. Garcia, E. Lopez-Dolado and M. C. Serrano, Myelinated axons and functional blood vessels populate mechanically compliant rGO foams in chronic cervical hemisected rats, Biomaterials, 2019, 192, 461–474 CrossRef CAS PubMed.
- W. F. Heinz and J. H. Hoh, Spatially Resolved Force Spectroscopy of Biological Surfaces Using the Atomic Force Microscope, Trends Biotechnol., 1999, 17, 143–150 CrossRef CAS PubMed.
- J. Alcaraz, L. Buscemi, M. Grabulosa, X. Trepat, B. Fabry, R. Farré and D. Navajas, Microrheology of Human Lung Epithelial Cells Measured by Atomic Force Microscopy, Biophys. J., 2003, 84, 2071–2079 CrossRef CAS PubMed.
- E. M. Darling, S. Zauscher, J. A. Block and F. A. Guilak, A thin-layer model for viscolastic stress-relaxation testing of cells using AFM: Do cell properteis reflect metastatic potentical ?, Biophys. J., 2007, 92, 1784–1791 CrossRef CAS PubMed.
- F. M. Hecht, J. Rheinlaender, N. Schierbaum, W. H. Goldmann, B. Fabry and T. E. Schaffer, Imaging viscoelastic properties of live cells by AFM: power-law rheology on the nanoscale, Soft Matter, 2015, 11, 4584–4591 RSC.
- R. Garcia and E. T. Herruzo, The emergence of multifrequency force microscopy, Nat. Nanotechnol., 2012, 7, 217–226 CrossRef CAS PubMed.
- Y. M. Efremov, A. X. Cartagena-Rivera, A. I. M. Athamneh, D. M. Suterr and A. Raman, Mapping heterogeneity of cellular mechanics by multi-harmonic atomic force microscopy, Nat. Protocols, 2018, 13, 2200–2216 CAS.
- M. E. Dokukin and I. Sokolov, Nanoscale compositional mapping of cells, tissues, and polymers with ringing mode of atomic force microscopy, Sci. Rep., 2017, 7, 11828 CrossRef CAS PubMed.
- Y. M. Efremov, A. I. Shipchka, S. L. Kotova and P. S. Timashev, Viscoelastic Mapping of Cells Based on Fast Force Volume and PeakForce Tapping, Soft Matter, 2019, 12, 5455–5463 RSC.
- C. Roduit, S. Sekatski, G. Dietler, S. Catsicas, F. Lafont and S. Kasas, Stiffness Tomography by Atomic Force Microscopy, Biophys. J., 2009, 97, 674–677 CrossRef CAS PubMed.
- E. K. Dimitriadis, F. Horkay, J. Maresca, B. Kachar and R. S. Chadwick, Determination of Elastic Moduli of Thin Layers of Soft Material Using the Atomic Force Microscope, Biophys. J., 2002, 82, 2798–2810 CrossRef CAS PubMed.
- N. Gavara and R. S. Chadwick, Determination of the elastic moduli of thin samples and adherent cells using conical AFM tips, Nat. Nanotechnol., 2012, 7, 733–736 CrossRef CAS PubMed.
- P. D. Garcia and R. Garcia, Determination of the Elastic Moduli of a Single Cell Cultured on a Rigid Support by Force Microscopy, Biophys. J., 2018, 114, 2923–2932 CrossRef CAS PubMed.
- B. L. Doss, E. K. Rahmani, K. Lin and R. Ros, Quantitative Mechanical Analysis of Indentations on Layered, Soft Elastic Materials, Soft Matter, 2019, 15, 1776–1784 RSC.
- P. Kollmannsberger and B. Fabry, Linear and Nonlinear Rheology of Living Cells, Annu. Rev. Mater. Res., 2011, 41, 75–97 CrossRef CAS.
- P. H. Wu, D. R. B. Aroush, A. Asnacios, W. C. Chen, M. E. Dokukin, B. L. Doss, P. Durand-Smet, A. Ekpenyong, J. Guck, N. V. Guz, P. A. Janmey, J. S. H. Lee, N. M. Moore, A. Ott, Y. Poh, R. Ros, M. Sander, I. Sokolov, J. R. Staunton and N. Wang, et al., A Comparison of Methods to Assess Cell Mechanical Properties, Nat. Methods, 2018, 15, 491–498 CrossRef CAS PubMed.
- B. D. Hofman, G. Massiera, K. M. Van Citters and J. C. Crocker, The consensus mechanics of cultured mammalian cells, Proc. Natl. Acad. Sci. U. S. A., 2006, 103, 10259–10264 CrossRef PubMed.
- S. Hiratsuka, Y. Mizutani, M. Tsuchiya, K. Kawahara, H. Tokumoto and T. Okajima, The Number Distribution of Complex Shear Modulus of Single Cells Measured by Atomic Force Microscopy, Ultramicroscopy, 2009, 109, 937–941 CrossRef CAS PubMed.
- S. Moreno-Flores, R. Benitez, M. D. Vivanco and J. L. Toca-Herrera, Stress Relaxation and Creep on Living Cells with the Atomic Force Microscope: A Means to Calculate Elastic Moduli and Viscosities of Cell Components, Nanotechnology, 2010, 21, 445101 CrossRef PubMed.
- E. Moeendarbary, L. Valon, M. Fritzsche, A. R. Harris, D. A. Moulding, A. J. Thrasher, E. Stride, L. Mahadevan and G. T. Charras, The Cytoplasm of Living Cells Behaves as a Poroelastic Material, Nat. Mater., 2013, 12, 253–261 CrossRef CAS PubMed.
- J. S. De Sousa, J. A. C. Santos, E. B. Barros, L. M. R. Alencar, W. T. Cruz, M. V. Ramos and J. Mendes-Filho, Analytical Model of Atomic-Force-Microscopy Force Curves in Viscoelastic Materials Exhibiting Power Law Relaxation, J. Appl. Phys., 2017, 121, 034901 CrossRef.
- A. Rigato, A. Miyagi, S. Scheuring and F. Rico, High-Frequency Microrheology Reveals Cytoskeleton Dynamics in Living Cells, Nat. Phys., 2017, 13, 771–775 Search PubMed.
- P. D. Garcia, C. R. Guerrero and R. Garcia, Time-resolved nanomechanics of a single cell under the depolymerization of the cytoskeleton, Nanoscale, 2017, 9, 12051–12059 RSC.
- K. Kroy, The benefits of getting high, Nat. Phys., 2017, 13, 728–729 Search PubMed.
- P. D. Garcia and R. Garcia, Determination of the Viscoelastic Properties of a Single Cell Cultured on a Rigid Support by Force Microscopy, Nanoscale, 2018, 10, 19799–19809 RSC.
- J. Rother, H. Nöding, I. Mey and A. Janshoff, Atomic force microscopy-based microrheology reveals significant differences in the viscoelastic response between malign and benign cell lines, Open Biol., 2014, 4, 140046 CrossRef PubMed.
- L. M. Rebelo, J. S. De Sousa, J. Mendes Filho and M. Radmacher, Comparison of the Viscoelastic Properties of Cells from Different Kidney Cancer Phenotypes Measured with Atomic Force Microscopy, Nanotechnology, 2013, 24, 055102 CrossRef CAS PubMed.
- N. Schierbaum, J. Rheinlaender and T. E. Schäffer, Viscoelastic properteis of normal and cancerous human breast cells are afffected by contact to adjacent cells, Acta Biomater., 2017, 55, 239–248 CrossRef CAS PubMed.
- H. Schillers, et al., Standardized Nanomechanical Atomic Force Microscopy Procedure (SNAP) for Measuring Soft and Biological Samples, Sci. Rep., 2017, 7, 1–9 CrossRef CAS PubMed.
- N. Gavara, Combined strategies for optimal detection of the contact point in AFM force-indentation curves obtained on thin samples and adherent cells, Sci. Rep., 2016, 6, 21267 CrossRef CAS PubMed.
- M. Galluzzi, G. Tang, C. S. Biswas, J. Zhao, S. Chen and F. J. Stadler, AFM methodology and AFMech suite software for nanomechanics on heterogenous soft materials, Nat. Commun., 2018, 9, 3584 CrossRef PubMed.
- Y. M. Efremov, W. H. Wang, S. D. Hardy, R. L. Geahlen and A. Raman, Measuring Nanoscale Viscoelastic Parameters of Cells Directly from AFM Force-Displacement Curves, Sci. Rep., 2017, 7, 1–14 CrossRef CAS PubMed.
- T. C. T. Ting, The Contact Stresses Between a Rigid Indenter and a Viscoelastic Half-Space, J. Appl. Mech., 1966, 33, 845–854 CrossRef.
- T. C. T. Ting, Contact Problems in the Linear Theory of Viscoelasticity, J. Appl. Mech., 1968, 35, 248–254 CrossRef.
- B. R. Bruckner, H. Nöding and A. Janshoff, Viscoelastic Properties of Confluent MDCK II Cells Obtained from Force Cycle Experiments, Biophys. J., 2017, 112, 724–735 CrossRef PubMed.
- H. Hertz, Ueber Die Beruehrung Elastischer Koerper (On Contact Between Elastic Bodies), J. Reine Angew. Math., 1882, 92, 156–171 Search PubMed.
- I. N. Sneddon, Boussinesq's Problem for a Rigid Cone, Math. Proc. Cambridge Philos. Soc., 1948, 44, 492 CrossRef.
- I. N. Sneddon, The relation between load and penetration in the axisymmetric boussinesq problem for a punch of arbitrary profile, Int. J. Eng. Sci., 1965, 3, 47–57 CrossRef.
- E. H. Lee and J. R. M. Radok, The Contact Problem for Visooelastic Bodies, J. Appl. Mech., 1960, 27, 438–444 CrossRef.
- N. W. Tschoegl, The Phenomenological Theory of Linear Viscoelastic Behavior An Introduction, Springer, Berlin, Heidelberg, 1989 Search PubMed.
- R. Garcia, C. J. Gomez, N. F. Martinez, S. Patil, C. Dietz and R. Magerle, Identification of nanoscale dissipation processes by dynamic atomic force microscopy, Phys. Rev. Lett., 2006, 97, 016103 CrossRef CAS PubMed.
- S. D. Solares, Nanoscale Effects in the Characterization of Viscoelastic Materials with Atomic Force Microscopy: Coupling of a Quasi-Three-Dimensional Standard Linear Solid Model with in-Plane Surface Interactions, Beilstein J. Nanotechnol., 2016, 7, 554–571 CrossRef CAS PubMed.
- R. Takahashi and T. Okajimaa, Mapping power-law rheology of living cells using multi-frequency force modulation atomic force microscopy, Appl. Phys. Lett., 2015, 107, 173702 CrossRef.
- D. Stamenović, N. Rosenblatt, M. Montoya-Zavala, B. D. Matthews, S. Hu, B. Suki, N. Wang and D. E. Ingber, Rheological Behavior of Living Cells Is Timescale-Dependent, Biophys. J., 2007, 93, 39–41 CrossRef PubMed.
- N. Guz, M. Dokukin, V. Kalaparthi and I. Sokolov, If Cell Mechanics Can Be Described by Elastic Modulus: Study of Different Models and Probes Used in Indentation Experiments, Biophys. J., 2014, 107, 564–575 CrossRef CAS PubMed.
Footnotes |
| † Electronic supplementary information (ESI) available: Complete derivation of the analytical expressions for PLR and KV models, coefficients for a conical tip, correspondence between velocities and equivalent indentation frequencies, statistical analysis of the experiments performed on NIH 3T3 fibroblasts. See DOI: 10.1039/c9nr10316c |
| ‡ These authors contributed equally. |
| This journal is © The Royal Society of Chemistry 2020 |