
 Open Access Article
 This Open Access Article is licensed under a
 Creative Commons Attribution 3.0 Unported Licence
Controlling protein interactions in blood for effective liver immunosuppressive therapy by silica nanocapsules†
Shuai
Jiang
 a,
Domenik
Prozeller
a,
Jorge
Pereira
a,
Johanna
Simon
ab,
Shen
Han
a,
Sebastian
Wirsching
c,
Michael
Fichter
c,
Milagro
Mottola
a,
Ingo
Lieberwirth
a,
Svenja
Morsbach
a,
Volker
Mailänder
ab,
Stephan
Gehring
c,
Daniel
Crespy
*ad and
Katharina
Landfester
*a
a,
Domenik
Prozeller
a,
Jorge
Pereira
a,
Johanna
Simon
ab,
Shen
Han
a,
Sebastian
Wirsching
c,
Michael
Fichter
c,
Milagro
Mottola
a,
Ingo
Lieberwirth
a,
Svenja
Morsbach
a,
Volker
Mailänder
ab,
Stephan
Gehring
c,
Daniel
Crespy
*ad and
Katharina
Landfester
*a
aMax Planck Institute for Polymer Research, Ackermannweg 10, 55128 Mainz, Germany. E-mail: landfester@mpip-mainz.mpg.de; daniel.crespy@vistec.ac.th
bDermatology Clinic, University Medical Center of the Johannes Gutenberg-University, Langenbeckstr. 1, 55131 Mainz, Germany
cChildren's Hospital, University Medical Center of the Johannes-Gutenberg University, Mainz, Germany
dDepartment of Materials Science and Engineering, School of Molecular Science and Engineering, Vidyasirimedhi Institute of Science and Technology (VISTEC), Rayong 21210, Thailand
First published on 31st December 2019
Abstract
Immunosuppression with glucocorticoids is a common treatment for autoimmune liver diseases and after liver transplant, which is however associated with severe side-effects. Targeted delivery of glucocorticoids to inflammatory cells, e.g. liver macrophages and Kupffer cells, is a promising approach for minimizing side effects. Herein, we prepare core–shell silica nanocapsules (SiO2 NCs) via a sol–gel process confined in nanodroplets for targeted delivery of dexamethasone (DXM) for liver immunosuppressive therapy. DXM with concentrations up to 100 mg mL−1 in olive oil are encapsulated while encapsulation efficiency remains over 95% after 15 days. Internalization of NCs by non-parenchymal murine liver cells significantly reduces the release of inflammatory cytokines, indicating an effective suppression of inflammatory response of liver macrophages. Fluorescent and magnetic labeling of the NCs allows for monitoring their intracellular trafficking and biodegradation. Controlled interaction with blood proteins and good colloidal stability in blood plasma are achieved via PEGylation of the NCs. Specific proteins responsible for stealth effect, such as apolipoprotein A-I, apolipoprotein A-IV, and clusterin, are present in large amounts on the PEGylated NCs. In vivo biodistribution investigations prove an efficient accumulation of NCs in the liver, underlining the suitability of the SiO2 NCs as a dexamethasone carrier for treating inflammatory liver diseases.
Introduction
Liver diseases such as autoimmune hepatitis, primary biliary cirrhosis, and primary sclerosing cholangitis are induced by overwhelming inflammatory immune responses. Immunosuppression with glucocorticoids is a common treatment option for autoimmune liver diseases and after liver transplant, even for pediatric patients.1 However, glucocorticoids do not act specifically on liver cells and their long-term systemic administration is associated with severe side effects such as osteoporosis, hypertension, hyperglycemia, adrenal insufficiency, myopathy, metabolic disturbances, and stomach and intestinal bleeding due to ulcers.2–4 Targeted delivery of glucocorticoids to inflammatory liver cells, e.g. Kupffer cells and macrophages, represents hence a promising approach for increasing drug bioavailability in targeted tissue and organs and reducing systemic adverse effects.5–9Dexamethasone (DXM) is a very common glucocorticoid drug.5 Although it is considered as one of the safest glucocorticoids, a broad spectrum of side effects have been still observed; mostly due to its hydrophobicity.5 Sodium salt of DXM was recommended as hydrophilic alternative of the drug, but its use can lead to sodium overdosing.5 Water-soluble polymers and nanoparticles have been used as drug carriers for increasing the solubility of hydrophobic drugs.10 Because large quantities of nanoparticles translocate to the liver by passive targeting upon parenteral administration,11–13 nanocarrier-mediated drug delivery represents a promising strategy for combatting liver diseases.14
There are two main strategies for the controlled delivery of DXM. In the first approach, DXM molecules were conjugated to hydrophilic polymers15–22 and nanoparticles23,24via reactions with ketone16–20,22,25,26 or hydroxyl20,21,23,27 groups of DXM. The formed hydrazone or ester linkages allowed a specific release of DXM in response to acidic local environment in inflammatory tissues. This approach relies on the modification of polymers and/or the parent drug, and the linker chemistry, and therefore multi-step synthesis and purifications are usually required. Alternatively, DXM compounds can be directly loaded in nanoparticles. A variety of nanoparticles prepared from biodegradable polymers such as PLGA,28–37 PLLA,38 PCL,38 cellulose,39 cyclodextrin,40 chitosan,41 polyglutamic acid,42 or lipids43 and inorganic materials,10,44 as well as polymer micelles,45 liposomes,46–49 and carbon nanotubes50 have been used to transport DXM. Entrapment of DXM in nanoparticles led usually to a prolonged and sustained release of DXM.10,30–40,44,50 Nevertheless, premature release of DXM before reaching the targeting tissues is still an issue. In order to minimize side effects due to leakage of drug and increase its bioavailability, an efficient encapsulation and a selective release drug delivery system are needed.
Furthermore, most of the DXM nano-formulations were developed for topical therapies, e.g. the treatment of ophthalmic,30,42,45,51 dermal,10,39 respiratory,32,52 bowel,43,53 brain,36,41 and joint diseases18,24,28,29,54–56 by local administration. In this case, the nanoencapsulation is mainly used for increasing local concentration of drugs and controlling their release kinetics. However, intravenous administration of nanocarriers is usually applied for treating liver diseases.9,13,57 Once the nanocarriers enter into the blood stream, various blood components such as proteins and lipids rapidly interact with nanocarriers and cover their surface.58,59 This biomolecular corona has been shown to be a key parameter that mediates in vivo behavior of nanocarriers.60 Therefore, a systematic study on the interaction of DXM-nanocarriers with blood proteins and the resulting colloidal stability and biodistribution of nanocarriers are essential for assessing the effectivity of nanocarrier-mediated targeted delivery.
In this study, we developed multifunctional core–shell silica nanocapsules (SiO2 NCs) via an interfacially confined sol–gel process for targeted delivery of DXM for liver immunosuppressive therapy (Fig. 1). Silica nanomaterials show good biocompatibility, tunable porosity, and ease of surface modification. Therefore, they have been widely studied for biological applications.61 The core–shell structure of the NCs enables high encapsulation efficiency of DXM at high concentrations and an intracellularly selective release upon biodegradation of the shell. Controlled interactions with blood proteins and good colloidal stability of the NCs in blood plasma were achieved by PEGylation of the NCs, which are prerequisites for an effective in vivo targeted delivery.
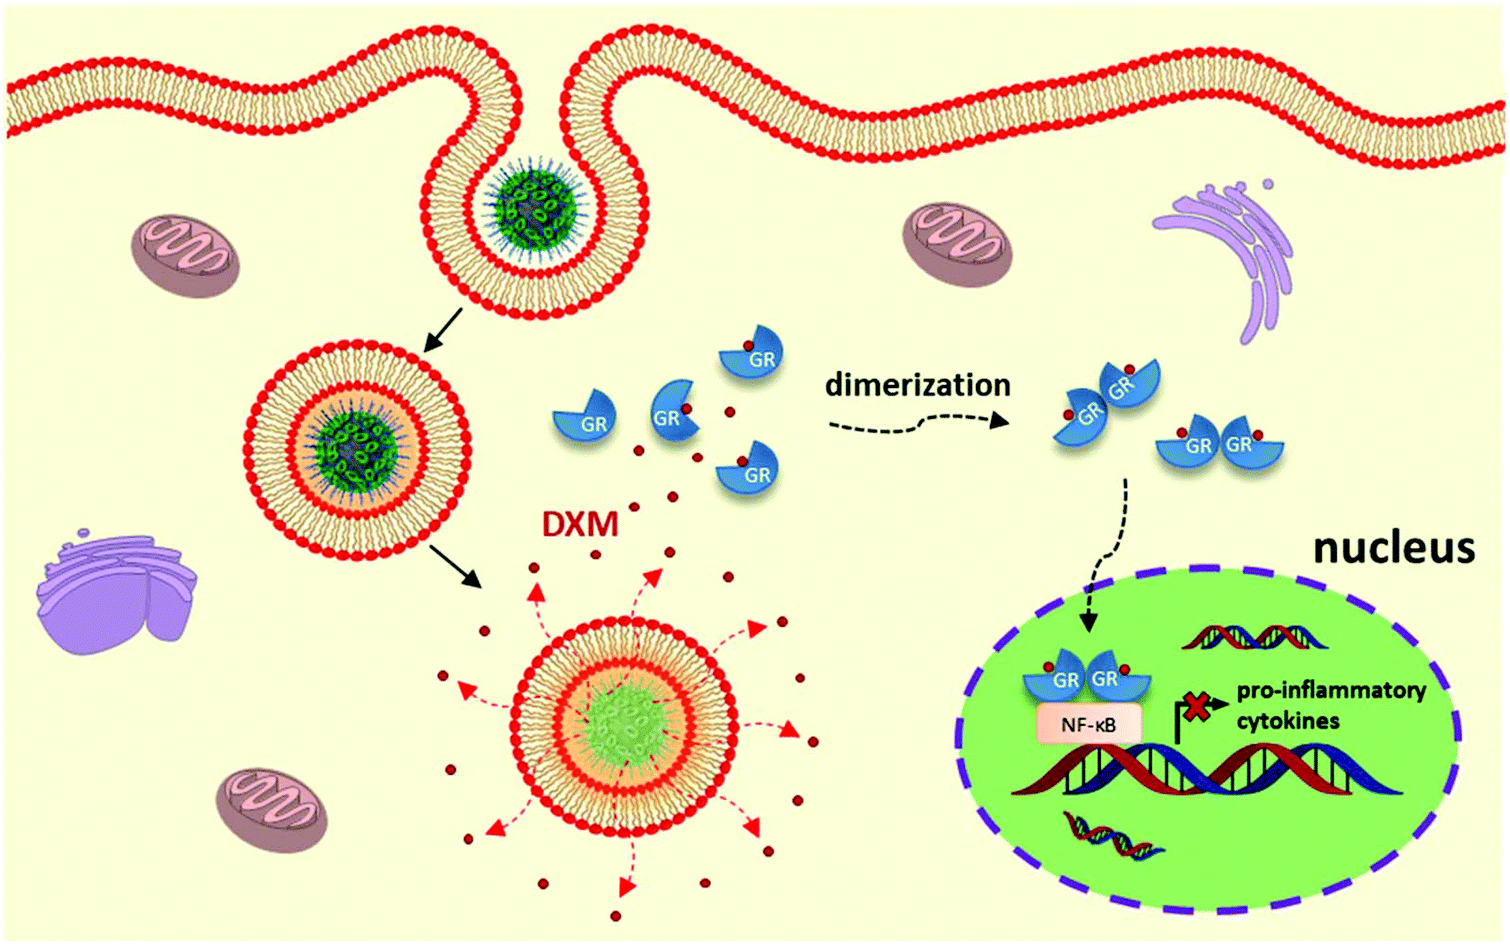 | ||
| Fig. 1 Schematic illustration of nanocarrier-mediated targeted delivery of dexamethasone for liver immunosuppressive therapy. | ||
Results and discussion
Encapsulation of DXM in SiO2 NCs
DXM was encapsulated in the liquid core of the SiO2 NCs. Hydrophobic DXM was first dissolved in olive oil at concentrations from 1 to 100 mg mL−1. The olive oil solution was mixed with hexadecane, functional silica precursors, and iron oxide nanoparticles (Fe3O4 NPs) to form the dispersed phase. The hydrophobic mixtures were dispersed in an aqueous solution of the cationic surfactant cetyltrimethylammonium chloride (CTMA-Cl). The CTMA-Cl stabilized the miniemulsion droplets against coalescence and confined the condensation of silica precursors at the oil/water interface via a cooperative assembly between negatively charged silica species with the cationic surfactant.62 A silica shell was therefore formed around nanodroplets containing DXM and Fe3O4 NPs.63 Simultaneously, fluorescently modified silica precursors were copolymerized in the silica network. Therefore, drug encapsulation and fluorescent and magnetic labeling of NCs were carried out in one step.SiO2 NCs with an average hydrodynamic diameter of 144 ± 64 nm and ζ-potential of +12.2 ± 0.5 mV were obtained. Core–shell morphology of the SiO2 NCs was identified by SEM and TEM (Fig. 2), indicating a confined condensation of alkoxysilanes around miniemulsion droplets. The average shell thickness was determined to be 5 ± 2 nm from TEM micrographs. Surface of the NCs was PEGylated by replacing the CTMA-Cl with a PEG-based nonionic surfactant Lutensol AT50 by dialysis. According to HPLC measurements performed to measure the concentration of CTMA-Cl in the dialysis media, ∼90% CTMA-Cl was removed. Remarkably, nanocapsules dispersions were stable during the surfactant-exchange process. Size of NCs increased slightly from 144 ± 64 nm for CTMA-Cl stabilized NCs to 154 ± 67 nm for Lutensol AT50 stabilized NCs. The surface charge of NCs turned from positive (+12.2 ± 0.5 mV) to neutral (−0.1 ± 1.0 mV) after PEGylation. The slightly negative charge was due to the dissociation of silanol groups at experimental pH (4–5), which is above the isoelectric point of silica (∼pH 2–3).62 Encapsulation efficiency of DXM in the PEGylated NCs was subsequently investigated by dialyzing the nanocapsules dispersions. Less than 5% of DXM was released in 15 days (Fig. S1†), indicating a minimal leakage which is beneficial for avoiding side effects from diffused free corticosteroids.
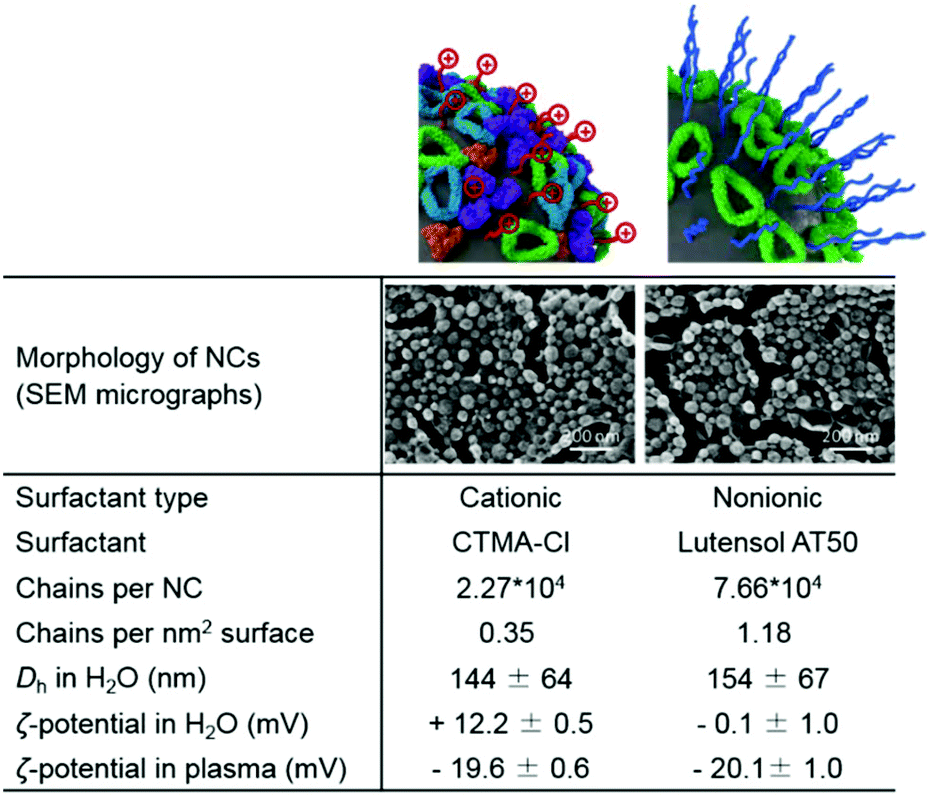 | ||
| Fig. 2 Colloidal characteristics of the SiO2 NCs. SEM micrographs of the NCs, average number and surface density of CTMA-Cl and Lutensol AT50 surfactant molecules, hydrodynamic diameter Dh, and zeta potential of the SiO2 NCs in water and plasma. | ||
Immunosuppression with SiO2-DXM NCs
Murine non-parenchymal liver cells were incubated with the SiO2 NCs at various concentrations for 24 h. Cellular uptake of NCs was quantified by using flow cytometry. A concentration-dependent cellular uptake of NCs was observed (Fig. 3a). The uptake increased from ∼5% to 28% as the concentration of NCs increased from 10 to 100 μg mL−1 in cell culture. The cells were stained with propidium iodide for quantifying the population of dead cells. The SiO2 NCs showed low effect on cell viability especially at low concentrations, which is in line with previous reports from other groups.64,65 Incubation with 100 μg mL−1 of NCs led to a slight increase of dead cells from ∼17% to 28% (Fig. 3b).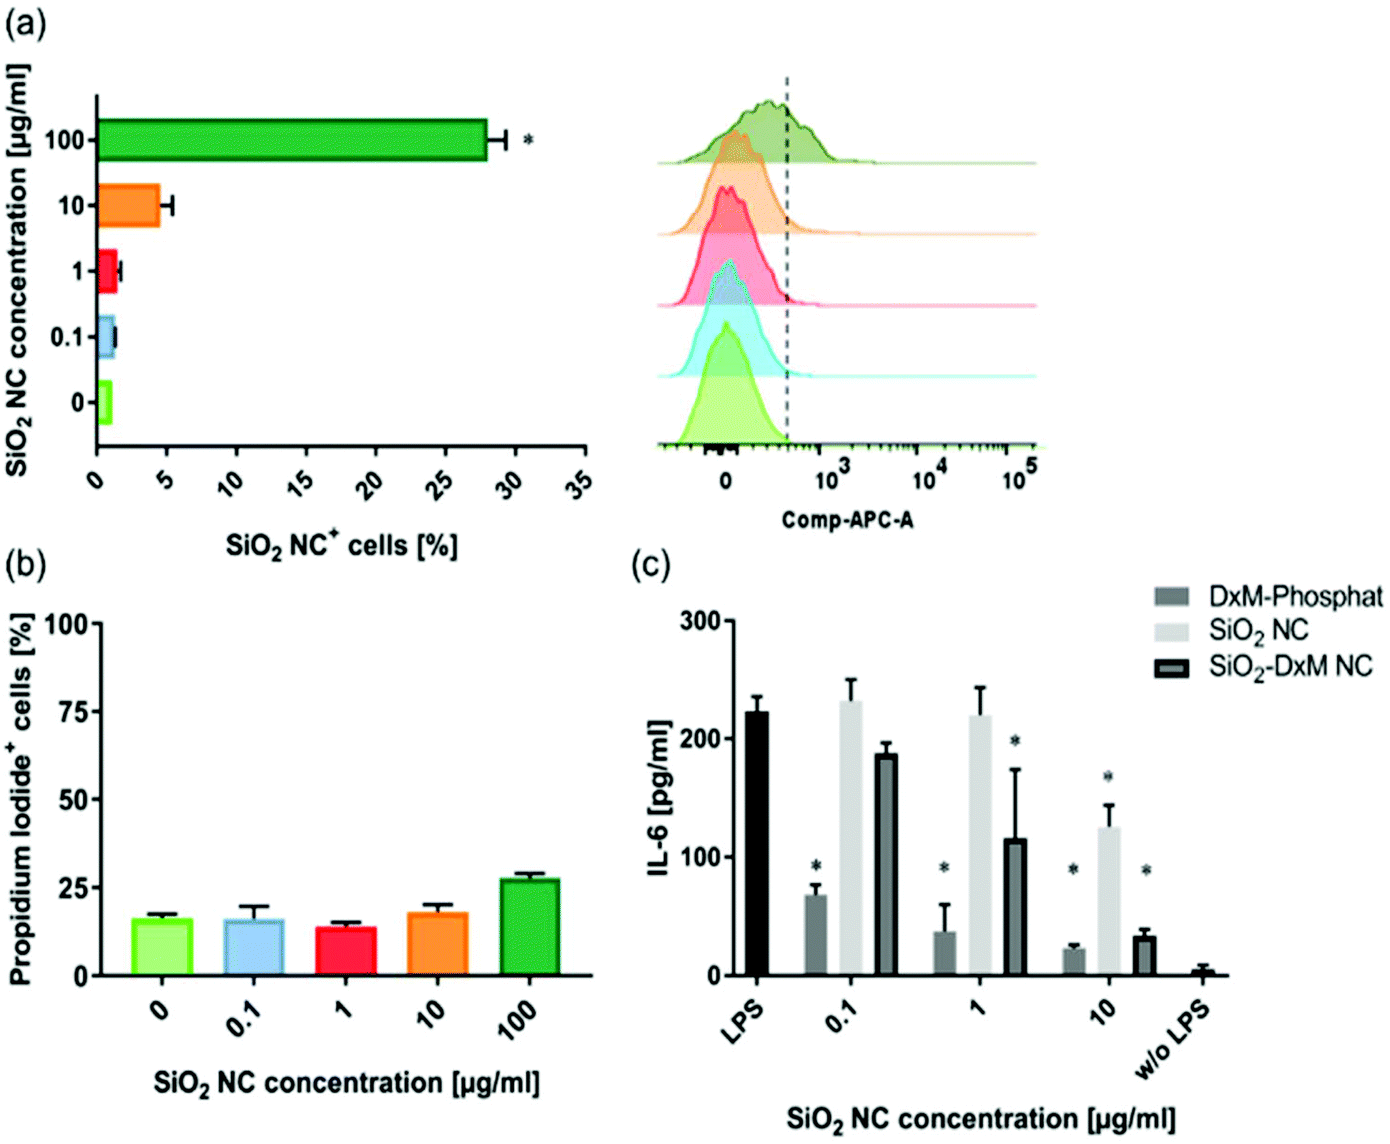 | ||
| Fig. 3 (a) Uptake of SiO2 NCs with increasing concentrations by non-parenchymal liver cells in vitro evaluated by flow cytometry. All conditions were compared to the negative control (without SiO2 NCs) and significance was given with p < 0.001 (*) (one-way ANOVA). (b) Cytotoxicity of SiO2 NCs measured by evaluating the number of propidium iodide positive cells by flow cytometry. (c) Effect of SiO2 NCs with increasing concentrations on IL-6 secretion of NPCs after stimulation with 2.5 μg mL−1 LPS. All conditions were compared to the positive control (LPS stimulated) and significance was given with p < 0.001 (*) (two-way ANOVA with Dunnett's multiple comparison test). Data represent mean ± SD (n = 3). | ||
ELISA assays were performed to study the effect of encapsulated DXM on interleukin-6 (IL-6) secretion of lipopolysaccharide (LPS) stimulated non-parenchymal liver cells after 24 h incubation in vitro. Treatment of the cells with SiO2-DXM NCs led to a dose-dependent decrease of IL-6 secretion (Fig. 3c). Incubation with 10 μg mL−1 SiO2-DXM NCs generated a ten-fold reduction of secreted IL-6, showing an effect comparable to the treatment with water-soluble DXM phosphate. One advantage of nanocapsules over nanoparticle carriers is their core–shell structure that offers a high encapsulation capacity. DXM with concentrations ranging from 1 to 100 mg mL−1 in olive oil was encapsulated as liquid core in SiO2 NCs, denoted as SiO2-DXM1(−100) NCs in Table S1.† Average Dh of the SiO2-DXM NCs was around 130–180 nm. Encapsulation efficiency of DXM in NCs increased to ∼97% at loading concentration of 100 mg mL−1 in the core oil. As shown in Fig. 4, the suppression efficiency of SiO2-DXM NCs for IL-6 secretion was enhanced significantly by increasing DXM loading content. The suppression effects of SiO2-DXM NCs at internal loading concentration of 50 and 100 mg mL−1 were comparable to the water-soluble DXM phosphate at a concentration of 10 μg mL−1.
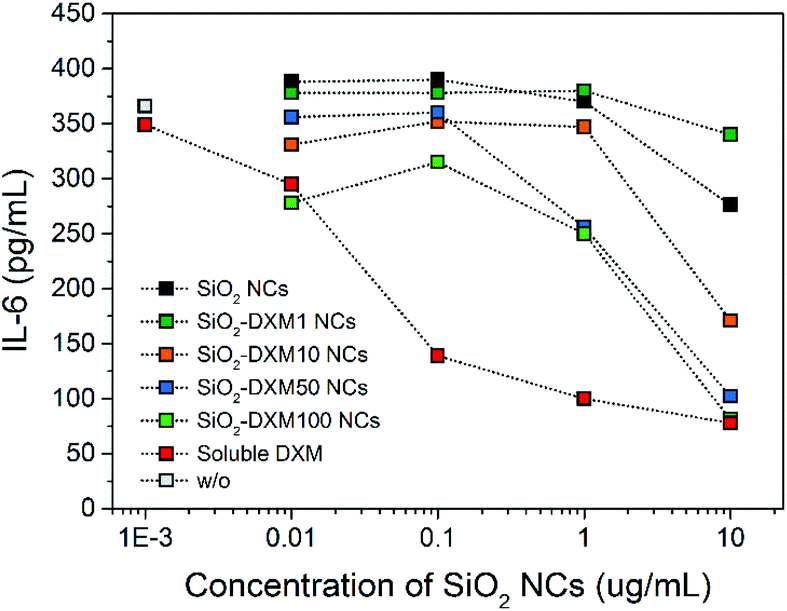 | ||
| Fig. 4 Evolution of IL-6 secretion in non-parenchymal liver cells after stimulation with 2.5 μg mL−1 LPS treated with SiO2 NCs containing various concentrations of DXM. All conditions were compared to a positive control (LPS stimulated) and significance was given with p < 0.001 (*) (two-way ANOVA with Dunnett's multiple comparison test). | ||
Cellular uptake behavior and intracellular trafficking of SiO2 NCs
Understanding cellular uptake, intra-, and intercellular trafficking mechanisms of nanocarriers is critical for designing efficient and safe nanomedicines.66 We studied the cellular uptake behavior and intracellular trafficking of the SiO2 NCs by TEM. However, because the SiO2 NCs have a core–shell structure and size of ∼100 nm, they are difficult to distinguish from cellular organelles on TEM micrographs. To overcome this issue, we labeled the SiO2 NCs with Fe3O4 NPs as contrast agent. Labeling of iron oxide also allowed the localization of NCs by monitoring elemental distribution of silicon and iron. As shown in Fig. 5a, the Fe3O4 NPs with diameter of ∼8 nm were encapsulated in the inner core of NCs. To prove the efficient loading of Fe3O4 NPs in NCs, gradient centrifugation technique was applied. No free Fe3O4 NPs were separated from the SiO2 NCs present in the upper phase (Fig. S2†), indicating a high encapsulation efficiency of the NPs. By encapsulating Fe3O4 NPs as contrast agent, SiO2 NCs were clearly distinguished from cellular organelles (Fig. 5b–e). Combined with elemental mapping of silicon and iron obtained by electron energy loss spectroscopy (EELS) and energy dispersive X-ray spectroscopy (EDS), cellular uptake of the SiO2 NCs and their localization in intracellular environment were successfully identified (Fig. 5g). Intracellular trafficking of the NCs was studied at different incubation times (Fig. 5c–f). Iron oxide labeled NCs were found in multivesicular bodies after 2 hours incubation (Fig. 5d). After incubating the cells with magnetic NCs for 10 and 24 h, some free Fe3O4 NPs, without surrounding silica shell, were observed (Fig. 5e and f). This observation indicates a plausible intracellular degradation of the ultrathin silica shell (∼5 nm), which is consistent with previous findings from other groups. Chen et al. found that the degradation of surfactant-extracted MCM-41-type mesoporous silica nanoparticles exhibited a very fast initial degradation within 2 h in simulated body fluid.67 The incomplete –Si–O– tetrahedral network in the nanoparticles, containing plenty of Si–R and Si–OH groups, facilitated their easy degradation. Bein et al. found that small particle size (50–70 nm) with a low condensation degree and a highly mesoporous texture (pore size ∼3–4 nm), and high surface area accelerated the degradation reactions.68 In our case, the SiO2 NCs showed also a low condensation degree, as shown by the Q2 signal of 1%, Q3 signal of 43%, and Q4 signal of 56% determined by 29Si MAS NMR spectroscopy. The combination of the presence of free Si–R and Si–OH groups with the thin shell and a pore size of ∼3–6 nm is therefore likely to facilitate the intracellular degradation of the SiO2 NCs.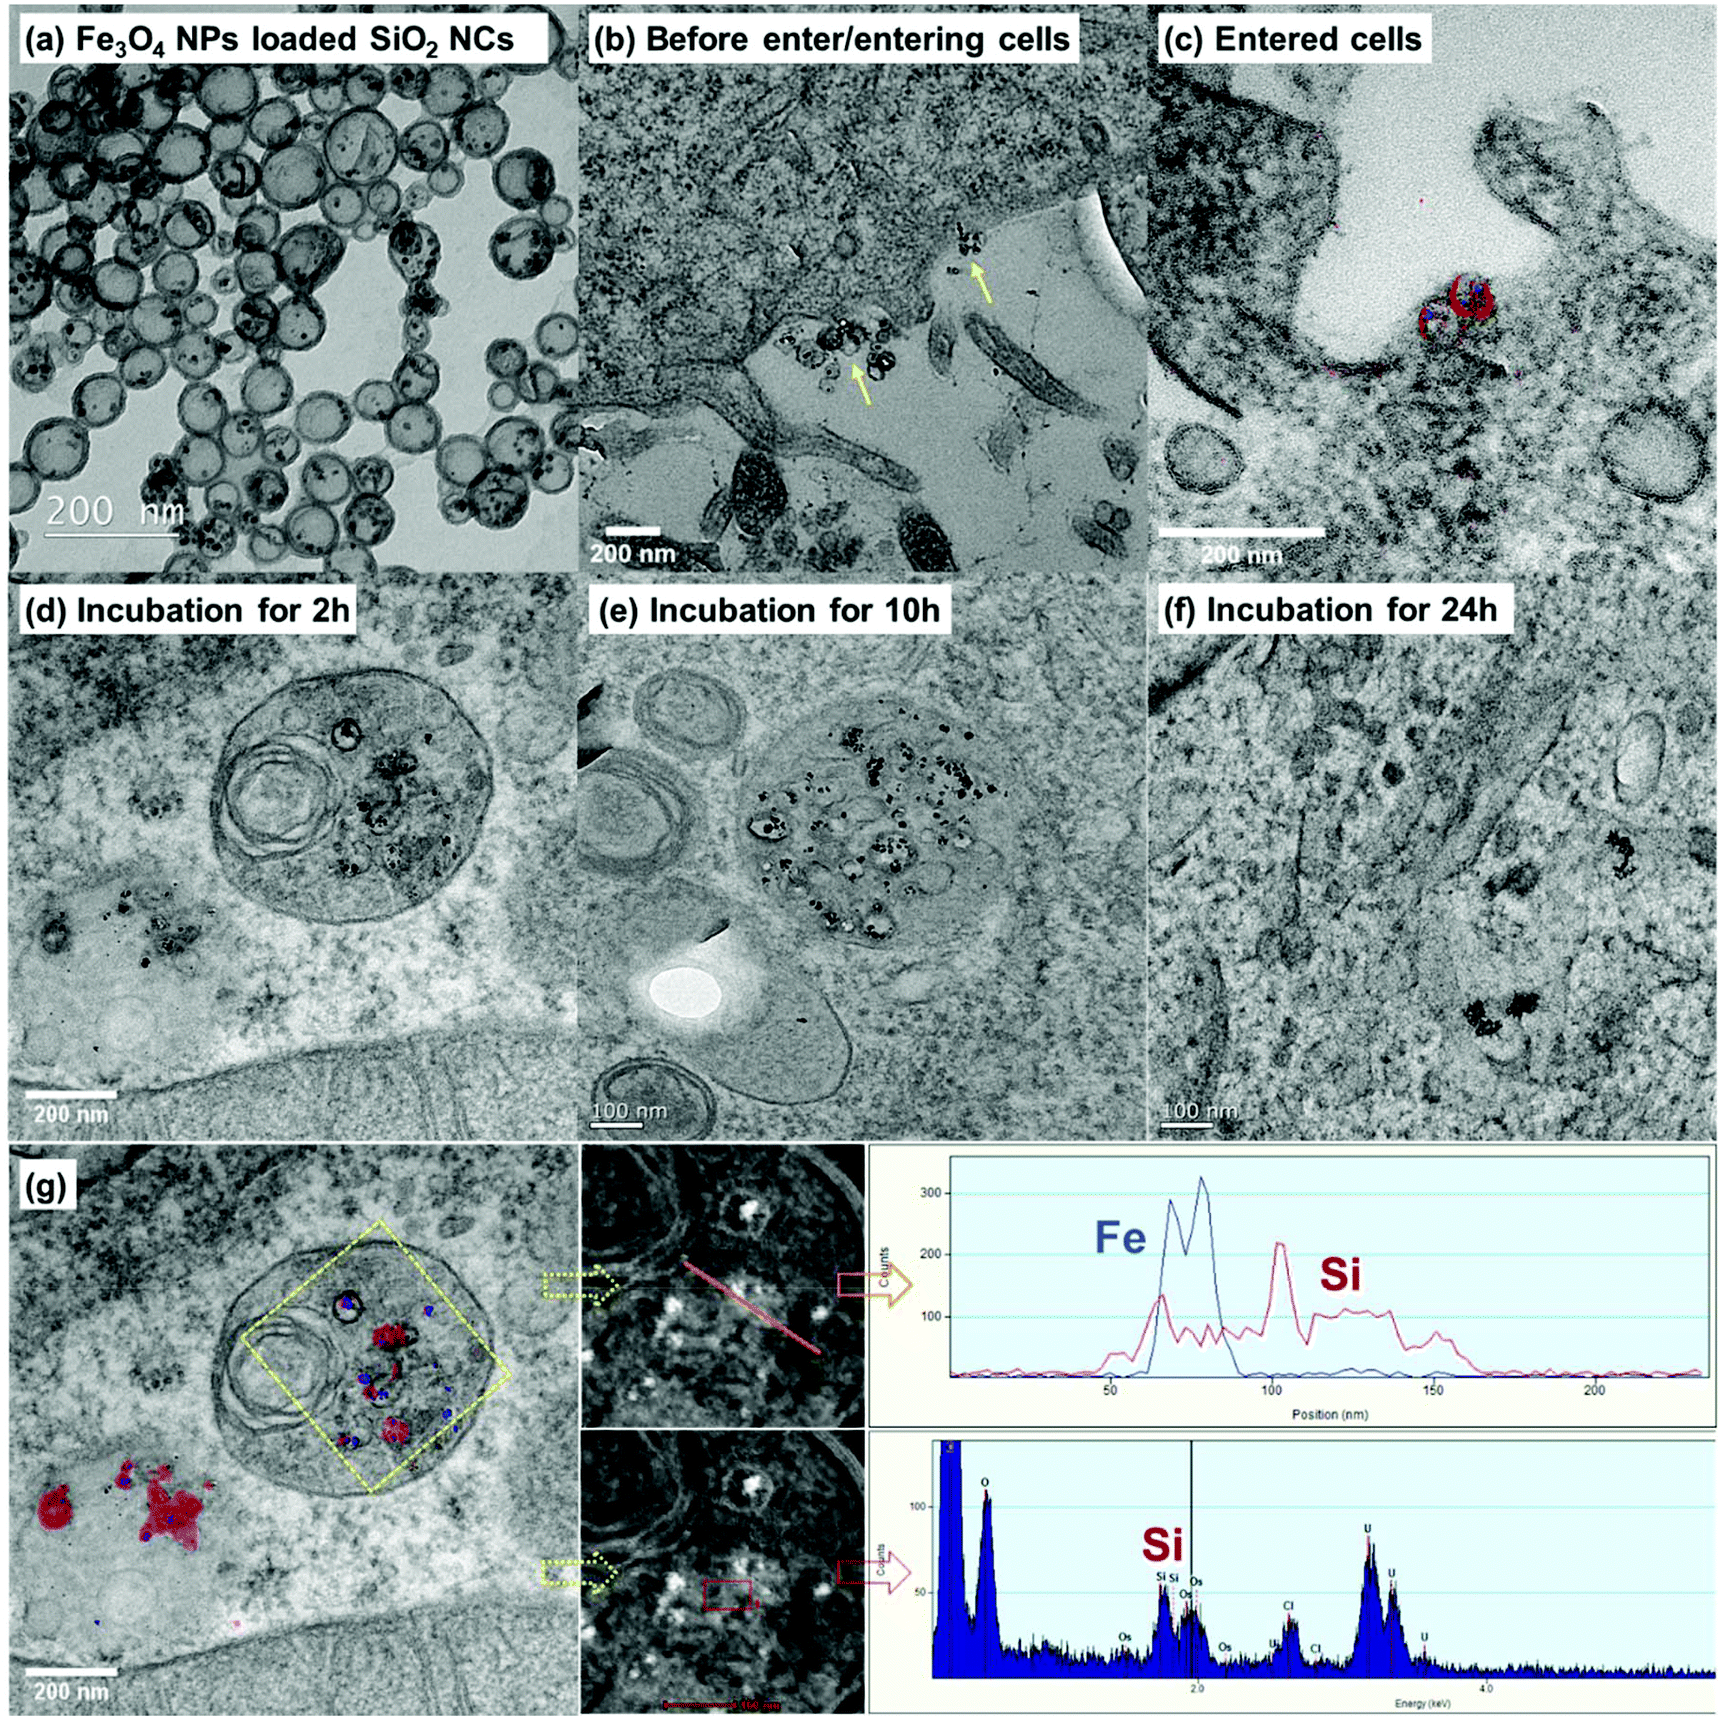 | ||
| Fig. 5 Cellular uptake and localization of iron oxide labeled SiO2 NCs in HeLa cells based on TEM and elemental mapping techniques. TEM micrographs of (a) Fe3O4 NPs labeled SiO2 NCs. (b) NCs that are entering cell membrane shown by yellow arrows. (c) NCs internalized in cell. (d–f) Localization of NCs in intracellular environments after incubation for 2, 10, and 24 h. (g) Blue color represents signal of iron and red color represents signal of silicon. | ||
Protein interaction and colloidal stability of SiO2 NCs in blood plasma
For successful in vivo application of nanocarriers as drug delivery vehicles, the nanocarriers need to remain colloidally stable in blood plasma. With dynamic light scattering, it is possible to directly monitor the aggregation state of nanocarriers in concentrated blood plasma.69,70 This method is suitable for screening the behavior of nanocarriers in blood plasma prior to in vivo investigations. The SiO2 NCs stabilized by cationic surfactant CTMA-Cl formed macroscopic aggregates in concentrated plasma. However, aggregation formation was significantly reduced after PEGylation of the NCs with the PEG-based nonionic surfactant Lutensol AT50 (Fig. 6). Surface charge of the NCs was reduced from +12 mV to ∼0 mV due to the removal of cationic surfactant (Fig. 2). With increased density of PEG chains on the surface, the SiO2 NCs became more stable in PBS and in blood plasma (Fig. S3†). Especially, going from 0.64 to 0.96 PEG chains per nm2 resulted in a major stability improvement, suggesting a certain threshold of required surface PEG density. While some aggregates of SiO2 NCs in blood plasma could still be observed after PEGylation, the intensity contribution factor of these larger species suggest that their actual concentration is very low compared to stable NCs (Fig. S3b†). The exemplary autocorrelation functions of the corresponding measured samples are given in Fig. S4.†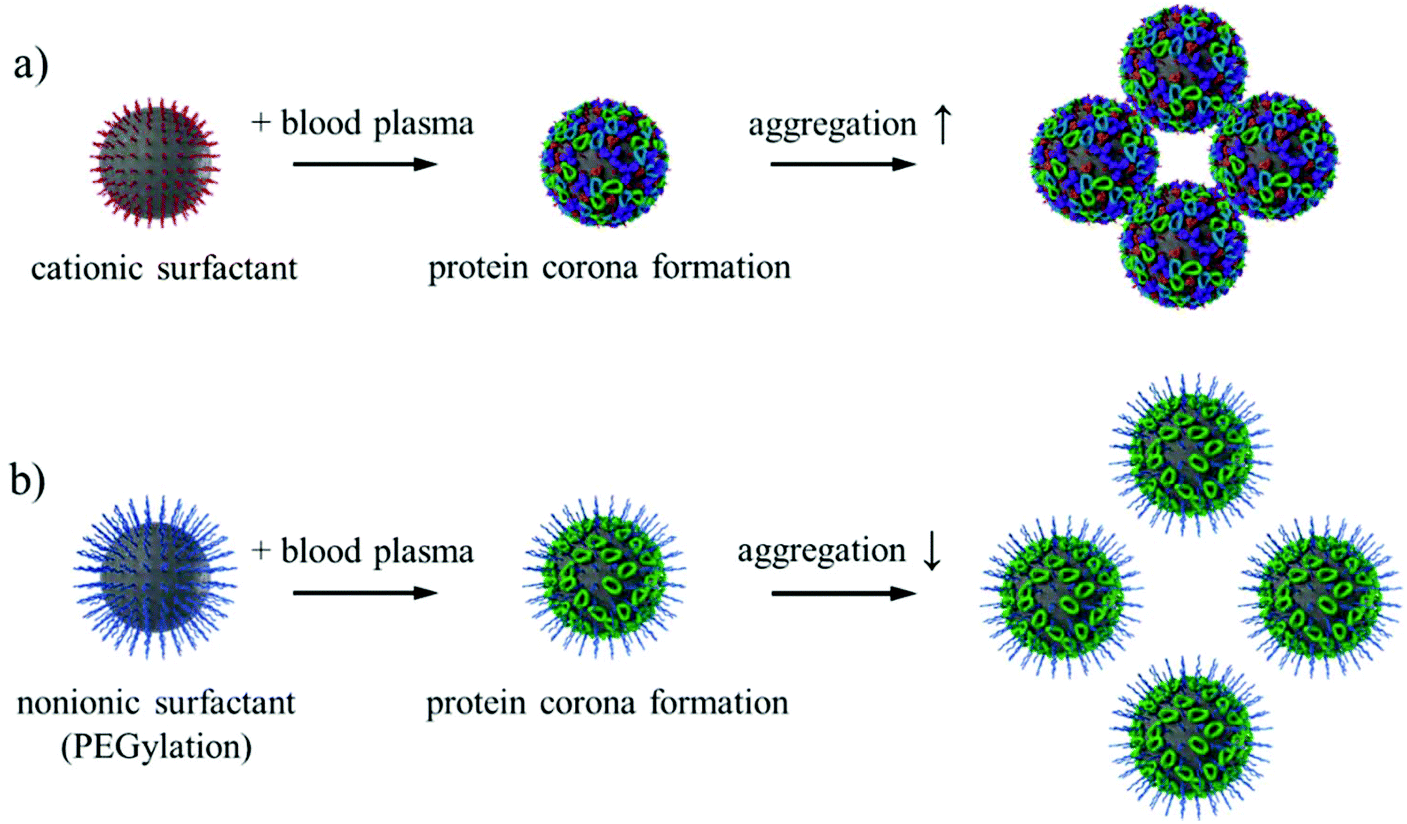 | ||
| Fig. 6 Schematic illustration of the aggregation state of SiO2 NCs stabilized with cationic surfactant CTMA-Cl and nonionic surfactant Lutensol AT50. | ||
Furthermore, it has been recognized in recent years that various blood components such as proteins and lipids rapidly interact with the nanocarriers and cover their surface upon entering of the nanocarriers into blood plasma.58,59 This process, coined ‘biomolecular corona formation’, has been shown to be a key parameter that mediates in vivo behavior of nanocarriers.60 As widely described in literature, PEGylated nanocarriers have a prolonged blood circulation time caused by reduced protein adsorption, which subsequently induces a lower cellular interaction with phagocytic cells (referred to as ‘stealth effect’).71,72 The PEGylated SiO2 NCs adsorbed a significantly lower amount of plasma proteins (2.8 ± 0.3 mg per m2 NC surface area) compared to non-PEGylated SiO2 NCs (7.7 ± 0.2 mg per m2 NC surface area; Fig. 7a). However, protein adsorption was not completely prevented, a phenomenon that was previously reported for PEGylated polystyrene nanoparticles.73,74 Through a detailed proteomic investigation, we were able to identify the key proteins that adsorbed onto the SiO2 NCs after incubation in blood plasma (Fig. 7c and d).
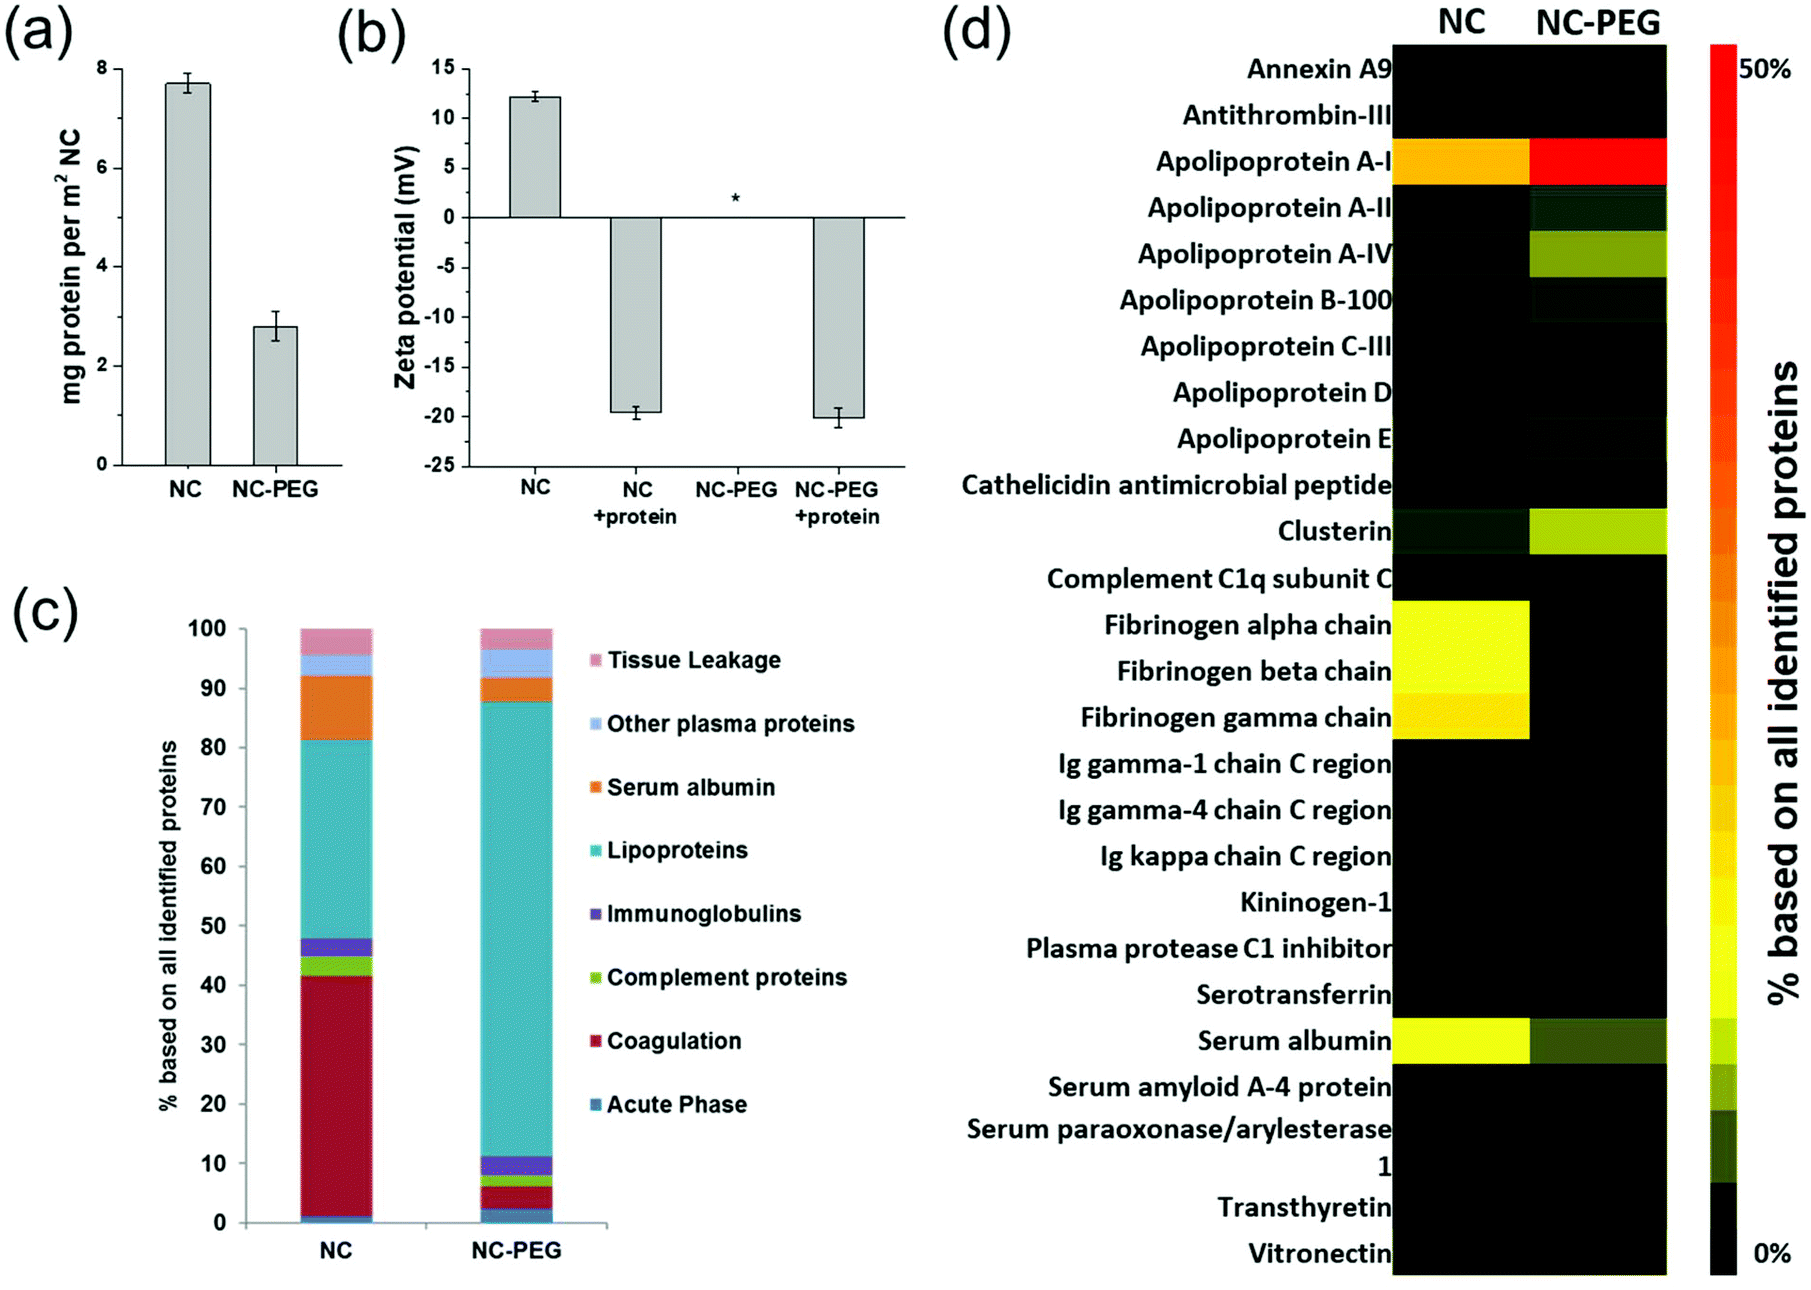 | ||
| Fig. 7 Analysis of the protein corona. (a) Absolute amount of corona proteins on PEGylated and non-PEGylated SiO2 NCs determined by Pierce Assay. (b) Zeta potential of SiO2 NC-PEG before or after incubation with blood plasma. (c) Isolated corona proteins identified by LC-MS. All proteins were categorized into eight different classes based on their biological function. (d) Heatmap displaying the most abundant proteins in the protein corona on SiO2 NCs before and after PEGylation. Only the proteins contributing to at least 1% of the protein corona on one of the nanocapsules are shown. Relative values (%) were calculated based on the absolute amount of each protein (fmol). A detailed list of all identified proteins is supplemented as Table S2.† | ||
We found that there was a significant change in the protein pattern after PEGylation of SiO2 NCs. Indeed, there was an overall increased amount of lipoproteins making up 76.4% of the total protein corona content, which specifically adsorbed to PEGylated SiO2 NCs in comparison to non-PEGylated capsules (Fig. 7c).75 Especially, the relative amount of apolipoprotein A-I, apolipoprotein A-IV, and clusterin increased. Clusterin, also known as apolipoprotein J, was identified as major component of various PEGylated nanocarriers and it was shown to display dysopsonic properties due to its ability to reduce interaction with phagocytic cells.74,76 Apolipoprotein A-I can substitute clusterin in this function.77–79 In contrast, non-PEGylated SiO2 NCs were surrounded by fibrinogen, which is a protein involved in blood coagulation and potentially mediates the aggregation of nanocapsules.80 In our case, the aggregation of CTMA-Cl stabilized NCs consequently most likely originated from the fibrinogen interactions due to their positively charged capsule surface.
The effect of protein corona on release profiles of drug from Fe3O4 NPs, polymer NCs, and commercial nanocarriers (Abraxane®, albumin-bound paclitaxel) was investigated.81 The protein corona was found to delay the release of drugs. The drug release profile of nanocarriers depended on their interaction with the protein corona, i.e. on the type and amount of associated proteins in the hard corona, and on the size/type of nanocarriers. The protein corona reduced the burst release effect for protein-conjugated drug and carriers with surface-loaded drug. However, drug release profiles of polymer NCs were only slightly influenced by the protein corona.
Next, we investigated the in vivo distribution of SiO2 NCs after intravenous injection in mice. The SiO2 NCs were covalently labeled with the NIR fluorophore Cy7.5 at various labeling densities (SiO2 NC-Cy7.5, NC-2 × Cy7.5, and NC-4 × Cy7.5) by coupling the amine-reactive molecular probe Cy7.5-NHS with 3-aminopropyltriethoxysilane. Injected NCs were accumulated in the liver at 30 min after intravenous injection whereas no signal was detected in the other organs (Fig. 8a and b). Total radiant efficiency of accumulated NCs in isolated livers increased when the labeling density of fluorophores increased in the NCs (Fig. 8c). This enrichment of nanocapsules in the livers underlines the suitability of SiO2 NCs as dexamethasone carrier for the treatment of inflammatory liver diseases such as alcoholic hepatitis, which are standardly treated with glucocorticoids.82
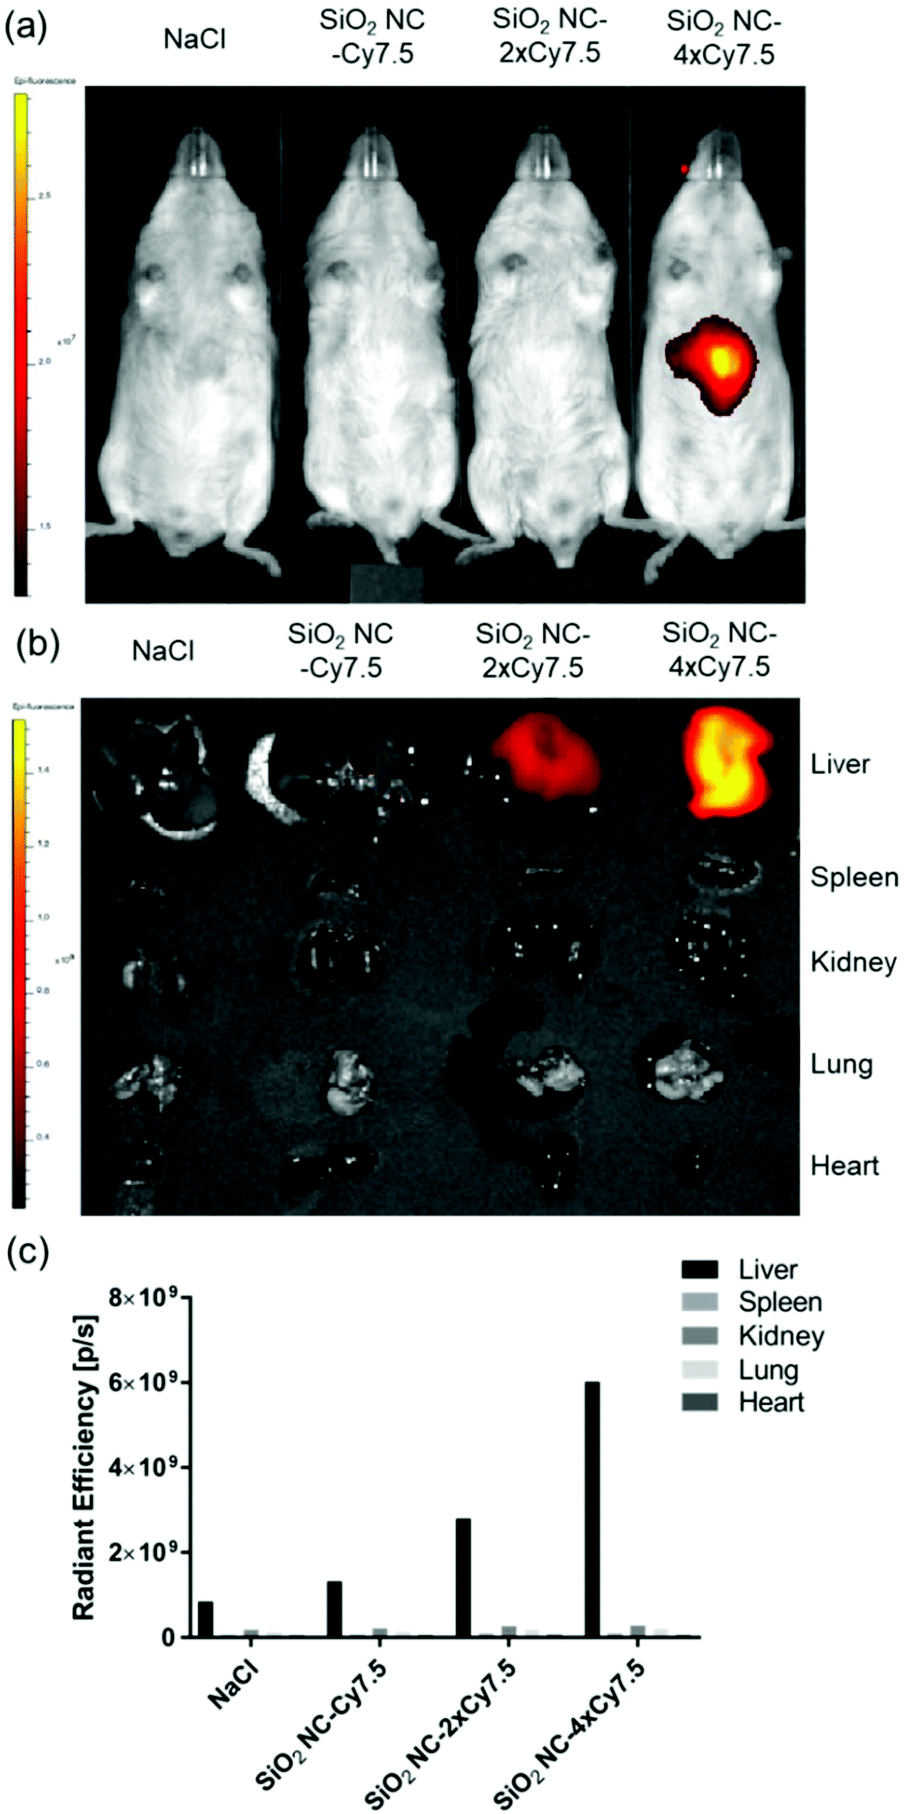 | ||
| Fig. 8 IVIS imaging of in vivo distribution of SiO2 NCs labeled with Cy7.5 observed at 30 min after intravenous injection in C57BL6/albino mice. (a) Epi-illumination image of mice. (b) Ex vivo imaging of separate organs. (c) Total radiant efficiencies of accumulated NCs in isolated organs. Data represent mean (n = 1). | ||
Conclusions
We developed core–shell silica nanocapsules displaying efficient and targeted delivery of dexamethasone for liver immunosuppressive therapy. The oil core could dissolve DXM at concentrations up to 100 mg mL−1 while the encapsulation efficiency was kept over 95% after 15 days. Therefore, side effects from premature leakage of DXM are expected to be significantly reduced. The SiO2-DXM NCs showed an effective suppression of inflammatory response of liver macrophages by reducing the secretion of inflammatory cytokines. Intracellular trafficking and degradation of NCs were investigated by labeling them with fluorescent dyes and magnetic nanoparticles. By a simple PEGylation process, controlled interactions with blood proteins and good colloidal stability of NCs in blood plasma were achieved with an efficient accumulation in the liver. The efficient encapsulation, multimodal labeling, controlled protein interaction, colloidal stability in blood, and enrichment in the liver underline the suitability of the SiO2 NCs as glucocorticoids carrier for the treatment of inflammatory liver diseases.Experimental section
Materials
Tetraethoxysilane (TEOS, Alfa Aesar, 98%), 3-aminopropyltrimethoxysilane (APTES, Alfa Aesar, >98%), hexadecane (Sigma Aldrich, 99%), olive oil (Sigma Aldrich, highly refined, low acidity), cetyltrimethylammonium chloride (CTMA-Cl, Acros Organics, 99%), Lutensol AT50 (BASF), dexamethasone (DXM, Sigma Aldrich, ≥98%), and sucrose (Sigma Aldrich, ≥99.5%) were used as received. Amine-reactive fluorescent dyes Cyanine5 NHS ester (Cy5-NHS) and Cyanine7.5 NHS ester (Cy7.5-NHS) were purchased from Lumiprobe GmbH, Germany. Human citrate plasma was obtained from the Department of Transfusion Medicine Mainz from ten healthy donors, pooled and stored at −80 °C. Prior to use, human plasma was centrifuged for 30 min at 20![[thin space (1/6-em)]](https://www.rsc.org/images/entities/char_2009.gif) 000g (4 °C) to remove aggregated proteins. Oleic acid capped iron oxide nanoparticles (Fe3O4 NPs) were synthesized according to a standard co-precipitation protocol.83
000g (4 °C) to remove aggregated proteins. Oleic acid capped iron oxide nanoparticles (Fe3O4 NPs) were synthesized according to a standard co-precipitation protocol.83
Synthesis of SiO2 NCs
SiO2 NCs were synthesized in an oil-in-water miniemulsion by using the surface of oil nanodroplets as template for the hydrolysis and condensation of alkoxysilanes. Specifically, 2.0 g (9.6 mmol) of TEOS was first mixed with 125 mg of hexadecane and 1 g of olive oil to form the oil phase. For cargo loading, various amounts of DXM or iron oxide nanoparticles were first dissolved in olive oil. In the second step, 30 mL of 0.77 mg mL−1 aqueous solution of CTMA-Cl was poured into the oil mixture under stirring. After a pre-emulsification step by stirring at 1000 rpm for 1 h, the obtained emulsion was sonicated by using a Branson 450 W sonifier with a 1/2′′ tip at 70% amplitude for 180 s (30 s of sonication, 10 s of pause) with ice cooling. The resulting miniemulsion was stirred at 1000 rpm for 12 h at room temperature to obtain an aqueous dispersion of SiO2 NCs. For the fluorescent labeling of SiO2 NCs, Cy5-NHS or Cy7.5-NHS was first coupled with APTES at a molar ratio of 1:1.1 to obtain fluorescently labeled silica precursors. The APTES-Cy5/7.5 conjugates were then mixed with TEOS as the silica source. The molar ratio of Cy5 with TEOS was 1:14000. For in vivo experiments, the molar ratio of Cy7.5 to TEOS was set as 1:14000, 1:7000, and 1:3500 for samples SiO2 NC-Cy7.5, NC-2 × Cy7.5, and NC-4 × Cy7.5, respectively.
PEGylation of SiO2 NCs and encapsulation efficiency of DXM
SiO2 NCs were PEGylated by replacing the templating surfactant CTMA-Cl by the nonionic surfactant Lutensol AT50. PEGylated nanocapsules were denoted as SiO2 NC-PEG. Specifically, 35 mg of Lutensol AT50 was added to 2 mL of SiO2 NCs dispersion. The dispersion was stirred at 1000 rpm for 2 h and then dialyzed against water with a dialysis tube with MWCO of 1000 g mol−1. In this case, CTMA-Cl (Mw = 320 g mol−1) could diffuse through the dialysis membrane into the aqueous dialysis medium while Lutensol AT50 (Mw = 2460 g mol−1) was kept inside. Dialysis media were changed three times per day until no DXM and CTMA-Cl were detected in the media by UV-Vis spectroscopy and HPLC, respectively. Encapsulation efficiency of DXM in NCs was expressed as the percentage of encapsulated DXM with respect to the initial amount of DXM. The calibration curve for the determination of DXM in water is shown in Fig. S5.† Afterwards, the dialyzed dispersion was centrifuged at 10k rpm to remove the excess of Lutensol AT50. The pellet was redispersed in water and the dispersion was stirred at 1000 rpm for 24 h.Protein corona analysis
000g, 1 h, 4 °C) and redispersed in PBS (1 mL). To remove loosely bound and unbound proteins, this purification procedure was repeated three times. Before the final washing step, the dispersion was transferred into a new Eppendorf-tube. After the last centrifugation step, the nanocapsule pellets were resuspended in a solution containing 2 wt% SDS and 62.5 mM Tris*HCl. The suspension was incubated at 95 °C for 5 min to detach the corona proteins. The sample was then centrifuged (20000g, 1 h, 4 °C) and the supernatant was taken for protein corona analysis.
000g, 10 min) and resuspended with RapiGest SF (Waters) in ammonium bicarbonate (50 mM). The protein solution was reduced with dithiothreitol (Sigma) at a concentration of 5 mM for 45 min at 56 °C and alkylated with 15 mM idoacetoamide (Sigma) for 1 h in the dark. Tryptic digestion (protein:trypsin ratio 50:1) was carried out for 18 h at 37 °C. Afterwards, the reaction was quenched with 2 μL hydrochloric acid (Sigma).
Tryptic peptides were diluted with 0.1% formic acid spiked with 50 fmol μL−1 Hi3 E. coli (Waters) for absolute protein quantification. The peptide solution was injected into a nanoACQUITY UPLC system coupled to a Synapt G2-Si mass spectrometer. The system was operated in resolution mode, with a NanoLockSpray source in positive ion mode. Data-independent acquisition (MSE) experiments were performed and data was analyzed with MassLynx 4.1.
Proteins were identified with Progenesis GI (2.0) using a reviewed human database downloaded from Uniprot. For analysis, the following criteria were chosen: max. protein mass 600 kDa, one missed cleavage, fixed modifications for carbamidomethyl and cysteine, variable oxidation for methionine, and a false discovery rate of 4%. Peptide identification requires three identified fragments and for proteins identification five identified fragments and two peptides are needed. Based on the TOP3/Hi3 quantification the amount of each protein in fmol is provided.86 All identified proteins are summarized in a separate Excel file as ESI.†
TEM analysis
Sapphire disks (3 mm; M. Wohlwend GmbH) were pre-coated with a 10 nm-thick carbon layer using an EM MED020 instrument (Leica). The coated sapphire disks were dried and sterilized in an oven at 120 °C overnight before use. HeLa cells were seeded onto sapphire disks in 12-well plates overnight for cell attachment. SiO2 NCs (loaded with Fe3O4 NPs) were incubated with HeLa Cells at 75 μg ml−1 for 2 h, 10 h, and overnight in a humidified incubator at 37 °C and 5% CO2. After the incubation, each sapphire disk was collected from the 12-well plates and slightly immersed into 1-hexadecene before placing them between two aluminum plates (3 mm, Plano). This “sandwich” structure was placed into a specimen holder for high pressure freezing in a Wohlwend HPF Compact 01 high pressure freezer with a pressure of 2100 bar for 2–3 s. The specimen holder was withdrawn from the freezer and immersed into liquid nitrogen to release the sample. The frozen sample was then labeled and stored in a container filled with liquid nitrogen. Subsequently, freeze substitution of the sample was carried out in a 0.5 ml Eppendorf tube using an AFS2 automated freeze substitution device (Leica). Each tube contained 1 ml of freeze substitution solution, consisting of 0.2 wt/vol% osmium tetroxide, 0.1 wt/vol% uranyl acetate, and 5% distilled water in acetone. The tubes were firstly kept at −90 °C and slowly warmed up to 0 °C in 24 h. After keeping at room temperature for 1 h, the substitution solution was removed and the samples were washed 3 times with acetone. Each sample was infiltrated in an ascending epoxy resin series (30%, 50%, and 75% in acetone) for 1 h before finally infiltration in 100% epoxy resin overnight. Finally, each sample was transferred into a new Eppendorf tube containing freshly prepared pure epoxy resin for polymerization at 60 °C for 24 h. After polymerization, sample blocks were kept at room temperature until their sectioning. Sample blocks for each time point were trimmed and sectioned into 100 nm sections by a 45° diamond knife (Diatome) in EM UC6 ultramicrotome (Leica). Sections were then carefully placed onto 300-mesh copper grid for standard bright-field, electron energy loss spectroscopy (EELS), and energy dispersive X-ray spectroscopy (EDX) analysis in Tecnai F20 200 kV transmission electron microscope (TEM) (FEI). Bright-field TEM micrographs were obtained with a Gatan US1000 2k CCD camera. EDX images were collected with an EDAX detector.Isolation of non-parenchymal liver cells and stimulation with SiO2 NCs
Six to eight-week old female C57BL/6J mice were obtained from Janvier (Le Genest-Saint-Isle, France). All mice were kept under a 12 h dark/12 h light cycle (with food and water supply ad libitum) in the animal facility of the Translational Animal Research Center, University Medical Center Mainz, Germany. The animals were treated in accordance with NIH publications entitled “Principles for Use of Animals” and “Guide for the Care and Use of Laboratory Animals”. All protocols have been approved by the local Animal Care and Use Committee (“Landesuntersuchungsamt Rheinland-Pfalz”). The murine non-parenchymal liver cells (NPCs) were isolated from livers as previously reported.87,88 Briefly, mice were anesthetized with Ketamin/Rompun and livers were perfused with cold 20 ml Ca2+- and Mg2+-free Hank's Balanced Salt Solution (HBSS; Sigma-Aldrich, St Louis, USA) containing 100 U l−1 collagenase A (Roche Diagnostics GmbH, Mannheim, Germany), 5% heat-inactivated fetal calf serum (FCS, GE Healthcare Life Sciences, Chalfont St Giles, UK), and 10 μg ml−1 DNase I (AppliChem, Darmstadt, Germany). Following dissection, the livers were incubated for 15 min at 37 °C and grinded through a 70 μm cell strainer to generate single cell suspensions. Hepatocytes were pelleted and discarded after centrifugation for 15 min at 4 °C and 30g. The non-parenchymal cell fraction remaining in the supernatant was further purified by centrifugation at 300g, resuspended in Histodenz solution in HBSS to reach a final concentration of 20% and overlaid with HBSS, followed by centrifugation at 1500g for 20 min. NPCs were collected at the Histodenz/HBSS interface and washed with RPMI 1640 medium containing 5% FCS and 1% penicillin/streptomycin. The cell suspension was then cultured in HEPES-buffered RPMI 1640 medium containing 10% FCS, 1% penicillin/streptomycin, 1 mM L-glutamine, 1% essential and non-essential amino acids, 1 mM sodium pyruvate, 50 nM β-mercaptoethanol, and with or without 2.5 μg ml−1 lipopolysaccharide (LPS) at concentration of 106 NPCs ml−1. Different formulations of SiO2 NCs containing cy5 or DXM as well as soluble DXM-phosphate were added at different concentrations and incubated for 24 h as indicated.Toxicity and uptake of SiO2 NCs and cytokine secretion
Toxicity and uptake of SiO2 NC by NPCs was analyzed by propidium iodide (PI, BD Pharmingen) staining (5 μl per sample) and subsequent flow cytometric quantification (BD LSR II) of PI and NC positive cells. Interleukin-6 (IL-6) levels in cell culture supernatants were analyzed using an enzyme-linked immunosorbent assay kit (ThermoFisher) according to manufacturer's instructions.In vivo imaging of SiO2 NCs
C57BL6/Albino mice were depilated at the abdominal and thoracic zone and the corresponding dorsal areas 400 μg of SiO2 NCs labeled with increasing concentrations of Cy7.5 were injected intravenously and mice were analyzed 30 min after injection using the IVIS SpectrumCT imager (PerkinEllmer, Waltham, USA) and the Living Image Software 4.5. Subsequently, mice were sacrificed and the organs (liver, spleen, kidneys, lungs, heart) were isolated and analyzed again.Characterization
Hydrodynamic diameters of SiO2 NCs were measured by dynamic light scattering (DLS) with a Nicomp particle sizer (Model 380, PSS, Santa Barbara, CA) at a fixed scattering angle of 90°. The morphology of nanocapsules was examined with a Gemini 1530 (Carl Zeiss AG, Oberkochem, Germany) scanning electron microscope (SEM) operating at 0.35 kV and a Jeol 1400 (Jeol Ltd, Tokyo, Japan) transmission electron microscope operating at an accelerating voltage of 120 kV. SEM and TEM samples of nanocapsules were prepared by casting the diluted dispersions on silicon wafers and carbon layer-coated copper grids, respectively. The capsule dispersions were dialyzed against Milli-Q water for 3 days to remove the surfactant. The dialyzed dispersions were then freeze-dried for 48 h and degassed at 70 °C under high vacuum for at least 12 h before measurements. The specific surface area was calculated using the Brunauer–Emmett–Teller (BET) equation based on data points obtained from 0 < P/P0 < 0.25. Zeta potential measurements were performed in 10−3 M potassium chloride solution at pH 6.8 and 25 °C with a Malvern Zeta sizer (Malvern Instruments, UK). Solid content of the capsule dispersion was measured gravimetrically. Quantitative 29Si MAS-NMR spectra were recorded with a Bruker Avance II spectrometer according to our previous work.89 Numbers of CTMA-Cl and Lutensol AT50 molecules per NC and per nm2 surface were calculated by dividing the number of surfactant molecules by the number and total surface area of NCs, respectively. The number of NCs in dispersion was determined based on the solid content of the dispersion and the mass of single NC. Multiangle DLS measurements were performed using an instrument from ALV (Langen, Germany) with an electronically controlled goniometer and an ALV-5000 multiple τ full-digital correlator with 320 channels for measurements in the range between 10−7 s and 103 s. The source of light was a helium–neon laser of the Type 1145 P from JDS Uniphase (Milpitas, USA) with 632.8 nm wavelength and 25 mV output power. Before the measurements, PBS or undiluted human plasma was filtered through Millex-LCR filters (Merck Millipore, Billerica, USA) with 450 nm pore size into quartz cuvettes with an inner radius of 9 mm for light scattering from Hellma (Müllheim, Germany). After filtration of the eluent, 2 μL of the NC dispersions (30 mg mL−1) were added. Prior to use, the quartz cuvettes were cleaned with acetone using a Thurmond apparatus.90 For data analysis, a robust multicomponent fit method reported by Rausch et al.70 was used. UV-Vis absorption spectra of DXM solution were recorded with a PerkinElmer Lambda 25 UV-Vis spectrometer. Gradient centrifugation experiments were performed at 4 °C and 5000 rpm for 3 h in a Rotixa 50RS ultracentrifuge, Hettich. Sucrose solutions with densities ranging between 1.00 and 1.30 g cm−3 were used.Conflicts of interest
There are no conflicts to declare.Acknowledgements
We acknowledge Stefan Schuhmacher for scheme drawing. Open Access funding provided by the Max Planck Society. SJ, DC, and KL are grateful to the Max Planck-VISTEC Partner Laboratory for Sustainable Materials. MM acknowledges the fellowship of the DAAD for a training period in the frame of a PhD work at IIBYT (CONICET-Universidad Nacional de Córdoba) as a doctoral fellow from CONICET, Argentina.References
- G. Mieli-Vergani and D. Vergani, Best Pract. Res., Clin. Gastroenterol., 2011, 25, 783–795 CrossRef PubMed.
- L. W. Doyle, R. A. Ehrenkranz and H. L. Halliday, Neonatology, 2010, 98, 217–224 CrossRef CAS PubMed.
- C.-M. Ho, H.-L. Wu, S.-T. Ho and J.-J. Wang, Acta Anaesthesiol. Taiwan., 2011, 49, 100–104 CrossRef PubMed.
- V. Krishnan, X. Xu, S. P. Barwe, X. Yang, K. Czymmek, S. A. Waldman, R. W. Mason, X. Jia and A. K. Rajasekaran, Mol. Pharm., 2013, 10, 2199–2210 CrossRef CAS PubMed.
- J. Urbańska, A. Karewicz and M. Nowakowska, J. Life Sci., 2014, 96, 1–6 CrossRef PubMed.
- N. J. London, A. Chiang and J. A. Haller, Adv. Ther., 2011, 28, 351–366 CrossRef CAS PubMed.
- R. L. Meyers, L. S. Book, M. A. O'Gorman, W. D. Jackson, R. E. Black, D. G. Johnson and M. E. Matlak, J. Pediatr. Surg., 2003, 38, 406–411 CrossRef PubMed.
- M. Hegeman, P. Cobelens, J. Kamps, M. Hennus, N. Jansen, M. Schultz, A. Van Vught, G. Molema and C. Heijnen, Br. J. Pharmacol., 2011, 163, 1048–1058 CrossRef CAS PubMed.
- B. N. Melgert, P. Olinga, J. M. Van Der Laan, B. Weert, J. Cho, D. Schuppan, G. M. Groothuis, D. K. Meijer and K. Poelstra, Hepatology, 2001, 34, 719–728 CrossRef CAS PubMed.
- J. Napp, M. A. Markus, J. G. Heck, C. Dullin, W. Möbius, D. Gorpas, C. Feldmann and F. Alves, Theranostics, 2018, 8, 6367 CrossRef CAS PubMed.
- L. Michelle, L. C. Peter and K. Hisataka, Curr. Top. Med. Chem., 2008, 8, 1180–1186 CrossRef PubMed.
- M. D. Joshi and R. Müller, Eur. J. Pharm. Biopharm., 2009, 71, 161–172 CrossRef CAS.
- M.-T. Wang, Y. Jin, Y.-X. Yang, C.-Y. Zhao, H.-Y. Yang, X.-F. Xu, X. Qin, Z.-D. Wang, Z.-R. Zhang and Y.-L. Jian, Int. J. Nanomed., 2010, 5, 487 CAS.
- K. Poelstra, J. Prakash and L. Beljaars, J. Controlled Release, 2012, 161, 188–197 CrossRef CAS PubMed.
- N.-N. Li, J. Lin, D. Gao and L.-M. Zhang, J. Colloid Interface Sci., 2014, 417, 301–309 CrossRef CAS PubMed.
- D. Wang, S. C. Miller, X.-M. Liu, B. Anderson, X. S. Wang and S. R. Goldring, Arthritis Res. Ther., 2007, 9, R2 CrossRef PubMed.
- X.-M. Liu, L.-D. Quan, J. Tian, Y. Alnouti, K. Fu, G. M. Thiele and D. Wang, Pharm. Res., 2008, 25, 2910–2919 CrossRef CAS PubMed.
- K. Ren, A. Dusad, F. Yuan, H. Yuan, P. E. Purdue, E. V. Fehringer, K. L. Garvin, S. R. Goldring and D. Wang, J. Controlled Release, 2014, 175, 1–9 CrossRef CAS PubMed.
- H. Krakovičová, T. Etrych and K. Ulbrich, Eur. J. Pharm. Sci., 2009, 37, 405–412 CrossRef PubMed.
- M. D. Howard, A. Ponta, A. Eckman, M. Jay and Y. Bae, Pharm. Res., 2011, 28, 2435–2446 CrossRef CAS PubMed.
- A. G. Bajpayee, M. A. Quadir, P. T. Hammond and A. J. Grodzinsky, Osteoarthrotic Cartilage, 2016, 24, 71–81 CrossRef CAS PubMed.
- D. Funk, H.-H. Schrenk and E. Frei, J. Drug Targeting, 2011, 19, 434–445 CrossRef CAS PubMed.
- C. Wang, H. Hou, K. Nan, M. J. Sailor, W. R. Freeman and L. Cheng, Exp. Eye Res., 2014, 129, 74–82 CrossRef CAS PubMed.
- Y. Zhao, C. Wei, X. Chen, J. Liu, Q. Yu, Y. Liu and J. Liu, ACS Appl. Mater. Interfaces, 2019, 11, 11587–11601 CrossRef CAS.
- N.-N. Li, J. Lin, D. Gao and L.-M. Zhang, J. Colloid Interface Sci., 2014, 417, 301–309 CrossRef CAS.
- T. Numpilai, T. Witoon, M. Chareonpanich and J. Limtrakul, Appl. Surf. Sci., 2017, 396, 504–514 CrossRef CAS.
- S. L. Timofeevski, E. F. Panarin, O. L. Vinogradov and M. V. Nezhentsev, Pharm. Res., 1996, 13, 476–480 CrossRef CAS PubMed.
- N. Butoescu, C. A. Seemayer, M. Foti, O. Jordan and E. Doelker, Biomaterials, 2009, 30, 1772–1780 CrossRef CAS PubMed.
- J. S. Park, H. N. Yang, S. Y. Jeon, D. G. Woo, M. S. Kim and K.-H. Park, Biomaterials, 2012, 33, 8600–8612 CrossRef CAS PubMed.
- L. Zhang, Y. Li, C. Zhang, Y. Wang and C. Song, Int. J. Nanomed., 2009, 4, 175 CrossRef CAS PubMed.
- C. Song, V. Labhasetwar, H. Murphy, X. Qu, W. Humphrey, R. Shebuski and R. Levy, J. Controlled Release, 1997, 43, 197–212 CrossRef.
- C. Fornaguera, M. Llinàs, C. Solans and G. Calderó, Colloids Surf., B, 2015, 125, 58–64 CrossRef CAS PubMed.
- C. Gómez-Gaete, E. Fattal, L. Silva, M. Besnard and N. Tsapis, J. Controlled Release, 2008, 128, 41–49 CrossRef PubMed.
- J. Cao, M. Naeem, J.-K. Noh, E. H. Lee and J.-W. Yoo, Macromol. Res., 2015, 23, 485–492 CrossRef CAS.
- J. Panyam, D. Williams, A. Dash, D. Leslie-Pelecky and V. Labhasetwar, J. Pharm. Sci., 2004, 93, 1804–1814 CrossRef CAS PubMed.
- D.-H. Kim and D. C. Martin, Biomaterials, 2006, 27, 3031–3037 CrossRef CAS PubMed.
- C. Gómez-Gaete, N. Tsapis, M. Besnard, A. Bochot and E. Fattal, Int. J. Pharm., 2007, 331, 153–159 CrossRef PubMed.
- C. Ruy, S. Silvia, J. F. Rodrigo, B. M. Cecília, I. Barcellos and J. A. Funck, Acta Farm. Bonaerense, 2003, 22, 11–15 Search PubMed.
- N. Döge, S. Hönzke, F. Schumacher, B. Balzus, M. Colombo, S. Hadam, F. Rancan, U. Blume-Peytavi, M. Schäfer-Korting and A. Schindler, J. Controlled Release, 2016, 242, 25–34 CrossRef PubMed.
- M. Argenziano, C. Dianzani, B. Ferrara, S. Swaminathan, A. Manfredi, E. Ranucci, R. Cavalli and P. Ferruti, Gels, 2017, 3, 22 CrossRef PubMed.
- O. F. Turkoglu, H. Eroglu, O. Okutan, E. Burul, M. F. Sargon, N. Özer, L. Öner and E. Beskonaklı, Surg. Neurol., 2005, 64, S11–S16 CrossRef PubMed.
- M. Ryu, T. Nakazawa, T. Akagi, T. Tanaka, R. Watanabe, M. Yasuda, N. Himori, K. Maruyama, T. Yamashita and T. Abe, J. Controlled Release, 2011, 151, 65–73 CrossRef CAS PubMed.
- L. Serpe, R. Canaparo, M. Daperno, R. Sostegni, G. Martinasso, E. Muntoni, L. Ippolito, N. Vivenza, A. Pera and M. Eandi, Eur. J. Pharm. Sci., 2010, 39, 428–436 CrossRef CAS PubMed.
- R. Beck, A. Pohlmann, C. Hoffmeister, M. Gallas, E. Collnot, U. Schaefer, S. Guterres and C. Lehr, Eur. J. Pharm. Biopharm., 2007, 67, 18–30 CrossRef CAS PubMed.
- F. Rafie, Y. Javadzadeh, A. R. Javadzadeh, L. A. Ghavidel, B. Jafari, M. Moogooee and S. Davaran, Curr. Eye Res., 2010, 35, 1081–1089 CrossRef CAS PubMed.
- J. Schmidt, J. M. Metselaar, M. H. M. Wauben, K. V. Toyka, G. Storm and R. Gold, Brain, 2003, 126, 1895–1904 CrossRef PubMed.
- J. M. Metselaar, M. H. M. Wauben, J. P. A. Wagenaar-Hilbers, O. C. Boerman and G. Storm, Arthritis Rheum., 2003, 48, 2059–2066 CrossRef CAS PubMed.
- J. M. Metselaar, W. B. van den Berg, A. E. M. Holthuysen, M. H. M. Wauben, G. Storm and P. L. E. M. van Lent, Ann. Rheum. Dis., 2004, 63, 348–353 CrossRef CAS.
- Y. Avnir, R. Ulmansky, V. Wasserman, S. Even-Chen, M. Broyer, Y. Barenholz and Y. Naparstek, Arthritis Rheum., 2008, 58, 119–129 CrossRef CAS.
- X. Luo, C. Matranga, S. Tan, N. Alba and X. T. Cui, Biomaterials, 2011, 32, 6316–6323 CrossRef CAS PubMed.
- Q. Pan, Q. Xu, N. J. Boylan, N. W. Lamb, D. G. Emmert, J.-C. Yang, L. Tang, T. Heflin, S. Alwadani and C. G. Eberhart, J. Controlled Release, 2015, 201, 32–40 CrossRef CAS PubMed.
- N. J. Kenyon, J. M. Bratt, J. Lee, J. Luo, L. M. Franzi, A. A. Zeki and K. S. Lam, PLoS One, 2013, 8, e77730 CrossRef CAS PubMed.
- A. Lee, C. De Mei, M. Fereira, R. Marotta, H. Y. Yoon, K. Kim, I. C. Kwon and P. Decuzzi, Theranostics, 2017, 7, 3653 CrossRef CAS PubMed.
- R. B. Friedrich, M. C. Fontana, R. C. R. Beck, A. R. Pohlmann and S. S. Guterres, Quim. Nova, 2008, 31, 1131–1136 CrossRef CAS.
- X.-M. Liu, L.-D. Quan, J. Tian, F. C. Laquer, P. Ciborowski and D. Wang, Biomacromolecules, 2010, 11, 2621–2628 CrossRef CAS PubMed.
- N. Butoescu, O. Jordan, A. Petri-Fink, H. Hofmann and E. Doelker, J. Microencapsulation, 2008, 25, 339–350 CrossRef CAS PubMed.
- M. Bartneck, K. M. Scheyda, K. T. Warzecha, L. Y. Rizzo, K. Hittatiya, T. Luedde, G. Storm, C. Trautwein, T. Lammers and F. Tacke, Biomaterials, 2015, 37, 367–382 CrossRef CAS PubMed.
- I. Lynch, A. Salvati and K. A. Dawson, Nat. Nanotechnol., 2009, 4, 546 CrossRef CAS PubMed.
- C. D. Walkey and W. C. W. Chan, Chem. Soc. Rev., 2012, 41, 2780–2799 RSC.
- R. M. Pearson, V. V. Juettner and S. Hong, Front. Chem., 2014, 2, 108 Search PubMed.
- A. Maity, R. Belgamwar and V. Polshettiwar, Nat. Protoc., 2019, 14, 2177–2204 CrossRef CAS PubMed.
- A. P. Philipse, M. P. Van Bruggen and C. Pathmamanoharan, Langmuir, 1994, 10, 92–99 CrossRef CAS.
- D. Wibowo, Y. Hui, A. P. J. Middelberg and C.-X. Zhao, Adv. Colloid Interface Sci., 2016, 236, 83–100 CrossRef CAS PubMed.
- I.-Y. Kim, E. Joachim, H. Choi and K. Kim, Nanomedicine, 2015, 11, 1407–1416 CrossRef CAS PubMed.
- Q. Wu, Y. Hou, G. Han, X. Liu, X. Tang, H. Li, X. Song and G. Zhang, Nanomedicine, 2017, 12, 2699–2711 CrossRef CAS PubMed.
- S. Behzadi, V. Serpooshan, W. Tao, M. A. Hamaly, M. Y. Alkawareek, E. C. Dreaden, D. Brown, A. M. Alkilany, O. C. Farokhzad and M. Mahmoudi, Chem. Soc. Rev., 2017, 46, 4218–4244 RSC.
- Q. He, J. Shi, M. Zhu, Y. Chen and F. Chen, Microporous Mesoporous Mater., 2010, 131, 314–320 CrossRef CAS.
- V. Cauda, A. Schlossbauer and T. Bein, Microporous Mesoporous Mater., 2010, 132, 60–71 CrossRef CAS.
- K. Mohr, M. Sommer, G. Baier, S. Schöttler, P. Okwieka, S. Tenzer, K. Landfester, V. Mailänder, M. Schmidt and R. G. Meyer, J. Nanomed. Nanotechnol., 2014, 5, 193 Search PubMed.
- K. Rausch, A. Reuter, K. Fischer and M. Schmidt, Biomacromolecules, 2010, 11, 2836–2839 CrossRef CAS PubMed.
- D. E. Owens III and N. A. Peppas, Int. J. Pharm., 2006, 307, 93–102 CrossRef PubMed.
- S. Salmaso and P. Caliceti, J. Drug Delivery, 2013, 2013 Search PubMed.
- J. Müller, K. N. Bauer, D. Prozeller, J. Simon, V. Mailänder, F. R. Wurm, S. Winzen and K. Landfester, Biomaterials, 2017, 115, 1–8 CrossRef PubMed.
- S. Schöttler, G. Becker, S. Winzen, T. Steinbach, K. Mohr, K. Landfester, V. Mailänder and F. R. Wurm, Nat. Nanotechnol., 2016, 11, 372–377 CrossRef PubMed.
- S. Schöttler, K. Landfester and V. Mailänder, Angew. Chem., Int. Ed., 2016, 55, 8806–8815 CrossRef PubMed.
- M. Aoyama, K. Hata, K. Higashisaka, K. Nagano, Y. Yoshioka and Y. Tsutsumi, Biochem. Biophys. Res. Commun., 2016, 480, 690–695 CrossRef CAS PubMed.
- J. Simon, J. Müller, A. Ghazaryan, S. Morsbach, V. Mailänder and K. Landfester, Nanoscale, 2018, 10, 21096–21105 RSC.
- N. Bertrand, P. Grenier, M. Mahmoudi, E. M. Lima, E. A. Appel, F. Dormont, J.-M. Lim, R. Karnik, R. Langer and O. C. Farokhzad, Nat. Commun., 2017, 8, 777 CrossRef PubMed.
- M. Kokkinopoulou, J. Simon, K. Landfester, V. Mailänder and I. Lieberwirth, Nanoscale, 2017, 9, 8858–8870 RSC.
- R. Cukalevski, S. A. Ferreira, C. J. Dunning, T. Berggård and T. Cedervall, Nano Res., 2015, 8, 2733–2743 CrossRef CAS.
- S. Behzadi, V. Serpooshan, R. Sakhtianchi, B. Müller, K. Landfester, D. Crespy and M. Mahmoudi, Colloids Surf., B, 2014, 123, 143–149 CrossRef CAS PubMed.
- B. Saberi, A. S. Dadabhai, Y.-Y. Jang, A. Gurakar and E. Mezey, J. Clin. Transl. Hepatol., 2016, 4, 113 Search PubMed.
- M. B. Bannwarth, S. W. Kazer, S. Ulrich, G. Glasser, D. Crespy and K. Landfester, Angew. Chem., Int. Ed., 2013, 52, 10107–10111 CrossRef CAS PubMed.
- M. Kokkinopoulou, J. Simon, K. Landfester, V. Mailänder and I. Lieberwirth, Nanoscale, 2017, 9, 8858–8870 RSC.
- J. Simon, T. Wolf, K. Klein, K. Landfester, V. Mailänder and F. R. Wurm, Angew. Chem., Int. Ed., 2018, 57, 5548–5553 CrossRef CAS PubMed.
- J. C. Silva, M. V. Gorenstein, G.-Z. Li, J. P. Vissers and S. J. Geromanos, Mol. Cell. Proteomics, 2006, 5, 144–156 CrossRef CAS PubMed.
- S. Gehring, E. M. Dickson, M. E. San Martin, N. van Rooijen, E. F. Papa, M. W. Harty, T. F. Tracy Jr. and S. H. Gregory, Gastroenterology, 2006, 130, 810–822 CrossRef CAS PubMed.
- M. Fichter, G. Baier, M. Dedters, L. Pretsch, A. Pietrzak-Nguyen, K. Landfester and S. Gehring, Nanomedicine, 2013, 9, 1223–1234 CrossRef CAS PubMed.
- J. Fickert, P. Rupper, R. Graf, K. Landfester and D. Crespy, J. Mater. Chem., 2012, 22, 2286–2291 RSC.
- C. D. Thurmond, J. Polym. Sci., 1952, 8, 607–609 CrossRef CAS.
Footnote |
| † Electronic supplementary information (ESI) available. See DOI: 10.1039/c9nr09879h |
| This journal is © The Royal Society of Chemistry 2020 |