
 Open Access Article
 This Open Access Article is licensed under a Creative Commons Attribution-Non Commercial 3.0 Unported Licence
Nanozeolite ZSM-5 electrolyte additive for long life sodium-ion batteries†
Lin
Chen
 a,
Brij
Kishore
a,
Marc
Walker
b,
Claire E. J.
Dancer
c and
Emma
Kendrick
*a
a,
Brij
Kishore
a,
Marc
Walker
b,
Claire E. J.
Dancer
c and
Emma
Kendrick
*a
aSchool of Metallurgy and Materials, University of Birmingham, Edgbaston B15 2TT, UK. E-mail: e.kendrick@bham.ac.uk
bDept. of Physics, University of Warwick, Gibbet Hill Road, Coventry, CV4 7AL, UK
cWarwick Manufacturing Group (WMG), University of Warwick, Gibbet Hill Road, Coventry, CV4 7AL, UK
First published on 17th August 2020
Abstract
A novel low cost sodium-ion battery electrolyte additive ZSM-5 nanozeolite, which improves cycle life, is demonstrated in a Na-ion cell. The addition of this zeolitic small molecule scavenger removes electrolyte decomposition products, and has beneficial properties compared to traditional organic additives such as fluoroethylene carbonate (FEC). Capacity retention after 480 cycles improves from 40% (none) compared to 62% (ZSM-5). This is due to the enhanced interface stability over the cell life-time, as shown by XPS.
Sodium-ion batteries (NIBs) are attracting considerable attention as possible post Li-ion batteries, however despite their seemingly similar chemistries there are significant differences which require extensive research before they can be commercialised. In particular, the different ionic radii of Na+ and Li+ alters the choice of the electrode materials, intercalation reaction potentials, electrochemical reaction of the electrolyte, the formation and stability of the solid electrolyte interface (SEI) layer.1 A good SEI layer determines crucial properties for NIBs such as cycle life and stability.2–5
The electrolyte is an ionic charge carrier and has an important role in the SEI. In NIBs, the most commonly used electrolytes are prepared by dissolving either NaClO4,6,7 NaPF62,8,9 or NaTFSI10,11 in carbonate-based organic solvents or ether-based solvents. NaPF6 in ethylene carbonate (EC): diethyl carbonate (DEC) is a widely used electrolyte for NIBs in the literatures.2,5,8,9
Kumar et al.4 investigated the fundamental mechanism of reduction-induced electrolyte decomposition in NIBs using quantum chemistry simulation. This indicated that a high reduction potential and a low energy barrier for ring opening of EC are the main driving forces for continual SEI layer growth. The presence of additives increases the energy barrier for ring opening in EC and changes the reduction potential. This predicted that the presence of additives in NIBs system will not only protect the decomposition of electrolyte, but will also potentially lead to a stable SEI layer if optimal additives are used.
FEC has been widely used as an electrolyte additive on both the cathode6,12–14 and anode side9,15–20 because it forms a thinner and smoother passivation layer. This effect has been confirmed by Nagaoka's simulation.21,22 The presence of FEC helps to control the amount of organic species by increasing the quantity of inorganic species such as NaF. However other by-products such as CO2 and H2O also increase with the presence of FEC. In addition the quantity of organic dimers, which are responsible for the stability of the SEI layer, are also reduced.22 This indicates that FEC is not a panacea and new alternative additives need to be explored in the NIBs system.
In this work we have designed the electrolyte with the addition of an inorganic water (H2O) and hydrogen fluoride (HF) scavenger,23–25 nano H-ZSM-5 zeolite (NZeo). It consists of a framework of linked tetrahedra, each consisting of four O atoms surrounding a cation.23 The open cavities in the framework offer channels and cages for H2O molecules and are large enough to allow the passage of guest species. The potential for NZeo to be used as a new inorganic electrolyte additive (Fig. S1, ESI†) was assessed by comparison to the standard electrolyte (Std, 1 M NaPF6 in EC:DEC) with and without FEC additive, and the behaviour in the full cell system with a P2-O3 type cathode and hard carbon anode (NaaMO2/C) is discussed.
After the 5 formation cycles at 0.12 mA cm−2 (0.08 C) a capacity of 125 mA h g(cathode)−1 or 1.5 mA h cm−2 was observed. The electrochemical performances of NaaMO2/C cells at higher rates (0.8 C) for ageing are displayed in Fig. S2 (ESI†). The cells start with similar initial areal capacities, 1.36, 1.35 and 1.39 mA h cm−2 respectively when they were cycled from 1.0–4.2 V at 0.8 C. Capacity decay was observed in all cells with progressive cycling. The presence of FEC and NZeo helped to reduce the capacity fading from 0.37% (for Std electrolyte) to 0.20% (FEC additive) and 0.12% (NZeo additive) per cycle. In addition, standard deviation of the results is significantly reduced with the NZeo addition compared to the other FEC and no additive as shown in Fig. S2a (ESI†).
To further understand the effect of the additives on the full cell charge/discharge profiles of the cells, Fig. 1 compares the 1st cycle of the de/sodiation profile of each additive separately. The irreversible capacity between the first charge and discharge are very similar in all cases. The corresponding differential capacity curves were plotted from 1.2 to 3.0 V (Fig. 1 inset), these indicate a peak around 2.2 V that is observed solely in FEC-containing electrolyte. This is likely due to the reduction of FEC at the hard carbon electrode. The derivative curves for the 2nd and 6th cycles help to understand the extent of decomposition process during cycling and show that the majority of the decomposition of FEC is completed after the first cycle. The 6th cycle is the first cycle after the formation process is completed. Three-electrode cells (Fig. S3, ESI†) confirm that the different charging voltage profile for the full cell is caused by the reduction of FEC on the hard carbon26 and indicate that the reduction is likely completed after the first cycle.
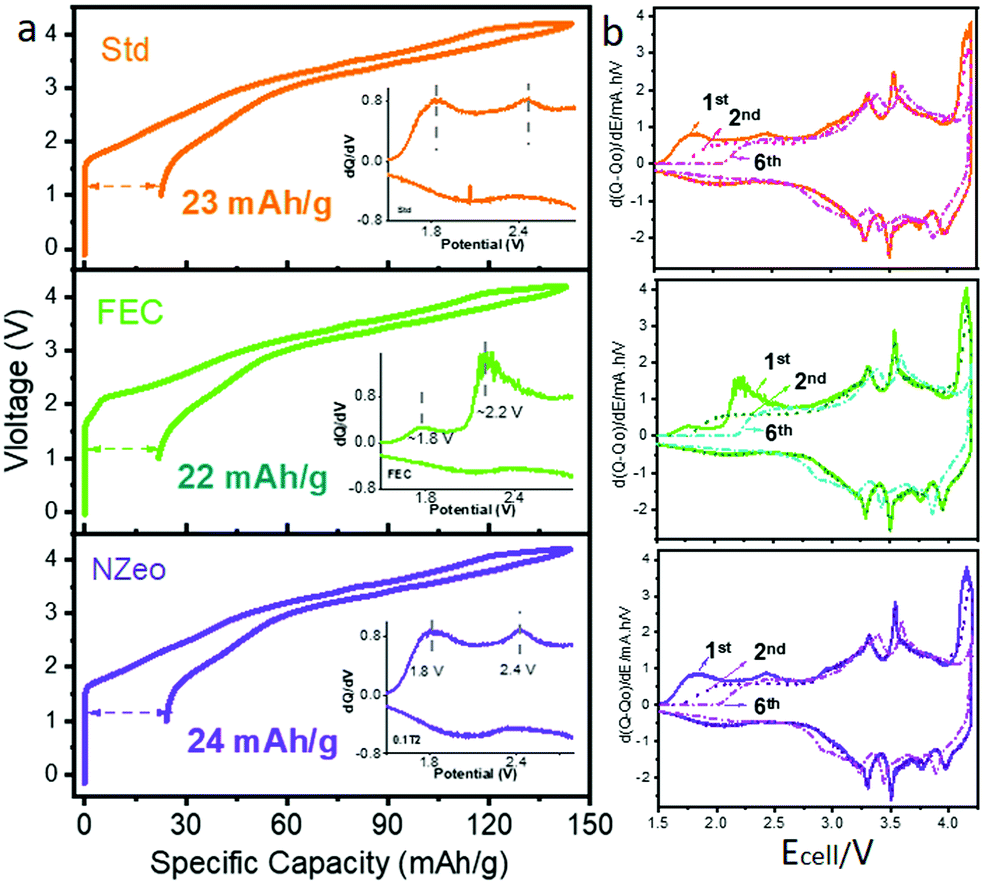 | ||
| Fig. 1 The electrochemical performance of NaaMO2/C cells using different electrolyte with additives. (a) Initial voltage–capacity curve of the cell and (b) differential capacity plot of the full cells. Differential capacity plots of the NaaMO2/C cells. Different line styles represent the 1st, 2nd and 6th cycle. | ||
In contrast to the self-sacrificing mechanism in FEC-containing electrolyte system, NZeo is chemically inert when it acts as an electrolyte additive. For the cell assembled with electrolyte containing NZeo, similar electrochemical behaviours as the Std electrolyte are observed on both WE and CE charging profiles (Fig. S3, ESI†). The improved electrochemical performance is expected to be due to the physical properties of NZeo; specifically its stable framework structure and ability to preferentially absorb different molecules into its structure.
FEC has been widely studied6,8,12,15,20,23 as electrolyte additive but the long-term reliability still needs to be investigated. Here, we present the long-term effect of FEC and NZeo additives in NIBs full cell system compared with a standard electrolyte. The cells were cycled at 1.2 mA cm−2 (0.8 C) for 480 cycles between 1.0–4.2 V after formation process and the long-term cycling is shown in Fig. 2. A similar capacity fading phenomenon is presented in the 50 cycles (Fig. S2a, ESI†) is observed with all electrolytes. FEC and NZeo aid cycle stability (Fig. 2a) and yielded remarkably improved capacity retentions of 58% and 62% respectively, compared to 40% in the Std case.
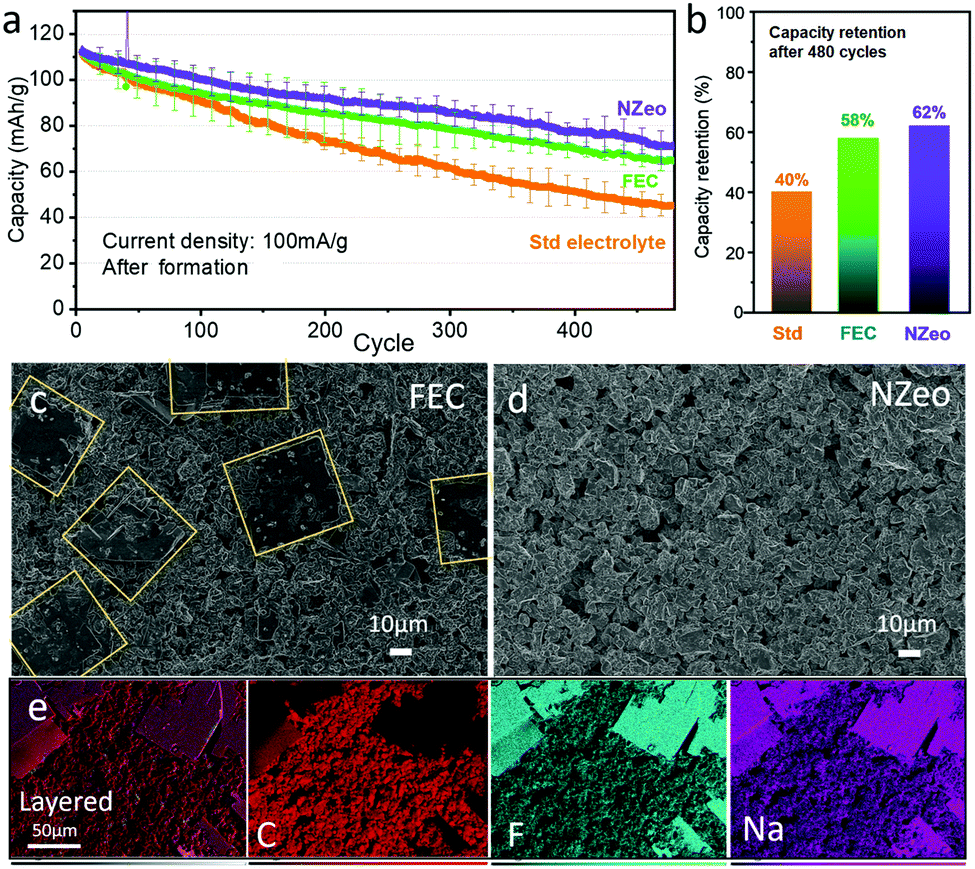 | ||
| Fig. 2 The capacity performance of the full cell using different additives. (a) Long cycle performance and (b) capacity retention during long cycling at 100 mA g−1 after 5 formation cycles at 10 mA g−1. SEM images of the non-plating regions of the anode coating for FEC (c) and NZeo (d) electrolytes after 480 cycles; mapping images of the flakes pattern observed on the negative electrode surface with the presence of FEC (e). | ||
The cells were de-crimped inside the glovebox after 480 cycles, and the images of Celgard separator and the hard carbon negative electrodes are presented in Fig. S4a–c (ESI†). The shiny decomposition product on the anode edges is metallic sodium plating which is visible in all the cells. The presence of 5% FEC indicates some reduction in Na plating on the hard carbon surface (Fig. S4b, ESI†), whereas plating is not reduced with 0.1% NZeo. In comparison with 1% NZeo addition, plating is significantly reduced (Fig. S5, ESI†), however the observed capacity is lower and therefore not studied further. The SEM images of the non-plated region of the electrodes are presented in Fig. S4a′–c′ (ESI†) and Fig. 2. Very fine square flake shaped particles (Fig. S4b′ and Fig. 2c highlighted with yellow lines) on the anode surface are observed only in the case of using FEC as electrolyte additive. Elemental mapping helps to understand the components of the square-flake covering the surface, and indicates that these crystals are comprised of NaF as shown in Fig. 2e. No zeolite was observed on the surface of the hard carbon after cycling (Fig. S6, ESI†), which is expected considering the size and the concentration of the NZeo.
To understand the effect of the zeolite (even at this low concentration) we must first consider the interface formation mechanism. The NaF on the surface of the hard carbon is formed from the decomposition of fluoride-containing materials; NaPF6 salt (eqn (1)) and the additional fluoride source FEC. We expect the decomposition of NaPF6 to be similar to that of LiPF6 which has been extensively studied.27,28 The NaPF6 breaks down to form NaF and PF5 (eqn (1)). The resulting PF5 can react with small quantities of H2O to produce HF and POF3 (eqn (2)). The HF produced from this reaction can subsequently react with decomposition products such as Na2CO3 to form further NaF and H2O (eqn (3)). The additional FEC forms a greater concentration of NaF on the surface of the hard carbon, as is expected from the decomposition reactions (eqn (4)).
| NaPF6 ↔ NaF + PF5 | (1) |
| H2O + PF5 ↔ 2HF + POF3 | (2) |
| 2HF + Na2CO3 ↔ 2NaF + H2O + CO2 | (3) |
| FEC + e− + Na+ ↔ NaF +CO2 + C2H3O | (4) |
This explains the increase in NaF surface covering observed in Fig. 2c. Upon the addition of NZeo to the Std electrolyte there is no additional NaF and CO2 generated during cycling, as with FEC. We suggest that the enhanced cycle life is due to the presence of NZeo which reduces the water content and decomposition products such as HF in the electrolyte by incorporating the molecules into its structure. This helps build a more stable SEI layer/electrolyte and prolongs the life-time of the cell.
XPS was carried out to give greater insight into the combination of compounds which comprise the SEI layer formed on the anode after formation, 50, and 100 cycles. Results are presented in Fig. 3a–c, and Fig. 3d shows a schematic illustration of the SEI composition, with all peaks normalised to a standard. Different bonding environments arising from the different electrolyte decomposition products were present in the cycled anodes. The C 1s, O 1s and F 1s spectra were collected for each anode from the full cells. The C 1s spectra shows the peaks corresponding to the sp2 C–C bonds of the turbostatic graphene layers in hard carbon (284.5 eV), sp3 C–C bonds of hard carbon, and of the carbon black additive (285.0 eV), C–O (286.2 eV, pale orange peak) and O![[double bond, length as m-dash]](https://www.rsc.org/images/entities/char_e001.gif) C–O (289.2 eV, magenta peak) in sodium or organic alkyl carbonates (Na(R)–O–(CO)–O–CH2–R). These findings are also reflected in the O 1s spectra (Fig. 3b) in which the peaks observed at ∼532 eV, ∼534 eV and 537 eV are believed to correspond, at least in part, to O atoms in these alkyl carbonates. Besides the peaks associated with PVDF (∼292 eV, denoted as CF2–CH2), the C 1s core spectra reveal upon cycling the appearance of a new peak located at 290.4 eV (light green in Fig. 3a), which is assigned to Na2CO3. The low intensities of peaks attributed to Na2CO3 and sodium alkyl carbonate C 1s spectra in FEC are indicative of a thinner surface layer than the Std electrolyte, which is consistent with other observations in the literature.6,22 These inorganic species form a compact inner SEI layer on the hard carbon surface (Fig. 3d). This 290.4 eV peak (light green in Fig. 3a) was detected on the Std and FEC electrolyte electrode samples but was not in the NZeo electrolyte electrode. This indicates a lower degree of electrolyte decomposition has occurred with the addition of NZeo, which may also result in an even thinner inner inorganic SEI layer than FEC one. A notable feature in these spectra is the overlap of the O 1s and Na KLL Auger regions, with the Na Auger emission arising from both Na2CO3 and sodium alkyl carbonate denoted by the light green peak in Fig. 3b. Therefore, the same trend of –O–(CO)–O peak in Std, FEC and NZeo electrodes in C 1s spectra (Fig. 3a, light green) is also applied to the Na Auger peak in O 1s spectra in Fig. 3b (light green). The peak observed at ∼536 eV (grey peak) and ∼538 eV (red peak) are believed to correspond to the O atoms in organic species and sodium carboxylate complexes (COO–Na) arising from the decomposition of the electrolytes (Fig. 3d, organic layer). The low intensities of the grey peak in NZeo electrolyte indicate a lower concentration of organic species is present within the SEI. The peaks at ∼685 eV (orange peak) in F 1s spectra which appeared in the cycled electrodes are attributed to NaF, derived from NaPF6 decomposition. The variations in amplitude of these signals are shown as a function of cycling (Fig. 3c). The NaF appears to increase for Std electrolyte and NZeo electrolyte upon cycling as opposed to a decreasing trend for FEC. The large NaF peak observed for the FEC electrolyte derived from the decomposition of NaPF6 as well as FEC agrees with the SEM observations discussed above.
C–O (289.2 eV, magenta peak) in sodium or organic alkyl carbonates (Na(R)–O–(CO)–O–CH2–R). These findings are also reflected in the O 1s spectra (Fig. 3b) in which the peaks observed at ∼532 eV, ∼534 eV and 537 eV are believed to correspond, at least in part, to O atoms in these alkyl carbonates. Besides the peaks associated with PVDF (∼292 eV, denoted as CF2–CH2), the C 1s core spectra reveal upon cycling the appearance of a new peak located at 290.4 eV (light green in Fig. 3a), which is assigned to Na2CO3. The low intensities of peaks attributed to Na2CO3 and sodium alkyl carbonate C 1s spectra in FEC are indicative of a thinner surface layer than the Std electrolyte, which is consistent with other observations in the literature.6,22 These inorganic species form a compact inner SEI layer on the hard carbon surface (Fig. 3d). This 290.4 eV peak (light green in Fig. 3a) was detected on the Std and FEC electrolyte electrode samples but was not in the NZeo electrolyte electrode. This indicates a lower degree of electrolyte decomposition has occurred with the addition of NZeo, which may also result in an even thinner inner inorganic SEI layer than FEC one. A notable feature in these spectra is the overlap of the O 1s and Na KLL Auger regions, with the Na Auger emission arising from both Na2CO3 and sodium alkyl carbonate denoted by the light green peak in Fig. 3b. Therefore, the same trend of –O–(CO)–O peak in Std, FEC and NZeo electrodes in C 1s spectra (Fig. 3a, light green) is also applied to the Na Auger peak in O 1s spectra in Fig. 3b (light green). The peak observed at ∼536 eV (grey peak) and ∼538 eV (red peak) are believed to correspond to the O atoms in organic species and sodium carboxylate complexes (COO–Na) arising from the decomposition of the electrolytes (Fig. 3d, organic layer). The low intensities of the grey peak in NZeo electrolyte indicate a lower concentration of organic species is present within the SEI. The peaks at ∼685 eV (orange peak) in F 1s spectra which appeared in the cycled electrodes are attributed to NaF, derived from NaPF6 decomposition. The variations in amplitude of these signals are shown as a function of cycling (Fig. 3c). The NaF appears to increase for Std electrolyte and NZeo electrolyte upon cycling as opposed to a decreasing trend for FEC. The large NaF peak observed for the FEC electrolyte derived from the decomposition of NaPF6 as well as FEC agrees with the SEM observations discussed above.
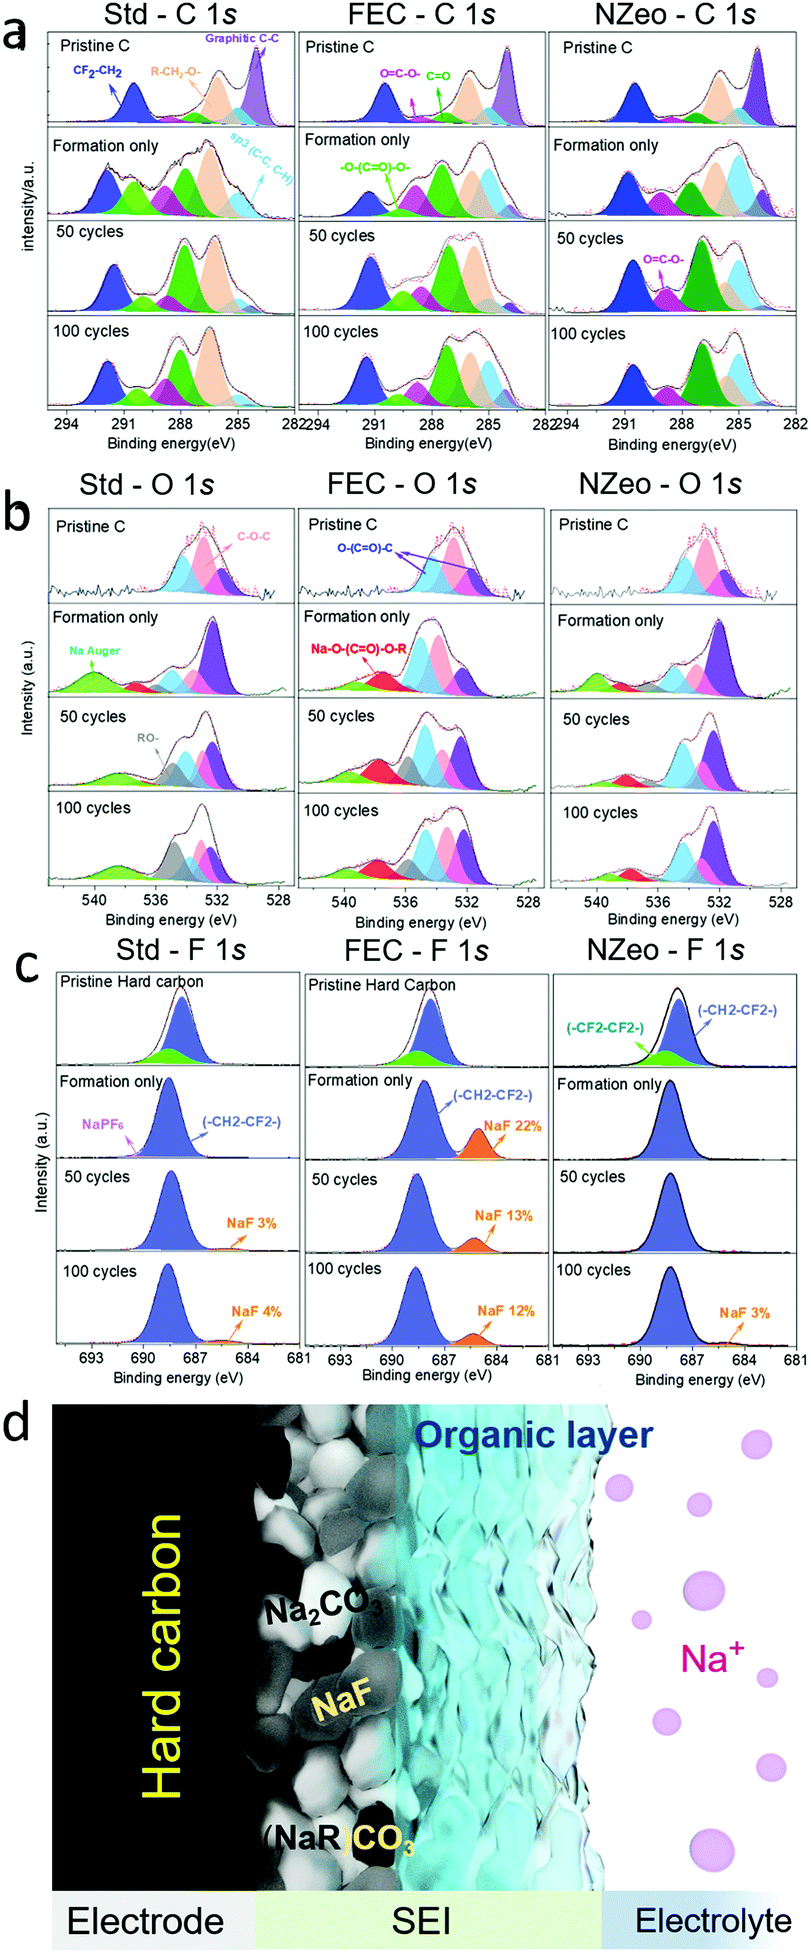 | ||
| Fig. 3 The XPS spectra of pristine hard carbon electrodes and those electrodes after formation, after 50 cycles and after 100 cycles by using Std, FEC and NZeo electrolytes. (a) The C 1s spectra of hard carbon electrodes; (b) O 1s spectra of the hard carbon e electrodes; (c) F 1s spectra of the hard carbon electrodes. (d) Schematic illustration of the SEI layer. | ||
 | ||
| Fig. 4 Schematic diagram of the proposed mechanism of FEC (a) and NZeo (b) electrolyte additives in the long term cycling process as described with eqn (1)–(4) and SEM images (ESI†). | ||
In summary, after formation and upon cycling (as presented in Fig. 4), the hard carbon interface with an electrolyte containing FEC exhibited increased NaF and sodium alkyl carbonate, Na–O–(CO)–O–CH2–R, compounds as compared to that without this additive. This indicates that the initial SEI formed for electrolyte containing FEC is likely mostly NaF and sodiated electrolyte decomposition species, which stabilise the interface. During cycling these compounds reduce in content. In contrast for the electrolyte with nanozeolite additive there is no significant change in the proportions of the observed XPS peaks, indicating a greater stability of the interface composition. This results in improved life-time of the cell. The benefit of NZeo addition is the ability to absorb small molecules into the stable framework structure of the zeolite. Water, CO2 and HF and other electrolyte decomposition products are trapped inside the zeolite cages helping to generate a thinner and more stable SEI composition. This work provides evidence of a novel promising electrolyte additive, nanozeolite, which is beneficial for sodium-ion battery cycle life at extremely low concentrations in comparison to standard electrolyte additives such as FEC.
The authors LC, BK, CEJD and EK thank Innovate UK for funding (IUK Project 104179).
Conflicts of interest
There are no conflicts to declare.Notes and references
- S. Roberts and E. Kendrick, Nanotechnol., Sci. Appl., 2018, 11, 23–33 CrossRef CAS PubMed.
- A. Ponrouch, E. Marchante, M. Courty, J. M. Tarascon and M. R. Palacin, Energy Environ. Sci., 2012, 5, 8572–8583 RSC.
- J. Lee, Y. M. Chen, Y. Zhu and B. D. Vogt, RSC Adv., 2015, 5, 99329–99338 RSC.
- H. Kumar, E. Detsi, D. P. Abraham and V. B. Shenoy, Chem. Mater., 2016, 28, 8930–8941 CrossRef CAS.
- H. Che, S. Chen, Y. Xie, H. Wang, K. Amine, X. Z. Liao and Z. F. Ma, Energy Environ. Sci., 2017, 10, 1075–1101 RSC.
- S. Komaba, T. Ishikawa, N. Yabuuchi, W. Murata, A. Ito and Y. Ohsawa, ACS Appl. Mater. Interfaces, 2011, 3, 4165–4168 CrossRef CAS PubMed.
- P. R. Kumar, Y. H. Jung, B. Moorthy and D. K. Kim, J. Electrochem. Soc., 2016, 163, A1484–A1492 CrossRef CAS.
- L. Ji, M. Gu, Y. Shao, X. Li, M. H. Engelhard, B. W. Arey, W. Wang, Z. Nie, J. Xiao, C. Wang, J. G. Zhang and J. Liu, Adv. Mater., 2014, 26, 2901–2908 CrossRef CAS PubMed.
- G. Yan, K. Reeves, D. Foix, Z. Li, C. Cometto, S. Mariyappan, M. Salanne and J. Tarascon, Adv. Energy Mater., 2019, 1901431 CrossRef CAS.
- G. G. Eshetu, T. Diemant, M. Hekmatfar, S. Grugeon, R. J. Behm, S. Laruelle, M. Armand and S. Passerini, Nano Energy, 2019, 55, 327–340 CrossRef CAS.
- G. G. Eshetu, S. Grugeon, H. Kim, S. Jeong, L. Wu, G. Gachot, S. Laruelle, M. Armand and S. Passerini, ChemSusChem, 2016, 9, 462–471 CrossRef CAS PubMed.
- Y. Lee, J. Lee, H. Kim, K. Kang and N. S. Choi, J. Power Sources, 2016, 320, 49–58 CrossRef CAS.
- I. Hasa, S. Passerini and J. Hassoun, RSC Adv., 2015, 5, 48928–48934 RSC.
- S. Komaba, N. Yabuuchi, T. Nakayama, A. Ogata, T. Ishikawa and I. Nakai, Inorg. Chem., 2012, 51, 6211–6220 CrossRef CAS.
- H. Lu, L. Wu, L. Xiao, X. Ai, H. Yang and Y. Cao, Electrochim. Acta, 2016, 190, 402–408 CrossRef CAS.
- L. Baggetto, M. Marszewski, J. Górka, M. Jaroniec and G. M. Veith, J. Power Sources, 2013, 243, 699–705 CrossRef CAS.
- I. T. Kim, S. O. Kim and A. Manthiram, J. Power Sources, 2014, 269, 848–854 CrossRef CAS.
- I. T. Kim, E. Allcorn and A. Manthiram, J. Power Sources, 2015, 281, 11–17 CrossRef CAS.
- S. A. Pervez, D. Kim, S. M. Lee, C. H. Doh, S. Lee, U. Farooq and M. Saleem, J. Power Sources, 2016, 315, 218–223 CrossRef CAS.
- L. Baggetto, J. K. Keum, J. F. Browning and G. M. Veith, Electrochem. Commun., 2013, 34, 41–44 CrossRef CAS.
- N. Takenaka, H. Sakai, Y. Suzuki, P. Uppula and M. Nagaoka, J. Phys. Chem. C, 2015, 119, 18046–18055 CrossRef CAS.
- A. Bouibes, N. Takenaka, T. Fujie, K. Kubota, S. Komaba and M. Nagaoka, ACS Appl. Mater. Interfaces, 2018, 10, 28525–28532 CrossRef CAS PubMed.
- M. Moshoeshoe, M. S. Nadiye-Tabbiruka and V. Obuseng, Am. J. Mater. Sci., 2017, 7, 191–221 Search PubMed.
- X. L. Dong, W. L. Mi, L. H. Yu and Y. S. Lin, Microporous Mesoporous Mater., 2016, 226, 406–414 CrossRef CAS.
- Y. L. Li, X. Wang, J. Y. Liang, K. Wu and J. Wang, Polymers, 2020, 12, 764 CrossRef CAS.
- R. Dugas, A. Ponrouch, G. Gachot, R. David, M. R. Palacin and J. M. Tarascon, J. Electrochem. Soc., 2016, 163, A2333–A2339 CrossRef CAS.
- S. J. An, J. Li, C. Daniel, D. Mohanty, S. Nagpure and D. L. Wood, Carbon, 2016, 105, 52–76 CrossRef CAS.
- S. K. Heiskanen, J. Kim and B. L. Lucht, Joule, 2019, 3, 2322–2333 CrossRef CAS.
Footnote |
| † Electronic supplementary information (ESI) available. See DOI: 10.1039/d0cc03976d |
| This journal is © The Royal Society of Chemistry 2020 |