MOF-derived two-dimensional N-doped carbon nanosheets coupled with Co–Fe–P–Se as efficient bifunctional OER/ORR catalysts†
Hengbo
Wu
a,
Jie
Wang
c,
Ji
Yan
 d,
Zexing
Wu
 *b and
Wei
Jin
 *a
*a
aSchool of Chemical and Material Engineering, Jiangnan University, Wuxi 214122, China. E-mail: wjin@ipe.ac.cn
bCollege of Chemistry and Molecular Engineering, Qingdao University of Science & Technology, Qingdao 266042, PR China. E-mail: splswzx@qust.edu.cn
cCollege of Chemistry and Pharmaceutical Sciences, Qingdao Agricultural University, Qingdao, 266109, China
dSchool of Materials and Chemical Engineering, Zhengzhou University of Light Industry, Zhengzhou 450001, Henan, PR China
First published on 30th September 2019
Abstract
Developing highly efficient, low-cost and bifunctional electrocatalysts for the oxygen evolution reaction (OER) and oxygen reduction reaction (ORR) plays a pivotal role in the scalable applications of zinc–air (Zn–air) batteries. Herein, Co–Fe–P–Se nanoparticles supported on two-dimensional nitrogen-doped carbon (Co–Fe–P–Se/NC) to construct a three-dimensional nanostructure were obtained under the assistance of metal–organic frameworks (MOFs). The two-dimensional nanosheet facilitated the electron transfer rate and exposed abundant active sites. The three-dimensional morphology composed of nanosheets was favorable for electrolyte transport and provided abundant channels for gas diffusion during the catalytic process. Moreover, the coexistence of Co and Fe had important effects on promoting the catalytic performances. Lastly, the catalytic performances for OER and ORR could be promoted effectively after the introduction of selenium and phosphorous in the designed electrocatalyst. Benefiting from the above merits, the prepared Co–Fe–P–Se/NC exhibited excellent catalytic performances for OER (overpotential of 0.27 V at 10 mA cm−2), ORR (half-wave potential of 0.76 V) and rechargeable batteries (a low voltage gap of 0.719 V, high power density of 104 mW cm−2 at 200 mA cm−2 and high energy density of 805 W h KgZn−1). Moreover, the prepared electrocatalyst possessed more stable long-term stability in all the conducted experiments. This work provides a novel approach to develop and construct high-performance bifunctional nanocatalysts for metal–air batteries.
Introduction
With the rapidly increasing environmental pollution and energy crisis, it is indispensable to exploit a sustainable and eco-friendly energy storage and conversion setup.1–6 Among the researched energy devices, zinc–air (Zn–air) batteries have attracted tremendous attention and are deemed as promising candidates to fulfill our demands for future power devices due to their advantages of high theoretical energy density, rich resources and environmental sustainability.4,7–10 However, the sluggish catalytic kinetics of the oxygen evolution reaction (OER) and oxygen reduction reaction (ORR), which are two critical electrochemical reactions in rechargeable Zn–air batteries, limit their large-scale practical applications.11–14 At present, Ru/Ir and Pt are widely acknowledged as the best catalysts for OER and ORR, respectively.15–20 However, their scarcity and high cost hinder their widespread implementation for applications in rechargeable Zn–air batteries.21,22 Moreover, the noble metals elevate the cost to prepare catalysts in promoting the catalytic performance for OER or ORR. Accordingly, developing highly efficient, low-cost, earth-abundant and bifunctional electrocatalysts is still challenging.23–26During the past decades, earth-abundant transition metal-based nanomaterials have been extensively investigated for OER and ORR, and they are considered as promising candidates for the replacement of precious metals.27–31 However, the catalytic activities of the developed substitutes are still far behind those of the precious metals. As reported, a designed bimetallic electrocatalyst presents a better catalytic performance compared with monometallic nanomaterials because the electronic tuning would influence the reaction kinetics.32–34 Among the developed synthesis strategies, metal–organic frameworks (MOFs), a family of crystalline materials formed by the self-assembly of organic ligands and metal ions, have been extensively investigated in energy conversion and storage technologies after specific modifications due to their well-defined structures and high porosity.35–37 In addition to the design of bimetallic nanomaterials, the morphologies of the obtained electrocatalysts also play a pivotal role in promoting the catalytic properties. Two-dimensional (2D) nanomaterials possess unique structures and electronic properties, which has promoted the research in energy conversion and other fields.38–44 For instance, Li et al.45 fabricated a two-dimensional coupled hybrid composed of Mo2C on an N, P co-doped carbon shell and N, P co-doped RGO; it presented excellent catalytic activities for the hydrogen evolution reaction. Li et al.46 developed 2D mesoporous FeCo-Nx-carbon catalysts, which yielded excellent catalytic performances for OER, ORR and rechargeable Zn–air batteries. Thus, constructing a bimetallic 2D nanostructure catalyst would be a promising method to achieve outstanding catalytic activities. Recently, metal phosphides and selenides have been extensively investigated for OER and ORR due to the efficient electron transfer during the catalytic process over their intrinsically conductive properties.47–51 Therefore, excellent catalytic performances for OER, ORR and rechargeable Zn–air batteries are expected to be achieved through the combination of metal phosphides and selenides.
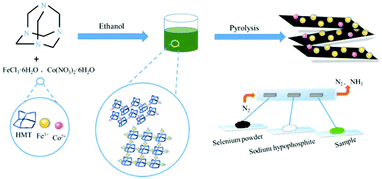
Herein, a facile and scalable strategy was exploited to design Co–Fe–P–Se nanoparticles supported on 2D nitrogen-doped carbon nanosheets, which presented excellent catalytic activities for OER and ORR. Hexamethylenetetramine (HMT) acting as the organic ligand could coordinate with metal ions; the formed 2D nitrogen-doped carbon matrix was beneficial for the electron transfer and avoided the aggregation of metallic nanoparticles during low-temperature pyrolysis (Scheme 1). The obtained 2D nanosheets formed a three-dimensional structure with abundant channels; this was favorable for the electrolyte transfer and exposed abundant active sites, which contributed towards the enhancement in the catalytic performances. Phosphorous and selenium were introduced during pyrolysis to form phosphides and selenides, which further promoted the catalytic performances. Benefiting from the above-mentioned merits, the designed electrocatalyst delivered excellent catalytic properties in OER, ORR and rechargeable Zn–air batteries. Moreover, the resulting product also possessed excellent long-term stability for all the measured tests.
Results and discussion
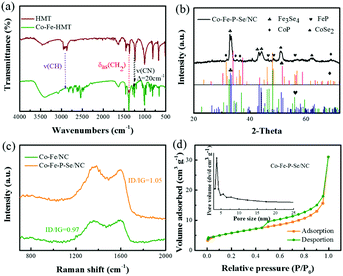
XRD was first performed to investigate the structure information of the prepared Co-HMT and pure HMT. As shown in Fig. S1b,† the Co-HMT frameworks possess a high degree of crystallinity and match well with the previously determined MOF.52 Compared with the XRD diffraction pattern of pure HMT, the XRD diffraction pattern of the Co–Fe-HMT nanorods shows a significant difference. With different molar ratios, the main diffraction peaks were similar. Besides, on increasing the proportion of Fe3+, the diffraction peaks gradually approached the peak shape of Fe-HMT, which indicated that HMT successfully coordinated with the Co–Fe species (Fig. S1c†). FT-IR was performed to investigate the interactions between metal ions and HMT. As shown in Fig. 1a, a vibration band located at 1234 cm−1 for v(CN) increases to 1254 cm−1; moreover, Co-HMT, Fe-HMT, and Co–Fe-HMT possess similar vibration bands (Fig. S1a†), demonstrating the coordination of Co2+ and Fe3+ to the ring nitrogen.53,54 The interactions between an organic ligand and metal ions can help avoid the aggregation of metal nanoparticles and expose abundant active sites. XRD was conducted to study the structure information of the prepared catalysts. As shown in Fig. 1b, the peaks at 32.5°, 33.4°, 43.3° and 43.9° correspond to the (−202), (202), (−114) and (114) crystal facets for Fe3Se4 (JCPDS No. 73-2021); the peaks at 46.3°, 48.3° and 56.1° are ascribed to the (121), (211) and (221) lattice planes of FeP (JCPDS No. 71-2262), respectively. Apart from FeP and Fe3Se4, the peaks at 51.7 and 63.4 are attributed to the (311) and (400) lattice planes of CoSe2 (JCPDS No. 88-1712). The rest of the characteristic diffraction peaks at 31.6°, 35.3°, 36.3°, and 68.8° correspond to the (011), (200), (111) and (122) lattice planes of CoP (JCPDS No. 29-0497). For Co/NC (Fig. S1d†), the peaks of Co/NC at 41.6°, 44.7° and 47.5° well correspond to the (100), (002), and (102) crystal facets for the Co nanoparticles (JCPDS No. 05-0727). The peaks of Fe/NC at 41.7°, 42.9° and 43.9° are indexed to the (100), (002), and (102) lattice planes of C, respectively (JCPDS No. 79-1472). Moreover, the peaks at 35.6°, 44.7° and 46° belong to the (020), (410), and (330) lattice planes of Fe2O3, respectively (JCPDS No. 39-1346). The diffraction peaks of Co–Fe/NC at 30.2°, 35.6° and 44.7° also well correspond to the (220), (020) and (410) lattice planes of Fe2O3 (JCPDS No. 39-1346). The diffraction peak at 47.5° can be assigned to the (102) plane of the Co nanoparticles (JCPDS No. 05-0727). For Co–Fe–Se/NC (Fig. S1e†), the peaks at 28.1°, 33.4°, 45.3°, 47.8°, 48.4° and 57.5° can be indexed to the (103), (202) (−213), (015) (006) and (215) lattice planes in Fe3Se4, respectively (JCPDS No. 73-2021). The rest of the peaks can be well indexed to CoSe2 (JCPDS No. 88-1712) and Fe2O3 (JCPDS No. 39-1346). For Co–Fe–P/NC (Fig. S1f†), the peaks at 32.7°, 48.3°, and 55.3° are indexed to the (011), (211) and (310) lattice planes in FeP, respectively (JCPDS No. 71-2262). The rest of the peaks can be well indexed to Co2P (JCPDS No. 32-0306).Fig. 1c shows the Raman spectra of the prepared catalysts; two prominent peaks at 1377 and 1606 cm−1 can be clearly detected and correspond to the D band of the disordered carbon and the G band of the graphitic carbon. The ID/IG value of Co–Fe–P–Se/NC (1.05) was larger than that of Co–Fe/NC (0.97), demonstrating that the doping of Se and P in the carbon matrix could induce more defect structures; this was beneficial to accelerate the electrochemical reaction due to the defects, which could modulate the surface electronic structure and create more active sites.55,56 As illustrated in Fig. 1d, the surface area of Co–Fe–P–Se/NC is explored by the N2 adsorption–desorption technique, and the BET surface area is 15.1 m2 g−1. During the applied relative pressure, the N2 adsorption/desorption isotherms revealed a typical IV curve with a hysteresis loop; the pore size distribution analysis indicated the presence of mesopores.
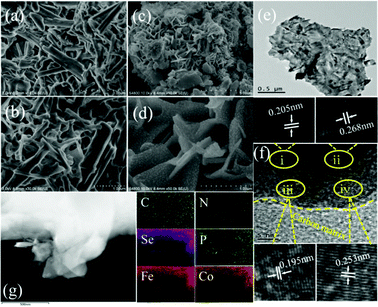
SEM and TEM tests were conducted to investigate the nanostructure of the designed electrocatalysts. As shown in Fig. 2a and b, the obtained Co–Fe-HMT is composed of numerous aggregated nanorods. We believe that the interactions between Co2+, Fe3+ and HMT led to the formation of nanorods.57 Interestingly, nanosheet structures appeared after low-temperature pyrolysis for Co–Fe/NC (Fig. S2a and b†), Co–Fe–Se/NC (Fig. S3a and b†), Co–Fe–P/NC (Fig. S4a and b†) and Co–Fe–P–Se/NC (Fig. 2c and d), indicating that the pyrolysis treatment resulted in the transformation of nanorod to nanosheet morphology. It could be clearly detected that the emerged nanosheets contacted each other intimately and formed three-dimensional porous structures. The three-dimensional morphology with abundant channels benefits the transport of an electrolyte and the diffusion of the produced gas or reaction gases during OER and ORR, which helps accelerate the reaction process.58 Moreover, the featured nanosheet structure possesses a specific electronic structure and can expose abundant active sites, which also contributes to the enhancement in the catalytic performances.59 As illustrated in Fig. 2d, the Co–Fe–P–Se nanoparticles can be obviously observed on the nanosheet and are distributed uniformly, which effectively increases the reaction active sites. The nanosheet morphology could be observed more clearly via TEM (Fig. 2e) and it was found that the metal nanoparticles were distributed on the carbon nanosheet homogeneously. The lattice spacing values of 0.253, 0.195, 0.268 and 0.205 nm were attributed to CoP (200), FeP (121), Fe3Se4 (202), and Fe3Se4 (114), respectively (Fig. 2f). The interface (yellow dotted line) between the carbon matrix and metal nanoparticles could be observed distinctly. The Co–Fe–P/NC nanosheets could be observed clearly via TEM (Fig. S4c†) and the carbon matrix was clearly distinguished. The lattice spacing values of 0.22 nm and 0.274 nm were attributed to Co2P (121) and FeP (011), respectively (Fig. S4f†). The elemental mappings (Fig. 2g) and EDX (Fig. S5†) demonstrated the existence of C, N, P, Se, Fe and Co in the obtained catalysts.
XPS was further conducted to study the composition and chemical valence of the developed Co–Fe–P–Se/NC. In line with the elemental mapping results, C, N, P, Se, Fe and Co were detected in the XPS survey spectrum (Fig. 3a). As shown in Fig. 3b, the high-resolution XPS spectrum of C 1s can be fitted into four peaks at 284.6, 285.7, 287.3, and 289.1 eV, which are contributed by the C–C/C![[double bond, length as m-dash]](https://www.rsc.org/images/entities/char_e001.gif) C, C
C, C![[double bond, length as m-dash]](https://www.rsc.org/images/entities/char_e001.gif) O, C–N, and O–C
O, C–N, and O–C![[double bond, length as m-dash]](https://www.rsc.org/images/entities/char_e001.gif) O species, respectively.60 The peaks located at 129.3 and 130.4 eV in the high-resolution P 2p spectrum (Fig. 3c) can be ascribed to metal phosphides, and the peak located at 134 eV is attributed to the P–O species exposed to air.61,62 The Se 3d spectrum can be resolved into three components at the binding energies of 54.6, 55.7, and 58.9 eV (Fig. 3d), which are attributed to Se 3d5/2 and Se 3d3/2 in selenides and the SeOx species, respectively.63 In the Fe 2p spectrum (Fig. 3e), the peaks located at 710.3 and 723.6 eV reveal the presence of Fe2+, while the other two strong peaks located at 712.3 and 725.7 eV are derived from Fe3+.64 The accompanied satellite peak at 715.8 eV indicates the partially oxidized Fe species. In the Co 2p spectrum (Fig. 3f), the peaks at 780.4 eV and 796.2 eV can be ascribed to Co3+ accompanied with two satellite bands at 786 eV and 802 eV, while the peaks at 782.1 eV and 797.6 eV can be ascribed to Co2+; the peaks at 778.2 eV and 793 eV correspond well to metallic Co.65 Thus, Co–Fe–P–Se/NC was verified to be successfully synthesized after the low-temperature phosphidation and selenization process.
O species, respectively.60 The peaks located at 129.3 and 130.4 eV in the high-resolution P 2p spectrum (Fig. 3c) can be ascribed to metal phosphides, and the peak located at 134 eV is attributed to the P–O species exposed to air.61,62 The Se 3d spectrum can be resolved into three components at the binding energies of 54.6, 55.7, and 58.9 eV (Fig. 3d), which are attributed to Se 3d5/2 and Se 3d3/2 in selenides and the SeOx species, respectively.63 In the Fe 2p spectrum (Fig. 3e), the peaks located at 710.3 and 723.6 eV reveal the presence of Fe2+, while the other two strong peaks located at 712.3 and 725.7 eV are derived from Fe3+.64 The accompanied satellite peak at 715.8 eV indicates the partially oxidized Fe species. In the Co 2p spectrum (Fig. 3f), the peaks at 780.4 eV and 796.2 eV can be ascribed to Co3+ accompanied with two satellite bands at 786 eV and 802 eV, while the peaks at 782.1 eV and 797.6 eV can be ascribed to Co2+; the peaks at 778.2 eV and 793 eV correspond well to metallic Co.65 Thus, Co–Fe–P–Se/NC was verified to be successfully synthesized after the low-temperature phosphidation and selenization process.
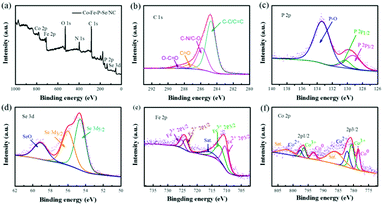 | ||
| Fig. 3 (a) XPS survey spectra and high-resolution C 1s (b), P 2p (c), Se 3d (d), Fe 2p (e) and Co 2p (f) spectra of Co–Fe–P–Se/NC. | ||
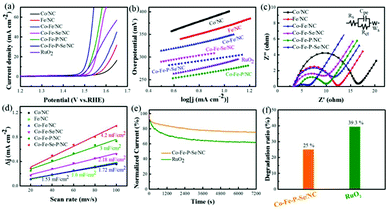
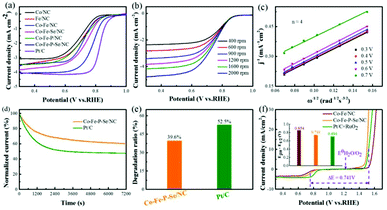
The electrocatalytic activities of the prepared catalysts for OER were first evaluated in a 1 M KOH solution with a typical three-electrode setup. For an ideal electrocatalyst for OER, the lower overpotential to drive 10 mA cm−2 means a better catalytic performance. As shown in Fig. 4a, Co–Fe–P–Se/NC exhibits the lowest overpotential (270 mV) to deliver 10 mA cm−2 relative to Co–Fe/NC (340 mV), RuO2 (290 mV), Co/NC (397 mV), Fe/NC (366 mV), Co–Fe–Se/NC (300 mV), Co–Fe–P/NC (289 mV), Co–P–Se/NC (359 mV) (Fig. S11a and b†) and Fe–P–Se/NC (336 mV) (Fig. S11a and b†); this demonstrated that the coexistence of Co and Fe and the introduction of heteroatoms played a significant role in promoting the catalytic activity. Except overpotential, the Tafel slope, calculated by the Tafel equation η = b![[thin space (1/6-em)]](https://www.rsc.org/images/entities/char_2009.gif) log
log![[thin space (1/6-em)]](https://www.rsc.org/images/entities/char_2009.gif) j + a (j is the current density and b is the slope), is also an important parameter to research the reaction mechanism and evaluate the catalytic activity; a smaller slope means faster oxygen production with the increase in overpotential. It could be obviously observed that the designed Co–Fe–P–Se/NC possessed the smallest Tafel slope (39 mV dec−1) compared with Co/NC (96 mV dec−1), Fe/NC (74 mV dec−1), Co–Fe/NC (60 mV dec−1), Co–Fe–Se/NC (44 mV dec−1), Co–Fe–P/NC (42 mV dec−1) and RuO2 (57 mV dec−1), further confirming the outstanding catalytic performance of Co–Fe–P–Se/NC for OER (Fig. 4b). Moreover, Co–Fe/NC with different molar ratios of Co–Fe (Fig. S6†), Co–Fe–Se/NC with different mass ratios of selenium powder (Fig. S7†), and Co–Fe–P–Se/NC with different mass ratios of NaH2PO2·H2O (Fig. S8†) were prepared to explore the OER performance. EIS was fitted by an equivalent circuit (Fig. S9†). The Nyquist plots in Fig. 4c show that the obtained Co–Fe–P–Se/NC has the lowest charge-transfer resistance (3.235 Ω) (Table S1†), which is beneficial for improving the catalytic performance. Electrochemical double layer capacitance (EDLC) is an important parameter to evaluate the electrochemical surface area of the prepared electrocatalysts.66 The value of EDLC was obtained by using the CV method in the potential range of 1.07 V–1.17 V (Fig. S10†) and by plotting Δj/2 against the scan rate. As illustrated in Fig. 4d, Co–Fe–P–Se/NC presents the largest EDLC value of 4.2 mF cm−2 relative to Co/NC (1.53 mF cm−2), Fe/NC (1.6 mF cm−2), Co–Fe/NC (1.72 mF cm−2), Co–Fe–Se/NC (2.18 mF cm−2) and Co–Fe–P/NC (3 mF cm−2), indicating that the coexistence of different metals and heteroatoms can enlarge the contact surface area, which is in favor of improving the catalytic performance. Except catalytic performance, stability is also a significant parameter for the designed electrocatalyst. I–t chronoamperometric measurements were recorded to investigate the stability of the prepared electrocatalyst. As presented in Fig. 4e and f, the prepared Co–Fe–P–Se/NC exhibits a lower current loss of 25% after 7200 s relative to commercial catalysts (39.3%), demonstrating that its working stability is higher than that of RuO2.
j + a (j is the current density and b is the slope), is also an important parameter to research the reaction mechanism and evaluate the catalytic activity; a smaller slope means faster oxygen production with the increase in overpotential. It could be obviously observed that the designed Co–Fe–P–Se/NC possessed the smallest Tafel slope (39 mV dec−1) compared with Co/NC (96 mV dec−1), Fe/NC (74 mV dec−1), Co–Fe/NC (60 mV dec−1), Co–Fe–Se/NC (44 mV dec−1), Co–Fe–P/NC (42 mV dec−1) and RuO2 (57 mV dec−1), further confirming the outstanding catalytic performance of Co–Fe–P–Se/NC for OER (Fig. 4b). Moreover, Co–Fe/NC with different molar ratios of Co–Fe (Fig. S6†), Co–Fe–Se/NC with different mass ratios of selenium powder (Fig. S7†), and Co–Fe–P–Se/NC with different mass ratios of NaH2PO2·H2O (Fig. S8†) were prepared to explore the OER performance. EIS was fitted by an equivalent circuit (Fig. S9†). The Nyquist plots in Fig. 4c show that the obtained Co–Fe–P–Se/NC has the lowest charge-transfer resistance (3.235 Ω) (Table S1†), which is beneficial for improving the catalytic performance. Electrochemical double layer capacitance (EDLC) is an important parameter to evaluate the electrochemical surface area of the prepared electrocatalysts.66 The value of EDLC was obtained by using the CV method in the potential range of 1.07 V–1.17 V (Fig. S10†) and by plotting Δj/2 against the scan rate. As illustrated in Fig. 4d, Co–Fe–P–Se/NC presents the largest EDLC value of 4.2 mF cm−2 relative to Co/NC (1.53 mF cm−2), Fe/NC (1.6 mF cm−2), Co–Fe/NC (1.72 mF cm−2), Co–Fe–Se/NC (2.18 mF cm−2) and Co–Fe–P/NC (3 mF cm−2), indicating that the coexistence of different metals and heteroatoms can enlarge the contact surface area, which is in favor of improving the catalytic performance. Except catalytic performance, stability is also a significant parameter for the designed electrocatalyst. I–t chronoamperometric measurements were recorded to investigate the stability of the prepared electrocatalyst. As presented in Fig. 4e and f, the prepared Co–Fe–P–Se/NC exhibits a lower current loss of 25% after 7200 s relative to commercial catalysts (39.3%), demonstrating that its working stability is higher than that of RuO2.
From the above discussion, we inferred that the prepared catalysts delivered an outstanding catalytic performance for OER. Considering that the ORR performance is also a key reaction in rechargeable Zn–air batteries, we further measured the electrocatalytic activities for ORR in alkaline media. As shown in Fig. 5a, Co–Fe–P–Se/NC possesses the best catalytic performances for ORR except Pt/C; it exhibited the smallest half-wave potential (E1/2 = 0.76 V) relative to Co/NC (E1/2 = 0.7 V), Fe/NC (E1/2 = 0.708 V), Co–Fe/NC (E1/2 = 0.72 V), Co–Fe–Se/NC (E1/2 = 0.736 V), Co–Fe–P/NC (E1/2 = 0.71 V), Co–P–Se/NC (0.708 V) (Fig. S11c and d†) and Fe–P–Se/NC (0.719 V) (Fig. S11c and d†). This indicated that the coexistence of Co and Fe and the introduction of heteroatoms had paramount effects on improving the catalytic activity for ORR. As an ideal electrocatalyst for ORR, a four-electron reaction mechanism calculated by the K–L equation is necessary. Fig. 5b shows the LSVs of Co–Fe–P–Se/NC with different rotating rates. The limiting current density decreased as the rotating rate decreased, demonstrating that the current density is kinetically controlled. The electron number was calculated to be around four from the K–L plots (Fig. 5c), indicating that the prepared Co–Fe–P–Se/NC went through a desired four-electron reduction process. Long-term stability capability is also a significant parameter for the prepared electrocatalyst in ORR. As illustrated in Fig. 5d and e, the current density of Co–Fe–P–Se/NC shows negligible loss (about 39.6% loss in 0.1 M KOH) after 7200 s, which is better than that for commercial Pt/C (52.5% loss), revealing that Co–Fe–P–Se/NC had better stability than Pt/C.
The total oxygen electrode activity (Fig. 5f) was further evaluated by the potential difference (ΔE = Ej10 − E1/2) between OER (the potential at the current density of 10 mA cm−2 (Ej10) and ORR (E1/2). A smaller ΔE value means better reversible oxygen catalytic activity. It was found that the ΔE value of Co–Fe–P–Se/NC was smaller (0.741 V) than that of the Co–Fe/NC sample (0.86 V) except that for Pt/C + RuO2 (0.694 V).
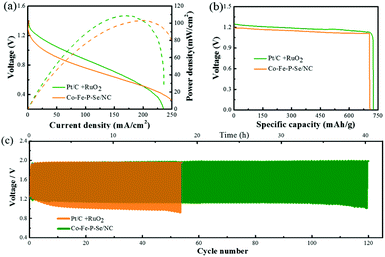
In terms of the excellent catalytic performances for both OER and ORR for the designed Co–Fe–P–Se/NC in alkaline media, we assembled the catalysts into a Zn–air battery composed of a polished zinc plate and Co–Fe–P–Se/NC with 6 M KOH (containing 0.2 M Zn(CH3COO)2) as the electrolyte. The open-circuit potential of the Zn–air battery (1.3 V) equipped with Co–Fe–P–Se/NC was slightly lower than that of Pt/C + RuO2 (1.39 V) (Fig. S12a†). As shown in Fig. S13a and b,† two tandem Zn–air batteries with the Co–Fe–P–Se/NC catalyst provide enough voltage to power the red LED (2.0 V). The discharge and charge polarization curves of Co–Fe–P–Se/NC and Pt/C + RuO2 are shown in Fig. S12b,† indicating that the prepared catalyst exhibits comparable charge and discharge curves with noble metals. Fig. 6a shows that the power density of the Zn–air battery equipped with the Co–Fe–P–Se/NC catalyst reaches 104 mW cm−2 at 200 mA cm−2, which is close to that of Pt/C + RuO2 (108.5 mW cm−2 at 167 mA cm−2). The specific capacity (Fig. 6b) and the energy density (Fig. S12c†) of Co–Fe–P–Se/NC (708 mA h g−1 and 805 W h kg−1, respectively) were close to those of Pt/C + RuO2 (725 mA h g−1 and 848 W h kg−1, respectively); this demonstrated the outstanding catalytic performance of the prepared catalyst, which was also comparable or even superior to those of the previously reported catalysts (Table S2†). The cycle performance of the battery was evaluated by a galvanostatic test via 10 min discharging and 10 min charging at a current density of 10 mA cm−2 (Fig. 6c). Initially, the battery made up of the Co–Fe–P–Se/NC catalyst afforded a voltage gap of 0.719 V (a discharge voltage of 1.219 V and a charge voltage of 1.938 V), and the battery made up of the Pt/C + RuO2 catalyst provided a voltage gap of 0.654 V (a discharge voltage of 1.259 V and a charge voltage of 1.913 V). However, the voltage gap of the Pt/C + RuO2 battery was larger than that of the Co–Fe–P–Se/NC battery after 5 cycles, which was in line with the polarization curves. Almost no obvious voltage change occurred in the Zn–air battery composed of the prepared Co–Fe–P–Se/NC after 40 hours, demonstrating outstanding cycling stability. As demonstrated above, the designed Co–Fe–P–Se/NC, as a promising bifunctional oxygen electrode catalyst, can potentially work as an oxygen electrode in metal–air batteries. Additionally, SEM images obtained after the zinc–air battery tests show that the nanosheet structures are well maintained (Fig. S14†). The TEM images (Fig. S15†) confirmed the carbon matrix and the main crystal phase FeP (121) and Fe3Se4 (202) could be well retained. Compared to the XRD pattern of the fresh one, the XRD pattern of the Co–Fe–P–Se/NC catalyst (Fig. S16†) after the zinc–air battery tests changed negligibly, suggesting the stability of this catalyst. Moreover, XPS analysis clarified the surface composition of Co–Fe–P–Se/NC after the zinc–air battery tests (Fig. S16†). In the Se 3d XPS spectrum (Fig. S17d†), the SeOx species increase obviously compared with the unreacted one, indicating that the surface of Co–Fe–P–Se/NC is oxidized during the OER and ORR processes.67 The P 2p, Fe 2p and Co 2p spectra (Fig. S17c, e and f†) indicate the same species compared with the XPS spectra before measurements. Hence, based on the SEM, TEM, XRD and XPS results, we affirmed that Co–Fe–P–Se/NC can maintain a relatively stable state.
Conclusions
In summary, we developed an innovative avenue to prepare two-dimensional carbon nanosheets with Co–Fe–P–Se nanoparticles via the pyrolysis of metal–organic frameworks in the presence of phosphorous and selenium sources, which presented outstanding catalytic performances for OER and ORR in alkaline electrolytes. As a proof of concept, rechargeable Zn–air batteries were constructed with the designed nanomaterials as electrodes and they presented an excellent performance and long-term cycling stability. The excellent catalytic properties could be ascribed to the following factors: the two-dimensional structure was beneficial for the electron transfer and exposed rich active sites; the three-dimensional morphology was favorable for the electrolyte transport and diffusion of gas; nitrogen doping in the carbon matrix also had a significant role in enhancing the catalytic activities; the coexistence of Co and Fe and the introduction of P and Se were critical to promote the catalytic performances. This work will accelerate the development of efficient and low-cost non-noble electrocatalysts with definite nanostructures in renewable energy conversion and storage.Conflicts of interest
There are no conflicts to declare.Acknowledgements
We acknowledge the funding support from National Natural Science Foundation of China (Grant No. 51604253), the Natural Science Foundation of Shandong Province of China (ZR2019BB002) and the Research Foundation for Distinguished Scholars of Qingdao Agricultural University (665-1119008); MOE & SAFEA for the 111 Project (B13025).Notes and references
- F. M. Li, X. Q. Gao, S. N. Li, Y. Chen and J. M. Lee, NPG Asia Mater., 2015, 7, e219 CrossRef CAS.
- Q. Xue, J. Bai, C. Han, P. Chen, J. X. Jiang and Y. Chen, ACS Catal., 2018, 8, 11287–11295 CrossRef CAS.
- G. Fu, Y. Liu, Y. Chen, Y. Tang, J. B. Goodenough and J. M. Lee, Nanoscale, 2018, 10, 19937–19944 RSC.
- G. Fu, J. Wang, Y. Chen, Y. Liu, Y. Tang, J. B. Goodenough and J. M. Lee, Adv. Energy Mater., 2018, 8, 1802263 CrossRef.
- J. S. Li, L. X. Kong, Z. Wu, S. Zhang, X. Y. Yang, J. Q. Sha and G. D. Liu, Carbon, 2019, 145, 694–700 CrossRef CAS.
- Z. Wu, D. Nie, M. Song, T. Jiao, G. Fu and X. Liu, Nanoscale, 2019, 11, 7506–7512 RSC.
- G. Fu, Z. Cui, Y. Chen, Y. Li, Y. Tang and J. B. Goodenough, Adv. Energy Mater., 2017, 7, 1601172 CrossRef.
- C. Zhu, Z. Yin, W. Lai, Y. Sun, L. Liu, X. Zhang, Y. Chen and S. L. Chou, Adv. Energy Mater., 2018, 8, 1802327 CrossRef.
- J. Fu, R. Liang, G. Liu, A. Yu, Z. Bai, L. Yang and Z. Chen, Adv. Mater., 2019, 31, 1805230 CrossRef PubMed.
- K. Kordek, L. Jiang, K. Fan, Z. Zhu, L. Xu, M. Al-Mamun, Y. Dou, S. Chen, P. Liu, H. Yin, P. Rutkowski and H. Zhao, Adv. Energy Mater., 2019, 9, 1802936 CrossRef.
- L. Yang, L. Shi, D. Wang, Y. Lv and D. Cao, Nano Energy, 2018, 50, 691–698 CrossRef CAS.
- G. Fu, Z. Cui, Y. Chen, L. Xu, Y. Tang and J. B. Goodenough, Nano Energy, 2017, 39, 77–85 CrossRef CAS.
- P. Cai, S. Ci, E. Zhang, P. Shao, C. Cao and Z. Wen, Electrochim. Acta, 2016, 220, 354–362 CrossRef CAS.
- H. W. Liang, Z. Y. Wu, L. F. Chen, C. Li and S. H. Yu, Nano Energy, 2015, 11, 366–376 CrossRef CAS.
- X. Peng, L. Zhang, Z. Chen, L. Zhong, D. Zhao, X. Chi, X. Zhao, L. Li, X. Lu, K. Leng, C. Liu, W. Liu, W. Tang and K. P. Loh, Adv. Mater., 2019, 31, 1900341 CrossRef PubMed.
- Z. Wu, J. Wang, M. Song, G. Zhao, Y. Zhu, G. Fu and X. Liu, ACS Appl. Mater. Interfaces, 2018, 10, 25415–25421 CrossRef CAS PubMed.
- S. Wang, H. Jang, J. Wang, Z. Wu, X. Liu and J. Cho, ChemSusChem, 2019, 12, 830–838 CrossRef CAS PubMed.
- J. Yang, Y. Xiao, Q. Zhao, G. Zhang, R. Wang, G. Teng, X. Chen, M. Weng, D. He, S. Mu, Y. Lin and F. Pan, Nano Energy, 2019, 59, 443–452 CrossRef CAS.
- L. Zhuang, Y. Jia, H. Liu, X. Wang, R. K. Hocking, H. Liu, J. Chen, L. Ge, L. Zhang, M. Li, C. L. Dong, Y. C. Huang, S. Shen, D. Yang, Z. Zhu and X. Yao, Adv. Mater., 2019, 31, e1805581 CrossRef PubMed.
- G. Maduraiveeran and W. Jin, Trends Environ. Anal. Chem., 2017, 13, 10–23 CrossRef CAS.
- X. Xue, H. Yang, T. Yang, P. Yuan, Q. Li, S. Mu, X. Zheng, L. Chi, J. Zhu, Y. Li, J. Zhang and Q. Xu, J. Mater. Chem. A, 2019, 7, 15271–15277 RSC.
- Z. Cui, Y. Li, G. Fu, X. Li and J. B. Goodenough, Adv. Mater., 2017, 29, 1702385 CrossRef PubMed.
- Y. Qian, Z. Hu, X. Ge, S. Yang, Y. Peng, Z. Kang, Z. Liu, J. Y. Lee and D. Zhao, Carbon, 2017, 111, 641–650 CrossRef CAS.
- Q. Yu, C. Wu, J. Xu, Y. Zhao, J. Zhang and L. Guan, Carbon, 2018, 128, 46–53 CrossRef CAS.
- A. Sumboja, J. Chen, Y. Zong, P. S. Lee and Z. Liu, Nanoscale, 2017, 9, 774–780 RSC.
- P. Cai, Y. Hong, S. Ci and Z. Wen, Nanoscale, 2016, 8, 20048–20055 RSC.
- J. Wu, H. Zhou, Q. Li, M. Chen, J. Wan, N. Zhang, L. Xiong, S. Li, B. Y. Xia, G. Feng, M. Liu and L. Huang, Adv. Energy Mater., 2019, 9, 1900149 CrossRef.
- Y. Chen, Z. Li, Y. Zhu, D. Sun, X. Liu, L. Xu and Y. Tang, Adv. Mater., 2019, 31, 1806312 CrossRef PubMed.
- P. Yu, L. Wang, F. Sun, Y. Xie, X. Liu, J. Ma, X. Wang, C. Tian, J. Li and H. Fu, Adv. Mater., 2019, 31, 1901666 CrossRef PubMed.
- J. Li, Q. Zhou, C. Zhong, S. Li, Z. Shen, J. Pu, J. Liu, Y. Zhou, H. Zhang and H. Ma, ACS Catal., 2019, 9, 3878–3887 CrossRef CAS.
- L. Zhuang, L. Ge, Y. Yang, M. Li, Y. Jia, X. Yao and Z. Zhu, Adv. Mater., 2017, 29, 1606793 CrossRef PubMed.
- Y. Liu, C. Ma, Q. Zhang, W. Wang, P. Pan, L. Gu, D. Xu, J. Bao and Z. Dai, Adv. Mater., 2019, 31, 1900062 CrossRef PubMed.
- Y. Shi, Y. Yu, Y. Liang, Y. Du and B. Zhang, Angew. Chem., Int. Ed., 2019, 58, 3769–3773 CrossRef CAS PubMed.
- T. Ouyang, Y. Q. Ye, C. Y. Wu, K. Xiao and Z. Q. Liu, Angew. Chem., Int. Ed., 2019, 58, 4923–4928 CrossRef CAS PubMed.
- S. Wang, J. Qin, T. Meng and M. Cao, Nano Energy, 2017, 39, 626–638 CrossRef CAS.
- H. B. Wu and X. W. Lou, Sci. Adv., 2017, 3, eaap9252 CrossRef PubMed.
- B. Zhu, D. Xia and R. Zou, Coord. Chem. Rev., 2018, 376, 430–448 CrossRef CAS.
- T. A. Shifa, F. Wang, Y. Liu and J. He, Adv. Mater., 2018, 1804828 CrossRef PubMed.
- L. Wang, Z. Zeng, W. Gao, T. Maxson, D. Raciti, M. Giroux, X. Pan, C. Wang and J. Greeley, Science, 2019, 363, 870–874 CrossRef CAS PubMed.
- Y. Zhu, W. Peng, Y. Li, G. Zhang, F. Zhang and X. Fan, Small Methods, 2019, 3, 1800438 CrossRef.
- S. Li, C. Cheng, H. W. Liang, X. Feng and A. Thomas, Adv. Mater., 2017, 29, 1700707 CrossRef PubMed.
- X. Liu, C. Giordano and M. Antonietti, Small, 2014, 10, 193–200 CrossRef CAS PubMed.
- W. Wei, H. Liang, K. Parvez, X. Zhuang, X. Feng and K. Müllen, Angew. Chem., Int. Ed., 2014, 53, 1570–1574 CrossRef CAS PubMed.
- Z. Wu, M. Song, Z. Zhang, J. Wang, H. Wang and X. Liu, Appl. Surf. Sci., 2019, 465, 724–729 CrossRef CAS.
- J. S. Li, Y. Wang, C. H. Liu, S. L. Li, Y. G. Wang, L. Z. Dong, Z. H. Dai, Y. F. Li and Y. Q. Lan, Nat. Commun., 2016, 7, 11204 CrossRef CAS PubMed.
- S. Li, C. Cheng, X. Zhao, J. Schmidt and A. Thomas, Angew. Chem., Int. Ed., 2018, 57, 1856–1862 CrossRef CAS PubMed.
- X. Zheng, X. Han, H. Liu, J. Chen, D. Fu, J. Wang, C. Zhong, Y. Deng and W. Hu, ACS Appl. Mater. Interfaces, 2018, 10, 13675–13684 CrossRef CAS PubMed.
- Z. Qian, Y. Chen, Z. Tang, Z. Liu, X. Wang, Y. Tian and W. Gao, Nano-Micro Lett., 2019, 11, 28 CrossRef CAS.
- S. H. Ahn and A. Manthiram, Small, 2017, 13, 1702068 CrossRef PubMed.
- X. Zhong, Y. Jiang, X. Chen, L. Wang, G. Zhuang, X. Li and J. g. Wang, J. Mater. Chem. A, 2016, 4, 10575–10584 RSC.
- Z. Wu, M. Song, J. Wang and X. Liu, New J. Chem., 2018, 42, 8800–8804 RSC.
- S. Liu, J. Zhou and H. Song, Chem. Commun., 2018, 54, 9825–9828 RSC.
- K. Ezzayani, A. Ben Khelifa, E. Saint-Aman, F. Loiseau and H. Nasri, J. Mol. Struct., 2017, 1137, 412–418 CrossRef CAS.
- J. Seo, J. W. Chung, I. Cho and S. Y. Park, Soft Matter, 2012, 8, 7617–7622 RSC.
- C. Xie, D. Yan, W. Chen, Y. Zou, R. Chen, S. Zang, Y. Wang, X. Yao and S. Wang, Mater. Today, 2019 DOI:10.1016/j.mattod.2019.05.021.
- D. Yan, Y. Li, J. Huo, R. Chen, L. Dai and S. Wang, Adv. Mater., 2017, 29, 1606459 CrossRef PubMed.
- Z. Wu, J. Wang, L. Han, R. Lin, H. Liu, H. L. Xin and D. Wang, Nanoscale, 2016, 8, 4681–4687 RSC.
- J. Zhang, Z. Xia and L. Dai, Sci. Adv., 2015, 1, e1500564 CrossRef PubMed.
- K. Shehzad, Y. Xu, C. Gao and X. Duan, Chem. Soc. Rev., 2016, 45, 5541–5588 RSC.
- M. Wu, J. Wang, Z. Wu, H. L. Xin and D. Wang, J. Mater. Chem. A, 2015, 3, 7727–7731 RSC.
- P. He, X. Y. Yu and X. W. Lou, Angew. Chem., Int. Ed., 2017, 56, 3897–3900 CrossRef CAS PubMed.
- T. Wu, M. Pi, D. Zhang and S. Chen, J. Mater. Chem. A, 2016, 4, 14539–14544 RSC.
- S. Liu, D. Li, G. Zhang, D. Sun, J. Zhou and H. Song, ACS Appl. Mater. Interfaces, 2018, 10, 34193–34201 CrossRef CAS PubMed.
- J. Yu, W. J. Li, H. Zhang, F. Zhou, R. Li, C. Y. Xu, L. Zhou, H. Zhong and J. Wang, Nano Energy, 2019, 57, 222–229 CrossRef CAS.
- J. Chen, C. Fan, X. Hu, C. Wang, Z. Huang, G. Fu, J. M. Lee and Y. Tang, Small, 2019, 15, e1901518 CrossRef PubMed.
- Z. Wu, J. Wang, J. Zhu, J. Guo, W. Xiao, C. Xuan, W. Lei and D. Wang, Electrochim. Acta, 2017, 232, 254–261 CrossRef CAS.
- Y. Chen, Z. Ren, H. Fu, X. Zhang, G. Tian and H. Fu, Small, 2018, 14, e1800763 CrossRef PubMed.
Footnote |
| † Electronic supplementary information (ESI) available. See DOI: 10.1039/c9nr05744g |
| This journal is © The Royal Society of Chemistry 2019 |

