
Unveiling lasing mechanism in CsPbBr3 microsphere cavities†
Wenna
Du‡
a,
Shuai
Zhang‡
ab,
Zhiyong
Wu
ac,
Qiuyu
Shang
d,
Yang
Mi
a,
Jie
Chen
abd,
Chaochao
Qin
c,
Xiaohui
Qiu
a,
Qing
Zhang
*de and
Xinfeng
Liu
 *a
*a
aCAS Key Laboratory of Standardization and Measurement for Nanotechnology, CAS Center for Excellence in Nanoscience, National Center for Nanoscience and Technology, Beijing 100190, China. E-mail: liuxf@nanoctr.cn
bUniversity of Chinese Academy of Sciences, Beijing 100049, P. R. China
cCollege of Physics and Materials Science, Henan Normal University, Xinxiang 453007, P. R. China
dDepartment of Materials Science and Engineering, College of Engineering, Peking University, Beijing 100871, China
eState Key Laboratory for Mesoscopic Physics, School of Physics, and Collaborative Innovation Center of Quantum Matter, Peking University, Beijing 100871, China
First published on 22nd January 2019
Abstract
Recently, the light–matter interaction of perovskite microcavities has been widely explored for its great potential in low-threshold lasing devices. However, the mechanism of perovskite lasing remains unclear to date. In this study, we demonstrated high-quality single-mode excitonic lasing in CsPbBr3 microspheres, providing an ideal platform to study the underlying physics of lasing behavior. We show that the lasing mechanism shifts from the exciton–exciton scattering to the exciton–phonon scattering with the increase in temperature from 77 to 300 K, which was verified by temperature-dependent photoluminescence (PL), time-resolved photoluminescence (TRPL) as well as temperature-dependent Raman spectroscopy. Furthermore, by analyzing PL line width broadening with varied temperatures, we found that two different phonon modes were involved in the exciton–phonon scattering process. The scattering from the low-energy phonon (∼8.6 meV) is the dominant source of exciton–phonon coupling in the intermediate temperature range (77 to 230 K), while the high-energy phonon (∼15.3 meV) dominates from 230 K to room temperature. These results confirm the lasing mechanism in such perovskite-based micro/nano-cavities and significantly influence the development of future low-threshold lasers.
1. Introduction
Small solid-state lasers have shown great potential in applications such as optical integration, high-speed communication and high-resolution imaging. Over the past decades, a variety of semiconductor nanostructures including nanowires (NWs), nanoribbons, and quantum dots (QDs) have been utilized to serve as active materials for small lasers.1–8 Despite these great successes, high lasing threshold is still an obstacle in small lasers due to their large optical losses.9–11 Recently, lead halide perovskites have attracted considerable attention for their unprecedented success in the field of photovoltaics research12–15 due to their high absorption coefficient, large carrier diffusion length and low density of defects.16–18 Moreover, perovskites provide excellent gain, which is crucial for a high-performance coherent light source.19–21 Till now, perovskite-based small lasers have been realized in many micro/nanostructures at room temperature, such as NWs,22–27 nanoplatelets (NPs),28,29 and QDs.30–32 Compared to the conventional II–VI/III–V semiconductors, the optically pumped perovskite microlasers based on such nanostructures show even lower threshold, better spectral coherence, and wide-range emission colours.21,24,25,33,34However, it remains unclear whether the emission of perovskites originates from free charge carriers or excitons,34–38 and the mechanism of lasing in these microcavities has been rarely discussed, although it is critical to the rational development of small lasers. The basic condition of lasing is that the stimulated emission is greater than the absorption, that is, the optical gain is positive. Previously, two main mechanisms were generally involved to produce significant gain: excitonic and electron–hole plasma (EHP) process.39–42 In the intermediate density regime where excitons are still good quasiparticles, the following stimulated emission or lasing due to various excitonic processes was observed: (1) exciton–exciton (ex–ex) scattering; (2) exciton-longitudinal optical phonon (ex-LO) scattering; and (3) exciton-electron (ex-el) scattering. However, excitons are no longer good quasi particles in the high density regime, which means that excitonic processes are hardly relevant at these densities. The laser action is converted from an excitonic process to an EHP emission. An EHP state is formed when the density of electron–hole pairs exceeds the Mott density nM, where screening effect sufficiently reduces the Coulomb interaction such that bound excitonic states cannot exist.38,43 Despite these intrinsic properties, the geometry and quality of microcavities and excitation methods can also affect the optical gain and lasing mechanism.40,42 Temperature-dependent spontaneous emission (SE) and lasing spectroscopy are well-established methods to study the lasing mechanism. However, the multimode lasers inevitably introduce big errors. Very recently, the low threshold, single-mode lasing has been demonstrated in microsphere/nanocuboid cavities, which provide an ideal system to explore the light–matter interaction involved in the lasing process.38,44,45 However, the underlying physics of a particular lasing behavior has barely been researched, and the lasing mechanism in these CsPbBr3 microspheres remains unclear and controversial to date. Accordingly, some researchers thought that the emission of perovskites originated from excitons,34 while others considered it to originate from the bimolecular recombination of free charge carriers.37 Yang et al. postulated that an EHP mechanism is responsible for the stimulated emission in CsPbBr3 nanowires at the carrier density three times larger than the bulk CsPbBr3 Mott density.22 Later, Wang et al. and Liu et al. proposed that the formation of EHP was the origin of the contribution from stimulated emission to optical gain in CsPbBr3 nanostructures under high-intensity two-photon excitation.38,46
In this study, we performed temperature-dependent photoluminescence (PL) and time-resolved photoluminescence (TRPL) experiments as well as Raman spectroscopy to confirm the mechanism of lasing in CsPbBr3 microsphere cavities. When the temperature T is 77–150 K, the lasing mechanism is dominated by ex–ex scattering, while the exciton–phonon scattering plays a key role when T is 150–300 K. Systemic Raman and temperature-dependent SE spectroscopy suggest that two phonon modes (∼8.6 meV and ∼15.3 meV) were involved in the exciton–phonon scattering process by analyzing the PL line width at different temperature regions. The scattering from the low-energy phonon is the dominant source of exciton–phonon coupling in the intermediate temperature range (77 to 230 K), while the high-energy phonon dominates from 230 K to the room temperature. All of our experimental results suggest that the lasing mechanism is ascribed to the formation of excitons (scattering with exciton or phonon) instead of electron–hole plasma at all temperature regions.
2. Results and discussion
CsPbBr3 microspheres were grown on silicon wafer substrates by the chemical vapor deposition (CVD) method (for growth conditions, see ESI, Section I†). The microsphere structures were selected for the following two reasons: (1) the spherical structure can support the whispering gallery mode (WGM) with relatively higher Q-factor compared with the other Fabry–Pérot (FP) or WGM microcavities confined in NWs and NPs.44,45 Hence, the lasing could be realized at a quite low pumping intensity in order to suppress the heating, band filling, band renormalization and screening effects occurring at high excitation density. (2) The diameter of CsPbBr3 microspheres is as small as several microns; with this dimension NWs or platelets can be replaced by microspheres for single mode lasers; therefore, the temperature-dependent lasing wavelength and emission width can be precisely resolved. Fig. 1a shows a typical SEM image of CsPbBr3 microspheres grown on a silicon substrate with diameters varying from 1.0 to 3.0 μm. They have a perfectly spherical configuration and good smooth surface (inset, Fig. 1a), which can be clearly verified further in the SEM images of the sphere samples with different tilted angles (see ESI, Section II†). Energy-dispersive spectrometer (EDS) mapping confirms the uniform spatial distribution of the contained chemical elements with a clear boundary of the CsPbBr3 microsphere (Fig. 1b). The X-ray diffraction (XRD) pattern (Fig. 1c) shows the two peaks corresponding to the (002) and (110) face of the orthorhombic phase of CsPbBr3,22 which is quite stable below 370 K.47,48 As shown in Fig. 1d, the CsPbBr3 microsphere presents a broad absorption band with the edge at ∼530 nm. The PL peak is located at 532 nm at room temperature with full width at half maximum (FWHM) of ∼20 nm, which is consistent with previous researches.35 These characterizations of morphology and spectroscopy confirmed the high quality of the as-grown CsPbBr3 microspheres.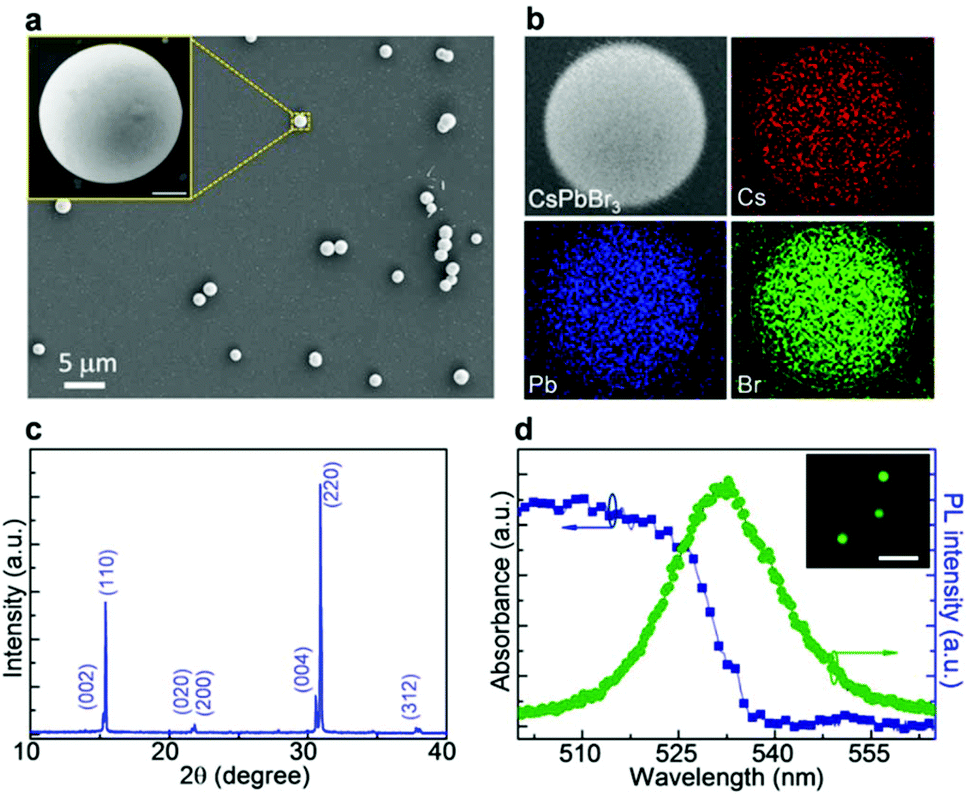 | ||
| Fig. 1 Characterizations of CsPbBr3 microspheres. (a) A typical SEM image of the CsPbBr3 microcrystals grown on silicon wafer showing a sphere shape. Scale bar is 5 μm. Inset is the magnified SEM image of a typical CsPbBr3 microsphere. Scale bar is 0.5 μm. (b) EDS mapping of CsPbBr3 microsphere, showing the uniform composition of the CsPbBr3 microspheres. The SEM image is shown for comparison. (c) XRD pattern of the as-grown CsPbBr3 microspheres. (d) Optical absorption spectrum (navy) and PL spectra (olive) of the sample of CsPbBr3 microspheres, and insert shows the photoluminescence image of the CsPbBr3 microspheres. The scale bar inside is 5 μm. | ||
Room-temperature optically pumped PL spectroscopy was performed on the CsPbBr3 microspheres. The schematic is shown in Fig. 2a, where a 400 nm-fs-pulse laser pumps the whole body of CsPbBr3 microspheres to ensure high excitation efficiency and low heating effects. The green line illuminates the propagation mode of light in individual microsphere via total reflection on the microsphere-air interface. The pump-fluence-dependent emission spectra in Fig. 2b show the transition from SE to laser behavior in a typical CsPbBr3 microsphere with a diameter of ∼2 μm. At low pump fluence, there is only a single broad emission peak located at ∼530 nm owing to SE. When pump fluence exceeds 3.5 μJ cm−2, one sharp peak generates above the SE profile and further becomes dominant in the emission spectra. The relation of integrated intensity versus pump fluence in Fig. 2c reveals an S-shaped curve, confirming the achievement of lasing with a threshold of 3.5 μJ cm−2. The transition can also be indicated from the optical image at different pump fluence. Below the threshold, the microsphere mainly exhibits uniform luminescence, which is maintained by the laser spot (left inset, Fig. 2c). Coherent light emission can be inferred from the optical image above the threshold (right inset, Fig. 2c) with a multi-circular pattern originated from the interference in the WGM microcavity. Furthermore, the saturation region (>5 μJ cm−2) has the same slope with the spontaneous emission region fitted by I = Pk. The value of 1 < k < 2 is just consistent with excitonic emission for excitation laser energy exceeding the gap energy.49 The carrier density at the threshold is estimated to be ≈7.0 × 1016 cm−3 under the present excitation conditions, which is below the Mott density of CsPbBr3 reported (from 1.8 × 10¹⁷ to 1.0 × 1019 cm−3),21,50 suggesting that the lasing may not be due to EHP lasing.21,40,41 When the pump intensity is above the threshold, the position and FWHM of the lasing mode show a non-monotonic shift or a slight change (Fig. 2d), also suggesting that the laser emission occurring in the CsPbBr3 microspheres should be an excitonic property rather than an EHP emission.40 Moreover, the large exciton binding energy (from 65–86 meV, ESI, Section III†) and approximate linear dependence of PL intensity on laser power (see ESI, Section IV†) also verify that excitons instead of free charge carriers exist at room temperature and at these excited conditions.
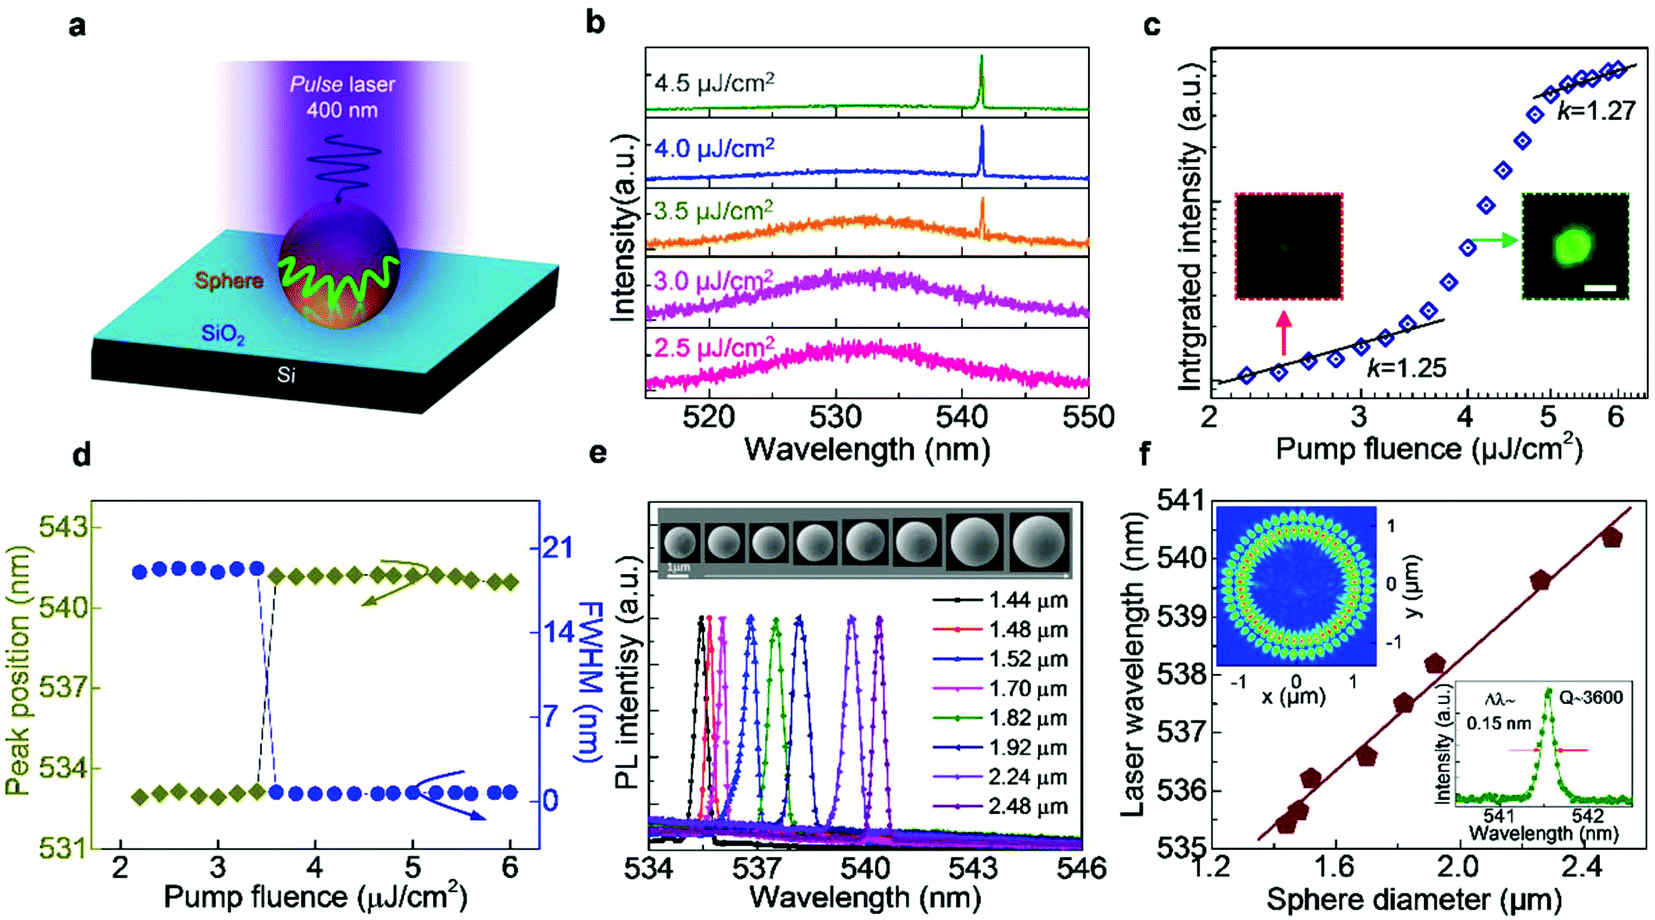 | ||
| Fig. 2 Coherent light emission from the CsPbBr3 microspheres. (a) Schematic of the experimental setup, a CsPbBr3 microsphere lying on a SiO2 substrate. A 400 nm (80 fs, 1 kHz) pulsed laser source (violet arrow) pumping the entire microsphere, and the microsphere emitting in green. (b) Emission spectra of CsPbBr3 microspheres with increasing pump fluence around threshold, showing the broadening emission spectra before threshold, and a sudden sharp laser peak at and above threshold. (c) Output intensity as a function of excitation power. Black lines are fitting curves with I = ∼Pk. Insets: Optical images (with pump laser filtered out) showing emission from the CsPbBr3 microsphere below threshold (left), and above threshold (right). The scale bar is 2 μm. (d) For spontaneous emission and lasing, the wavelength and line width versus the excitation pump fluence. (e) Single-mode lasing spectra of eight typical CsPbBr3 microspheres with different diameters. Inset: Magnified SEM image of CsPbBr3 microspheres with diameter from ∼1 to 3 μm. The scale bar is 1 μm. (f) The resonant mode is extracted and plotted as a function of the diameter of CsPbBr3 microspheres. Upper left inset: Simulated electric field distribution under a transverse magnetic resonant mode at ∼540 nm. Bottom inset: Amplified spectrum for CsPbBr3 microsphere. The experimental data (green dots) was well fitted by Lorentz curve, giving an ultra-narrow FWHM of ∼0.15 nm and high-quality factor Q of ∼3600. | ||
The observed lasing emission in these microspheres is usually single mode and on the lower energy side of the PL peak, as is illustrated in Fig. 2e. The generation of low-energy laser modes can be explained as the counterbalance of optical gain and finite self-absorption at absorption tail.51 The laser peak can be modulated from 537 to 542 nm by changing the diameter of the microsphere from 1 to 3 μm. This can be explained by the relation of the WGM and cavity length in a spherical cavity,44
| πD/(λ/N) ≈ ν. | (1) |
Here, the wavelength of the mode peak λ at different mode orders ν is determined by the optical path of the spherical cavity with the parameters of diameter D and refractive index of the active material N. For a fixed mode order, the resonant WGM peak scales linearly with the diameter of the spherical cavity. This is consistent with the relation of single-mode laser peak versus diameter of CsPbBr3 microspheres, as depicted in Fig. 2f. When the diameter of CsPbBr3 microspheres increases, lasing peaks shift to longer wavelength, which can be fitted linearly as expected from eqn (1). To investigate the mode type of the single-mode laser in this spherical WGM microcavity, finite element simulation by FDTD solution was employed with consideration of the material dispersion of CsPbBr3. Upper-left inset of Fig. 2f shows the electric field distribution of transverse magnetic (TM) polarized WGM modes (at wavelength of ∼540 nm) in the microsphere with the diameter of 2.48 μm, which is consistent with the experimental results (see inset of Fig. 2c). The preferred TM-mode lasing in these CsPbBr3 microspheres can also be seen in CsPbBr3 perovskite nanoplatelets and microdisks.34,52 In addition, a sharp lasing peak presented in the lower-right inset of Fig. 2f indicates the high-quality laser mode. Using the Lorentz function fitting, a FWHM of 0.15 nm is obtained. The quality factor Q is further determined to be ∼3600 by Q = λ/δλ, where λ and δλ are the center wavelength and FWHM of the peak profile, respectively. These values in such sub-micron spheres are better than those in other nanolasers reported in previous literatures.22,38,53 In general, the Q factor can be degraded in the smaller cavity approaching the wavelength of light due to the increased leakage of light. The excellent lasing performance in these CsPbBr3 microspheres can be understood to be due to the high-quality single crystalline characteristic with a smooth surface avoiding radiation loss in the corners and low defects, together with the high optical gain in CsPbBr3.
Next, temperature-dependent lasing behavior was investigated to explore the mechanism of lasing in the CsPbBr3 microspheres. Fig. 3a presents the normalized lasing spectra of a typical CsPbBr3 microsphere when the temperature varies from 77 to 300 K. When the temperature is in the range of 77–150 K, the lasing position locates at the low-energy side of SE and almost remains unchanged; as the temperature increases from 150 to 300 K, the lasing position redshifts from 533.4 nm to 535.2 nm, which is consistent with reports from previous literature on CsPbBr3 quantum dots.39,54 The variation tendency of the single-mode lasing peak with the temperature is consistent with that of the PL peak position, as presented in Fig. 3b. A summary of these temperature-dependent data in Fig. 3c clearly shows the weaker temperature dependence of the spontaneous and stimulated emission peaks below 150 K, and the following monotonic red-shift at the slope of ∼0.04 nm K−1 at higher temperatures. This consistency indicates that the behaviors of the single-mode lasing have been derived from the material gain with temperature rather than optical cavity mode gain modulation, as shown in Fig. 2e.
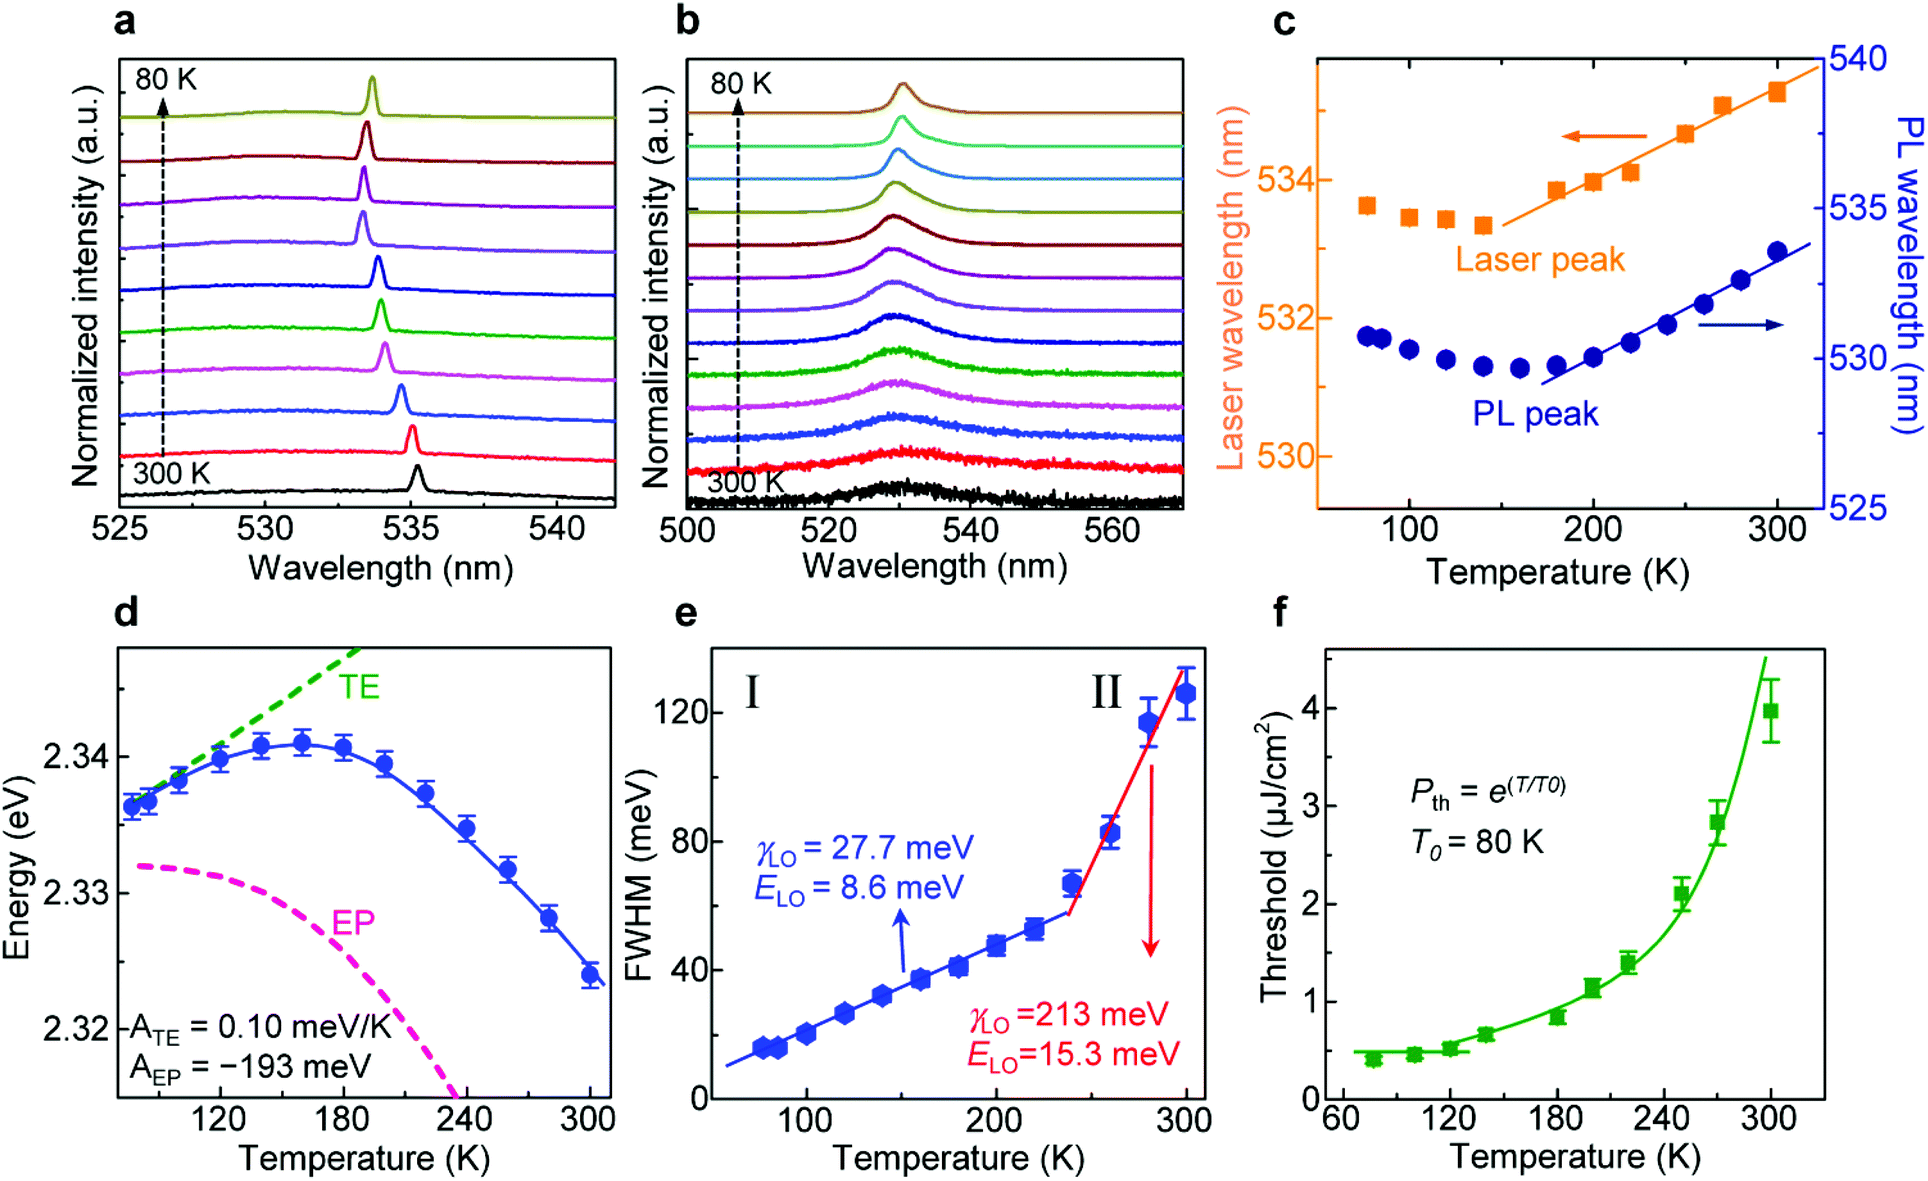 | ||
| Fig. 3 Temperature-dependent photoluminescence of the CsPbBr3 microspheres. (a) Normalized lasing spectra of a typical CsPbBr3 microsphere at different temperatures from 77 to 300 K. (b) Normalized PL spectra of a typical CsPbBr3 microsphere at a temperature range from 77 to 300 K. (c) A summary of the variation tendency of the single-mode lasing peak and PL emission wavelength with temperature. (d) The emission peak energy of the microspheres with increasing temperatures from 77 to 300 K. The solid line is the fitting result; the dashed lines show the individual contributions of TE and EP interaction. (e) Plot of the change in FWHM with temperature from 77 K to 300 K, presenting a drastic change at 235 K. The solid line is the fit according to eqn (2). (f) Temperature-dependent lasing threshold in the range from 77 to 300 K, fitted by the exponential function, giving a characteristic temperature T0 = 80 K. | ||
A detailed analysis of the PL spectra under different temperatures ranging from 77 to 300 K was conducted in order to confirm the lasing mechanism of CsPbBr3 microspheres supposed above. By assuming a linear relationship between lattice constant and temperature, the temperature dependence of the PL peak energy is generally estimated by the following expression,54
 | (2) |
Furthermore, we can see an inflection point near 230 K in the plot of the change in FWHM with the temperature (Fig. 3e), where the slope of the curve from 77 to 230 K is different from that above 230 K. The FWHM of the PL measured above 230 K increases faster than that below 230 K. The analysis of temperature-dependent emission broadening has long been used to evaluate the mechanism of exciton–phonon coupling in a large number of inorganic semiconductors. The emission broadening can be expressed as55
 | (3) |
where Γ0 is the term of a temperature-independent inhomogeneous broadening, which results from the disorder and imperfection scattering. The second term is the homogeneous broadening term, which arises from LO phonon-charge scattering. γLO and ELO are carrier–phonon coupling strength and the LO phonon energy, respectively. Piecewise fitting of the temperature-dependent PL line width with temperature using eqn (3) was plotted in Fig. 3e, yielding the coupling strength γLO = 27.7 meV and an average phonon energy of ELO = 8.6 meV in region I (below 230 K), and the coupling strength γLO = 213 meV and an average phonon energy of ELO = 15.3 meV in region II (from 230 to 300 K). Therefore, a preliminary conclusion can be drawn that phonons of different energies are dominant at different temperature regions, and the exciton–phonon coupling strength γLO in region II is much stronger than that in region I. Thus, we conjecture that two different phonon modes participate in the exciton–phonon scattering, and the ex-LO phonon scattering that involves the phonon with energy of ELO = 15.3 meV is more significant.
In addition, the lasing threshold (Pth) can be increased from ∼0.4 μJ cm−2 to 3.5 μJ cm−2 when the sample temperature rises from 77 K to 300 K (Fig. 3f). Therefore, the threshold dependence shows little temperature dependence at lower temperature accompanied by nearly constant SE and lasing position, which is consistent with the reported lasing from exciton–exciton scattering.42 At temperatures above 150 K, the higher exciton states become thermally populated and cause an increase in the lasing threshold of the exciton–exciton process. Exciton scattering with LO phonons can contribute more to gain at these temperatures at the same time, which leads to the threshold rising exponentially due to the thermal population of the optical phonon branch. Therefore, at the higher temperature, the lasing mechanism of CsPbBr3 microspheres can be attributed to the ex-LO phonon scattering process. Moreover, this temperature-dependent variation tendency is fitted by the empirical function Pth = ∼eT/T0, where T is the measured temperature and T0 is a characteristic temperature. A large T0 indicates a weak dependence on the temperature of Pth, which suggests that a semiconductor laser has good quality. Here, the obtained T0 is 80 K in the temperature range of 77–300 K, which is comparable to that of a conventional semiconductor.56,57
To confirm the exciton–phonon coupling in sphere microcavities, Raman measurement was executed using 633 nm-laser as the excitation source (see ESI, Section V†). There is no effect of phase change on the temperature-dependent Raman spectra from 103 K to 303 K, as mentioned above. As it can be observed from Fig. 4a recorded at T = 103 K, Raman spectrum of the CsPbBr3 perovskite microsphere has two major regions: one region near 70 cm−1 with three sharp major peaks, and another region near 130 cm−1 with broad, overlapping peaks. Fitted by Lorentz function to obtain the exact value of wave number, five Raman modes centered at around 60, 70, 76, 127 and 141 cm−1 were, respectively, recognized (as labeled in Fig. 4a), which agree well with a previous report.58 A detailed analysis of the vibrational modes of the CsPbBr3 microsphere reveals that they are derived mainly from the [PbBr6]4− anion. Based on previous work,59 the peak at 141 cm−1 is assigned to the symmetric Pb–Br stretching mode, whereas the peak at 127 cm−1 is the antisymmetric partner. The strong modes at 76 cm−1 and 70 cm−1 are assigned to the bending mode of Br–Pb–Br and its antisymmetric partner. But the peak at 62 cm−1 is indeterminate, it may be assigned to Pb–Br bending or lattice deformation mode, and needs to be further studied. Nevertheless, Raman modes at ∼70 cm−1 and ∼127 cm−1 are regarded as the signature of phonons with energy of 8.6 meV fitted in region I of Fig. 3e and of 15.3 meV obtained in region II of Fig. 3e, respectively. As mentioned earlier, no structural phase transitions were observed below 370 K. Hence, the different scattering mechanisms are derived from the participation of different vibrational modes, in other words, coupling with different LO phonons. The 76 cm−1 phonon mode plays a key role but has a weaker coupling strength in region I, and in region II the 126 cm−1 phonon mode is dominant with stronger coupling strength with the increase in temperature. To further analyze the temperature-dependent Raman spectra, we extracted the Raman shift and FWHM of the main peak at 76 cm−1 to plot the change with temperature (Fig. 4b and c). Without structural phase transitions, the major contribution to the temperature dependence of the phonon wavenumber is expected to be the anharmonicity. In this model, the variation of phonon frequency ω(T) and width Γ(T) can be described by an anharmonic expression60 (see ESI, Section VI†). As shown in Fig. 4b and c, the experimental results for Raman frequency show blue shift and the line-width broadens as the temperature increases from 103 K to 303 K. Also shown is the fit to the data (solid curve) specified by the above model. The experimental phenomena of line width and wave number conform to the anharmonic behavior,61 with A, B, C and D of 0.065 cm−1, −0.026 cm−1, 0.45 cm−1 and 0.04 cm−1, respectively, and ω0 of 78.15 cm−1. The anharmonic behavior indicates that there is an interaction between phonons,62,63 also known as thermal expansion, which is consistent with the fitting results of the temperature dependence of the PL peak energy in Fig. 3d.
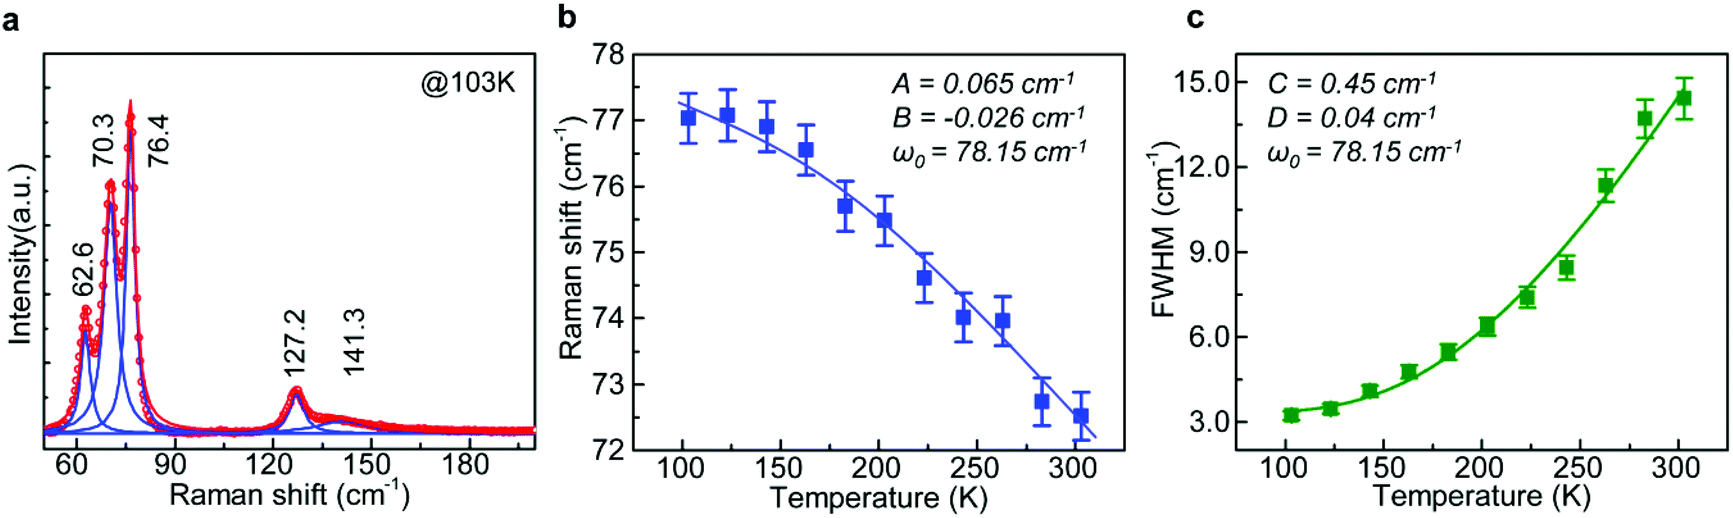 | ||
| Fig. 4 Temperature-dependent Raman spectra of the CsPbBr3 microspheres. (a) Raman spectrum of the CsPbBr3 microspheres measured with a 633 nm excitation laser at 103 K. Five Raman peaks at 62.6, 70.3, 76.4, 127.2 and 126 cm−1 are obtained by peak fitting. (b) and (c) Temperature dependence of position and line width of the Raman mode at 76 cm−1. Inside are fitting parameters using the equations from ref. 54. | ||
Temperature-dependent TRPL spectra were measured to study the exciton recombination dynamics of the CsPbBr3 microsphere. Fig. 5a plots three representative PL decay curves at 77 K, 180 K and 280 K. All experimental data and multi-exponential decay fitting results are presented in the ESI (see Section VII†). The average lifetime provides an overall comparison (including all the recombination processes) of the dynamic behavior.54,64 We summarize the average lifetime and the integrated PL intensity at different temperatures in Fig. 5b and c. It is found that they share the same trend including a turning point, which is similar to the changing of PL FWHM with temperature. When the temperature increases from 77 K to 230 K, the average lifetime shortens from ∼4 ns to ∼1.7 ns as shown in Fig. 5b. In this scenario, the interaction between exciton and low-energy phonon (∼8.6 meV) as well as the thermal expansion are speculated to jointly influence the lifetime in the temperature range from 77 K to 230 K, where low-energy phonons become more active. The interaction with the lattice becomes predominant and reduces the PL lifetime as carriers transfer their energy to the lattice preventing the radiative recombination. The intensity of PL is decreased with temperature as demonstrated in Fig. 5c. It is confirmed that thermal quenching, which can result in a decrease in PL lifetime,65 is responsible for the change of PL intensity in this temperature region. Further increasing the temperature from 230 K to 300 K leads to the activation of high-energy phonons (∼15.3 meV), which could assist the relaxation of hot carriers from higher-energy states to lower-energy states, and thus the average lifetime lengthens expectedly. The PL intensity hence turns out to be opposite to the trend at low temperature (Fig. 5c).
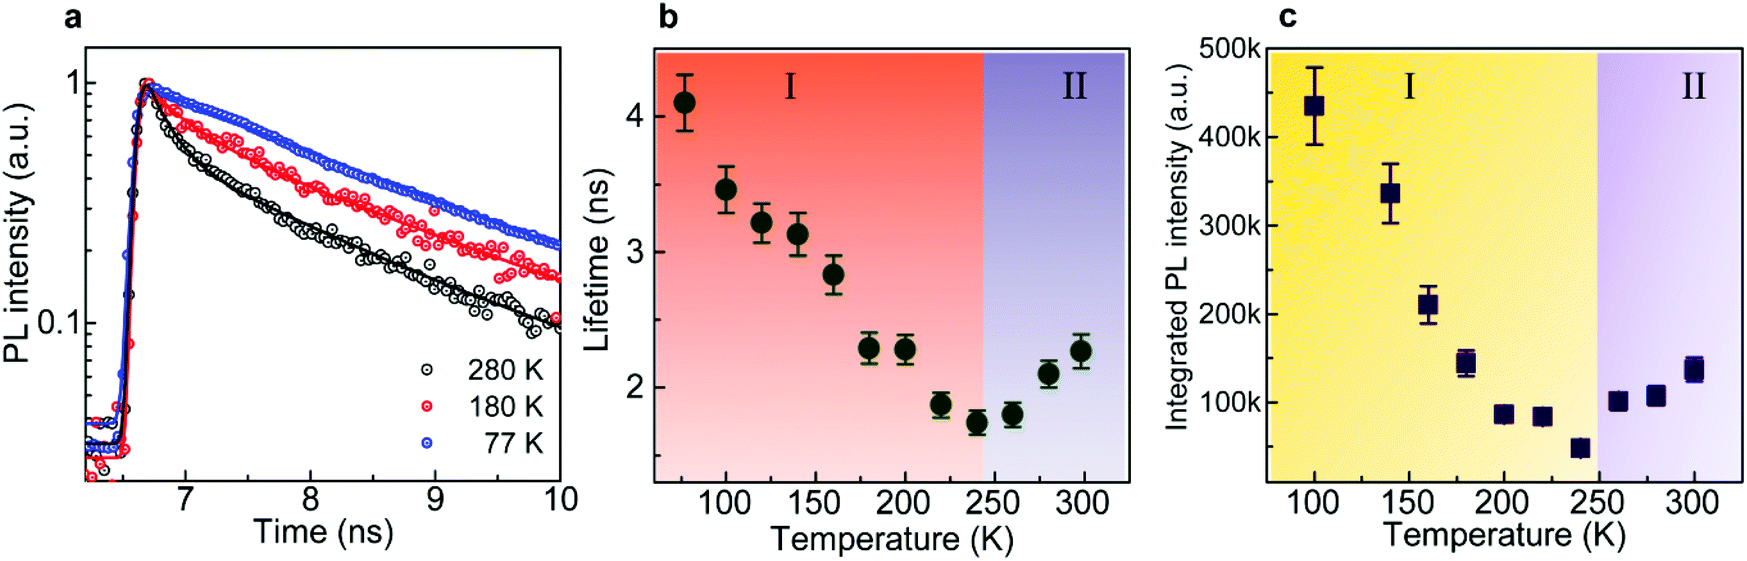 | ||
| Fig. 5 Time-resolved PL (TRPL) of CsPbBr3 microspheres. (a) TRPL decay curves of CsPbBr3 microspheres with different temperatures monitored around 530 nm with excitation of 400 nm (76 MHz, 120 fs). (b) The PL lifetime of CsPbBr3 microspheres decreases with temperature from 77 K to 238 K, while it increases with temperature from 238 K to 300 K. (c) Plot of the change in integrated PL intensity with temperature from 77 K to 300 K. It almost shares the same feature as shown in (b). | ||
3 Conclusions
To conclude, the lasing mechanism in CsPbBr3 microspheres was elucidated by temperature-dependent PL and TRPL measurements as well as Raman spectroscopy. Our results show that it is purely excitonic lasing in the CsPbBr3 microspheres: ex–ex scattering at the low-temperature range and ex-phonon scattering at higher-temperature range. Two phonon modes of different energies (∼8.6 meV and ∼15.3 meV) have been observed and confirmed to participate in the exciton–phonon coupling in different temperature ranges. The scattering from the low-energy phonon is the dominant source of exciton–phonon coupling in the intermediate temperature range, while the high-energy phonon dominates from 230 K to room temperature. The different exciton–phonon coupling mechanisms accompanied by TE in turn determine the behaviors of PL decay and PL intensity with temperature variations. Although the mechanism will be affected by factors such as the crystal properties, cavity configuration, losses, and excitation conditions, we believe our research lays the groundwork for the physics underlying the lasing behavior in perovskites and also helps designing ultralow-threshold lasing devices.4 Experimental sections
Morphology and structure characterization
The morphology of the as-grown CsPbBr3 microspheres were characterized by scanning electron microscopy (SEM, NOVA NanoSEM 430) equipped with energy dispersive spectroscopy (EDS, Oxford: X-Max80), and the crystal structure was measured using X-ray diffraction (XRD, Rigaku D/MAX-TTRIII (CBO), Cu Kα radiation).Optical characterizations
Absorption spectra were obtained by a home-built micro-transmission/absorption spectrometer. The light emitted from a halogen lamp source was vertically focused onto the sample from top. The reflected light from the sample was collected by a reflective objective, and spectrally analyzed by a monochromator. Apertures with adjustable size were used to selectively acquire reflected light from the targeted sample. For obtaining steady-state PL spectrum, a 405 nm-CW laser was focused onto an individual CsPbBr3 microsphere by an Olympus BX51 microscope. The PL emission signal was collected by the same microscope objective in a backscattering configuration and analyzed by a Princeton Instrument SP2500i spectrometer equipped with a liquid nitrogen-cooled charge-coupled detector (CCD). The PL image was recorded by the CCD equipped on Olympus BX51 microscope. The PL lifetime was obtained by a time-corrected single photon counter (TCSPC) with an ultimate temporal resolution of ∼40 ps. A frequency-doubled mode-locked Ti-sapphire oscillator laser (800 nm, repetition rate 76 MHz, pulse length 120 fs) was used as the excitation laser source. For lasing experiments, the excitation laser source was generated by a frequency-doubled crystal from a Coherent Astrella regenerative amplifier (80 fs, 1 kHz, 2.5 mJ per pulse, 800 nm) that was seeded by a Coherent Vitara-s oscillator (35 fs, 80 MHz). The setup of optical measurement is presented in the ESI, Section VIII.†Simulation of electric field distribution of CsPbBr3 microsphere
The three-dimensional FDTD simulation with perfectly matched layer (PML) boundary conditions was employed to calculate the electric field distribution of one CsPbBr3 sphere at its emission wavelength. The refractive index of CsPbBr3 was set as 2.4 according to the literature value.66 Dipole source with its phase theta and phi of 0 was used as the light source, which was placed on the middle cross section of the CsPbBr3 microsphere (viewed as X–Y plane). The simulation type of monitor was 2D–Z normal, and the monitored wavelength was set at 400–700 nm.Conflicts of interest
There are no conflicts to declare.Acknowledgements
We thank for the support from the Ministry of Science and Technology (2017YFA0205004, 2017YFA0304600, 2017YFA0205700 and 2016YFA0200700), National Natural Science Foundation of China (11874130, 61774003, 61521004 and 21673054), and Natural Science Foundation of Beijing Municipality (4182076 and 4184109). We also acknowledge the support of start-up funding from Peking University, one-thousand talent programs from Chinese government, and open research fund program of the State Key Laboratory of Low-Dimensional Quantum Physics. This study was also supported by the National Natural Science Foundation of China (61307120, 61704038, 11474187).References
- X. Duan, Y. Huang, R. Agarwal and C. M. Lieber, Nature, 2003, 421, 241–245 CrossRef CAS PubMed.
- B. Guzelturk, Y. Kelestemur, K. Gungor, A. Yeltik, M. Z. Akgul, Y. Wang, R. Chen, C. Dang, H. Sun and H. V. Demir, Adv. Mater., 2015, 27, 2741 CrossRef CAS PubMed.
- M. H. Huang, S. Mao, H. Feick, H. Yan, Y. Wu, H. Kind, E. Weber, R. Russo and P. Yang, Science, 2001, 292, 1897–1899 CrossRef CAS PubMed.
- A. L. Pan, D. Liu, R. B. Liu, F. F. Wang, X. Zhu and B. S. Zou, Small, 2005, 1, 980–983 CrossRef CAS PubMed.
- L. M. Tong, R. R. Gattass, J. B. Ashcom, S. L. He, J. Y. Lou, M. Y. Shen, I. Maxwell and E. Mazur, Nature, 2003, 426, 816–819 CrossRef CAS PubMed.
- Q. Zhang, X. Liu, M. I. B. Utama, G. Xing, T. C. Sum and Q. Xiong, Adv. Mater., 2016, 28, 276–283 CrossRef CAS PubMed.
- A. Yadav, M. Danesh, L. Zhong, G. J. Cheng, L. Jiang and L. Chi, Nanotechnology, 2016, 27, 165703 CrossRef PubMed.
- A. Yadav, L. Bai, Y. Yang, J. Liu, A. Kaushik, G. J. Cheng, L. Jiang, L. Chi and Z. Kang, Nanoscale, 2017, 9, 5049–5054 RSC.
- Z. Junxi, Z. Lide and X. Wei, J. Phys. D: Appl. Phys., 2012, 45, 113001 CrossRef.
- I. Mora-Seró, F. Fabregat-Santiago, B. Denier, J. Bisquert, R. Tena-Zaera, J. Elias and C. Lévy-Clément, Appl. Phys. Lett., 2006, 89, 203117 CrossRef.
- P. D. Yang, H. Q. Yan, S. Mao, R. Russo, J. Johnson, R. Saykally, N. Morris, J. Pham, R. R. He and H. J. Choi, Adv. Funct. Mater., 2002, 12, 323–331 CrossRef CAS.
- Q. Dong, Y. Fang, Y. Shao, P. Mulligan, J. Qiu, L. Cao and J. Huang, Science, 2015, 347, 967–970 CrossRef CAS PubMed.
- M. Liu, M. B. Johnston and H. J. Snaith, Nature, 2013, 501, 395–398 CrossRef CAS PubMed.
- D. Shi, V. Adinolfi, R. Comin, M. Yuan, E. Alarousu, A. Buin, Y. Chen, S. Hoogland, A. Rothenberger, K. Katsiev, Y. Losovyj, X. Zhang, P. A. Dowben, O. F. Mohammed, E. H. Sargent and O. M. Bakr, Science, 2015, 347, 519–522 CrossRef CAS PubMed.
- G. Xing, N. Mathews, S. Sun, S. S. Lim, Y. M. Lam, M. Gratzel, S. Mhaisalkar and T. C. Sum, Science, 2013, 342, 344–347 CrossRef CAS PubMed.
- S. De Wolf, J. Holovsky, S. J. Moon, P. Loper, B. Niesen, M. Ledinsky, F. J. Haug, J. H. Yum and C. Ballif, J. Phys. Chem. Lett., 2014, 5, 1035–1039 CrossRef CAS PubMed.
- C. Shen, W. Du, Z. Wu, J. Xing, S. T. Ha, Q. Shang, W. Xu, Q. Xiong, X. Liu and Q. Zhang, Nanoscale, 2017, 9, 8281 RSC.
- M. Gratzel, Nat. Mater., 2014, 13, 838–842 CrossRef CAS PubMed.
- X. Liu, L. Niu, C. Wu, C. Cong, H. Wang, Q. Zeng, H. He, Q. Fu, W. Fu and T. Yu, Adv. Sci., 2016, 3, 1600137 CrossRef PubMed.
- Q. Zhang, R. Su, W. Du, X. Liu, L. Zhao, S. T. Ha and Q. Xiong, Small Methods, 2017, 1700163 CrossRef.
- Q. Zhang, R. Su, X. Liu, J. Xing, T. C. Sum and Q. Xiong, Adv. Funct. Mater., 2016, 26, 6238–6245 CrossRef CAS.
- S. W. Eaton, M. Lai, N. A. Gibson, A. B. Wong, L. Dou, J. Ma, L. W. Wang, S. R. Leone and P. Yang, Proc. Natl. Acad. Sci. U. S. A., 2016, 113, 1993–1998 CrossRef CAS PubMed.
- Y. Fu, H. Zhu, A. Schrader, D. Liang, Q. Ding, P. Joshi, L. Hwang, X. Y. Zhu and S. Jin, Nano Lett., 2016, 16, 1000 CrossRef CAS PubMed.
- H. Zhu, Y. Fu, F. Meng, X. Wu, Z. Gong, Q. Ding, M. V. Gustafsson, M. T. Trinh, S. Jin and X. Zhu, Nat. Mater., 2015, 14, 636 CrossRef CAS PubMed.
- J. Xing, X. F. Liu, Q. Zhang, S. T. Ha, Y. W. Yuan, C. Shen, T. C. Sum and Q. H. Xiong, Nano Lett., 2015, 15, 4571–4577 CrossRef CAS PubMed.
- S. Zhang, Q. Shang, W. Du, J. Shi, Z. Wu, Y. Mi, J. Chen, F. Liu, Y. Li, M. Liu, Q. Zhang and X. Liu, Adv. Opt. Mater., 2018, 6, 1701032 CrossRef.
- W. Du, S. Zhang, J. Shi, J. Chen, Z. Wu, Y. Mi, Z. Liu, Y. Li, X. Sui, R. Wang, X. Qiu, T. Wu, Y. Xiao, Q. Zhang and X. Liu, ACS Photonics, 2018, 5, 2051–2059 CrossRef CAS.
- Y. Bekenstein, B. A. Koscher, S. W. Eaton, P. Yang and A. P. Alivisatos, J. Am. Chem. Soc., 2015, 137, 16008–16011 CrossRef CAS PubMed.
- Y. Ling, Z. Yuan, Y. Tian, X. Wang, J. C. Wang, Y. Xin, K. Hanson, B. Ma and H. Gao, Adv. Mater., 2016, 28, 305–311 CrossRef CAS PubMed.
- V. I. Klimov, A. A. Mikhailovsky, S. Xu, A. Malko, J. A. Hollingsworth, C. A. Leatherdale, H.-J. Eisler and M. G. Bawendi, Science, 2000, 290, 314–317 CrossRef CAS PubMed.
- J. Pan, S. P. Sarmah, B. Murali, I. Dursun, W. Peng, M. R. Parida, J. Liu, L. Sinatra, N. Alyami, C. Zhao, E. Alarousu, T. K. Ng, B. S. Ooi, O. M. Bakr and O. F. Mohammed, J. Phys. Chem. Lett., 2015, 6, 5027–5033 CrossRef CAS PubMed.
- Y.-S. Park, W. K. Bae, T. Baker, J. Lim and V. I. Klimov, Nano Lett., 2015, 15, 7319–7328 CrossRef CAS PubMed.
- S. Yakunin, L. Protesescu, F. Krieg, M. I. Bodnarchuk, G. Nedelcu, M. Humer, G. De Luca, M. Fiebig, W. Heiss and M. V. Kovalenko, Nat. Commun., 2015, 6, 8056 CrossRef CAS PubMed.
- Q. Zhang, S. T. Ha, X. Liu, T. C. Sum and Q. Xiong, Nano Lett., 2014, 14, 5995–6001 CrossRef CAS PubMed.
- D. Zhang, S. W. Eaton, Y. Yu, L. Dou and P. Yang, J. Am. Chem. Soc., 2015, 137, 9230–9233 CrossRef CAS PubMed.
- K. Wu, G. Liang, Q. Shang, Y. Ren, D. Kong and T. Lian, J. Am. Chem. Soc., 2015, 137, 12792–12795 CrossRef CAS PubMed.
- F. Deschler, M. Price, S. Pathak, L. E. Klintberg, D. D. Jarausch, R. Higler, S. Huttner, T. Leijtens, S. D. Stranks, H. J. Snaith, M. Atature, R. T. Phillips and R. H. Friend, J. Phys. Chem. Lett., 2014, 5, 1421–1426 CrossRef CAS PubMed.
- Z. Liu, J. Yang, J. Du, Z. Hu, T. Shi, Z. Zhang, Y. Liu, X. Tang, Y. Leng and R. Li, ACS Nano, 2018, 12, 5923–5931 CrossRef CAS PubMed.
- R. Agarwal, C. J. Barrelet and C. M. Lieber, Nano Lett., 2005, 5, 917 CrossRef CAS PubMed.
- R. Matsuzaki, H. Soma, K. Fukuoka, K. Kodama, A. Asahara, T. Suemoto, Y. Adachi and T. Uchino, Phys. Rev. B, 2017, 96, 125306 CrossRef.
- M. A. Versteegh, D. Vanmaekelbergh and J. I. Dijkhuis, Phys. Rev. Lett., 2012, 108, 157402 CrossRef PubMed.
- H. Haug and S. Koch, Phys. Status Solidi B, 2010, 82, 531–543 CrossRef.
- C. Klingshirn and H. Haug, Phys. Rep., 1981, 70, 315–398 CrossRef CAS.
- B. Tang, H. Dong, L. Sun, W. Zheng, Q. Wang, F. Sun, X. Jiang, A. Pan and L. Zhang, ACS Nano, 2017, 11, 10681–10688 CrossRef CAS PubMed.
- B. Tang, L. X. Sun, W. H. Zheng, H. X. Dong, B. B. Zhao, Q. Q. Si, X. X. Wang, X. W. Jiang, A. L. Pan and L. Zhang, Adv. Opt. Mater., 2018, 6, 1800391 CrossRef.
- X. Wang, H. Zhou, S. Yuan, W. Zheng, Y. Jiang, X. Zhuang, H. Liu, Q. Zhang, X. Zhu and X. Wang, Nano Res., 2017, 10, 3385–3395 CrossRef CAS.
- S. Hirotsu, J. Harada, M. Iizumi and K. Gesi, J. Phys. Soc. Jpn., 1974, 37, 1393–1398 CrossRef CAS.
- C. C. Stoumpos, C. D. Malliakas, J. A. Peters, Z. Liu, M. Sebastian, J. Im, T. C. Chasapis, A. C. Wibowo, D. Y. Chung, A. J. Freeman, B. W. Wessels and M. G. Kanatzidis, Cryst. Growth Des., 2013, 13, 2722–2727 CrossRef CAS.
- T. Schmidt, K. Lischka and W. Zulehner, Phys. Rev. B: Condens. Matter Mater. Phys., 1992, 45, 8989 CrossRef.
- J. Butkus, P. Vashishtha, K. Chen, J. K. Gallaher, S. K. K. Prasad, D. Z. Metin, G. Laufersky, N. Gaston, J. E. Halpert and J. M. Hodgkiss, Chem. Mater., 2017, 29, 3644–3652 CrossRef CAS.
- S. Yakunin, L. Protesescu, F. Krieg, M. I. Bodnarchuk, G. Nedelcu, M. Humer, G. De Luca, M. Fiebig, W. Heiss and M. V. Kovalenko, Nat. Commun., 2015, 6, 8056 CrossRef CAS PubMed.
- K. Wang, W. Sun, J. Li, Z. Gu, S. Xiao and Q. Song, ACS Photonics, 2016, 3, 1125–1130 CrossRef CAS.
- T. J. S. Evans, A. Schlaus, Y. Fu, X. Zhong, T. L. Atallah, M. S. Spencer, L. E. Brus, S. Jin and X. Y. Zhu, Adv. Opt. Mater., 2018, 6, 1700982 CrossRef.
- K. Wei, Z. Xu, R. Chen, X. Zheng, X. Cheng and T. Jiang, Opt. Lett., 2016, 41, 3821–3824 CrossRef CAS PubMed.
- J. Lee, E. S. Koteles and M. O. Vassell, Phys. Rev. B: Condens. Matter Mater. Phys., 1986, 33, 5512–5516 CrossRef CAS.
- A. Ohtomo, K. Tamura, M. Kawasaki, T. Makino, Y. Segawa, Z. K. Tang, G. K. L. Wong, Y. Matsumoto and H. Koinuma, Appl. Phys. Lett., 2000, 77, 2204–2206 CrossRef CAS.
- Ł. Piskorski, R. P. Sarzała and W. Nakwaski, Opto-Electron. Rev., 2011, 19, 320–326 Search PubMed.
- O. Yaffe, Y. Guo, L. Z. Tan, D. A. Egger, T. Hull, C. C. Stoumpos, F. Zheng, T. F. Heinz, L. Kronik, M. G. Kanatzidis, J. S. Owen, A. M. Rappe, M. A. Pimenta and L. E. Brus, Phys. Rev. Lett., 2017, 118, 136001 CrossRef PubMed.
- K. M. McCall, C. C. Stoumpos, S. S. Kostina, M. G. Kanatzidis and B. W. Wessels, Chem. Mater., 2017, 29, 4129–4145 CrossRef CAS.
- M. Balkanski, R. F. Wallis and E. Haro, Phys. Rev. B: Condens. Matter Mater. Phys., 1983, 28, 1928–1934 CrossRef CAS.
- P. K. Pandey, R. J. Choudhary, D. K. Mishra, V. G. Sathe and D. M. Phase, Appl. Phys. Lett., 2013, 102, 53–152 Search PubMed.
- P. Brüesch, Anharmonicity, Springer Berlin Heidelberg, 1982 Search PubMed.
- A. Bussmann-Holder and A. R. Bishop, Phys. Rev. B: Condens. Matter Mater. Phys., 1991, 44, 2853–2856 CrossRef.
- C. Wolf and T.-W. Lee, Mater. Today Energy, 2018, 7, 199–207 CrossRef.
- M. S. Gaponenko, A. A. Lutich, N. A. Tolstik, A. A. Onushchenko, A. M. Malyarevich, E. P. Petrov and K. V. Yumashev, Phys. Rev. B: Condens. Matter Mater. Phys., 2010, 82, 125320 CrossRef.
- G. Murtaza and I. Ahmad, Phys. B, 2011, 406, 3222–3229 CrossRef CAS.
Footnotes |
| † Electronic supplementary information (ESI) available. See DOI: 10.1039/c8nr09634a |
| ‡ These authors contributed equally to this work |
| This journal is © The Royal Society of Chemistry 2019 |