Morphology-controlled synthesis and excellent microwave absorption performance of ZnCo2O4 nanostructures via a self-assembly process of flake units†
Xiao
Li
,
Lei
Wang
,
Wenbin
You
,
Linshen
Xing
,
Xuefeng
Yu
,
Yuesheng
Li
and
Renchao
Che
 *
*
Laboratory of Advanced Materials, Department of Materials Science, Collaborative Innovation Center of Chemistry for Energy Materials (iChEM), Fudan University, 220 Handan Road, Shanghai 200433, China. E-mail: rcche@fudan.edu.cn
First published on 27th December 2018
Abstract
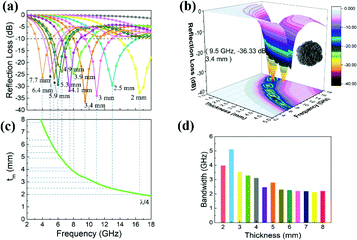
Pure dielectric microwave absorbers with strong attenuation capability and wide-band response become a challenge for efficient electromagnetic wave energy absorption. Herein, a series of ZnCo2O4 hierarchical structures with superior absorption performance have been achieved by tuning their surface architectures from ball-, hydrangea- to cabbage-, and pineapple-like morphologies. A facile one-step synthesis strategy using a self-assembly process with ZnCo2O4 crystalline flakes as structural units was proposed. The deionized water solution and urea addition were found to critically determine the formation of our unique cabbage-like ZnCo2O4 self-assembled morphology. The wide band and distinct absorption was dominantly contributed from dielectric ZnCo2O4 flakes, which could be furthermore adjusted by the above-mentioned morphologies. Due to its abundant void volume stacked by flakes, the cabbage-like ZnCo2O4 demonstrated the best absorption performance where the RLmax reached −36.33 dB at 9.5 GHz with an efficient bandwidth of 5.11 GHz (RL < −10 dB, 11.17–16.28 GHz). Adjusting the simulating thickness from 1 to 5 mm, the bandwidths range from 5.8 to 18 GHz. This unique structure has the polarization, conduction loss and strong dissipation capability resulting from the high density of accumulated charges trapped by the flake gap, confirmed by the analysis of electromagnetic parameters and electronic holography. It is expected that the self-assembled ZnCo2O4 microsphere might shed new light on the design of novel microwave absorption materials.
Introduction
With the rapid development of the modern electronics industry, the issue of electromagnetic wave absorption has become more serious.1–5 Therefore, it is a necessary goal to fabricate microwave absorbers with the following advantages: easy fabrication, low density, strong absorption capability and wide bandwidth. Both magnetic and dielectric absorption materials have been reported, such as ferrites,6 nickel,7 alloys,8 carbon derivatives9 and conducting polymers.10Notably, dielectric materials have attracted a great deal of attention since they avoid the limitation of Curie temperature and the high temperature oxidation of magnetic materials. There are a number of reports concerning dielectric substances used as electromagnetic wave absorbing materials with great absorption properties, especially for low-dimensional materials.11–13 Cao et al. have successfully prepared ZnO nanocrystals on multi-walled carbon nanotubes to form a conductive absorber.14 Yin et al. incorporated SiC nanowires into rGO foams to achieve improved thermostability and electromagnetic absorption.15 Du et al. introduced the core@shell composites of polypyrrole and polyaniline, which displayed evident interfacial polarization.16 Briefly, the nonmagnetic system with enhanced polarization and dielectric loss plays an important role in the process of dissipating microwave energy. However, the introduction of multiple components in the above structures has resulted in complex processing, low efficiency and agglomeration phenomenon. Unfortunately, hierarchical self-assembly structures composed of only single dielectric components are rare. Thus, monocomponent absorbers might become a simplified model for the study of absorption mechanisms.
Generally, the methods for adjusting the electromagnetic parameters for a single component absorber are doping,17,18 changing size,19,20 and tuning the morphology.21,22 Noticeably, the electromagnetic wave absorption property is affected by the morphologies of an absorber due to the changed electron transportation path, penetration route and induced scattering effects. These above-mentioned studies suggest that absorption performance depends strongly on the geometrical morphology, which becomes an effective path to improve microwave absorption capability.23,24 Therefore, it is valuable to explore a type of pure dielectric microwave absorber that shows strong absorption and wide response band and to further investigate the relationship between morphology and electromagnetic properties. Moreover, a facile and repeatable synthetic process is still lacking.
Zinc cobaltate (ZnCo2O4) has been used as an energy storage material due to its ion conductivity.25–27 ZnCo2O4 has the potential to become a promising microwave absorber due to the intrinsic charge conductivity similar to other AB2O4 spinel structure compounds. Furthermore, Co3O4,28,29 CoFe2O4,30 NiCo2O4,31 ZnFe2O4,32 and MnFe2O4![[thin space (1/6-em)]](https://www.rsc.org/images/entities/char_2009.gif) 33 all have been successfully reported to possess related microwave absorption properties. Therefore, the development of ZnCo2O4 as a novel microwave absorbing material can expand the opportunities in this field. So far, the effect of structure and morphology of ZnCo2O4 on its dielectric and microwave absorption performance have not been reported, although its composites have already been studied in other fields.
33 all have been successfully reported to possess related microwave absorption properties. Therefore, the development of ZnCo2O4 as a novel microwave absorbing material can expand the opportunities in this field. So far, the effect of structure and morphology of ZnCo2O4 on its dielectric and microwave absorption performance have not been reported, although its composites have already been studied in other fields.
Herein, hierarchical ZnCo2O4 microspheres made up of ZnCo2O4 crystalline nanosheets were synthesized by using a facile hydrothermal method, which exhibits excellent microwave absorption performance. A novel strategy was proposed, wherein ZnCo2O4 flake units were effectively self-assembled into microspheres simply by adjusting the reaction solvent (H2O) and additive (urea). A 5.11 GHz bandwidth with reflection loss stronger than −10 dB was achieved from our products. The dielectric absorption mechanism involves charge accumulation and multiple reflections around the nanosheets surface region and interfacial gaps resulting from their unique morphology. ZnCo2O4 have a significant potential to offer suitable relative complex permittivity, thus, they can be good candidates for fabricating distinct performance and wide broadband microwave absorbers. Our findings might provide new strategies for producing microwave absorption materials using single component dielectric components as a self-assembly unit for achieving morphology-dependent electromagnetic absorption properties.
Experimental
Materials
Zinc chloride (ZnCl2), cobaltous chloride hexahydrate (CoCl2·6H2O), zinc acetate dihydrate (Zn(CH3COO)2·2H2O), cobalt(II) acetate tetrahydrate (Co(CH3COO)2·4H2O), zinc nitrate hexahydrate (Zn(NO3)2·6H2O), cobaltous nitrate hexahydrate (Co(NO3)2·6H2O), ammonium bicarbonate (NH4HCO3), urea and ethylene glycol (EG) solution were purchased from Sinopharm Chemical Reagent Co., Ltd. All chemicals were of analytical grade and used without further purification. Deionized water obtained from a Milli-Q system (Millipore, Bedford, MA) was used in all experiments.Synthesis of ball-, hydrangea-, cabbage-, and pineapple-like ZnCo2O4 hierarchical nanostructures
In a typical process for the synthesis of the cabbage-like microspheres, Zn(NO3)2·6H2O (1 mmol) and Co(NO3)2·6H2O (2 mmol) were dissolved in 40 mL deionized water under magnetic stirring at room temperature. Then, 15 mmol of urea was added to the above solution. After being stirred for 3 h, the resultant solution was transferred into a Teflon lined stainless-steel autoclave with a capacity of 50 mL, and heated at 120 °C for 16 h in an oven. The cabbage-like ZnCo2O4 precursors were collected by centrifuging, washed with water three times and with ethanol four times, and dried in a vacuum oven at 60 °C for 12 h. Finally, the black cabbage-like ZnCo2O4 microspheres were obtained after calcination at 350 °C for 2 h in air. By simply changing the reaction solvent (EG) and additives (NH4HCO3), ball-, hydrangea-, and pineapple-like ZnCo2O4 microspheres can be synthesized using the same method (see details in the ESI†).Characterization
The crystallographic structure and phase purity of the as-synthesized products were studied by a Bruker, D8 ADVANCE X-ray diffractometer with Ni-filtered Cu Kα radiation (40 kV, 40 mA). The morphologies of the products were characterized using a field-emission scanning electron microscope (FESEM, Hitachi S-4800, Japan) and a field-emission transmission electron microscope (TEM, JEOL, JEM-2100F, 200 kV). For electron holography measurements, the samples were fixed in an embedding medium and cut into ultrathin sections by using an ultra-microtome. An electrostatic bi-prism (a thin conducting wire) system was installed in the microscope column perpendicular to the electron beam. The X-ray photoelectron spectroscopy (XPS) measurements were recorded on KRATOS Axis Ultra DLD equipped with a monochromatic X-ray source (Al Kα, hv = 1486.6 eV). The electromagnetic parameters were measured in the 2–18 GHz range with a N5230C vector network analyser. The measured samples were prepared by uniformly mixing with a paraffin matrix in a mass fraction of 50 wt% and compacted into a ring shape with a 7.00 mm outer diameter and 3.04 mm inner diameter.Results and discussion
By adjusting the reaction solvents and additives, a series of ZnCo2O4 structures with four different morphologies can be obtained, as shown in Scheme 1. For example, the formation of cabbage-like ZnCo2O4 can be described as follows. First, a cobalt zinc precursor formed by Zn and Co ions coordinated with deionized water acts as the nuclei for ZnCo2O4 nanocrystals. To reduce the surface energy, the primary particles aggregated spontaneously into flake units during the process of Ostwald ripening. With the assistance of urea, these flake units were self-assembled into cabbage-like hierarchical structures based on their inner crystallographic orientation. Finally, the continuous growth of hierarchical branches of microspheres results in the formation of the compact assembled microspheres after the post-annealing process.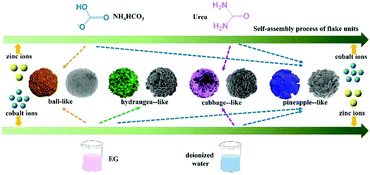 | ||
| Scheme 1 Schematic illustration of the synthetic process for the ball-, hydrangea- cabbage-, and pineapple-like ZnCo2O4 samples. | ||
The phase structures of four samples were determined by XRD over the range of 10° ≤ 2θ ≤ 70° (Fig. 1a). It can be seen that all the diffraction peaks are well assigned to the spinel structure of ZnCo2O4 (JCPDS No. 23-1390). Eight typical diffraction peaks are observed with increasing degree, related to the (111), (220), (311), (222), (400), (422), (511), and (440) crystallographic planes, respectively. At the same time, no impurity peaks are present, evidently proving that all products are highly purified and do not have any second phase. Hence, all four ZnCo2O4 samples with different morphology were successfully fabricated. As shown in Fig. 1b, the ZnCo2O4 is “normal” spinel with the +3 ions mostly on octahedral sites and the +2 ions mostly on tetrahedral sites (space group Fd3m). With the replacement of Co2+ by Zn2+ ions, spinel ZnCo2O4 is isomorphic to the Co3O4 crystal structure.34 This cubic spinel structure offers better electron transmission behaviour between the metal–oxygen bond, resulting in the increased dielectric property especially for the imaginary part of the dielectric constant, that is, the electromagnetic loss capability.
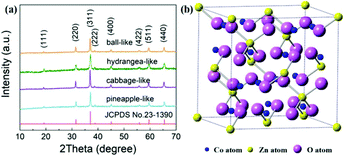 | ||
| Fig. 1 XRD patterns of four different ZnCo2O4 samples (a) and the structural illustration of the dielectric ZnCo2O4 (b). | ||
The surface electronic states and more detailed information about the chemical composition of the prepared ZnCo2O4 can be further investigated by XPS, and the results are displayed in Fig. 2. The full wide-scan spectrum (Fig. 2a) shows the presence of Co, Zn, O and C elements. The two major peaks centred at 1020.3 eV and 1043.4 eV (Fig. 2b) can be assigned to Zn 2p3/2 and Zn 2p1/2, respectively. As shown in Fig. 2c, the high-resolution Co 2p XPS spectrum exhibits two strong peaks at about 779 eV and 794 eV, which are assigned to 2p3/2 and 2p1/2, respectively.35 Furthermore, the binding energy at 779.4 and 794.7 eV correspond to Co3+, while the binding energy at 780.5 and 795.9 eV are assigned to Co2+. In the O 1s high-resolution spectrum (Fig. 2d), the peaks at 529.6 eV and 531.0 eV are usually associated with the oxygen from the metal–O bonds and oxygen vacancy in the ZnCo2O4, respectively. Overall, these results indicate that the chemical composition of four different ZnCo2O4 materials contains Zn2+, Co2+, Co3+, Co–O and Zn–O bonds, which are in good agreement with the reported literatures.36,37 Moreover, this XPS data in conjunction with XRD results all confirm that the as-synthesized ZnCo2O4 have a pure spinel structure, which may lead to the dielectric polarization for the incident microwave.
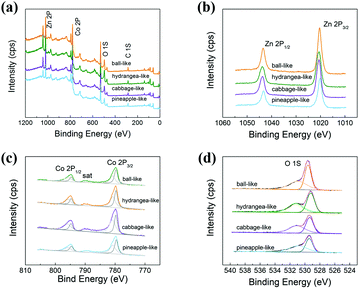 | ||
| Fig. 2 XPS spectra: (a) survey spectrum; (b) Zn 2p; (c) Co 2p; (d) O 1s for four different ZnCo2O4 samples. | ||
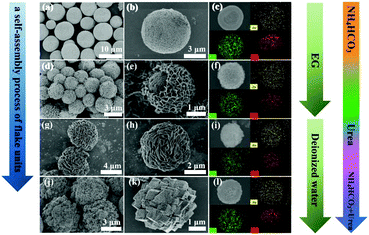
It is confirmed that a series of ZnCo2O4 with different morphologies have been successfully synthesized, such as ball-, hydrangea-, cabbage- and pineapple-like (Fig. 3). The self-assembly process of flake units can also be clearly observed only by adjusting the reaction solvent and additives. In Fig. 3a and b, each monodisperse ball-like ZnCo2O4 exhibits a relatively narrow size distribution of 3–7 μm and is composed of many small nanospheres. A number of nanosheets were wrapped around a solid microsphere to form hydrangea-like ZnCo2O4 structures with an average size of about 3 μm (Fig. 3d and e). By changing the reaction solvent from EG to deionized water, it seems that the nanosheets were wrapped around an invisible core to form the cabbage-like ZnCo2O4 architectures that consist of many densely interconnected flake units with diameters of about 5 μm (Fig. 3g and h). Thus, the multilayered porous architecture is formed by the extremely thin flake units with similar morphologies that are densely packed. The low-magnification SEM image (Fig. 3j) shows that the pineapple-like samples are composed of many linked nanocubes with a diameter of ∼5 μm. The high-magnification image (Fig. 3k) further reveals that the surface of these nanocubes has many pores due to the loss of inorganic substances during the reaction process. Remarkably uniform distribution of elements in the four different ZnCo2O4 samples is further verified by EDX spectra (Fig. 3c, f, i and l). Compared to other samples, the cabbage-like ZnCo2O4 structures have much more flake units, pores and voids, indicating that these structures are advantageous for keeping the large surface area in the internal space, which may largely improve multiple reflection capabilities. Energy dispersive spectrometry quantitative analysis (Fig. S1†) also demonstrates that the atomic ratio of Zn, Co and O is 1![[thin space (1/6-em)]](https://www.rsc.org/images/entities/char_2009.gif) :
:![[thin space (1/6-em)]](https://www.rsc.org/images/entities/char_2009.gif) 1.96
1.96![[thin space (1/6-em)]](https://www.rsc.org/images/entities/char_2009.gif) :
:![[thin space (1/6-em)]](https://www.rsc.org/images/entities/char_2009.gif) 3.68, which is in good agreement with XPS O 1s data (Fig. 2d), implying a certain degree of oxygen vacancies in the ZnCo2O4 spinel crystal.
3.68, which is in good agreement with XPS O 1s data (Fig. 2d), implying a certain degree of oxygen vacancies in the ZnCo2O4 spinel crystal.
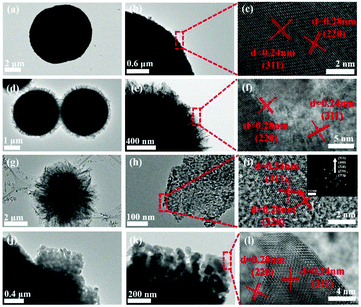
Fig. 4a and b show the typical TEM images of the ball-like ZnCo2O4. It can be clearly seen that the average size of microspheres is consistent with the SEM observation. As shown in Fig. 4d and e, there are numerous nanosheets closely packed on the surface of the solid microspheres in hydrangea-like ZnCo2O4 products. Fig. 4g and h show the cabbage-like structure, composed of a number of ultrathin nanosheets, which is in good accordance with the SEM results. The inset in Fig. 4i gives the selected-area electron diffraction (SAED) pattern with well-defined rings, indicating the polycrystalline nature of the as-prepared ZnCo2O4. From the image shown in Fig. 4j, the irregular edges of the microspheres are in accordance with the nanocubes. A high resolution TEM image (Fig. 4c, f, i and l) is taken from the parts of Fig. 4b, e, h and k, which clearly indicates two interplanar spacings of 0.24 and 0.28 nm, corresponding to the (311) and (220) planes of spinel ZnCo2O4 structures, respectively. As described above, it can be further proved that all the four different ZnCo2O4 samples are produced with high purity and good crystallinity.
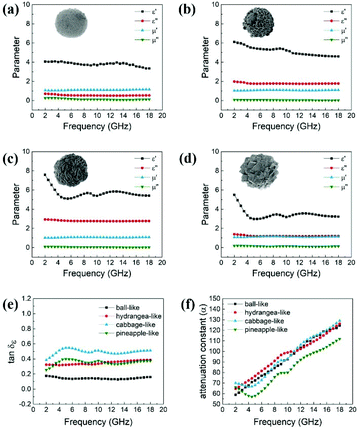
Generally, the complex permittivity (εr = ε′ − jε′′), complex permeability (μr = μ′ − jμ′′), and the impedance matching of absorbers play important roles in determining the microwave absorption properties. The real parts of complex permittivity (ε′) and complex permeability (μ′) show the storage capability of electromagnetic energy, while the imaginary parts (ε′′, μ′′) indicate the loss capability of electromagnetic energy.38,39 According to the electromagnetic loss model, a high ε′′ and μ′′ are significantly beneficial to absorb the electromagnetic wave energy.40Fig. 5 shows the electromagnetic parameters of the four different ZnCo2O4 samples in the frequency range of 2–18 GHz. The cabbage-like ZnCo2O4 materials with massive flake units exhibit the highest real permittivity (ε′) ranging from 7.5 to 5.4 (Fig. 5c), and may possess strong capability of both energy storage and dielectric polarization. Moreover, a noticeable valley peak appeared at about 8 GHz. With the increase in frequency, this decreasing tendency of (ε′) follows the general rule of a typical dielectric relaxation. When the number of nanosheets are reduced to form a hydrangea-like shape, ε′ values fluctuate within the range of 6.11–4.59. When the number of nanosheets further decreases to zero, ε′ rapidly declines to 4.11–2.36 without any relaxation peak. For other unique pineapple-like ZnCo2O4 with many linked nanocubes, the ε′ value decreases from 5.51 to 3.18. Hence, the massive nanosheets might provide the absorber superior capability to store electromagnetic energy although they have the same chemical composition. As for the imaginary permittivity (ε′′), compared to other samples, cabbage-like materials display the highest ε′′ of 2.96 to 2.74 with a relatively smooth trend. This relates to their enhanced interfacial polarization resulting from the increased specific surface area between the linked flake units. Cabbage-like ZnCo2O4 has a stronger ability to generate the induced charges, thereby making the ε′′ value rise and dissipating the electromagnetic wave energy. According to the Debye theory of dielectrics, ε′′ can be calculated by
 | (1) |
![[thin space (1/6-em)]](https://www.rsc.org/images/entities/char_2009.gif) δε = ε′′/ε′) was calculated to further evaluate the dielectric loss property, as shown in Fig. 5e. Generally, higher the δε value, higher would be dissipation of electric energy of incident microwaves. The order of tan
δε = ε′′/ε′) was calculated to further evaluate the dielectric loss property, as shown in Fig. 5e. Generally, higher the δε value, higher would be dissipation of electric energy of incident microwaves. The order of tan![[thin space (1/6-em)]](https://www.rsc.org/images/entities/char_2009.gif) δε values of four samples are cabbage-like > hydrangea-like ≈ pineapple-like > ball-like ZnCo2O4 samples, which provides the distinct evidence that the flake units are powerful aids to reinforce the microwave attenuation capacity. Moreover, microwave attenuation ability can also be evaluated by the attenuation constant (α), which can be calculated as
δε values of four samples are cabbage-like > hydrangea-like ≈ pineapple-like > ball-like ZnCo2O4 samples, which provides the distinct evidence that the flake units are powerful aids to reinforce the microwave attenuation capacity. Moreover, microwave attenuation ability can also be evaluated by the attenuation constant (α), which can be calculated as | (2) |
![[thin space (1/6-em)]](https://www.rsc.org/images/entities/char_2009.gif) δε values are much higher than that of tan
δε values are much higher than that of tan![[thin space (1/6-em)]](https://www.rsc.org/images/entities/char_2009.gif) δm (Fig. S2†), all the as-prepared ZnCo2O4 samples can be considered as a dielectric loss-type microwave absorber.
δm (Fig. S2†), all the as-prepared ZnCo2O4 samples can be considered as a dielectric loss-type microwave absorber.
In order to study the microwave absorption capabilities of ZnCo2O4 samples with four different morphologies, the reflection loss (RL) was calculated. According to the transmit line theory, RL values usually are given by the following equations:45,46
 | (3) |
RL(dB) = 20![[thin space (1/6-em)]](https://www.rsc.org/images/entities/char_2009.gif) log|(Zin − Z0)/(Zin + Z0)| log|(Zin − Z0)/(Zin + Z0)| | (4) |
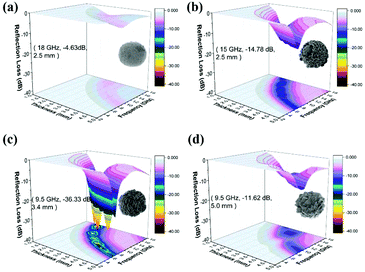 | ||
| Fig. 6 3D plots of reflection loss for (a) ball-, (b) hydrangea-, (c) cabbage-, (d) pineapple-like ZnCo2O4 composites containing 50 wt% paraffin. | ||
The best electromagnetic wave absorbing property is exhibited by cabbage-like ZnCo2O4 samples (Fig. 7). It should be pointed out that the optimal RL peaks are shifted toward lower frequencies with increasing sample thickness (Fig. 7a). Furthermore, the RL peak intensity first increases and then decreases. Fig. 7c indicates the dependence of matching thickness (tm) on matching frequency (fm) at wavelengths of λ/4, which should be expressed by the 1/4 wavelength cancellation equation.47,48
 | (5) |
| Absorber | Maximum RL (dB) | Matching frequency (GHz) | Matching thickness (mm) | Absorption band (GHz) RL ≤ −10 dB | Ref. |
|---|---|---|---|---|---|
| NiCo2O4 | −25.5 | 4.5 | 4 | — | 31 |
| Co3O4 | −38 | 11.7 | 2.5 | 4.5 | 28 |
| ZnFe2O4/RGO | −29.3 | 16.7 | 1.6 | 2.6 | 32 |
| CoFe2O4/GO | −42 | 12.9 | 2 | 4.59 | 30 |
| Co3O4/RGO | −32.3 | 12.4 | 2.5 | — | 29 |
| MnFe2O4/RGO | −32.8 | 8.2 | 3.5 | 4.8 | 33 |
| ZnCo 2 O 4 | −36.33 | 9.5 | 3.4 | 5.11 | this work |
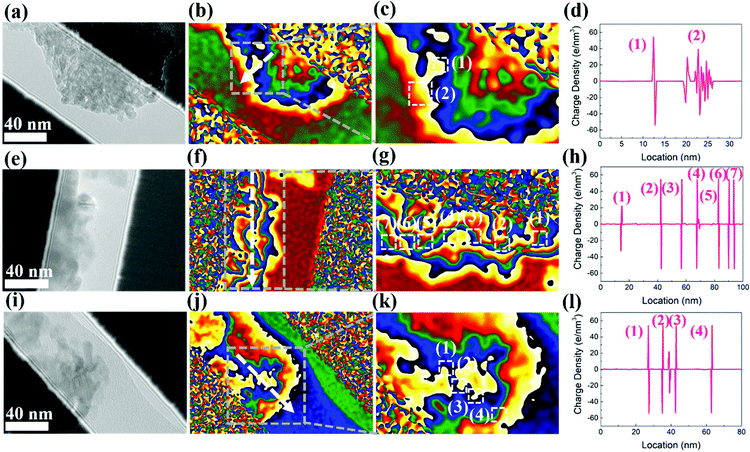
The microwave absorption mechanism of the cabbage-like ZnCo2O4 samples loaded with an abundance of nanosheets is described from the viewpoint of the microstructure (Scheme 2). First, because of the numerous flake units embedded inside the cabbage-like ZnCo2O4 structures, a large number of ZnCo2O4–ZnCo2O4 cross plane around interfacial regions are formed in microspheres (Fig. 8a, e and j), leading to an enhanced interfacial polarization relaxation. Second, the massive flake units of the cabbage-like ZnCo2O4 material are prone to produce a dielectric polarization field at nanoscale, which further induces a redistribution of surface charge and enhances the dielectric polarization, thereby dissipating the microwave energy. Electron holography analysis was carried out to determine the charge density distribution (Fig. 8b, f and j). Both negative and positive distributions coexist at interfaces and junctions of ZnCo2O4–ZnCo2O4 (Fig. 8d, h and l). Interestingly, the defects on microsphere surfaces formed by the existence of oxygen vacancies can break the balance of the charge distribution and cause the dipole polarization and Debye relaxations, which are favourable for an enhanced microwave absorption. Third, the cabbage-like ZnCo2O4 samples have the most flake units and voids compared to that of others, leading to the fact that an enhanced surface area is generated. When the electromagnetic waves permeate into these unique microspheres, large amounts of specific surface areas will provide a large number of active sites to induce multiple reflection and scattering. Such processes could effectively attenuate microwave irradiations. Fourth, the collective migration of polarization electrons near the interfacial planes could generate residual holes and gather more electrons driven by the applied high frequency electromagnetic field. The imaginary part of permittivity could be enhanced by the effect of the electron migration. Because ε′′ is proportional to conductivity, the higher value of σ means better electron movement, by which electromagnetic energy can be quickly converted into thermal energy and further improve the microwave absorption ability. Fifth, according to porous architectures, microwaves may be neutralized by the opposite electromagnetic waves with similar vibrational frequency, further improving the microwave absorption capability of cabbage-like ZnCo2O4 microspheres.
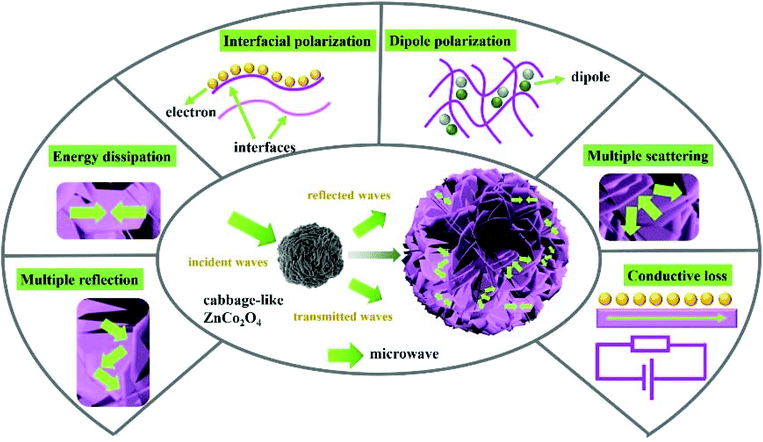 | ||
| Scheme 2 Schematic illustration of microwave absorption mechanisms for cabbage-like ZnCo2O4 samples. | ||
Conclusions
In conclusion, a self-assembly process of flake units can be successfully achieved through a facile solvothermal method and thermal annealing treatment by simply changing the reaction solvent and additives. Only when the reaction solvent is deionized water and the additive is urea, cabbage-like ZnCo2O4 can be successfully prepared. Benefitting from the interconnected nanosheet structure with numerous pores, voids and interfaces, the cabbage-like ZnCo2O4 absorber shows excellent microwave absorption performance. The structural distinctions among these four samples lead to a total difference in dielectric and microwave absorption abilities. Thus, cabbage-like ZnCo2O4 samples show the maximum RL value of −36.33 dB at 9.5 GHz and effective bandwidth of 5.11 GHz (from 11.17 to 16.28 GHz). The enhanced microwave attenuation ability was mainly ascribed to unique architectures, induction of more interfacial polarization, dipole polarization, multiple scattering and energy dissipation. Furthermore, all the above-mentioned discussions demonstrate that this self-assembly process of flake units related to their microwave absorption performance provides an avenue for future material design.Conflicts of interest
There are no conflicts to declare.Acknowledgements
This work was supported by the Ministry of Science and Technology of China (973 Project No. 2018YFA0209102) and the National Natural Science Foundation of China (11727807, 51725101, 51672050, 61790581), Science and Technology Commission of Shanghai Municipality (16DZ2260600).Notes and references
- X. M. Zhang, G. B. Ji, W. Liu, X. X. Zhang, Q. W. Gao, Y. C. Li and Y. W. Du, J. Mater. Chem. C, 2016, 4(9), 1860–1870 RSC.
- T. Wu, Y. Liu, X. Zeng, T. T. Cui, Y. T. Zhao, Y. N. Li and G. X. Tong, ACS Appl. Mater. Interfaces, 2016, 8(11), 7370–7380 CrossRef CAS PubMed.
- P. B. Liu, Y. Huang, J. Yan, Y. W. Yang and Y. Zhao, ACS Appl. Mater. Interfaces, 2016, 8(8), 5536–5546 CrossRef CAS PubMed.
- J. Z. He, X. X. Wang, Y. L. Zhang and M. S. Cao, Mater. Chem. C, 2016, 4(29), 7130–7140 RSC.
- X. Jian, B. A. Wu, Y. F. Wei, S. X. Dou, X. L. Wang, W. D. He and N. Mahmood, ACS Appl. Mater. Interfaces, 2016, 8(9), 6101–6109 CrossRef CAS PubMed.
- R. Qiang, Y. C. Du, H. T. Zhao, Y. Wang, C. H. Tian, Z. G. Li, X. J. Han and P. Xu, J. Mater. Chem. A, 2015, 3(25), 13426–13434 RSC.
- X. G. Huang, J. Zhang, M. Lai and T. Y. Sang, J. Alloys Compd., 2015, 627, 367–373 CrossRef CAS.
- Q. H. Liu, X. H. Xu, W. X. Xia, R. C. Che, C. Chen, Q. Cao and J. G. He, Nanoscale, 2015, 7(5), 1736–1743 RSC.
- D. F. Zhang, F. X. Xu, J. Lin, Z. D. Yang and M. Zhang, Carbon, 2014, 80, 103–111 CrossRef CAS.
- J. M. Thomassin, C. Jerome, T. Pardoen, C. Bailly, I. Huynen and C. Detrembleur, Mater. Sci. Eng., R, 2013, 74(7), 211–232 CrossRef.
- M. S. Cao, W. L. Song, Z. L. Hou, B. Wen and J. Yuan, Carbon, 2010, 48(3), 788–796 CrossRef CAS.
- B. Wen, M. S. Cao, M. M. Lu, W. Q. Cao, H. L. Shi, J. Liu, X. X. Wang, H. B. Jin, X. Y. Fang, W. Z. Wang and J. Yuan, Adv. Mater., 2014, 26(21), 3484–3489 CrossRef CAS PubMed.
- L. Wang, X. Li, Q. Li, Y. H. Zhao and R. C. Che, ACS Appl. Mater. Interfaces, 2018, 10(26), 22602–22610 CrossRef CAS PubMed.
- M. M. Lu, W. Q. Cao, H. L. Shi, X. Y. Fang, J. Yang, Z. L. Hou, H. B. Jin, W. Z. Wang, J. Yuan and M. S. Cao, J. Mater. Chem. A, 2014, 2(27), 10540–10547 RSC.
- M. K. Han, X. W. Yin, Z. X. Hou, C. Q. Song, X. L. Li, L. T. Zhang and L. F. Cheng, ACS Appl. Mater. Interfaces, 2017, 9(13), 11803–11810 CrossRef CAS PubMed.
- C. H. Tian, Y. C. Du, P. Xu, R. Qiang, Y. Wang, D. Ding, J. L. Xue, J. Ma, H. T. Zhao and X. J. Han, ACS Appl. Mater. Interfaces, 2015, 7(36), 20090–20099 CrossRef CAS PubMed.
- R. S. Alam, M. Moradi, M. Rostami, H. Nikmanesh, R. Moayedi and Y. Bai, J. Magn. Magn. Mater., 2015, 381, 1–9 CrossRef CAS.
- Z. Mosleh, P. Kameli, A. Poorbaferani, M. Ranjbar and H. Salamati, J. Magn. Magn. Mater., 2016, 397, 101–107 CrossRef CAS.
- Q. H. Liu, Q. Cao, X. B. Zhao, H. Bi, C. Wang, D. S. Wu and R. C. Che, ACS Appl. Mater. Interfaces, 2015, 7(7), 4233–4240 CrossRef CAS PubMed.
- W. Wang, J. X. Guo, C. Long, W. Li and J. G. Guan, J. Alloys Compd., 2015, 637, 106–111 CrossRef CAS.
- B. Zhao, W. Y. Zhao, G. Shao, B. B. Fan and R. Zhang, ACS Appl. Mater. Interfaces, 2015, 7(23), 12951–12960 CrossRef CAS PubMed.
- G. L. Wu, Y. H. Cheng, F. Xiang, Z. R. Jia, Q. Xie, G. Q. Wu and H. J. Wu, Mater. Sci. Semicond. Process., 2016, 41, 6–11 CrossRef CAS.
- M. Cao, X. Wang, W. Cao, X. Fang, B. Wen and J. Yuan, Small, 2018, 14(29), 1800987 CrossRef PubMed.
- W. Q. Cao, X.-X. Wang, J. Yuan, W.-Z. Wang and M. S. Cao, J. Mater. Chem. C, 2015, 3(38), 10017–10022 RSC.
- B. Liu, B. Y. Liu, Q. F. Wang, X. F. Wang, Q. Y. Xiang, D. Chen and G. Z. Shen, ACS Appl. Mater. Interfaces, 2013, 5(20), 10011–10017 CrossRef CAS PubMed.
- B. Liu, J. Zhang, X. F. Wang, G. Chen, D. Chen, C. W. Zhou and G. Z. Shen, Nano Lett., 2012, 12(6), 3005–3011 CrossRef CAS PubMed.
- X. Zhou, W. Feng, C. Wang, X. L. Hu, X. W. Li, P. Sun, K. Shimanoe, N. Yamazoe and G. Y. Lu, J. Mater. Chem. A, 2014, 2(41), 17683–17690 RSC.
- F.-N. Shi, Y. Hu, X. Wang, X. Sun, M. Lu, G. Shi and G. Xu, Dalton Trans., 2017, 46(6), 1936–1942 RSC.
- X. Li, S. Yang, J. Sun, P. He, X. Pu and G. Ding, Synth. Met., 2014, 194, 52–58 CrossRef CAS.
- S. Wang, Y. Zhao, H. Xue, J. Xie, C. Feng, H. Li, D. Shi, S. Muhammad and Q. Jiao, Mater. Lett., 2018, 223, 186–189 CrossRef CAS.
- M. Zhou, F. Lu, T. Lv, X. Yang, W. Xia, X. Shen, H. He and X. Zeng, J. Phys. D: Appl. Phys., 2015, 48(21), 1–7 CrossRef CAS.
- Z. Yang, Y. Wan, G. Xiong, D. Li, Q. Li, C. Ma, R. Guo and H. Luo, Mater. Res. Bull., 2015, 61, 292–297 CrossRef CAS.
- Y. Wang, X. Wu, W. Zhang and S. Huang, Mater. Technol., 2017, 32(1), 32–37 CrossRef CAS.
- X. J. Zhang, G. S. Wang, W. Q. Cao, Y. Z. Wei, J. F. Liang, L. Guo and M. S. Cao, ACS Appl. Mater. Interfaces, 2014, 6(10), 7471–7478 CrossRef CAS PubMed.
- R. P. Zhang, J. Liu, H. G. Guo and X. L. Tong, Mater. Lett., 2014, 115, 208–211 CrossRef CAS.
- L. Y. Guo, Q. Ru, X. Song, S. J. Hu and Y. Mo, J. Mater. Chem. A, 2015, 3(16), 8683–8692 RSC.
- S. Vijayanand, P. A. Joy, H. S. Potdar, D. Patil and P. Patil, Sens. Actuators, B, 2011, 152(1), 121–129 CrossRef CAS.
- W. F. Wei, W. X. Chen and D. G. Ivey, Chem. Mater., 2008, 20(5), 1941–1947 CrossRef CAS.
- F. Qin and C. Brosseau, J. Appl. Phys., 2012, 111(6), 0613011–06130124 CrossRef.
- Q. H. Liu, Q. Cao, H. Bi, C. Y. Liang, K. P. Yuan, W. She, Y. J. Yang and R. C. Che, Adv. Mater., 2016, 28(3), 486–490 CrossRef CAS PubMed.
- W. L. Song, M. S. Cao, Z. L. Hou, X. Y. Fang, X. L. Shi and J. Yuan, Appl. Phys. Lett., 2009, 94(23), 2331101–2331103 Search PubMed.
- T. Wang, R. Han, G. G. Tan, J. Q. Wei, L. Qiao and F. S. Li, J. Appl. Phys., 2012, 112(10), 1049031–1049036 Search PubMed.
- B. Zhao, W. Y. Zhao, G. Shao, B. B. Fan and R. Zhang, Dalton Trans., 2015, 44(36), 15984–15993 RSC.
- F. Wang, Y. Sun, D. Li, B. Zhong, Z. Wu, S. Zuo, D. Yan, R. Zhuo, J. Feng and P. Yan, Carbon, 2018, 134, 264–273 CrossRef CAS.
- Z. J. Wang, L. N. Wu, J. G. Zhou, W. Cai, B. Z. Shen and Z. H. Jiang, J. Phys. Chem. C, 2013, 117(10), 5446–5452 CrossRef CAS.
- K. Singh, A. Ohlan, V. H. Pham, R. Balasubramaniyan, S. Varshney, J. Jang, S. H. Hur, W. M. Choi, M. Kumar, S. K. Dhawan, B. S. Kong and J. S. Chung, Nanoscale, 2013, 5(6), 2411–2420 RSC.
- P. J. Liu, L. Li, Z. J. Yao, J. T. Zhou, M. M. Du and T. T. Yao, J. Mater. Sci.: Mater. Electron., 2016, 27(8), 7776–7787 CrossRef CAS.
- Z. W. Li, G. Q. Lin and L. B. Kong, IEEE Trans. Magn., 2008, 44(10), 2255–2261 CAS.
Footnote |
| † Electronic supplementary information (ESI) available. See DOI: 10.1039/C8NR08601J |
| This journal is © The Royal Society of Chemistry 2019 |

