
Determination of tryptophan metabolism from biological tissues and fluids using high performance liquid chromatography with simultaneous dual electrochemical detection†
Emily L.
Brooks
ab,
Vongai S.
Mutengwa
a,
Aya
Abdalla
 ab,
Mark S.
Yeoman
ab and
Bhavik Anil
Patel
*ab
ab,
Mark S.
Yeoman
ab and
Bhavik Anil
Patel
*ab
aSchool of Pharmacy and Biomolecular Sciences, University of Brighton, Brighton, UK
bCentre for Stress and Age-Related Disease, University of Brighton, Brighton, UK. E-mail: b.a.patel@brighton.ac.uk; Fax: +44 (0)1273 643 333
First published on 16th September 2019
Abstract
Serotonin and kynurenine are formed following metabolism of the essential amino acid tryptophan. Both molecules play important biological roles and the balance of how tryptophan metabolism varies to either the serotonin or kynurenine pathway may provide key insight into the inflammatory status of the biological region. At present complex chromatographic methods are utilised which predominately focus on either monitoring analytes in the serotonin or kynurenine pathway rather than both. Our study develops a simple yet robust methodology for the monitoring of tryptophan metabolism. We utilised isocratic reverse phase high-performance liquid chromatography with simultaneously dual electrochemical detection. This approach allowed for separation of co-eluted analytes and identification of analytes from both pathways within 14 minutes. For all analytes, limits of detection were <35 nM. No crosstalk was observed when dual simultaneous detection was conducted in a radial flow cell. Responses from the hippocampus, blood and ileum mucosa highlighted that each region had a varying ratio of serotonin to kynurenine pathway, indicating varied approaches to tryptophan metabolism. The developed method can monitor how the metabolism of tryptophan varies between the two pathways which can provide insight into the inflammatory state of reach region with age and disease.
Introduction
Serotonin (5-HT) is an important signalling molecule in the central nervous system (CNS), blood and gastrointestinal tract and can regulate a diverse range of cellular functions including memory formation, blood coagulation and gastrointestinal motility. It is formed from the essential amino acid, tryptophan, via the actions of two enzymes tryptophan hydroxylase and an aromatic acid L-amino acid decarboxylase. Increased inflammation or oxidative stress1,2 can activate two additional enzymes tryptophan-2,3-dioxygenase (TDO) and indoleamine 2,3-dioxygenase (IDO) which metabolise tryptophan down the kynurenine pathway to form kynurenine (KYN) and a range of other metabolites including NAD+3,4 (Fig. 1). Over-activation of this pathway can lead to the production of a range of neurotoxic compounds but can also increase NAD+ which has potential anti-ageing properties.5 Therefore, as both 5-HT and KYN are formed from the same precursor, tryptophan, it is important to understand how changes in one pathway may influence the balance of another given these molecules play pivotal functional roles.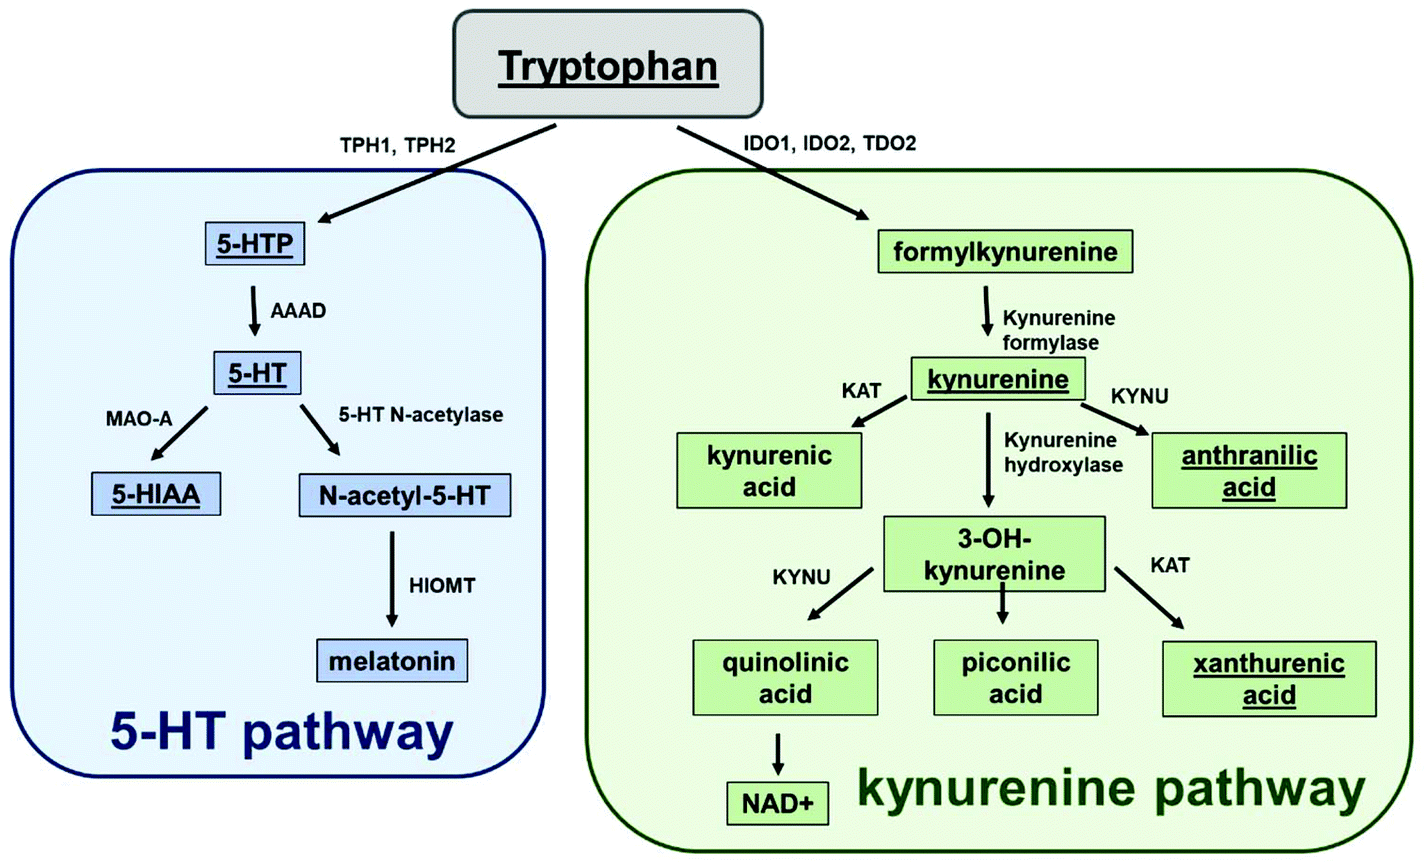 | ||
| Fig. 1 Metabolism of tryptophan to the 5-HT and KYN pathways. All chemicals underlined were detected within the HPLC method. Where 5-HTP: 5-hydroxytrophan 5-HT: serotonin; 5-HIAA: 5-hydroxyindole acetic acid; NAD+: nicotinamide adenine dinucleotide; TPH1&2: tryptophan hydroxylase 1&2; AAAD: aromatic L-amino acid decarboxylase; MAO-A: monoamine oxidase A; HIOMT: hydroxyindole-O-methyltransferase; IDO1&2: indoleamine 2,3-dioxygenase 1&2; TDO2: tryptophan 2,3-dioxygenase 2; KAT: kynurenine aminotransferase. KYNU: kynureninase. | ||
There are various chromatographic methodologies for the determination of tryptophan metabolites in biological tissues and fluids. The approaches utilised include high performance liquid chromatography (HPLC) with fluorescent detection,6,7 ultraviolet detection,8,9 mass spectrometric detection10,11 and electrochemical detection.12–14 Most of these published studies are time consuming due to (i) the utilisation of gradient elution; or (ii) the use of multiple detection and separation approaches.6,7,15–17 Additionally, published studies have measured either chemicals within the KYN pathway or the 5-HT pathway with few methods measuring the products of both pathways simultaneously.13–15,18–20 Of the few studies that have monitored analytes in both pathways, focus has been on identifying a single analyte in each pathway13 and has therefore failed to provide a representation of the full range of tryptophan metabolites within the 5-HT and KYN pathway. One study however has measured multiple analytes in both pathways, using isocratic mode elution, and achieved identification of analytes using multiple voltages in order to observe analytes.12 This approach utilised five different voltages in order to confirm the presence of individual analytes due to co-elution. This approach would be time consuming as samples needed to be injected multiple times in order to fully analyse all the analytes. This limitation may also be problematic for bioanalysis, where sample sizes are limited. Therefore, there is currently no simple and robust approach for the measurement of multiple analytes from both the 5-HT and KYN pathway in a single HPLC run.
The current study focused on developing a simple and robust isocratic elution chromatography methodology which can identify many tryptophan metabolites from both 5-HT and KYN pathways from a range of biological tissue and fluid samples. Simultaneous dual electrochemical detection provided the ability to monitor co-eluted analytes and reduce run times. Finally, we showcased the developed methodology was able to monitor analytes in both the 5-HT and KYN pathways from hippocampus, blood and ileum samples.
Experimental
Chemicals
Norepinephrine bitartrate salt (NA), dopamine hydrochloride (DA), 5-hydroxytryptophan (5-HTP), serotonin hydrochloride (5-HT), L-kynurenine (KYN), 3,4-dihydroxyphenylacetic acid (DOPAC), L-tryptophan (TR), xanthurenic acid (XA), 5-hydroxyindole-3-acetic acid (5-HIAA), homovanillic acid (HVA), and anthranillic acid (ANT) were all purchased from Sigma and used as received.Biological tissue and fluid sample preparation
All animal experiments were carried out in compliance with UK ARRIVE guidelines and approved through the animal ethics committee of the University of Brighton. Male C57BL/6 mice were euthanized using CO2 gas to obtain a segment of the ileum, the hippocampus and blood. For the ileum, a 1 cm long segment of tissue was placed into an inverted dry Petri dish and cut open along the mesenteric border. The tissue was laid flat with the mucosal layer uppermost then scraped with a sterile scalpel to remove the mucosa. The hippocampus was obtained by dissection on ice. Blood was collected by cardiac puncture and then allowed to coagulate at room temperature before centrifugation at 5000g for 5 min to yield a pure serum sample. Ileum mucosa, hippocampus and blood samples were homogenized in 250 μl of ice-cold 0.1 M perchloric acid and centrifuged at 13![[thin space (1/6-em)]](https://www.rsc.org/images/entities/char_2009.gif) 200g at 4 °C for 3 minutes. The resulting supernatant was then pushed through a 0.2 μm filter and stored at 4 °C before analysis. The remaining pellets were stored at −20 °C before being analysed for the protein content using the Bradford method.21
200g at 4 °C for 3 minutes. The resulting supernatant was then pushed through a 0.2 μm filter and stored at 4 °C before analysis. The remaining pellets were stored at −20 °C before being analysed for the protein content using the Bradford method.21
Chromatography
The HPLC system consisted of a Jasco pump (Model PU-2080), a Rheodyne manual injector with a 20 μl loop and a kinetic ODS 2.6 μm 100 mm × 2.1 mm i.d. analytical column with a guard column. The HPLC system was used in a completely isocratic mode for the determination of signalling metabolites and set at a flow rate of 100 μL min−1. A dual 3 mm glassy carbon electrode (BASi) served as the working electrodes and was used with an Ag|AgCl reference electrode and a stainless-steel auxiliary block as the counter electrode. The working electrodes were set at potentials of +950 mV and +650 mV vs. the Ag|AgCl reference electrode. Detector voltage and recording current was regulated by the CHI802D potentiostat (CH Instruments, Texas, USA). CHI802D software was used for data collection and processing. A cyclic voltammetry pre-treatment run (2 cycles of −2.5 V to +2.5 V at 0.1 V s−1) was used between each sample to eliminate any effects of fouling.The stock buffer for the mobile phase was comprised of the following: 0.1 M sodium acetate, 0.1 M citric acid, and 27 μM disodium ethylene–diamine–tetra-acetate (EDTA) dissolved in 1 L of deionized, reverse osmosis water (RO H2O) and buffered to pH 3.0 using concentrated hydrochloric acid. To prepare the mobile phase, the HPLC grade methanol (Fisher Scientific) was mixed with the stock buffer in a ratio of 12:88 (v/v) and degassed after mixing.
Standards and characterisation studies
Standard 1 mM stock solutions of each analyte were prepared in RO water, excluding xanthurenic acid, which was prepared in DMSO and stored at −80 °C. Standard stock solutions were utilised to generate calibration responses of all analytes. Additionally, the stock solutions were utilised to assess the repeatability and the intra and inter-day precision of the assay. This was carried out by studying the variability of the standard measure of all analytes at concentration 1 μM at varying time frames between biological samples. The cross talk was explored between the two electrodes, by monitoring the peak area of dopamine, DOPAC, 5-HIAA and anthranillic acid when both electrodes were simultaneously detecting at either +650 mV or +950 mV versus when measurements of the same analytes were obtained when single channel measurements were conducted at both potentials.Data analysis and interpretation
During the chromatographic separation, there was co-elution of 5-HTP and KYN peaks. KYN was undetectable below +700 mV, therefore, we utilised +650 mV to provide a clear signal of 5-HTP, which could be used for subtraction from the +950 mV response which measured of both 5-HTP and KYN. However, there is a clear difference in the charge of 5-HTP between +650 mV and +950 mV (see Fig. 3). Therefore, the charge of 5-HTP obtained at +650 mV was multiplied by 1.5 as a correction factor to obtain the appropriate response at +950 mV. This correction factor was valid throughout a concentration range of 5-HTP expected in biological tissues and fluids (see ESI Fig. 1†). This allowed for accurate peak area analysis of both analytes. Once peak areas were obtained from all analytes, the concentration of the analytes was obtained from the generated calibration responses. Finally, the samples were then normalised to the amount of protein present within each sample in order to facilitate comparison between the varying biological samples, by using the Bradford method.21 Data was presented as mean ± standard deviation and samples were statistically analysed using one-way or two-way ANOVA.Results and discussion
Determination of analytes within the serotonin and kynurenine pathways
The chromatographic measurements were carried out using electrochemical detection as this provided an order of selectivity against other known analytes such as neuropeptides, which are not easily oxidizable in comparison to the biogenic amines with the 5-HT and KYN pathways on glassy carbon electrode.22 The chromatographic method utilised allowed for the separation of all components within 14 minutes as shown in Fig. 2. The retention times for 5-HTP + KYN (peaks overlapping), 5-HT, tryptophan, xanthurenic acid, 5-HIAA and anthranilic acid were 3.8, 4.2, 6.8, 8.2, 9.1 and 11.9 min. Previous studies have focused on the analytes within either the 5-HT or KYN pathway using either isocratic or complex gradient approaches, where retention times are comparable.7,8,12,18,19,23 In the one paper where analytes from both pathways were measured in isocratic mode, the separation of identical analytes was achieved in 20 minutes.12 From the pathway shown in Fig. 1, other analytes, such as kynurenic acid, quinolinic acid and picolinic acid were only detectable at concentrations greater than 100 μM concentration and therefore, unlikely to be within the detection limits of the assay, as levels from biological tissues and fluids are expected to be much lower. We also explored the potential for interference from other neurochemicals such as norepinephrine, dopamine, DOPAC and homovanillic acid. No clear interference was observed when compared to the analytes within the 5-HT and KYN pathway. This also suggest that this approach can be utilised for measurement in biological tissues and fluids where multiple oxidizable neurotransmitters are present. There was good efficiency for the separation, with the number of theoretical plates greater than 1600 for all components. Excellent peak separation was observed, as the resolution was >1.5 between all analytes except for 5-HTP and KYN, where the analytes completely overlapped. All analytes showed excellent peak symmetry, as tailing factors were below 1.3.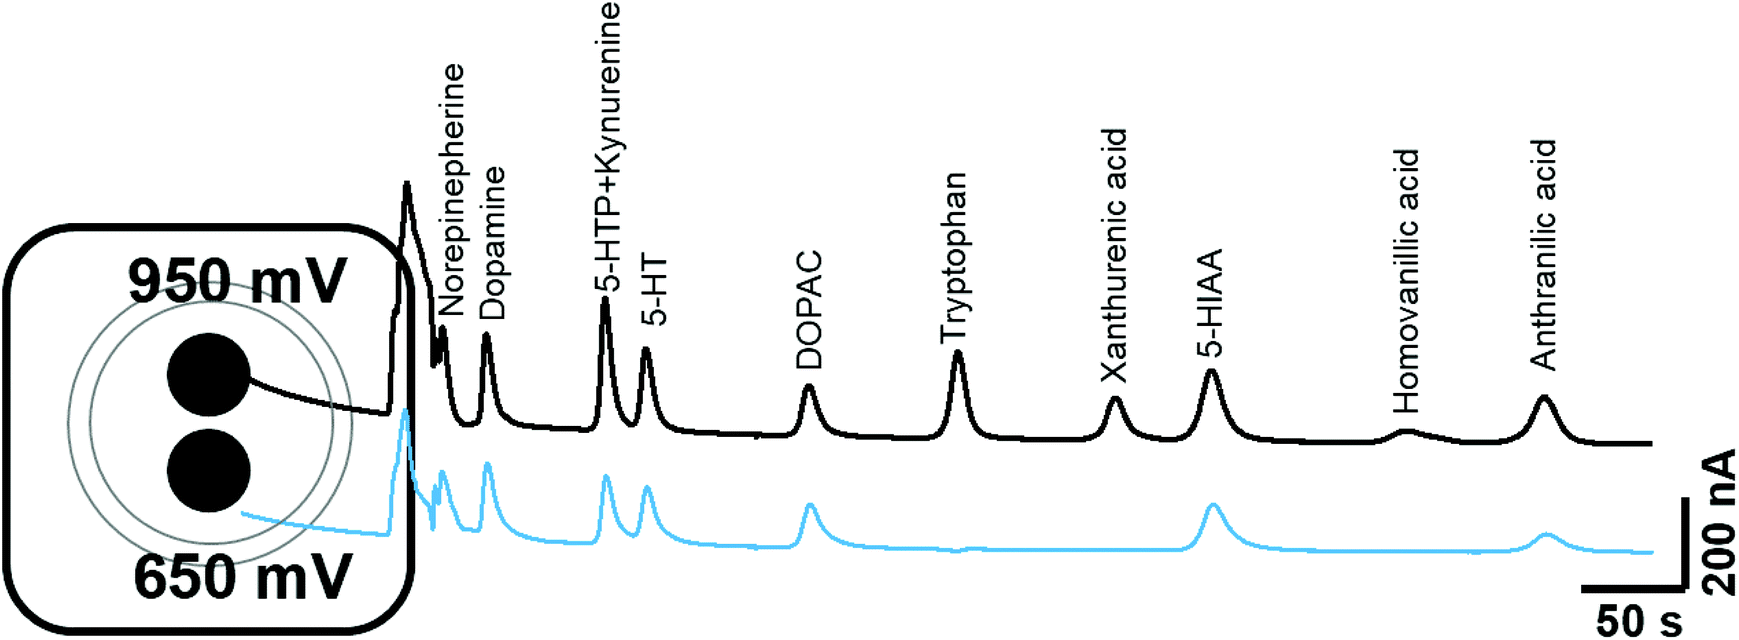 | ||
| Fig. 2 Schematic of the dual glassy carbon electrode utilised for simultaneous detection of analytes at +950 mV and +650 mV. Dual voltage detection was utilised to aid separation and validation of analyte detection. | ||
Our method solely used an isocratic mode in order to provide increased availability of the method over the more complex gradient system. We explored varying the concentration of the organic phase (5–13% methanol) in order separate the unresolved 5-HTP and KYN. Under all conditions investigated, the resolution was not improved to allow for baseline separation. Therefore, we explored the ability to use voltage as a mode for separating these two analytes. Fig. 3 shows hydrodynamic voltammograms of all the analytes obtained by plotting the peak area of each analyte at varying voltages. When the measurements were conducted the maximum peak area varied between each analyte at the range of voltages explored (Fig. 3A), and therefore for comparison of the hydrodynamic voltammograms, the peak area charge was normalised for analytes to the response observed at 1 V (Fig. 3B). Steady-state oxidation currents were observed at varying potentials for all analytes. 5-HTP shows a steady state oxidation current at +650 mV, whilst oxidation of KYN begins to occur from +850 mV. Therefore, by utilisation of dual voltage detection, we can utilise +950 mV and +650 mV in order to separate the co-eluted 5-HTP and KYN. This is an enhancement on previous studies, where five different detection voltages were needed in order to allow for clear separation of co-eluted analytes, and therefore our methodology reduces the need for multiple injections as measurements can be achieved in a single sample run.12
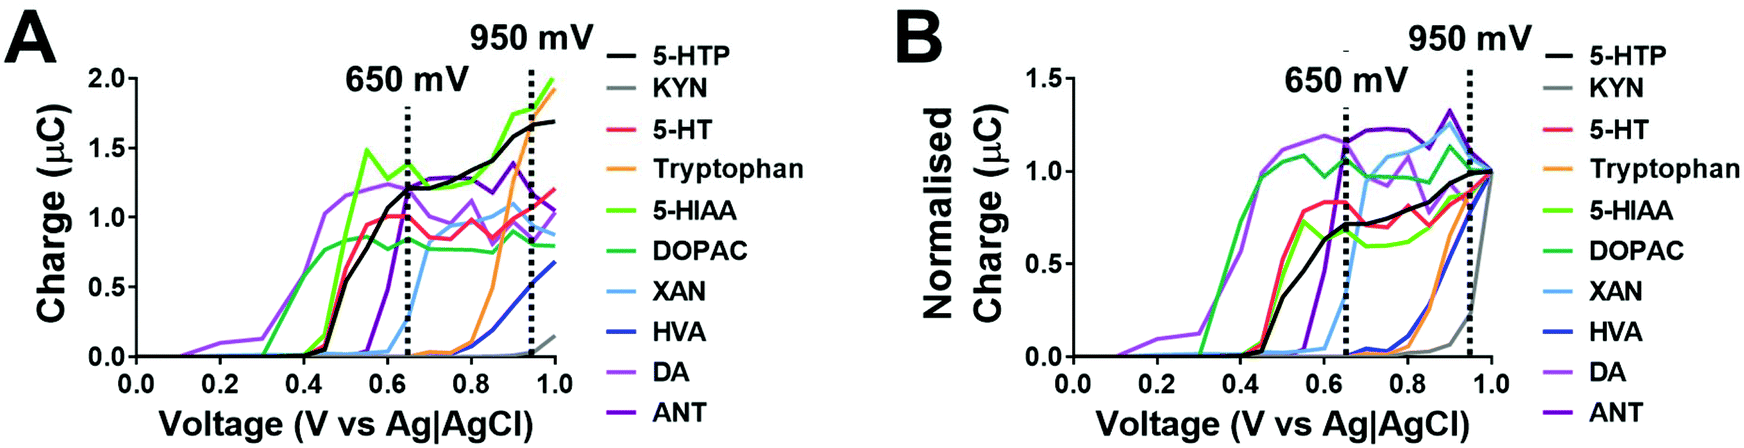 | ||
| Fig. 3 Hydrodynamic voltammograms of all analytes. (A) shows the response of all analytes where the peak area was monitored every 50 mV from 1 V to 0 V. (B) The response of all analytes was normalised to the charge observed at 1 V in order to show the voltammetric profile of each analyte in a comparable fashion. The dashed line highlights the voltages of 950 mV and 650 mV, which were utilised for dual detection and separation of analytes. | ||
Given that dual voltage provides the ability to detect co-eluted 5-HTP and KYN, we investigated if this approach provides the ability to accurately monitor the concentration of each analyte. When a mixture of 5-HTP and KYN was run at +950 mV, there is a clear presence of a shoulder on the peak, which can be interpreted to be the presence of KYN (Fig. 4A). When the mixture of 5-HTP and KYN is run at +650 mV, only 5-HTP is identified and the peak is comparable to that of the 5-HTP standard (Fig. 4B). When utilising the corrected +650 mV 5-HTP response to subtract the mixture response at +950 mV, in order to identify the presence of KYN, there was no significant different in the peak area of KYN within the mixture and when it was injected as a standard (Fig. 4C, P = 0.69). In similar fashion, no significant differences were observed in the peak area of the 5-HTP in the mixture to the individual standard at +650 mV (Fig. 4D, P = 0.88).
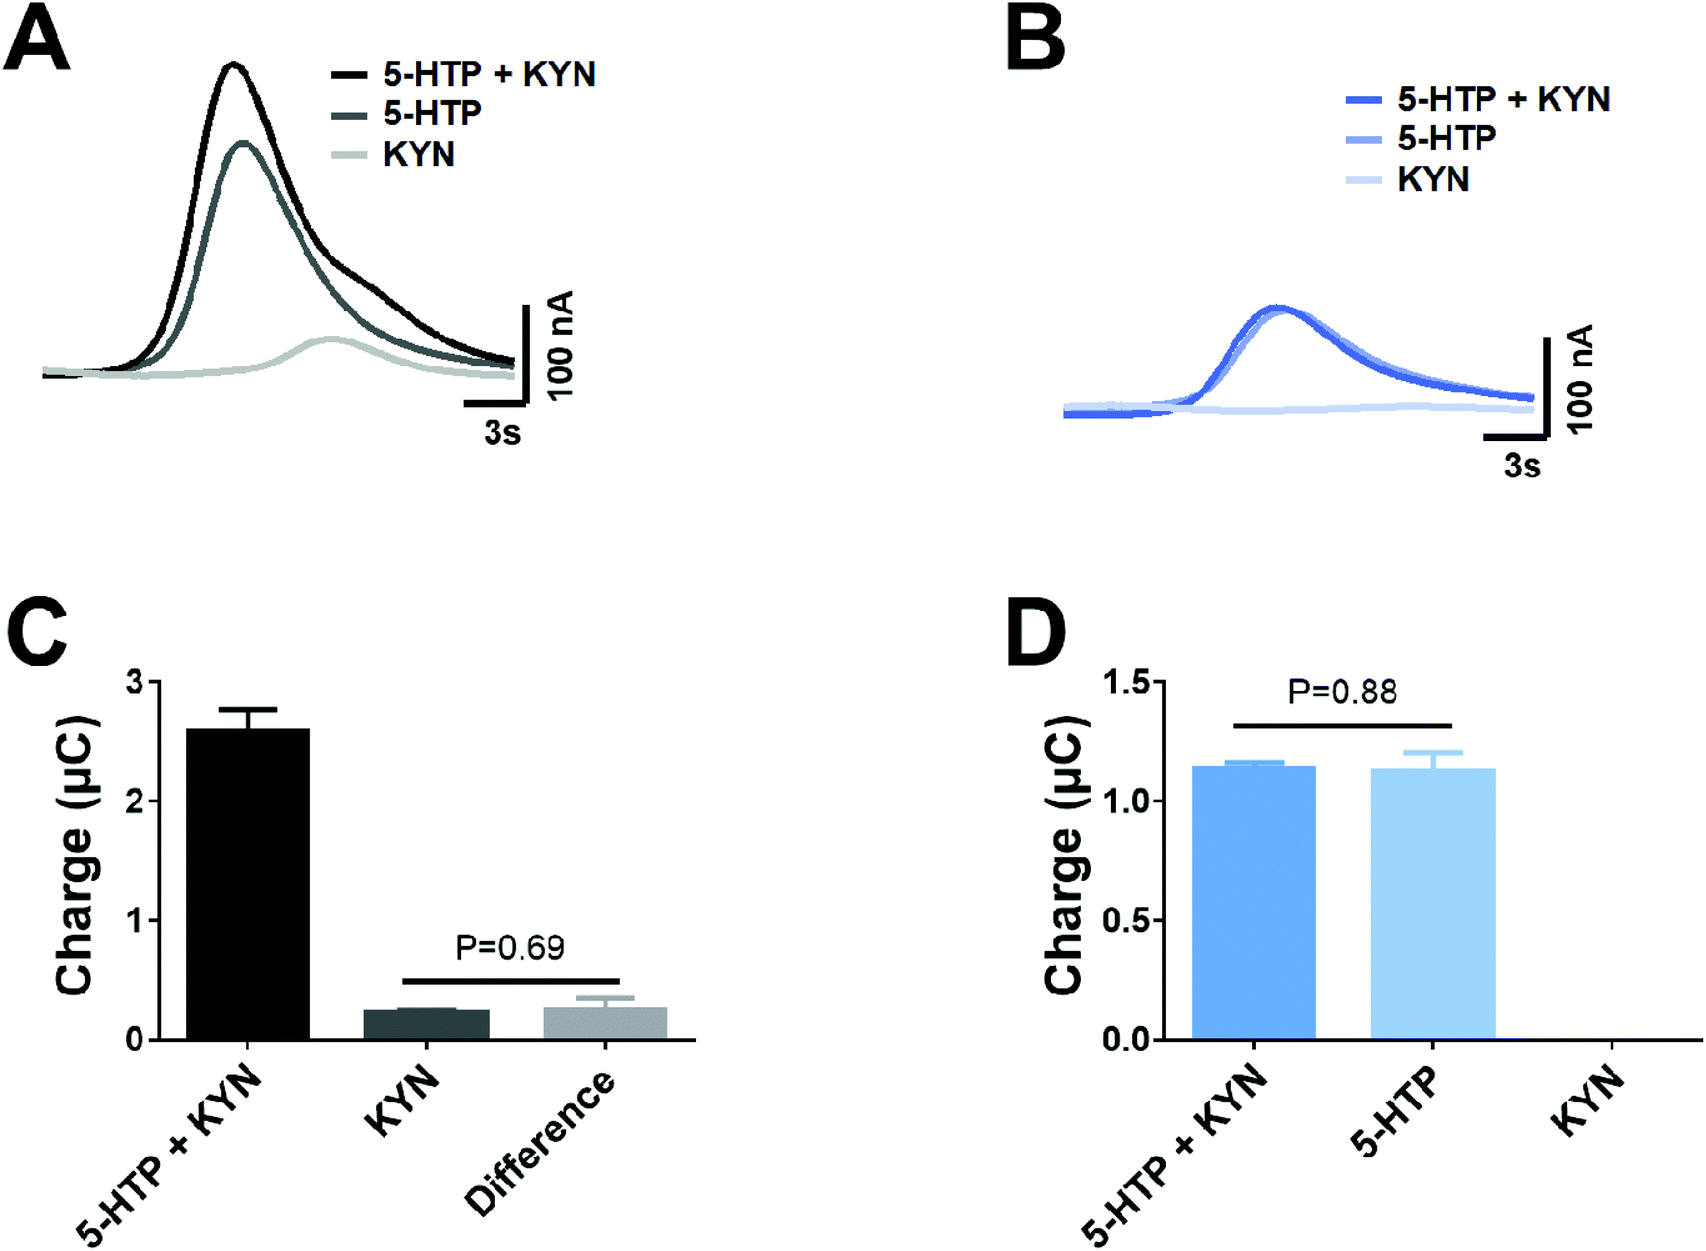 | ||
| Fig. 4 Separation of overlapping 5-HTP and KYN peaks through utilisation of the simultaneous dual voltage detection. Responses are shown for mixture of 1 μM 5-HTP and KYN, as well as individual standards of each at (A) 950 mV and (B) 650 mV. The resultant peak area was obtained from the traces at (C) 950 mV and (D) 650 mV and compared between standards to showcase the ability to accurately use the dual voltage subtraction approach to monitor KYN. Data shown as mean ± standard deviation, n = 4. | ||
Linearity, detection limits and accuracy
For each analyte the calibration curve was obtained. The analytes from the 5-HT and KYN pathways are present in varying concentrations within different biological tissues and fluids therefore the concentration range was chosen to reflect this. The limit of detection (LOD, based on the 3 standard deviations of the y intercept using least-squares regression of the slope), the calibration equations and the correlation coefficient (R2) are shown in ESI Table 1.† For all analytes, the LOD was <35 nM for all analytes and therefore were fit for measurement in the biological tissues and fluid assessed. The standards injected repeatedly over a period of one month showed less than 2% variation in intra and inter-day precision. When the mixture of analytes was injected over 20 times, there was less than 1% variation in responses. These responses suggest that the assay has excellent reproducibility and the detector is not prone to fouling at the concentrations studied.Determination of crosstalk between electrodes
As our approach for measurement only requires the use of two voltages for separation of co-eluted analytes, therefore simultaneous dual detection can be utilised in a radial flow cell, rather than the conventional approach using crossflow detection.24,25 However, with this approach, where two adjacent electrodes are simultaneously detecting analytes, there is a potential for crosstalk interference between the two electrodes. Therefore, we explored if the peak area of analytes were altered when both electrodes were held at a fixed voltage in comparison to when only one electrode was held at a fixed voltage.Fig. 5 shows the responses from crosstalk studies, where at +950 mV (Fig. 5A) and +650 mV (Fig. 5C), there was no clear variation in the chromatographic responses. For a range of four different analytes (dopamine, DOPAC, 5-HIAA and ANT) that spanned the duration of the chromatographic separation, the peak area was compared when one or both electrodes were held at either +950 mV (Fig. 5C) or +650 mV (Fig. 5D). In both cases, there was no significant difference in the charge observed between dual detection and individual detection. This clearly indicates that when simultaneous dual detection is conducted in a radial flow cell, there is no crosstalk interference between electrodes.
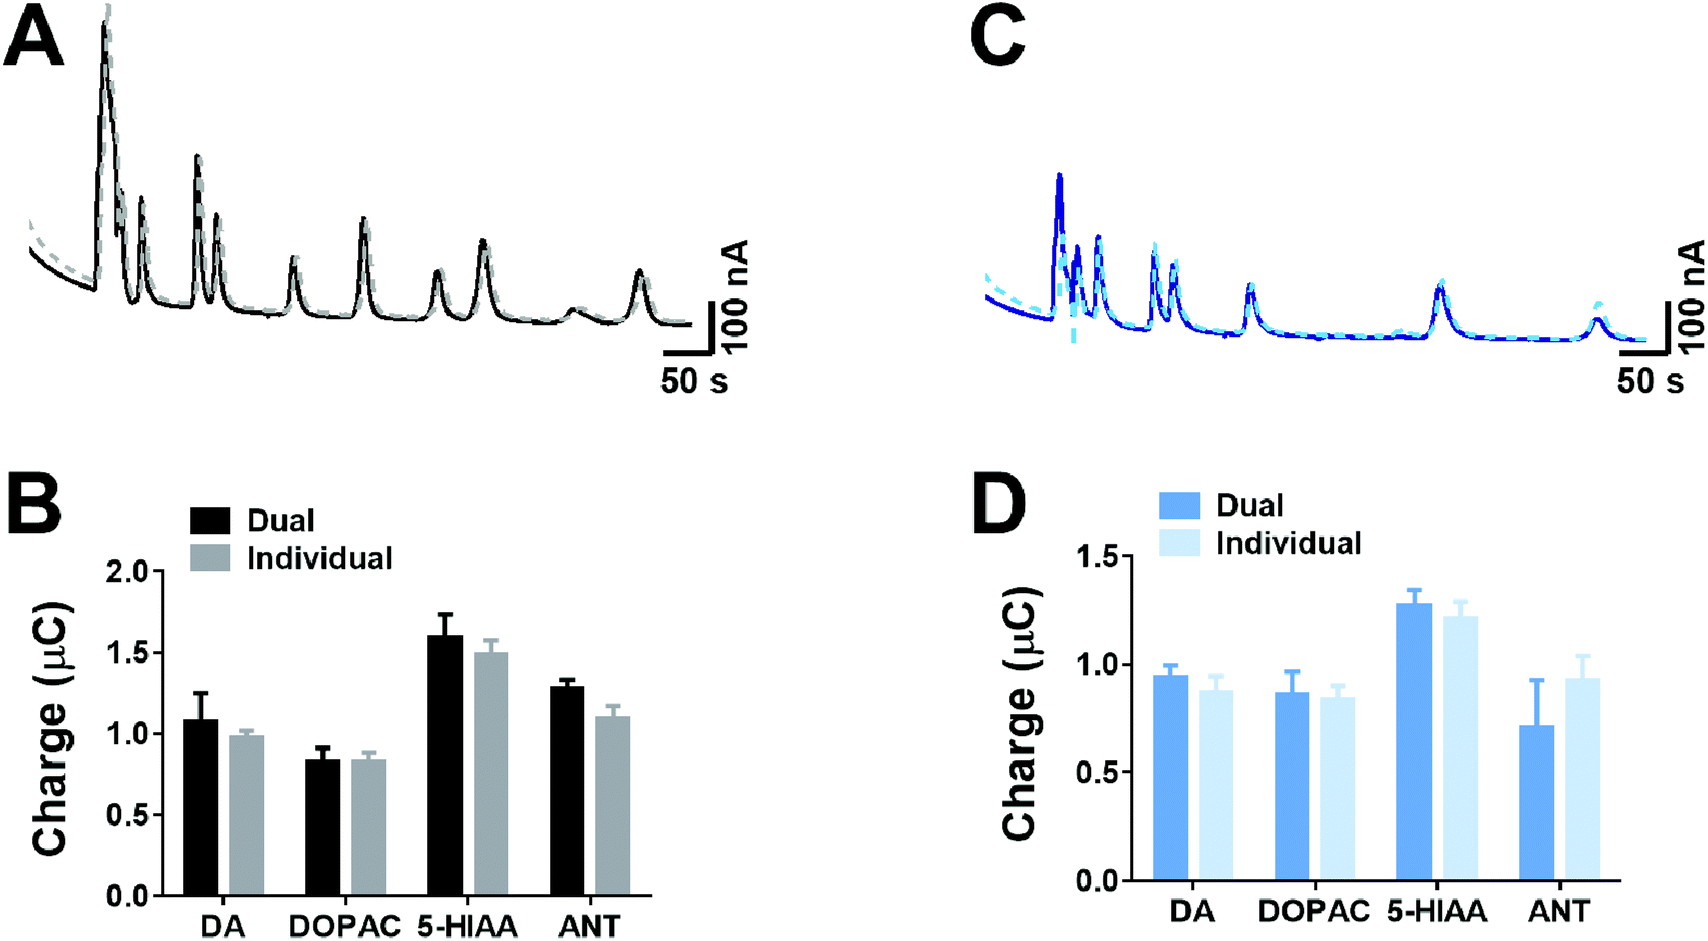 | ||
| Fig. 5 Determination of crosstalk between dual electrodes. Measurements were performed at (A) +950 mV and (C) +650 mV, where the analyte mixture was injected when either both electrodes were held at the given potential (solid line) or an individual electrode was polarised (dashed line). The resultant peak areas from multiple runs at (B) 950 mV and (D) 650 mV show no difference between the dual electrode and individual electrode. Data shown as mean ± standard deviation, n = 4. | ||
Measurement of analytes from biological tissues and fluids
In order to validate the methodology, we explored if tryptophan metabolism was altered between three distinct biological samples. These were the hippocampus, the blood and the ileum. The chromatographic responses from hippocampus, blood and ileum are shown in Fig. 6A–C. Analytes from both the 5-HT and KYN pathways can be seen in all the three tissue samples. Utilisation of the dual voltage protocol provides clear identification of components and highlights the presence of KYN in the 5-HTP peak due to a response being observed in the chromatogram at +650 mV.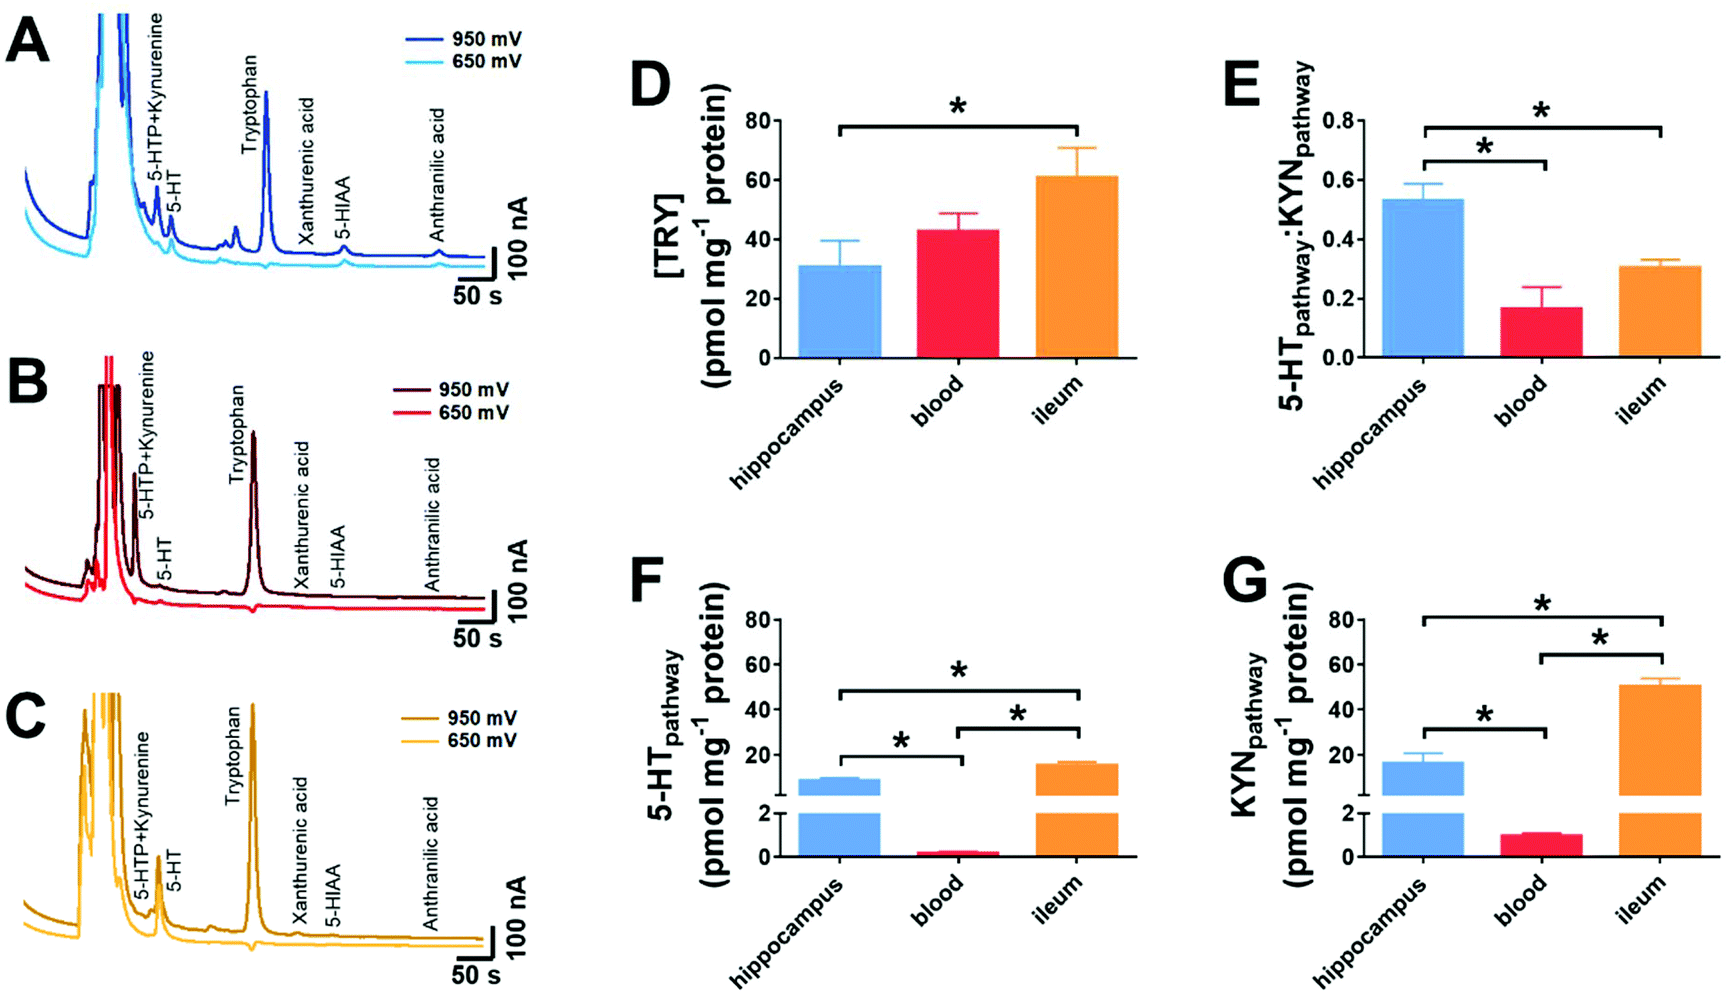 | ||
| Fig. 6 Measurement from biological tissues and fluids. Chromatographic responses from (A) hippocampus, (B) blood and (C) ileum are shown at 950 and 650 mV. From the resultant chromatograms, (D) the amount of tryptophan was measured. (E) shows the ratio between the 5-HT pathway and the KYN pathway, based on the analytes shown in Fig. 1. (F) shows the combined amount from the various analytes from 5-HT pathway and (G) shows the combined amount from the various analytes within the KYN pathway in the varying biological samples. Data shown as mean ± standard deviation, n = 3, *p < 0.05. | ||
There was a significant increase in the amount of tryptophan present in the ileum when compared to the hippocampus (p < 0.05, n = 3, Fig. 6D). This may be because tryptophan is adsorbed by the gut and may be stored prior to circulation to all cells.26 The ratio of the net amount of the analytes within the 5-HT pathway (5-HTP, 5-HT, 5-HIAA) was compared to that of the KYN pathway (KYN, XAN, ANT). The ratio was significantly greater in the hippocampus, when compared to the blood and ileum (p < 0.05, n = 3, Fig. 6E). Given that this ratio provides an important insight to the elevated inflammation or oxidative stress,27,28 it is suggestive that blood and ileum levels exert higher levels of inflammation and oxidative stress than the hippocampus. This may be due to the greater likelihood of external environmental irritants causing oxidative stress in the ileum. The high levels of KYN within the blood is most likely due to the circulating levels in plasma,29 then those produced within the blood.
When the ratio of the individual components is broken down to amounts of analytes from the 5-HT pathway, the ileum has a significantly greater amount of 5-HT pathway analytes, when compared to the hippocampus and blood (p < 0.05). The hippocampus has a greater amount of 5-HT pathways analytes when compared to blood (p < 0.05, Fig. 6F). This is anticipated, as a large proportion of 5-HT is synthesized in intestinal enterochromaffin cells.30,31 When exploring the KYN pathway, a similar trend was observed where there was a significantly greater amount of 5-HT pathway analytes, when compared to the hippocampus and ileum (p < 0.05). The hippocampus has a greater amount of KYN pathways analytes when compared to blood (p < 0.05, Fig. 6F).
Varying biological regions have highlighted key differences in how tryptophan metabolism occurs and this in turn can have significant implications in the function of the biological region as well as provide key insight into its inflammatory state. Measuring the change in the ratio between the 5-HT and KYN can provide key insight into the onset or status of stress and inflammation within a biological system.
Conclusion
We have developed a simple and robust chromatography methodology which utilises dual electrochemical detection for separation and identification of co-eluted analytes. Within our approach we were able to detect a range of tryptophan metabolism analytes within the 5-HT and KYN pathways. Our findings from biological measurements, highlighted that tryptophan metabolism is significantly greater towards the KYN pathway than the 5-HT pathways in various biological tissues. This methodology provides the ability to explore the important role of tryptophan metabolism in stress and age-related disease.Author contributions
EB, VSM and AB conducted the study and data analysis. MSY and BAP designed the research. The manuscript was written by MSY and BAP and revised by EB. All authors have given approval to the final version of the manuscript.Conflicts of interest
There are no conflicts of interest to declare.Acknowledgements
The authors would like to thank the staff of the School of Pharmacy and Biomolecular Sciences Bioresource Centre for care of the animals used in this study.References
- C. Gemma, J. Vila, A. Bachstetter and P. C. Bickford, 15 Oxidative Stress and the Aging Brain: From Theory to Prevention, Brain aging: models, methods, and mechanisms, 2007 Search PubMed.
- N. Ogasawara, T. Oguro, T. Sakabe, M. Matsushima, O. Takikawa, K. i. Isobe and F. Nagase, Hemoglobin induces the expression of indoleamine 2, 3-dioxygenase in dendritic cells through the activation of PI3K, PKC, and NF-κB and the generation of reactive oxygen species, J. Cell. Biochem., 2009, 108, 716–725 CrossRef CAS PubMed.
- F. Burke, R. G. Knowles, N. East and F. R. Balkwill, THE role of indoleamine 2, 3-dioxygenase in the anti-tumour activity of human interferon-γ in vivo, Int. J. Cancer, 1995, 60, 115–122 CrossRef CAS PubMed.
- G. Mackay, C. Forrest, N. Stoy, J. Christofides, M. Egerton, T. Stone and L. Darlington, Tryptophan metabolism and oxidative stress in patients with chronic brain injury, Eur. J. Neurol., 2006, 13, 30–42 CrossRef CAS PubMed.
- Y. Aman, Y. Qiu, J. Tao and E. F. Fang, Therapeutic potential of boosting NAD+ in aging and age-related diseases, Transl. Med. Aging, 2018, 2, 30–37 CrossRef.
- C. P. Bearcroft, M. J. G. Farthing and D. Perret, Determination of 5-Hydroxytryptamine, 5-Hydroxyiondoleacetic Acid and Tryptophan in Plasma and Urine by HPLC with Fluorimetric Detection, Biomed. Chromatogr., 1995, 9, 23–27 CrossRef CAS PubMed.
- A. T. Wood and M. R. Hall, Reversed-phase high-performance liquid chromatography of catecholamines and indoleamines using a simple gradient solvent system and native fluorescence detection*1, J. Chromatogr. B: Biomed. Sci. Appl., 2000, 744, 221–225 CrossRef CAS.
- J. Vignau, M. C. Jacquemont, A. Lefort, M. Imbenotte and M. Lhermitte, Simultaneous determination of tryptophan and kynurenine in serum by HPLC with UV and fluorescence detection, Biomed. Chromatogr., 2004, 18, 872–874 CrossRef CAS PubMed.
- P. L. Francis and I. Smith, High-performance liquid chromatography of tryptophan metabolites: Applications in biosynthesis and kinetics, J. Chromatogr. B: Biomed. Sci. Appl., 1982, 232, 165–169 CrossRef CAS.
- G. Koppisetti, A. Siriki, K. Sukala and G. V. Subbaraju, Estimation of l-5-hydroxytryptophan in rat serum and Griffonia seed extracts by liquid chromatography mass spectrometry, Anal. Chim. Acta, 2005, 549, 129–133 CrossRef CAS.
- Y. Huang, A. Louie, Q. Yang, N. Massenkoff, C. Xu, P. W. Hunt and W. Gee, A simple LC–MS/MS method for determination of kynurenine and tryptophan concentrations in human plasma from HIV-infected patients, Bioanalysis, 2013, 5, 1397–1407 CrossRef CAS PubMed.
- A. Vaarmann, A. Kask and U. Mäeorg, Novel and sensitive high-performance liquid chromatographic method based on electrochemical coulometric array detection for simultaneous determination of catecholamines, kynurenine and indole derivatives of tryptophan, J. Chromatogr. B: Anal. Technol. Biomed. Life Sci., 2002, 769, 145–153 CrossRef CAS.
- T.-t. Du, T. Cui, H.-m. Qiu, N.-r. Wang, D. Huang and X.-h. Jiang, Simultaneous determination of tryptophan, kynurenine, kynurenic acid and two monoamines in rat plasma by HPLC-ECD/DAD, J. Pharm. Biomed. Anal., 2018, 158, 8–14 CrossRef CAS PubMed.
- L. Parmar, L. D. Morgan and B. A. Patel, Intracellular and extracellular sampling to monitor the neurotransmission process using a chromatographic method, Anal. Methods, 2011, 3, 2770–2776 RSC.
- E. K. Cseh, G. Veres, M. Szentirmai, N. Nánási, I. Szatmári, F. Fülöp, L. Vécsei and D. Zádori, HPLC method for the assessment of tryptophan metabolism utilizing separate internal standard for each detector, Anal. Biochem., 2019, 574, 7–14 CrossRef CAS PubMed.
- P. Francis and I. Smith, High-performance liquid chromatography of tryptophan metabolites: Applications in biosynthesis and kinetics, J. Chromatogr. B: Biomed. Sci. Appl., 1982, 232, 165–169 CrossRef CAS.
- I. Sadok, A. Gamian and M. M. Staniszewska, Chromatographic analysis of tryptophan metabolites, J. Sep. Sci., 2017, 40, 3020–3045 CrossRef CAS PubMed.
- L. Liu, Y. Chen, Y. Zhang, F. Wang and Z. Chen, Determination of tryptophan and kynurenine in human plasma by liquid chromatography–electrochemical detection with multi-wall carbon nanotube-modified glassy carbon electrode, Biomed. Chromatogr., 2011, 25, 938–942 CrossRef CAS PubMed.
- B. Widner, E. R. Werner, H. Schennach, H. Wachter and D. Fuchs, Simultaneous measurement of serum tryptophan and kynurenine by HPLC, Clin. Chem., 1997, 43, 2424–2426 CAS.
- R. M. W. Chau and B. A. Patel, Determination of serotonin, melatonin and metabolites in gastrointestinal tissue using high-performance liquid chromatography with electrochemical detection, Biomed. Chromatogr., 2009, 23, 175–181 CrossRef CAS PubMed.
- M. M. Bradford, A rapid and sensitive method for the quantitation of microgram quantities of protein utilizing the principle of protein-dye binding, Anal. Biochem., 1976, 72, 248–254 CrossRef CAS PubMed.
- N. C. Reynolds Jr., B. M. Kissela and L. H. Fleming, The voltammetry of neuropeptides containing L-tyrosine, Electroanalysis, 1995, 7, 1177–1181 CrossRef.
- A. Laich, G. Neurauter, B. Widner and D. Fuchs, More rapid method for simultaneous measurement of tryptophan and kynurenine by HPLC, Clin. Chem., 2002, 48, 579–581 CAS.
- Z. D. Brodnik and G. E. Jaskiw, Effect of mobile phase pH on the function of other optimization parameters in an HPLC–ECD assay of biogenic amines and their metabolites, J. Liq. Chromatogr. Relat. Technol., 2015, 38, 467–471 CrossRef CAS.
- C. S. Chaurasia, C.-E. Chen and C. R. Ashby Jr., In vivo on-line HPLC-microdialysis: simultaneous detection of monoamines and their metabolites in awake freely-moving rats, J. Pharm. Biomed. Anal., 1999, 19, 413–422 CrossRef CAS.
- S. A. Adibi, S. J. Gray and E. Menden, The kinetics of amino acid absorption and alteration of plasma composition of free amino acids after intestinal perfusion of amino acid mixtures, Am. J. Clin. Nutr., 1967, 20, 24–33 CrossRef CAS PubMed.
- A. L. Lopresti, G. L. Maker, S. D. Hood and P. D. Drummond, A review of peripheral biomarkers in major depression: the potential of inflammatory and oxidative stress biomarkers, Prog. Neuro-Psychopharmacol. Biol. Psychiatry, 2014, 48, 102–111 CrossRef PubMed.
- K. Sas, H. Robotka, J. Toldi and L. Vécsei, Mitochondria, metabolic disturbances, oxidative stress and the kynurenine system, with focus on neurodegenerative disorders, J. Neurol. Sci., 2007, 257, 221–239 CrossRef CAS.
- A. K. Walker, E. E. Wing, W. A. Banks and R. Dantzer, Leucine competes with kynurenine for blood-to-brain transport and prevents lipopolysaccharide-induced depression-like behavior in mice, Mol. Psychiatry, 2018 DOI:10.1038/s41380-018-0076-7.
- K. Racke, A. Reimann, H. Schworer and H. Kilbinger, Regulation of 5-HT release from enterochromaffin cells, Behav. Brain Res., 1995, 73, 83–87 CrossRef CAS.
- B. A. Patel, X. Bian, V. Quaiserova-Mocko, J. J. Galligan and G. M. Swain, In vitro continuous amperometric monitoring of 5-hydroxytryptamine release from enterochromaffin cells of the guinea pig ileum, Analyst, 2007, 132, 41–47 RSC.
Footnote |
| † Electronic supplementary information (ESI) available. See DOI: 10.1039/c9an01501a |
| This journal is © The Royal Society of Chemistry 2019 |