 Open Access Article
Control of the photochromic behavior of cobaloxime complexes with salicylidene-3-aminopyridine and 2-cyanoethyl groups by dual photoisomerization†
Akiko
Sekine
*,
Sayaka
Ina
,
Kohei
Johmoto
and
Hidehiro
Uekusa
Department of Chemistry and Materials Science, Graduate School of Science and Engineering, Tokyo Institute of Technology, O-okayama, Meguro-ku, Tokyo 152-8551, Japan. E-mail: asekine@chem.titech.ac.jp
First published on 13th June 2016
Abstract
New dual photoisomeric cobaloxime complexes composed of salicylidene-3-aminopyridine derivatives and a 2-cyanoethyl group as axial ligands were synthesized. Photoisomerization of the 2-cyanoethyl group in the crystalline state was performed to control the photochromic properties of the salicylidene-3-aminopyridine derivatives. The colors of the three cobaloxime crystals changed from pale yellow to orange or dark red when the crystals were irradiated with UV light. The red crystals returned to their original color when they were irradiated with visible light or kept in the dark. When the crystals were exposed to visible light before UV irradiation, the 2-cyanoethyl group bonded to the cobalt atom isomerized to the 1-cyanoethyl group with retention of the single crystal form. The crystals containing the 1-cyanoethyl group after photoirradiation also showed photochromism on exposure to UV light. However, the lifetime of the photochromic red species after 2–1 isomerization of the cyanoethyl group was significantly different from that before isomerization. The difference is well explained by the cavity volume around the central C–N bond of the salicylidene moiety in the crystal of the red species.
Introduction
The light-induced reversible color change of materials is called photochromism. Organic photochromic compounds have been applied to optical data storage systems, electronic display systems, optical switching devices, ophthalmic glasses, and so on.1–4N-Salicylideneanilines (SAs) exhibit photochromism in both solution and the solid state.5 Photochromic SAs are usually colorless or pale yellow and exist in the cis-enol form in crystals, as shown in Scheme 1. The structure of the metastable red species has been controversial for a long time. However, using the crystal of N-3,5-di-tert-butylsalicylidene-3-nitroaniline, it has been directly confirmed by X-ray analysis with the two-photon excitation technique that the red trans-keto form is produced from the cis-enol form through the cis-keto form, as shown in Scheme 1.6The analyzed structure of the metastable red species shows that a trans-keto pair forms around an inversion center with formation of two hydrogen bonds, although no hydrogen bond is observed in the original crystal containing the cis-enol form. It has been proposed that these hydrogen bonds may stabilize the metastable trans-keto form and the longest lifetime would be realized for the crystal of N-3,5-di-tert-butylsalicylidene-3-nitroaniline.7
For N-3,5-di-tert-butylsalicylidene-3-carboxyaniline, in which the nitro group in N-3,5-di-tert-butylsalicylidene-3-nitroaniline is replaced by the carboxyl group, two polymorphic crystals can be obtained (α and β forms) and both show photochromism. The lifetimes of the red species of the α and β forms are 17 and 780 min, respectively, whereas the lifetime of N-3,5-di-tert-butyl-salicylidene-3-nitroaniline is 1200 min. The crystal structures of the red species of the α and β forms indicate that there is no intermolecular hydrogen bonding in the crystal structure of the red species of the α form, whereas there is one intermolecular hydrogen bond in the red species of the β form.8 It is clear that the stability of the red species is closely related to the number of intermolecular hydrogen bonds in the crystal of the metastable red species.
To use SAs as photochromic materials, it is very important to control the time of the color change. Although the color change time is too fast to control on exposure to UV light, the color change (or fading) time of the red species strongly depends on the intermolecular interactions in the crystal. This suggests that if another photochangeable moiety can be substituted in photochromic SAs, different photochromic behaviors should be observed before and after photoreaction of the inserted moiety. It has been reported that the color of a cobalt complex with a diarylethene derivative ligand changes before and after a methanol molecule coordinates to the cobalt atom under methanol vapor.9
Cobaloxime complexes with a photochangeable alkyl group and a base ligand as axial ligands seem to be good candidates to control the photochromic behavior, because they show almost 100% photoisomerization on exposure to visible light without destroying the single crystal form.10–13 If such a cobaloxime moiety is introduced into a crystal containing SAs, it is expected that the lifetime of the red species of the SA would change before and after the photoisomerization of the alkyl group of the cobaloxime moiety.
In previous studies,14–16 cobaloxime complexes with a 3-cyanopropyl group and photochromic azobenzene derivatives as an axial alkyl group and base ligands, respectively, were prepared and the photochromic behavior of the azobenzene moiety was compared before and after photoisomerization from the 3-cyanopropyl group to the 1-cyanopropyl group. The rate of the color change because of trans–cis isomerization of azobenzene significantly changed. However, it was difficult to investigate how the structural change because of 3–1 photoisomerization influenced the rate of the color change because the crystal gradually decomposed in the process of trans–cis isomerization of the azobenzene moiety.
Cobaloxime complexes containing N-salicylidene-3-amino-pyridines (SAPs), in which the aniline moiety of SAs is replaced by 3-aminopyridine to coordinate to the cobalt atom, have been prepared to control the photochromism of SAP moieties.17 It was observed that the color fading rates of the SAP moieties significantly changed before and after the 3-cyanopropyl group was isomerized to the 1-cyanopropyl group with retention of the single crystal form on exposure to visible light.
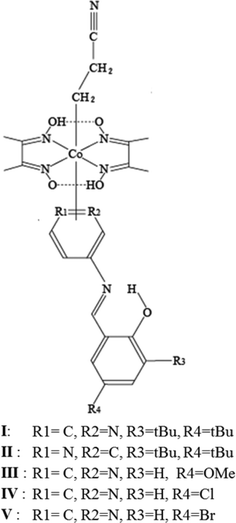
In the present work, the 3-cyanopropyl group is replaced by the 2-cyanoethyl group to determine the effect of a smaller structural change. Five cobaloxime complex crystals with a 2-cyanoethyl group and different axial SAP ligands were prepared: N-3,5-di-tert-butylsalicylidene-3-aminopyridine (I), N-3,5-di-tert-butylsalicylidene-4-aminopyridine (II), N-5-methoxysalicylidene-3-aminopyridine (III), N-5-chlorosalicylidene-3-amino-pyridine (IV), and N-5-bromosalicylidene-3-aminopyridine (V) (Fig. 1). Because photochromism on exposure to UV light was observed for I–III but not for IV and V, the crystal structures of I–V were analyzed to determine the reason why the latter two crystals showed no photochromism. Moreover, modified photochromic behavior was observed in I–III before and after photoisomerization of the 2-cyanoethyl group. The crystal structures of I–III before and after photoisomerization were analyzed. The different photochromic behavior is discussed considering the structural changes during 2–1 photoisomerization.
Experimental
Preparation
Photochromism of I–V owing to UV light irradiation
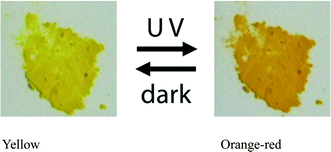
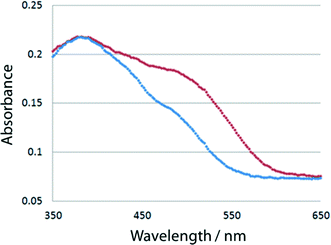
Each powdered sample of I–V, which was obtained by grinding the single crystals, was irradiated with UV light generated by an ultrahigh-pressure Hg lamp (SAN-EI UVF-352S) at room temperature and passed through a glass filter (HOYA UV-360) that allows wavelengths around 360 nm to pass through. The distance between the powdered sample and the lamp was 5 cm. The color of I changed from yellow to orange-red, as shown in Fig. 2. The red species thermally faded when the samples were kept in the dark at room temperature or irradiated with visible light. To more quantitatively examine the color change, 7.0 mg of the crystalline powder of each of I–V was mixed with 350 mg of barium sulfate in a mortar. The UV/vis spectra of the powdered samples were measured before and after UV irradiation using a JASCO V-560 spectrometer. The absorbance at 500 nm significantly increased because of UV irradiation. The change of the absorbance of I is shown in Fig. 3. Similar spectral changes were observed for II and III. However, no color changes were observed for IV and V. This suggests that the structural change from the cis-enol form to the trans-keto form (Scheme 1) occurred in the crystals of I, II, and III, but not in the crystals of IV and V.Isomerization on exposure to visible light
KBr discs (conc. 1.2%) made with powdered samples of I, II, and III, which were obtained by grinding the single crystals, were irradiated with visible light using a xenon lamp (SAN-EI, SUPERBRIGHT-152S), whose top was placed 5 cm from the disc. A glass filter (Toshiba Y44) was inserted between the disc and the lamp. The change in the C![[triple bond, length as m-dash]](https://www.rsc.org/images/entities/char_e002.gif) N stretching vibration was measured at a constant interval with an infrared (IR) spectrometer (Bio-Rad Excalibur FTS 3000). With increasing irradiation time, the peak at ca. 2240 cm−1 owing to the 2-cyanoethyl group gradually decreased and a new peak owing to the 1-cyanoethyl group appeared at ca. 2200 cm−1 and then gradually increased. The IR spectra of I before and after 120 min irradiation are shown in Fig. 4. This indicates that the 2-cyanoethyl group changed to the 1-cyanoethyl group. The 2–1 isomerization rate exponentially changed in the early stage (<3 min), but the rate gradually decreased and the spectral changes were within the experimental error after 2 h exposure, as shown in Fig. 5.
N stretching vibration was measured at a constant interval with an infrared (IR) spectrometer (Bio-Rad Excalibur FTS 3000). With increasing irradiation time, the peak at ca. 2240 cm−1 owing to the 2-cyanoethyl group gradually decreased and a new peak owing to the 1-cyanoethyl group appeared at ca. 2200 cm−1 and then gradually increased. The IR spectra of I before and after 120 min irradiation are shown in Fig. 4. This indicates that the 2-cyanoethyl group changed to the 1-cyanoethyl group. The 2–1 isomerization rate exponentially changed in the early stage (<3 min), but the rate gradually decreased and the spectral changes were within the experimental error after 2 h exposure, as shown in Fig. 5.
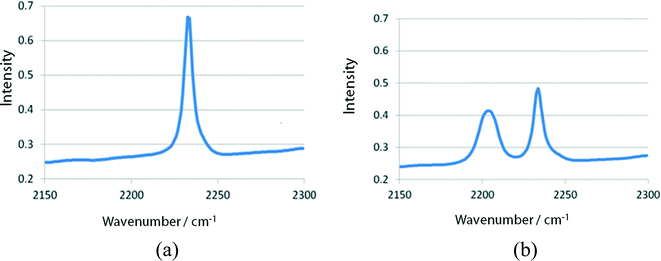 | ||
| Fig. 4 Change in IR spectra of I (a) before and (b) after 120 min visible-light irradiation. The stretching vibration modes of the 2-ce and 1-ce groups appear at 2240 and 2200 cm−1, respectively. | ||
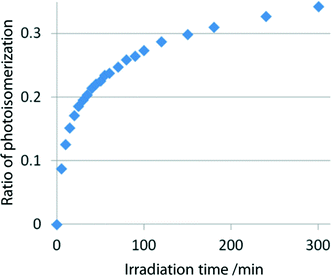 | ||
| Fig. 5 Rate of the 2–1 photoisomerization of the 2-ce group of I at early stages on exposure to visible light. | ||
For powdered samples of II and III, the changes in the IR spectra were measured in the same way. The isomerization rates in the early stage are somewhat different from that of I. The changes became small after 2 h exposure. Although similar 2–1 isomerization was observed for IV and V, further quantitative measurements were not performed because they showed no photochromism with UV light irradiation.
Photoisomerization of single crystals of I–III
Single crystals of I, II, and III were irradiated with visible light from the xenon lamp through a filter (TOSHIBA, R620) at a distance of 2 cm. This means that the crystal was irradiated with wavelengths longer than 620 nm. 2–1 Isomerization proceeded with retention of the single crystal form. The changes of the cell dimensions of the single crystals of I, II, and III were within the experimental error after 85, 92.5, and 79 h exposure, respectively. Hereafter, these crystals are called I′, II′, and III′, respectively.Thermal fading rates
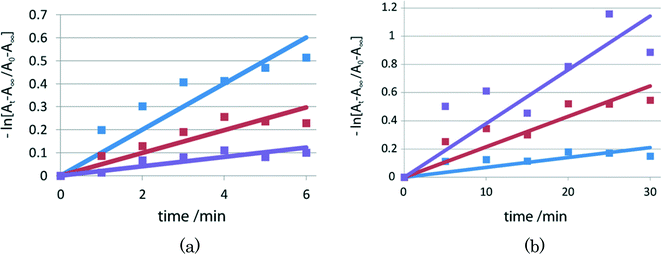
To measure the rate of thermal color fading, time-dependent UV/vis spectra were recorded for the red samples of I, II, and III at intervals of 5 min in the dark at room temperature. The fading rates after time t (min) were obtained from the ratio (At − A∞)/(A0 − A∞), where A0 and At are the integrated values of the absorbance from 400 to 700 nm at time 0 and time t, respectively, and A∞ is the corresponding integrated value before irradiation. The rate constant k was determined assuming first-order kinetics using −kt = ln[(At − A∞)/(A0 − A∞)] before 2–1 isomerization (before Xe lamp exposure) and after 4 and 15 min irradiation with the lamp, as shown in Fig. 6. The lifetimes of the red species of I were obtained by τ = 1/k.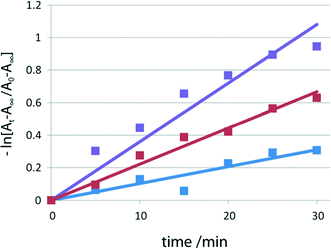 | ||
| Fig. 6 Fading rates of I before visible-light irradiation (blue), and after 4 min (red) and 15 min (violet) irradiation. | ||
For crystals of II and III, the lifetimes in the early stage are shown in Fig. 7(a) and (b), respectively. For powdered samples of I, II, and III, the lifetimes of the red species after 2–1 isomerization are shorter, longer, and shorter than the corresponding lifetimes before isomerization, respectively.
Crystal structure analysis
Crystals of I–V and I′–III′ were mounted on a diffractometer (Rigaku, R-AXIS RAPID or XtalLab) and intensity data was collected with MoKα radiation (λ = 0.71073 Å) at 173(2) K. The crystal data and experimental details for I–III and I′–III′ are shown in Table 1. The corresponding data for IV and V are shown in Table 2. Semi-empirical absorption correction was applied. The crystal structures were solved with the program SHELXS97 (ref. 18) or SIR2011 (ref. 19) and refined with full-matrix least-squares on F2 with the program SHELXL2013.20 All of the non-hydrogen atoms, including disordered atoms, were refined with anisotropic temperature factors. Hydrogen atoms were obtained geometrically and refined assuming rigid motion with isotropic temperature factors. The non-hydrogen atoms of the minor part of the disordered tert-butyl group and the solvent methanol molecule in I were refined with isotropic temperature factors. The atoms of the photoproduced 1-cyanoethyl group of I′ were also refined with isotropic temperature factors. The 2-cyanoethyl and SAP groups of I, II, and II′ are disordered. Refinement of the disordered atoms of the 2-cyanoethyl group and the minor part of the SAP group in II and II′ was performed with isotropic temperature factors.| I | I′ | II | II′ | III | III′ | |
|---|---|---|---|---|---|---|
| Formula | C31H44CoN7O5 CH3OH | C31H44CoN7O5 | C24H30CoN7O6 | |||
| Formula weight | 685.70 | 653.66 | 571.48 | |||
| Crystal system | Monoclinic | Triclinic | Monoclinic | |||
| Space group | P21/n |
P![[1 with combining macron]](https://www.rsc.org/images/entities/char_0031_0304.gif) |
P21/n | |||
| a (Å) | 9.2160(3) | 9.1680(6) | 8.8800(5) | 8.9000(8) | 17.2111(5) | 17.0830(6) |
| b (Å) | 26.7340(10) | 26.964(2) | 12.2000(8) | 12.2160(12) | 7.5620(2) | 7.6330(3) |
| c (Å) | 13.9320(5) | 14.0240(11) | 16.6870(11) | 16.8180(15) | 21.4770(5) | 21.5270(8) |
| α (°) | 90 | 90 | 109.096(2) | 109.239(3) | 90 | 90 |
| β (°) | 96.9100(10) | 97.328(2) | 95.643(2) | 94.666(3) | 107.5550(10) | 108.7110(10) |
| γ (°) | 90 | 90 | 103.792(2) | 104.585(3) | 90 | 90 |
| Volume (Å3) | 3408.8(2) | 3438.5(4) | 1628.16(18) | 1643.5(3) | 2665.04(12) | 2658.65(17) |
| Z | 4 | 2 | 4 | |||
| D calcd (Mg m−3) | 1.336 | 1.325 | 1.333 | 1.321 | 1.424 | 1.428 |
| Absorp. coeff. (mm−1) | 0.556 | 0.551 | 0.577 | 0.571 | 0.696 | 0.698 |
| F(000) | 1456 | 692 | 1192 | |||
| Crystal size (mm3) | 0.09 × 0.08 × 0.06 | 0.11 × 0.10 × 0.01 | 0.36 × 0.13 × 0.10 | |||
| Theta range (°) | 3.04–27.48 | 3.02–27.47 | 3.21–27.42 | 3.27–27.48 | 3.01–27.45 | 3.24–27.47 |
| Index ranges | −11 ≦ h ≦ 11 | −10 ≦ h ≦ 11 | −11 ≦ h ≦ 11 | −11 ≦ h ≦ 11 | −22 ≦ h ≦ 22 | −21 ≦ h ≦ 22 |
| −34 ≦ k ≦ 34 | −34 ≦ k ≦ 31 | −15 ≦ k ≦ 15 | −15 ≦ k ≦ 15 | −7 ≦ k ≦ 9 | −9 ≦ k ≦ 9 | |
| −18 ≦ l ≦ 17 | −17 ≦ l ≦ 18 | −21 ≦ l ≦ 21 | −20 ≦ l ≦ 21 | −27 ≦ l ≦ 27 | −27 ≦ l ≦ 27 | |
| Reflection collected | 51![[thin space (1/6-em)]](https://www.rsc.org/images/entities/char_2009.gif) 146 146 |
30![[thin space (1/6-em)]](https://www.rsc.org/images/entities/char_2009.gif) 650 650 |
16![[thin space (1/6-em)]](https://www.rsc.org/images/entities/char_2009.gif) 072 072 |
16![[thin space (1/6-em)]](https://www.rsc.org/images/entities/char_2009.gif) 059 059 |
24![[thin space (1/6-em)]](https://www.rsc.org/images/entities/char_2009.gif) 072 072 |
25![[thin space (1/6-em)]](https://www.rsc.org/images/entities/char_2009.gif) 059 059 |
| Independent reflections and R(int) | 7797 | 7531 | 7365 | 7371 | 6055 | 6059 |
| 0.0988 | 0.0981 | 0.0608 | 0.0948 | 0.0347 | 0.0375 | |
| Completeness (%) | 98.8 | 95.7 | 99.1 | 97.7 | 99.5 | 99.4 |
| Max. and min. transmission | 0.9674 | 0.9677 | 0.9943 | 0.9943 | 0.9337 | 0.9335 |
| 0.6530 | 0.6532 | 0.7918 | 0.7918 | 0.6807 | 0.4659 | |
| Data/restraints/parameters | 7797/2/433 | 7531/3/451 | 7365/3/507 | 7371/4/476 | 6055/0/351 | 6059/9/363 |
| Goodness-of-fit on F2 | 1.069 | 1.062 | 1.023 | 1.055 | 1.086 | 1.099 |
| Final R indices [I > 2σ(I)] | R 1 = 0.0854 | R 1 = 0.0839 | R 1 = 0.0569 | R 1 = 0.0773 | R 1 = 0.0376 | R 1 = 0.0491 |
| wR2 = 0.1948 | wR2 = 0.1600 | wR2 = 0.1153 | wR2 = 0.1688 | wR2 = 0.0987 | wR2 = 0.1228 | |
| R indices (all data) | R 1 = 0.1208 | R 1 = 0.1530 | R 1 = 0.1029 | R 1 = 0.1865 | R 1 = 0.0450 | R 1 = 0.0590 |
| wR2 = 0.2107 | wR2 = 0.1922 | wR2 = 0.1328 | wR2 = 0.2183 | wR2 = 0.1017 | wR2 = 0.1288 | |
| Largest diff. peak and hole (e Å−3) | 1.035 | 0.611 | 0.566 | 0.676 | 0.795 | 0.607 |
| −0.740 | −0.629 | −0.397 | −0.692 | −0.348 | −0.319 | |
| IV | V | |
|---|---|---|
| Formula | C23H27ClCoN7O5 | C23H27BrCoN7O5 |
| Formula weight | 575.90 | 620.36 |
| Crystal system | Monoclinic | Triclinic |
| Space group | P21 |
P![[1 with combining macron]](https://www.rsc.org/images/entities/char_0031_0304.gif) |
| a (Å) | 7.9620(7) | 8.4010(5) |
| b (Å) | 8.4070(6) | 13.0930(9) |
| c (Å) | 18.8990(14) | 13.7750(10) |
| α (°) | 90 | 63.746(2) |
| β (°) | 94.566(2) | 89.633(2) |
| γ (°) | 90 | 75.599(2) |
| Volume (Å3) | 126.02(17) | 1306.78(15) |
| Z | 2 | 2 |
| Density calculated | 1.517 | 1.577 |
| Absorption coeff. (mm−1) | 0.836 | 2.233 |
| F(000) | 596 | 632 |
| Crystal size (mm3) | 0.13 × 0.09 × 0.04 | 0.14 × 0.09 × 0.05 |
| Theta range (°) | 3.22–27.42 | 3.18–27.42 |
| Index ranges (°) | −10 ≦ h ≦ 10 | −10 ≦ h ≦ 10 |
| −9 ≦ k ≦ 10 | −15 ≦ k ≦ 16 | |
| −24 ≦ l ≦ 24 | −17 ≦ l ≦ 17 | |
| Reflection collected | 12![[thin space (1/6-em)]](https://www.rsc.org/images/entities/char_2009.gif) 560 560 |
12![[thin space (1/6-em)]](https://www.rsc.org/images/entities/char_2009.gif) 892 892 |
| Independent reflections and R(int) | 5130 | 5881 |
| 0.1063 | 0.0740 | |
| Completeness (%) | 99.7 | 99.1 |
| Max. and min. transmission | 0.9673 | 0.8965 |
| 0.5285 | 0.4552 | |
| Data/restraints/parameters | 5130/1/334 | 5881/0/331 |
| Goodness-of-fit on F2 | 1.069 | 1.134 |
| Final R indices [I > 2σ(I)] | R 1 = 0.0639 | R 1 = 0.0533 |
| wR2 = 0.1209 | wR2 = 0.1151 | |
| Final R indices (all data) | R 1 = 0.1306 | R 1 = 0.1276 |
| wR2 = 0.1644 | wR2 = 0.1605 | |
| Largest diff. peak and hole (e Å−3) | 0.947 | 1.104 |
| −0.919 | −1.261 | |
| Absolute structure parameter | 0.03(3) | — |
Results and discussion
Crystal and molecular structures of I and I′
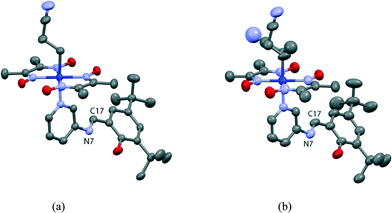
The crystal structure of I viewed along the a axis is shown in Fig. 8. There is a solvent methanol molecule in the crystal structure. The molecular structure is shown in Fig. 9(a). The 2-cyanoethyl group has a perpendicular conformation, which means that the conformation around the Co–C9–C10–C11 bond is trans. The N-salicylidene-3-aminopyridine moiety as a whole is nonplanar, but the salicylidene and 3-aminopyridine groups are planar and the dihedral angle between the two planes is 47.8(2)°. One of the two tert-butyl groups is disordered, and the occupancy ratio is 82![[thin space (1/6-em)]](https://www.rsc.org/images/entities/char_2009.gif) :
:![[thin space (1/6-em)]](https://www.rsc.org/images/entities/char_2009.gif) 18.
18.
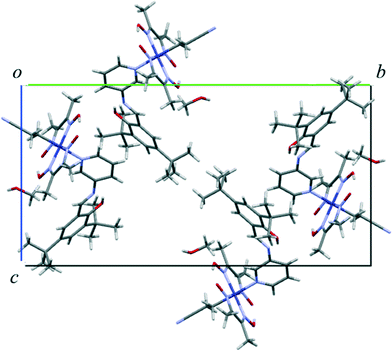 | ||
| Fig. 8 Crystal structure of I viewed down the a-axis. The minor part of the disordered tert-butyl groups is omitted for clarity. | ||
The crystal structure of I′ is essentially the same as that of I, although the unit cell volume is 29.7(2) Å3 larger. Several new peaks appear around the 2-cyanoethyl group in the difference electron density map of I′, which are assigned to atoms of the 1-cyanoethyl group. The ratio of the original 2-cyanoethyl group to the produced 1-cyanoethyl group is 58![[thin space (1/6-em)]](https://www.rsc.org/images/entities/char_2009.gif) :
:![[thin space (1/6-em)]](https://www.rsc.org/images/entities/char_2009.gif) 42. The configuration of the 1-cyanoethyl group is limited to R or S in an asymmetric unit, as shown in Fig. 9(b). The dihedral angle between the salicylidene moiety and the 3-aminopyridine group is 45.8(3)°, which is similar to the original angle. The ratio of the disordered tert-butyl group changes to 71
42. The configuration of the 1-cyanoethyl group is limited to R or S in an asymmetric unit, as shown in Fig. 9(b). The dihedral angle between the salicylidene moiety and the 3-aminopyridine group is 45.8(3)°, which is similar to the original angle. The ratio of the disordered tert-butyl group changes to 71![[thin space (1/6-em)]](https://www.rsc.org/images/entities/char_2009.gif) :
:![[thin space (1/6-em)]](https://www.rsc.org/images/entities/char_2009.gif) 29 and the occupancy factor of the solvent methanol molecule significantly decreases.
29 and the occupancy factor of the solvent methanol molecule significantly decreases.
Crystal and molecular structures of II and II′
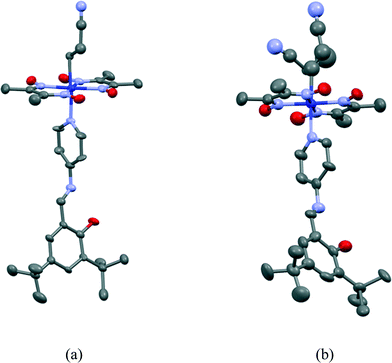
The 2-cyanoethyl and SAP groups in the crystal structure of II are disordered, as shown in Fig. 10(a). The 2-cyanoethyl group has a perpendicular conformation. The ratios of the major and minor components of the 2-cyanoethyl and SAP groups are 61![[thin space (1/6-em)]](https://www.rsc.org/images/entities/char_2009.gif) :
:![[thin space (1/6-em)]](https://www.rsc.org/images/entities/char_2009.gif) 49 and 69
49 and 69![[thin space (1/6-em)]](https://www.rsc.org/images/entities/char_2009.gif) :
:![[thin space (1/6-em)]](https://www.rsc.org/images/entities/char_2009.gif) 31, respectively. Because the two groups are in close contact in the crystal structure, both groups may be disordered. The dihedral angles between the salicylidene and 3-aminopyridine groups are 88.6(5)° and 77.1(11)° for the major and minor parts of the SAP moiety, respectively.
31, respectively. Because the two groups are in close contact in the crystal structure, both groups may be disordered. The dihedral angles between the salicylidene and 3-aminopyridine groups are 88.6(5)° and 77.1(11)° for the major and minor parts of the SAP moiety, respectively.
The crystal structure of II′ is essentially the same as that of II, although the unit-cell volume of II′ is 15.3(2) Å3 larger than that of II. The 2-cyanoethyl group partly changes to the 1-cyanoethyl group. The molecular structure of II′ is shown in Fig. 10(b). The ratio of the original 2-cyanoethyl group to the photoproduced 1-cyanoethyl group is 53![[thin space (1/6-em)]](https://www.rsc.org/images/entities/char_2009.gif) :
:![[thin space (1/6-em)]](https://www.rsc.org/images/entities/char_2009.gif) 47. The configuration of the produced 1-cyanoethyl group is only R or S in an asymmetric unit. The SAP group is also disordered, and the ratio is 69
47. The configuration of the produced 1-cyanoethyl group is only R or S in an asymmetric unit. The SAP group is also disordered, and the ratio is 69![[thin space (1/6-em)]](https://www.rsc.org/images/entities/char_2009.gif) :
:![[thin space (1/6-em)]](https://www.rsc.org/images/entities/char_2009.gif) 31, which is the same as that of II. The dihedral angles between the salicylidene and 3-aminopyridine groups are 85.3(7)° and 71.3(14)° for the major and minor parts, respectively, which are similar to the corresponding angles of II.
31, which is the same as that of II. The dihedral angles between the salicylidene and 3-aminopyridine groups are 85.3(7)° and 71.3(14)° for the major and minor parts, respectively, which are similar to the corresponding angles of II.
Crystal and molecular structures of III and III′
The 2-cyanoethyl and SAP groups in the crystal structure of III are ordered. The molecular structure of III is shown in Fig. 11(a). The 2-cyanoethyl group has a parallel conformation, which means that the conformation around the Co–C9–C10–C11 bond is gauche. There is no short contact between the nitrogen atom of the 2-cyanoethyl group and the N–H group of the salicylidene group. The N–H⋯N distance is 3.746 or 3.887 Å, which is too long for a weak hydrogen bond.21 The dihedral angle between the salicylidene and 3-aminopyridine groups is 32.50(9)°.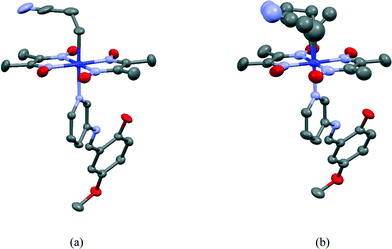 | ||
| Fig. 11 Molecular structures of III before (a) and after (b) visible light irradiation. Hydrogen atoms are omitted for clarity. The thermal ellipsoids of atoms are drawn at the 50% probability level. | ||
The crystal structure of III′ is essentially the same as that of III, although the unit-cell volume of III′ is 6.4(2) Å3 less than that of III. The 2-cyanoethyl group partly changes to the 1-cyanoethyl group. The molecular structure of III′ is shown in Fig. 11(b). The occupancy factor of the original 2-cyanoethyl group became ca. 0.5. The photoproduced 1-cyanoethyl group takes a disordered structure with the R and S configurations with a ratio of 3![[thin space (1/6-em)]](https://www.rsc.org/images/entities/char_2009.gif) :
:![[thin space (1/6-em)]](https://www.rsc.org/images/entities/char_2009.gif) 2 in an asymmetric unit. No intermolecular hydrogen bonds are formed for the R and S configurations. The dihedral angle between the salicylidene and 3-aminopyridine groups is 35.90(12)°, which is almost the same as the corresponding angle of III.
2 in an asymmetric unit. No intermolecular hydrogen bonds are formed for the R and S configurations. The dihedral angle between the salicylidene and 3-aminopyridine groups is 35.90(12)°, which is almost the same as the corresponding angle of III.
Color fading rates before and after 2–1 isomerization
As shown in Fig. 5 and 6(a) and (b), the lifetimes before and after 2–1 photoisomerization are significantly different, and they are summarized in Table 3. For example, for the powdered sample of I, the lifetime of the colored species before 2–1 isomerization is 96 min, but the lifetime gradually decreases on exposure to visible light and the lifetime is 28 min after irradiation with visible light for 15 min. This clearly indicates that the structural change from the 2-cyanoethyl group to the 1-cyanoethyl group decreases the lifetime of the colored species of the SAP molecule coordinated to the cobalt atom from the opposite side of the cobaloxime plane.| I | II | III | |||
|---|---|---|---|---|---|
| Irradiation time/min | Life time/min | Irradiation time/min | Life time/min | Irradiation time/min | Life time/min |
| 0 | 96 | 0 | 10 | 0 | 143 |
| 4 | 45 | 20 | 20 | 5 | 47 |
| 15 | 28 | 35 | 49 | 10 | 26 |
For the powdered sample of II, the lifetime of the colored species before 2–1 isomerization is 10 min, but it increases to 49 min after the sample was irradiated with visible light for 35 min. The lifetime of the colored species of III gradually decrease from 143 min before 2–1 isomerization to 26 min after photoirradiation for 10 min.
Assumed structure of the trans-keto form
When single crystals of I and II were irradiated with visible light, the unit-cell volumes increased by 29.7(2) and 15.3(2) Å3 at 173 K, respectively. In contrast, the unit-cell volume of III decreased by 6.4(2) Å3 at 173 K. Because the lifetime of colored species strongly depends on the void space in the crystal, it should follow the volume change of the unit cell. However, the unit-cell volume of III decreased after 2–1 isomerization, but the lifetime greatly decreased. Therefore, the change of the unit-cell volume has no correlation with the lifetime.The above results may indicate that intermolecular interactions around the reactive site are the most important factor for the lifetime of the colored species. The structure of the colored species of N-3,5-di-tert-butylsalicylideneaniline was successfully analyzed using two-photon excitation. The original cis-enol form transformed to the trans-keto form, as shown in Fig. 12(a). It has been proposed that this transformation should occur through pedal motion of the salicylideneaniline moiety around the central N1–C7 bond.22 The C4 and C10 atoms occupy nearly the same positions in pedal motion as shown in Fig. 12(b). This means that the void space around the central –N1(H)–C7(H)– group should play an important role in the cis-enol to trans-keto reaction and its back reaction.
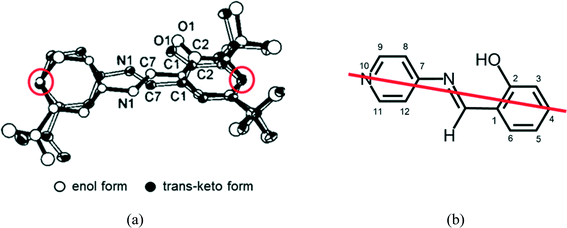 | ||
| Fig. 12 (a) Observed structure of the trans-keto form of SA,6 and (b) the model structure of the trans-keto form of SAP, assuming that the pedal motion occurs keeping the carbon atom 4 and the nitrogen atom 10 in the same positions. | ||
Size and shape of the cavity of the trans-keto form
To estimate the void spaces around the active sites, the volumes of the cavities around the central –N1(H)–C7(H)– groups of the trans-keto forms of I, I′, II, II′, III, and III′ were calculated, assuming that the produced trans-keto form has the same relative position as the cis-enol form observed in each structure. The volumes of the cavities for the trans-keto forms of I and I′ are calculated in the same way as those proposed previously11 and the similar figures of the cavities are drawn in the previous paper.17 The cavity volumes are 4.1 and 4.5 Å3 for I and I′, respectively. The increase in the cavity volume after irradiation suggests a shorter lifetime after 2–1 isomerization than before isomerization, which is consistent with the observed lifetime of I.For the crystal structures of II and II′, the cavities around the –N1(H)–C7(H)– groups of the assumed trans-keto forms were calculated. Because the SAP moieties are disordered in II and II′, only the major conformation was taken into account. However, similar results were obtained for the minor conformation. The cavity volumes of II and II′ were calculated to be 2.5 and 2.2 Å3, respectively. These values explain why the lifetime of II′ (49 min after UV irradiation for 35 min) is significantly longer than that of II (10 min).
Conformation effect
For the crystal structures of III and III′, the cavities around the –N1(H)–C7(H)– groups of the assumed trans-keto forms were calculated. The 2-cyanoethyl group in III transformed to the 1-cyanoethyl group with R and S configurations in III′, and the R/S ratio is 29![[thin space (1/6-em)]](https://www.rsc.org/images/entities/char_2009.gif) :
:![[thin space (1/6-em)]](https://www.rsc.org/images/entities/char_2009.gif) 20. The cavity volume for the assumed trans-keto form of III is 3.0 Å3. The corresponding cavity volumes of III′ are 2.5 and 2.6 Å3 for the R and S configurations, respectively. This suggests that the lifetime of the trans-keto form of III′ should be longer than that of III. However, the lifetimes observed in the experiment were 143 min before irradiation and 26 min after 2–1 isomerization, respectively.
20. The cavity volume for the assumed trans-keto form of III is 3.0 Å3. The corresponding cavity volumes of III′ are 2.5 and 2.6 Å3 for the R and S configurations, respectively. This suggests that the lifetime of the trans-keto form of III′ should be longer than that of III. However, the lifetimes observed in the experiment were 143 min before irradiation and 26 min after 2–1 isomerization, respectively.
The above results indicate that another factor should be taken into account. In the crystal structure of III, there are no effective intermolecular hydrogen bonds. The parallel conformation of the 2-cyanoethyl group may have some influence on the rate of the back reaction. Further experiments should be necessary for the parallel conformation.
Structure of photochromic SAP
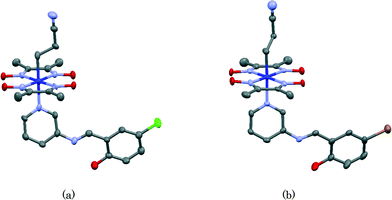
It should be clarified why crystals of IV and V show no photochromism. It has been proposed that salicylideneaniline shows no photochromism if the dihedral angle between the salicylidene and aniline planes is less than 20°. If the dihedral angle is greater than 30°, it shows photochromism. If the dihedral angle is between 20° and 30°, it depends on the crystal structure.23 The molecular structures of IV and V are shown in Fig. 13(a) and (b), respectively. The dihedral angles between the planes of the salicylidene moiety and the 3-aminopyridine group are 21.8(4)° and 18.1(3)° for IV and V, respectively. These values indicate that crystals of IV and V show no photochromism. Conversely, the corresponding dihedral angles of I, II, and III are 47.8(2)°, 88.6(5)° (major part) and 77.1(11)° (minor part), and 35.90(12)°, respectively. This is a reason why crystals of I, II, and III are photochromic, whereas crystals of IV and V are non-photochromic. It must be emphasized that although each SAP moiety in the former crystals is coordinated to the cobalt atom of the bulky cobaloxime moiety, it shows a considerably large dihedral angle and therefore the photochromic behavior is conserved.This work was partly supported by a Grant-in-Aid for Scientific Research in Priority Areas “New Frontiers in Photochromism (no. 471)” given to A. S. by the Ministry of Education, Culture, Sports, Science and Technology (MEXT), Japan. We thank Mr. Yuta Yamazaki for his useful assistance.
References
- H. Dürr and H. Bouas-Laurent, Photochromism: Molecules and Systems, Elsevier, Amsterdam, 2003 Search PubMed.
- J. C. Crano and R. J. Guglielmetti, Organic Photochromic and Thermochromic Compounds, vol. 1 and 2, Plenum Press, 1999 Search PubMed.
- M. Irie, Chem. Rev., 2000, 100, 1685–1716 CrossRef CAS PubMed.
- M. Irie, Bull. Chem. Soc. Jpn., 2008, 81, 917–926 CrossRef CAS.
- A. Senier and F. G. J. Shepheard, J. Chem. Soc., Trans., 1909, 95, 1943–1955 RSC.
- J. Harada, H. Uekusa and Y. Ohashi, J. Am. Chem. Soc., 1999, 121, 5809–5810 CrossRef CAS.
- M. Mikami and S. Nakamura, Phys. Rev. B: Condens. Matter Mater. Phys., 2004, 69, 134205 CrossRef.
- K. Johmoto, A. Sekine, H. Uekusa and Y. Ohashi, Bull. Chem. Soc. Jpn., 2009, 82, 50–57 CrossRef CAS.
- J. Han, M. Maekawa, Y. Suenaga, H. Ebisu, A. Nabei, T. Kuroda-Sowa and M. Munakata, Inorg. Chem., 2007, 46, 3313–3321 CrossRef CAS PubMed.
- Y. Ohashi and Y. Sasada, Nature, 1977, 267, 142–144 CrossRef CAS PubMed.
- Y. Ohashi, K. Yanagi, T. Kurihara, Y. Sasada and Y. Ohgo, J. Am. Chem. Soc., 1981, 103, 5805–5812 CrossRef CAS.
- Y. Ohashi, Acc. Chem. Res., 1998, 21, 268–274 CrossRef.
- A. Sekine, H. Tatsuki and Y. Ohashi, J. Organomet. Chem., 1997, 536–537, 389–398 CrossRef.
- A. Sekine and Y. Ohashi, Bull. Chem. Soc. Jpn., 1991, 64, 2183–2187 CrossRef CAS.
- A. Sekine, H. Yamagiwa and H. Uekusa, Chem. Lett., 2012, 41, 795–797 CrossRef CAS.
- H. Yamagiwa and A. Sekine, Bull. Chem. Soc. Jpn., 2013, 86, 1028–1034 CrossRef CAS.
- Y. Yamazaki, A. Sekine and H. Uekusa, Cryst. Growth Des. Search PubMed submitted.
- G. M. Sheldrick, Acta Crystallogr., Sect. A: Found. Crystallogr., 2008, 64, 112–122 CrossRef CAS PubMed.
- M. C. Burla, R. Caliandro, M. Camalli, B. Carrozzini, G. L. Cascarano, C. Giacovazzo, M. Mallamo, A. Mazzone, G. Polidori and R. Spagna, J. Appl. Crystallogr., 2012, 45, 357–361 CrossRef CAS.
- G. M. Sheldrick, Acta Crystallogr., Sect. A: Found. Adv., 2015, 71, 3–8 CrossRef PubMed.
- G. R. Desiraju and T. Steiner, The Weak Hydrogen Bond in Structural Chemistry and Biology, Oxford University Press, New York, 1999 Search PubMed.
- K. Ogawa, T. Sano, S. Yoshimura, Y. Takeuchi and K. Toriumi, J. Am. Chem. Soc., 1992, 114, 1041–1051 CrossRef CAS.
- K. Johmoto, T. Ishida, A. Sekine, H. Uekusa and Y. Ohashi, Acta Crystallogr., Sect. B: Struct. Sci., Cryst. Eng. Mater., 2012, 68, 297–304 CrossRef CAS PubMed.
Footnote |
| † The crystallographic data has been deposited with the Cambridge Crystallographic Data Centre: Deposition numbers CCDC 1476087–1476094 for I–V and I′–III′. For crystallographic data in CIF or other electronic format see DOI: 10.1039/c6ce01005a |
| This journal is © The Royal Society of Chemistry 2016 |


