
Performance comparison of two cascade reaction models in fluorescence off–on detection of hydrogen sulfide†
Tanmoy Saha,
Dnyaneshwar Kand and
Pinaki Talukdar*
Department of Chemistry, Indian Institute of Science Education and Research, Pune, India. E-mail: ptalukdar@iiserpune.ac.in; Fax: +91 20 2590 8186; Tel: +91 20 2590 8098
First published on 24th November 2014
Abstract
Comparative studies on the performances of two cascade reaction based fluorescent H2S probes are reported. These probes were also designed to address the solubility issues of existing probes. The Reso-N3 probe favors the H2S mediated azide-to-amine reduction followed by a cyclization to release the resorufin fluorophore. Reso-Br undergoes a bromide-to-thiol nucleophilic substitution followed by a similar cyclization releasing the same fluorophore. Reso-N3 exhibited lower background fluorescence and better H2S sensing behavior in water compared to Reso-Br. Reso-Br underwent hydrolysis in aqueous buffer conditions (pH = 7.4) while, Reso-N3 was quite stable. Reso-N3 displayed high selectivity and sensitivity towards H2S. Live cell imaging of the species by the probe was also established.
Introduction
Hydrogen sulfide (H2S) is a colorless, toxic, inflammable, corrosive gas, and it is produced mainly from geological and microbial activities.1,2 The species has a characteristic smell of rotten eggs and its detectability threshold by a healthy human nose ranges from 0.005–0.3 ppm. This gaseous species when exposed or inhaled in excess, can cause respiratory failure, loss of consciousness, sudden cardiac death, hepatic2 and olfactory paralysis. Endogenously, H2S can be produced during metabolism of cysteine (Cys) catalyzed by two pyridoxal 5′-phosphate dependent enzymes i.e. cystathionine-β-synthase (CBS),3 and cystathionine-γ-layse (CSE)4 and one pyridoxal 5′-phosphate independent enzyme i.e. 3-Mercaptopyruvate sulfurtransferase (3-MST).5 3-MST is a mitochondrial and cytosolic enzyme (found in brain tissues)6 whereas CBS and CSE are exclusively cytosolic (found in liver and brain tissues). Although, H2S has been viewed primarily as a noxious chemical species, recent studies have established its significance as the third most essential gasotransmitter (after NO and CO)6–8 which controls various physiological processes in nervous, respiratory, endocrine and immune systems.6,7 It also dilates blood vessels and lowers blood pressure by acting as a smooth muscle reluctant and K-ATP channel opener. Furthermore, the effects of H2S in gastrointestinal insulin signalling and as a regulator of energy production in mammalian cells under stress condition are also known.9 In recent times, H2S releasing prodrugs are used for treatments of cardiovascular, reperfusion injury and inflammatory diseases.10,11 Overexpression of H2S producing enzymes12,13 is related to various diseases e.g. Alzheimer's disease,14 Down's syndrome,15 diabetes,16 and liver cirrhosis.17Because of the increasing interest in H2S research, proper understanding of its production, mode of action and consumption is very essential. However, its optimal level in biological systems is debatable, as the concentration varies in the range over 105 orders.18 Very short half-life of the species is a critical limitation for its accurate determination. Therefore, reliable and accurate determination methods for H2S sensing in biological samples have appeared as burgeoning interests to acquire better knowledge of physiological and pathological functions. Several fluorescent probes were reported for in vitro as well as in vivo detection of the species. These probes were designed to accomplish rapid response, selectivity and sensitivity towards H2S. These strategies include: (a) H2S mediated reduction of azide to amine,19–29 (b) H2S trapping by nucleophilic addition,30–34 (c) copper sulfide precipitation,35–37 and (d) thiolysis of dinitrophenyl ether.38 Among these, the azide reduction strategy has been extensively applied in numerous fluorescent probes. H2S (pKa = 6.9) is a better nucleophile32 compared to other biothiols such as Cysteine (Cys, pKa = 8.4) and glutathione (GSH, pKa = 9.7).39 Moreover, H2S also exhibits dual nucleophilic character which discriminates it from other biothiols.40 These features of H2S were helpful in the design of various cascade reaction based probes. In 2011, Xian and co-workers reported fluorescence off–on probes based on cascade reaction demonstrating the selective and sensitive detection of H2S.33,34
The first strategy incorporating H2S mediated azide-to-amine reduction, in cascade reaction model was reported by Han et al.41 Based on their design, the probe 1 (Fig. 1A) upon reduction of the azide group facilitated an intramolecular cyclization to release a fluorescent coumarin derivative (Fig. 1B, route a). However, use of organic co-solvent (acetonitrile 20% v/v), long response time (20–40 min), low sensitivity, high detection limit (100 μM) and blue emission of the coumarin fluorophore limits its further biological applications. Guo and co-workers reported an alternate cascade reaction based probe 2 (Fig. 1A) which works via nucleophilic substitution of iodide by H2S, leading to a cyclization and release of fluorescein (Fig. 1B, route b). This strategy partially addressed the limitation related to blue-shifted emission in the probe 1.42 Although, the probe 2 displayed a faster response time (5 min) and a lower detection limit (0.1 μM) compared to 1, the sensitivity of the probe was not significant (50-fold) compared to other existing probes. The use of high concentration of a surfactant (20 mM cetrimonium bromide [CTAB]) in sensing studies limits its applicability in biological systems.43
 | ||
| Fig. 1 Structures of the reported probes 1–2 and proposed probes Reso-N3 and Reso-Br (A). Cascade reaction based strategies for H2S sensing (B). | ||
The use of dissimilar fluorophores in these probes also impedes the comparison of two cascade reaction mechanisms because; physicochemical property of the probe is largely influenced by the nature of fluorophore. Therefore, introduction of an identical fluorophore was proposed to minimize structural differences and establish a better comparison between two aforementioned reaction mechanisms. Herein, we report design, synthesis and H2S sensing abilities of two probes Reso-N3 and Reso-Br (Fig. 1A) to carry out a performance comparison of two cascade reaction models. Resorufin was selected as a fluorophore owing to its excellent chromogenic and fluorogenic properties.44–51 Photophysical properties in the visible region, water solubility and excellent biocompatibility have already established the significance of resorufin in the development of fluorescence probes with in vitro and in vivo applications. Quenched fluorescence states for these probes was rationalized easily because, esterification of the hydroxyl group at C7-position of resorufin is known to provide non-fluorescent species.47
Results and discussion
Addressing water solubility of Reso-N3 and Reso-Br
To ensure the water solubility and cell membrane permeation of the designed probes, Reso-N3 and Reso-Br, respective C![[thin space (1/6-em)]](https://www.rsc.org/images/entities/char_2009.gif) logP (the logarithm of the partition coefficient between water and 1-octanol) values were predicted using ChemBioDraw 14.0 program and values were also compared with those of probes 1 and 2. The program provided ClogP = 4.54, 4.21, 4.93 and 6.48 for Reso-N3, Reso-Br, 1 and 2, respectively (Fig. S1†). Considering the Lipinski's rule of five,52,53 the Reso-N3 and Reso-Br probes were expected to be more appropriate for sensing H2S in the water and better cell permeable over probes 1 and 2. The bromo leaving group in Reso-Br instead of an iodo was considered because the manipulation provides improved ClogP value compared to the corresponding iodo derivative (Fig. S1†).
logP (the logarithm of the partition coefficient between water and 1-octanol) values were predicted using ChemBioDraw 14.0 program and values were also compared with those of probes 1 and 2. The program provided ClogP = 4.54, 4.21, 4.93 and 6.48 for Reso-N3, Reso-Br, 1 and 2, respectively (Fig. S1†). Considering the Lipinski's rule of five,52,53 the Reso-N3 and Reso-Br probes were expected to be more appropriate for sensing H2S in the water and better cell permeable over probes 1 and 2. The bromo leaving group in Reso-Br instead of an iodo was considered because the manipulation provides improved ClogP value compared to the corresponding iodo derivative (Fig. S1†).
Synthesis of Reso-N3 and Reso-Br
Synthesis of Reso-N3 and Reso-Br were carried out from acids 6 and 9, respectively. Prior to the synthesis of Reso-N3, ester 5 was converted to the acid 6 via the sequential benzylic bromination, nucleophilic substitution of bromide by azide and ester hydrolysis.54,55 Acid 6 was then converted to acid chloride which was further treated with 7 to furnish Reso-N3 (54%) as red solid. Pthalide 8 was first converted to acid 9 following a reported protocol.56 Compound 9 was treated further with SOCl2 followed by addition of resorufin 7 to obtain Reso-Br as red solid (51%) (Scheme 1).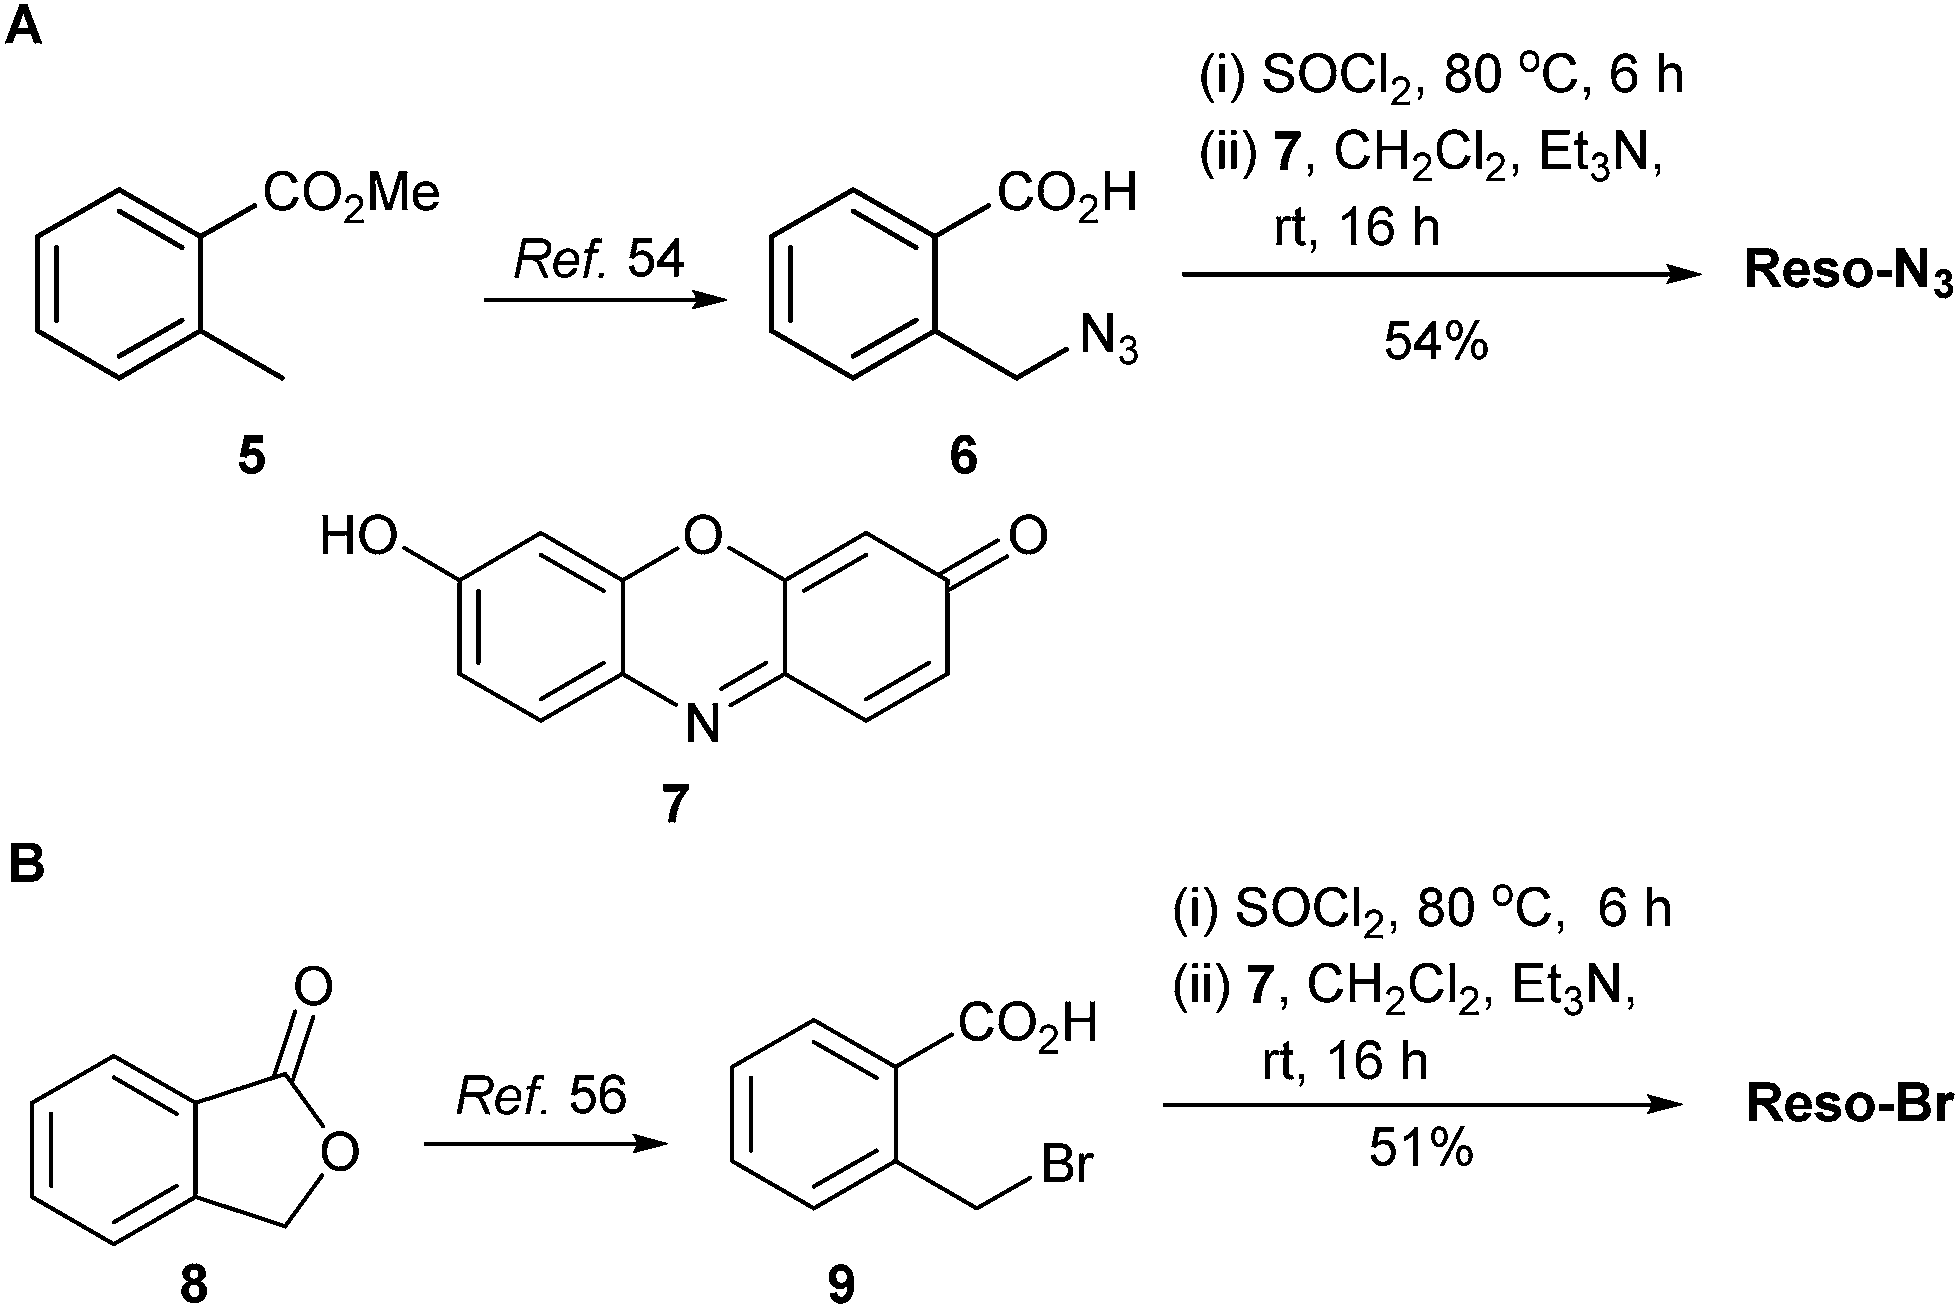 | ||
| Scheme 1 Synthesis of Reso-N3 (A) and Reso-Br (B). | ||
Comparison of photophysical properties between Reso-N3 and Reso-Br
After synthesizing Reso-N3 and Reso-Br, their background fluorescence properties were compared. Based on dynamic light scattering (DLS) studies, both probes (0–100 μM) were confirmed to be soluble in water. Therefore, photophysical properties and H2S sensing properties of these probes were determined in water. UV-visible spectrum of Reso-N3 (10 μM) in water (Fig. 2A) exhibited weaker absorption signals at 318 nm (ε = 2400 M−1 cm−1), 344 nm (ε = 2000 M−1 cm−1) and 419 nm (ε = 1100 M−1 cm−1). On the other hand, Reso-Br (10 μM) exhibited absorption maxima at λmax = 364 nm (ε = 9000 M−1 cm−1) and a less intense peak at 443 nm. When fluorescence intensities were monitored at λ = 585 nm (λex = 540 nm), probe Reso-N3 displayed 0.17 times lower background fluorescence compared to probe Reso-Br (Fig. 2B). Therefore, Reso-N3 was expected to exhibit better off–on response during sensing of H2S compared to Reso-Br because, both probes are identical fluorophore releasers. | ||
| Fig. 2 UV-visible spectra of Reso-N3 and Reso-Br (10 μM each) in water (A); comparison of fluorescence intensity at 585 nm (λex = 540 nm) of both probes (10 μM) in water (B). | ||
Kinetics of H2S sensing by Reso-N3 and Reso-Br in water
In the next stage, response times of probes Reso-N3 (10 μM) and Reso-Br (10 μM) during H2S sensing were determined under pseudo first order reaction conditions. Emission spectra (λex = 540 nm) were acquired at definite time intervals for each probe after addition of Na2S (5 mM) and fluorescence intensities at 585 nm were plotted against time. For Reso-N3, a pseudo first order reaction kinetics was observed with rate constant, k = 0.6 min−1 and half-life t1/2 = 1.2 min (Fig. 3A and S5A†). A similar kinetic profile was observed for Reso-Br with k = 0.28 min−1 and t1/2 = 2.4 min (Fig. 3B and S5B†). Sensing processes were completed within 6 min and 10 min for Reso-N3 and Reso-Br, respectively. These experiments confirm the faster response of the probe Reso-N3 compared to Reso-Br in water. Fluorescence kinetics experiments also suggest the stability and inertness of each probe, Reso-N3 and Reso-Br towards other biothiols (Fig. 3), Cys (5 mM) and GSH (5 mM). | ||
| Fig. 3 Fluorescence kinetics of probes Reso-N3 (A) and Reso-Br (B) towards H2S, Cys and GSH in water, recorded at 585 nm (λex = 540 nm). | ||
Quantitative response of Reso-N3 and Reso-Br towards H2S in water
Responses of probes Reso-N3 (10 μM) and Reso-Br (10 μM) towards H2S were evaluated by UV-visible spectroscopy. Na2S (0–5 mM) was added into the solution of each probe (10 μM), and UV-visible spectra were recorded after 10 min of each addition. For Reso-N3 probe, the changes of 318, 344 and 419 nm bands were less prominent but, the formation of a 572 nm band indicated the formation resorufin 7 during the sensing process (Fig. 4A and S2†). For Reso-Br, sharp decrease in absorption bands 364 and 443 nm was observed (Fig. 4B). The sensing of H2S by Reso-Br also resulted in the appearance of a strong band at 572 nm that corresponds to the formation of resorufin 7 (Fig. S2†). | ||
| Fig. 4 UV-Visible titration spectra of Reso-N3 (A) and Reso-Br (B) with increasing concentration of Na2S in water. | ||
Next stage, fluorometric titrations were carried out to estimate quantitative responses of probes Reso-N3 (Fig. 5A) and Reso-Br (Fig. 5B) towards H2S. Sharp enhancements in fluorescence intensities at 585 nm (λex = 540 nm) were observed when increasing concentration of Na2S (0 to 5 mM) was added to each probe in the water. Reso-N3 exhibited 614-fold fluorescence enhancement, which is significantly better than 414-fold jump determined for Reso-Br (Fig. S4†). The limit of detection (LOD) for H2S sensing by Reso-N3 was 440 nM (Fig. S7A and Table S1†). The outcome was slightly better than the LOD = 550 nM calculated for Reso-Br (Fig. S7B and Table S2†).
 | ||
| Fig. 5 Fluorescence titration spectra of Reso-N3 (A) and Reso-Br (B) with Na2S in water. In each experiment, 10 μM of probe was treated with Na2S (0–5 mM) and fluorescence spectrum (λex = 540 nm) was recorded after 10 min of addition. | ||
Encouraged by fast response time and low LOD values of probes Reso-N3 and Reso-Br, water sample analyses were conducted to detect trace amounts of H2S (or S2−).57 As expected, no H2S was detected in the collected samples of tap water. When these water samples were spiked with a measured quantity of Na2S, quantitative responses were observed for both Reso-N3 (Fig. 6A) and Reso-Br (Fig. 6B).
 | ||
| Fig. 6 Bar diagram, representing relative fluorescence intensity enhancements at 585 nm (λex = 540 nm) for Reso-N3 (A) and Reso-Br (B) towards various tap water samples having different amount of Na2S. | ||
High sensitivity of probes Reso-N3 and Reso-Br during H2S detection led us to evaluate their specificity to the analyte in an isolated and competitive environment with other biorelevant species. Each probe (10 μM) was treated with an analyte (NaF, NaCl, NaBr, NaI, Na2SO3, Na2SO4, Na2S2O3, NaSCN, NaNO2, NaNO3, Cys, GSH and Hcy; 5 mM each), and fluorescence spectra were recorded after 10 min of addition. No significant fluorescence enhancements were observed in the case of any analyte (Fig. 7 and S8†). When Na2S was added further to each of aforementioned solutions, the observed fluorescence enhancements were similar to that of only Na2S addition. This data confirm the selectivity of each probe towards H2S. Addition of a thiol containing amino acid (either of Cys, GSH and Hcy) to each probe did not show any significant increment of fluorescence. But, further addition of Na2S to these solutions did not exhibit the expected fluorescence enhancement. These results were surprising considering the established selectivity of two cascade mechanisms towards H2S. A plausible explanation of the unanticipated results can be attributed to the Michael addition of aliphatic thiols on resorufin leading to the formation of adducts that are nonfluorescent.58
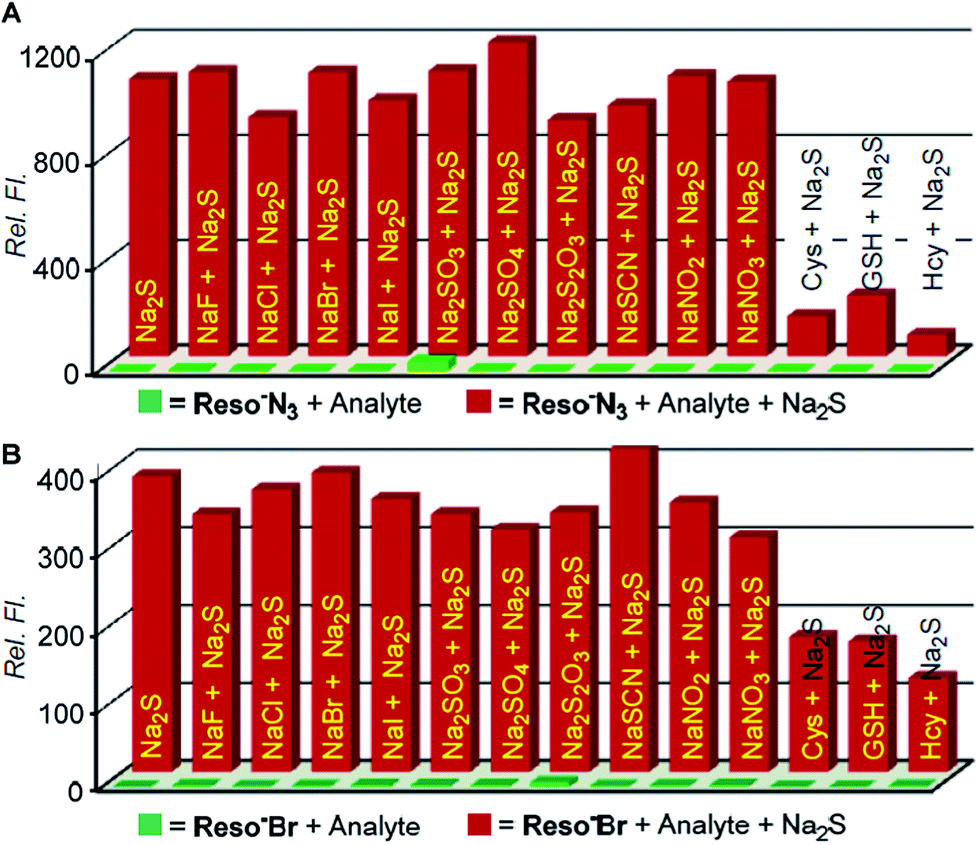 | ||
| Fig. 7 Relative fluorescence intensity enhancements at 585 nm for, (A) Reso-N3 (10 μM) and (B) Reso-Br (10 μM) towards Na2S (5 mM) in water. Front row: change in intensities in the presence of various analytes (5 mM); rear row: Na2S was added in the presence of respective analyte. | ||
The reduction-cyclization and nucleophilic substitution-cyclization mechanisms for detection of H2S by Reso-N3 and Reso-Br were further studied by 1H NMR titrations. Upon stepwise addition of Na2S to the solutions of probes, decrease of peaks corresponds to Reso-N3 (Fig. S13†) and Reso-Br (Fig. S14†) with a simultaneous appearance of new peaks corresponding to resorufin 7 was observed in both the cases.
H2S sensing properties of Reso-N3 under physiological conditions
Further assessments of these two probes were carried out under physiological conditions. Probe Reso-Br was not stable in varied aqueous buffer (pH = 7.4) conditions and resulted in the rapid release of fluorophore 7 with the time (Fig. S9 and S10†). The instability of the Reso-Br probe can be corroborated to its solvolysis under the weakly nucleophilic media59,60 followed by cyclization to release resorufin 7 (Scheme S1†). This outcome is not unanticipated for a benzyl bromide system with carboxylic ester moiety (an electron withdrawing group) at the ortho-position of aryl ring. Reso-N3 in contrast, was stable under aqueous buffer (pH = 7.4) conditions (Fig. 8B and S9†). The probe Reso-N3 (10 μM) upon reaction with Na2S (5 mM) in phosphate buffer (5 mM, pH = 7.4) exhibited a pseudo first order reaction kinetics with rate constant, k = 0.13 min−1 and t1/2 = 5.33 min (Fig. S6†). The sensing process completes within 18 min after addition of H2S (Fig. 8A). The fluorescence enhancement for Reso-N3 probe was limited to only H2S and addition of either GSH or Cys provided no significant fluorescence enhancement (Fig. 8B). | ||
| Fig. 8 Fluorescence spectra of Reso-N3 (10 μM) upon addition of Na2S (5 mM) in phosphate buffer (5 mM, pH = 7.4) recorded with increasing time (A) and corresponding fluorescence kinetics diagram (B) generated by plotting intensity at λ = 585 nm (λex = 540 nm) versus time. Stability of probe Reso-N3 in phosphate buffer (5 mM, pH = 7.4), in absence and in presence of Cys (5 mM), GSH (5 mM) are also presented. | ||
The quantitative response of Reso-N3 towards H2S was evaluated in buffer (5 mM, pH = 7.4) by UV-visible spectroscopy and fluorometric titrations. A gradual decrease in absorption maxima at 318 nm with sharp increment at 572 nm peak was observed with stepwise addition of Na2S (Fig. 9A). When fluorometric titration was carried out for Reso-N3 in phosphate buffer (5 mM, pH = 7.4), addition of Na2S results in a gradual increase in fluorescence intensity (Fig. 9B). When fluorescence intensity at 585 nm was plotted against the concentration of added Na2S an excellent linear correlation (R2 = 0.98095) was obtained (Fig. S11†). A detection limit of 4.15 μM was calculated based on signal to noise ratio, S/N = 3 (Table S3†).
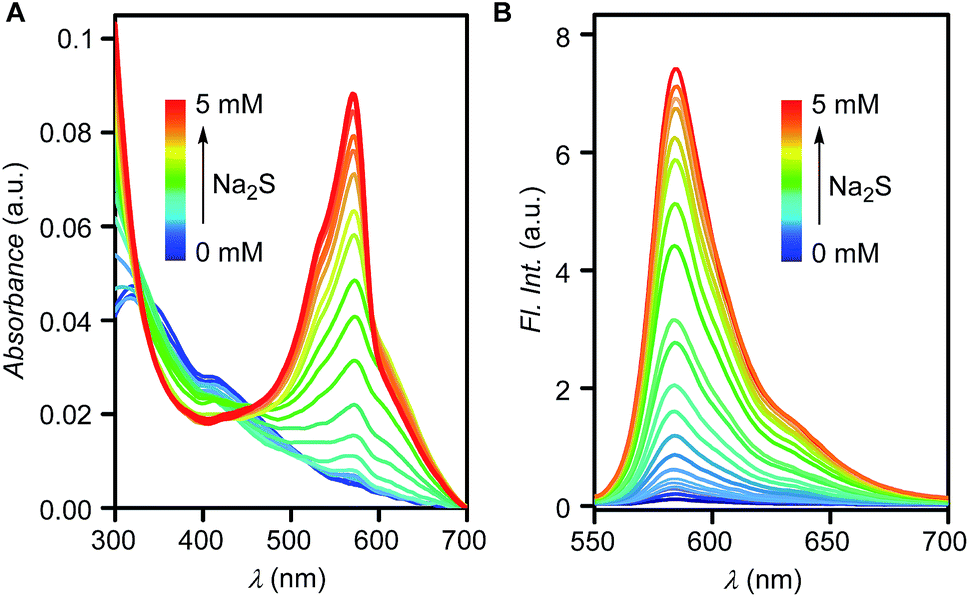 | ||
| Fig. 9 UV-visible (A) and fluorescence spectra (B) of Reso-N3 (10 μM) with increasing concentration of Na2S (0 to 5 mM) in phosphate buffer (5 mM, pH = 7.4). | ||
Further, the selectivity of Reso-N3 towards H2S over other analytes was evaluated under comparable conditions. When the probe was treated with ranges of analytes (NaF, NaCl, NaBr, NaI, Na2SO3, Na2SO4, Na2S2O3, NaSCN, NaNO2, NaNO3, Ala, Ser, Cys, GSH or Hcy) in phosphate buffer (5 mM, pH = 7.4), no significant increment in fluorescence intensity was observed (Fig. 10A, front row). On the other hand, strong enhancement in fluorescence intensity was observed when Na2S was added to the probe (Fig. 10A, the leftmost column of the rear row). Addition of Na2S to solutions of the probe and competing analyte resulted in strong fluorescence intensity enhancements (Fig. 10A, rear row). The response of Na2S towards the probe in the presence of Cys improved than that observed in pure water. Cuvette images taken under ambient light suggests a change in color from yellow to pink upon addition of only Na2S to the probe Reso-N3 (Fig. 10B). Similarly, the appearance of orange fluorescent for the probe in the presence of Na2S under the hand held UV-lamp (λex = 365 nm) also corroborates to the selectivity of probe towards H2S over other analytes (Fig. 10C).
 | ||
| Fig. 10 Relative fluorescence intensity enhancements at 585 nm for Reso-N3 (10 μM) towards Na2S (5 mM) and other analytes in phosphate buffer (A). Front row: change in intensities in the presence of various analytes (5 mM); rear row: Na2S was added in the presence of respective analyte. Cuvette images of Reso-N3 (50 μM) in phosphate buffer (5 mM, pH = 7.4) in presence of various analytes taken under ambient light (B) and under hand held UV lamp, λex = 365 nm (C). | ||
Live cell imaging of intracellular H2S by Reso-N3
To evaluate the ability of Reso-N3 for detecting H2S in the biological systems, live cell imaging studies were carried out using HeLa cells. When cells were incubated with only Reso-N3 (10 μM, in PBS buffer, pH = 7.4) for 15 min, very low fluorescence was observed. The weak fluorescence is attributed to the low levels of intracellular H2S. Strong fluorescence was observed when cells, preincubated with probe, were incubated with Na2S (1 mM, in PBS buffer, pH = 7.4) for 15 min (Fig. 11).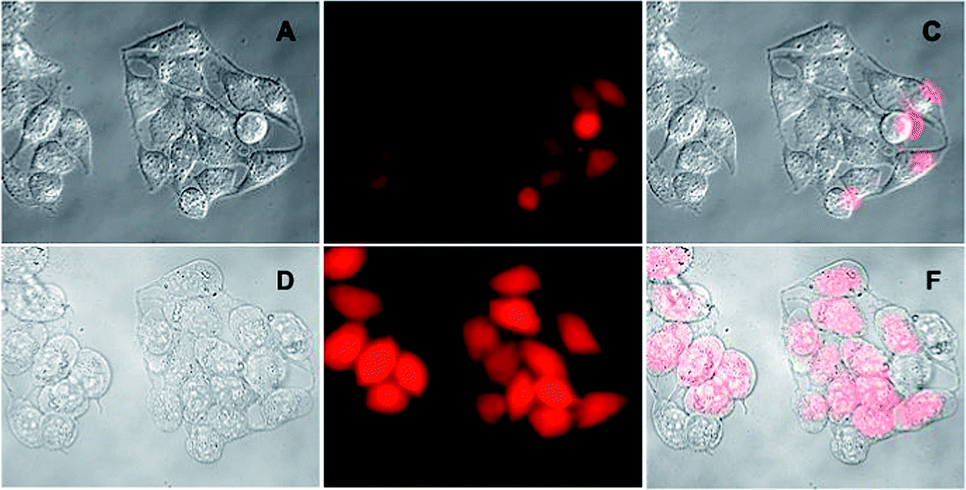 | ||
| Fig. 11 Live cell imaging of HeLa cell: DIC (A), fluorescence (B) and overlay (C) images of cells, incubated with Reso-N3 (10 μM) for 15 min. (D–F) are respective DIC, fluorescence and overlay image of HeLa cells, preincubated with Reso-N3 (10 μM) followed by incubation with Na2S (1 mM) for 15 min. | ||
Finally, the quantitative response of probe Reso-N3 towards intracellular H2S was studied. Quantification was done by recording the pixel intensity of the selected region of interest (ROI) from images acquired at different time intervals (0, 5, 10, 15, 20 min), after incubation with Na2S. When pixel intensity values were plotted in a bar diagram against time, an increase in intensity was observed up to 20 min of incubation (Fig. 12). The gradual increment in intensity corresponds to an increase in intracellular H2S concentration.
 | ||
| Fig. 12 Fluorescence images of HeLa cell acquired at different time intervals (0, 5, 10, 15 and 20 min) after incubating with Na2S (A–E). Bar diagram was plotted by the average pixel intensity of selected ROI's versus time (F). | ||
Conclusions
In summary, we have developed two fluorescent probes Reso-N3 and Reso-Br for sensing of H2S under physiological conditions. Reso-N3 undergoes azide-to-amine reduction by H2S followed by cyclization to release resorufin fluorophore. On the other hand, Reso-Br probe facilitates nucleophilic substitution of bromide by H2S followed by cyclization to release the same fluorophore. The ClogP guideline based on Lipinski's rule of five was also considered in the design, to favour water solubility and cell membrane permeation of these molecules. Reso-N3 was prepared from methyl 2-methylbenzoate in three steps with overall 27% yield. Reso-Br probe was synthesized from pthalide in two steps with overall 25% yield. Photophysical properties of these probes in water provided a lower background fluorescence for Reso-N3 compared to Reso-Br. H2S sensing by Reso-N3 under the pseudo first order reaction kinetics provided rate constant, k = 0.6 min−1 and t1/2 = 1.2 min. Response of the probe Reso-Br towards H2S under similar conditions was significantly faster with k = 0.28 min−1 and half life t1/2 = 2.4 min. Reso-N3 displayed 614-fold off–on fluorescence with detection limit = 440 nM. For Reso-Br, considerably reduced sensitivity of 414-fold and detection limit = 580 nM were determined. 1H NMR titration experiments were carried out to prove the sensing mechanisms for each probe. Moreover under physiological conditions (in aqueous buffer, pH = 7.4) Reso-Br was found to be unstable, possibly due to its solvolysis under the weakly nucleophilic media. Reso-N3 on the other hand was stable under the comparable conditions. During H2S sensing under these conditions, the Reso-N3 probe displayed k = 0.13 min−1, t1/2 = 5.33 min and sensitivity of 110-fold. Live cell imaging studies demonstrated applicability of Reso-N3 in the detection of intracellular H2S.
Experimental section
I. General methods
All reactions were conducted under a nitrogen atmosphere. All the chemicals were purchased from commercial sources and used as received unless stated otherwise. Solvents: petroleum ether and ethyl acetate (EtOAc) were distilled prior to thin layer and column chromatography. Dichloromethane (DCM) was pre-dried over calcium hydride and then distilled under vacuum. Column chromatography was performed on Merck silica gel (100–200 mesh). TLC was carried out with E. Merck silica gel 60-F254 plates.II. Physical measurements
The 1H and 13C spectra were recorded on 400 MHz Jeol ECS-400 (or 100 MHz for 13C) spectrometers using either residual solvent signals as an internal reference or from internal tetramethylsilane on the δ scale (CDCl3 δH, 7.24 ppm, δC 77.0 ppm). The chemical shifts (δ) were reported in ppm and coupling constants (J) in Hz. The following abbreviations were used: m (multiplet), s (singlet), br s (broad singlet), d (doublet), t (triplet) dd (doublet of doublet). High-resolution mass spectra were obtained from MicroMass ESI-TOF MS spectrometer. FT-IR spectra were obtained using NICOLET 6700 FT-IR spectrophotometer as KBr disc and reported in cm−1. Melting points were measured using a VEEGO Melting point apparatus. All melting points were measured in open glass capillary and values are uncorrected. Absorption spectra were recorded on a PerkinElmer, Lambda 45 UV-Vis spectrophotometer. Steady State fluorescence experiments were carried out in a micro fluorescence cuvette (Hellma, path length 1.0 cm) on a Fluoromax 4 instrument (Horiba Jobin Yvon). Cell images were taken in 35 mm (diameter) dishes. The media (DMEM) and PBS buffer were purchased from commercial sources. Fluorescence images were taken using Olympus Inverted IX81 equipped with Hamamatsu Orca R2 microscope. ChemBio Draw Ultra and Image J software were used for drawing structure and for processing cell image respectively.III. Synthesis of probes Reso-N3 and Reso-Br
Step A. To the solution of 2-methylbenzoate 5 (1.00 g, 6.65 mmol) in dry CCl4 (10 mL) were added N-bromosuccinimide (1.30 g, 7.32 mmol), and benzoyl peroxide (0.032 g, 0.133 mmol). The reaction mixture was stirred at 80 °C for 8 h. Subsequently, the reaction mixture was cooled to room temperature and placed in an ice-water bath to allow the precipitation of succinimide. The reaction mixture was diluted with dichloromethane (50 mL) and filtered. The filtrate was washed with saturated NH4Cl (30 mL). The organic layer was dried over Na2SO4 and concentrated under reduced pressure to afford 2-(bromomethyl) benzoate as yellow oil. The crude product was used for the next reaction without further purification.
Step B. To the solution of 2-(bromomethyl)benzoate in DMF (10 mL) was added sodium azide (0.570 g, 8.72 mmol), and the reaction mixture was stirred at 70 °C for 16 h. At the completion of the reaction, the solution was cooled to room temperature. To the reaction mixture was added water (30 mL) and the product extracted with ethyl acetate (3 × 30 mL). The combined organic layer was washed with brine (40 mL), dried over Na2SO4, and concentrated under reduced pressure to obtain methyl 2-(azidomethyl)benzoate (0.665 g) as yellow oil. The crude product was used for the next reaction without further purification.
Step C. In a 50 mL round bottomed flask, was placed methyl 2-(azidomethyl)benzoate and 20 mL of 2 N NaOH/MeOH (1
:1) was added. After 1 h stirring at room temperature the reaction mixture was acidified with 1 N HCl (upto pH = 1) and product was extracted with of chloroform (3 × 30 mL). The combined organic layer was dried over Na2SO4 and concentrated under reduced pressure to afford 2-(azidomethyl)benzoic acid 6 (0.67 g, 52%) as white solid. 1H NMR (400 MHz, CD3OD): δ 8.03 (d, J = 7.8 Hz, 1H), 7.56 (dd, J = 11.8, 4.3 Hz, 1H), 7.52–7.38 (m, 2H), 4.79 (s, 2H). 13C NMR (100 MHz, CD3OD): δ 169.92, 138.47, 133.59, 132.33, 131.33, 131.01, 129.27, 53.91.
Acknowledgements
We acknowledge IISER Pune and DST-SERB (Grant no. SR/S1/OC-65/2012) for financial supports. T.S. thanks University Grant Commission (UGC) and D.K. thanks Council for Scientific and Industrial Research (CSIR) for research fellowships.Notes and references
- C. L. Evans, Q. J. Exp. Physiol., 1967, 52, 231–248 CAS.
- T. L. Guidotti, Int. J. Toxicol., 2010, 29, 569–581 CrossRef CAS PubMed.
- S. Singh, D. Padovani, A. Leslie Rachel, T. Chiku and R. Banerjee, J. Biol. Chem., 2009, 284, 22457–22466 CrossRef CAS PubMed.
- D. Boehning and S. H. Snyder, Annu. Rev. Neurosci., 2003, 26, 105–131 CrossRef CAS PubMed.
- N. Shibuya, M. Tanaka, M. Yoshida, Y. Ogasawara, T. Togawa, K. Ishii and H. Kimura, Antioxid. Redox Signaling, 2009, 11, 703–714 CrossRef CAS PubMed.
- L. Li, P. Rose and P. K. Moore, Annu. Rev. Pharmacol. Toxicol., 2011, 51, 169–187 CrossRef CAS PubMed.
- H. Kimura, Amino Acids, 2011, 41, 113–121 CrossRef CAS PubMed.
- O. Kabil and R. Banerjee, J. Biol. Chem., 2010, 285, 21903–21907 CrossRef CAS PubMed.
- M. Fu, W. Zhang, L. Wu, G. Yang, H. Li and R. Wang, Proc. Natl. Acad. Sci. U. S. A., 2012, 109, 2943–2948 CrossRef CAS PubMed.
- A. Martelli, L. Testai, C. Breschi Maria, C. Blandizzi, A. Virdis, S. Taddei and V. Calderone, Med. Res. Rev., 2012, 32, 1093–1130 CrossRef CAS PubMed.
- J. L. Wallace, Trends Pharmacol. Sci., 2007, 28, 501–505 CrossRef CAS PubMed.
- K. Wang, S. Ahmad, M. Cai, J. Rennie, T. Fujisawa, F. Crispi, J. Baily, M. R. Miller, M. Cudmore, P. W. F. Hadoke, R. Wang, E. Gratacos, I. A. Buhimschi, C. S. Buhimschi and A. Ahmed, Circulation, 2013, 127, 2514–2522 CrossRef CAS PubMed.
- C. Szabo, C. Coletta, C. Chao, K. Modis, B. Szczesny, A. Papapetropoulos and M. R. Hellmich, Proc. Natl. Acad. Sci. U. S. A., 2013, 110, 12474–12479 CrossRef CAS PubMed.
- K. Eto, T. Asada, K. Arima, T. Makifuchi and H. Kimura, Biochem. Biophys. Res. Commun., 2002, 293, 1485–1488 CrossRef CAS.
- P. Kamoun, M.-C. Belardinelli, A. Chabli, K. Lallouchi and B. Chadefaux-Vekemans, Am. J. Med. Genet., Part A, 2003, 116, 310–311 CrossRef PubMed.
- W. Yang, G. Yang, X. Jia, L. Wu and R. Wang, J. Physiol., 2005, 569, 519–531 CrossRef CAS PubMed.
- S. Fiorucci, E. Antonelli, A. Mencarelli, S. Orlandi, B. Renga, G. Rizzo, E. Distrutti, V. Shah and A. Morelli, Hepatology, 2005, 42, 539–548 CrossRef CAS PubMed.
- K. R. Olson, Biochim. Biophys. Acta, 2009, 1787, 856–863 CrossRef CAS PubMed.
- H. Peng, Y. Cheng, C. Dai, A. L. King, B. L. Predmore, D. J. Lefer and B. Wang, Angew. Chem., Int. Ed., 2011, 50, 9672–9675 CrossRef CAS PubMed.
- A. R. Lippert, E. J. New and C. J. Chang, J. Am. Chem. Soc., 2011, 133, 10078–10080 CrossRef CAS PubMed.
- L. A. Montoya and M. D. Pluth, Chem. Commun., 2012, 48, 4767–4769 RSC.
- B. Chen, W. Li, C. Lv, M. Zhao, H. Jin, H. Jin, J. Du, L. Zhang and X. Tang, Analyst, 2013, 138, 946–951 RSC.
- G. Zhou, H. Wang, Y. Ma and X. Chen, Tetrahedron, 2013, 69, 867–870 CrossRef CAS PubMed.
- S. K. Das, C. S. Lim, S. Y. Yang, J. H. Han and B. R. Cho, Chem. Commun., 2012, 48, 8395–8397 RSC.
- M.-Y. Wu, K. Li, J.-T. Hou, Z. Huang and X.-Q. Yu, Org. Biomol. Chem., 2012, 10, 8342–8347 CAS.
- Q. Wan, Y. Song, Z. Li, X. Gao and H. Ma, Chem. Commun., 2013, 49, 502–504 RSC.
- R. Wang, F. Yu, L. Chen, H. Chen, L. Wang and W. Zhang, Chem. Commun., 2012, 48, 11757–11759 RSC.
- F. Yu, P. Li, P. Song, B. Wang, J. Zhao and K. Han, Chem. Commun., 2012, 48, 2852–2854 RSC.
- T. Saha, D. Kand and P. Talukdar, Org. Biomol. Chem., 2013, 11, 8166–8170 CAS.
- Z. Xu, L. Xu, J. Zhou, Y. Xu, W. Zhu and X. Qian, Chem. Commun., 2012, 48, 10871–10873 RSC.
- Y. Qian, L. Zhang, S. Ding, X. Deng, C. He, X. E. Zheng, H.-L. Zhu and J. Zhao, Chem. Sci., 2012, 3, 2920–2923 RSC.
- Y. Qian, J. Karpus, O. Kabil, S.-Y. Zhang, H.-L. Zhu, R. Banerjee, J. Zhao and C. He, Nat. Commun., 2011, 2, 495 CrossRef PubMed.
- C. Liu, J. Pan, S. Li, Y. Zhao, L. Y. Wu, C. E. Berkman, A. R. Whorton and M. Xian, Angew. Chem., Int. Ed., 2011, 50, 10327–10329 CrossRef CAS PubMed.
- C. Liu, B. Peng, S. Li, C.-M. Park, A. R. Whorton and M. Xian, Org. Lett., 2012, 14, 2184–2187 CrossRef CAS PubMed.
- K. Sasakura, K. Hanaoka, N. Shibuya, Y. Mikami, Y. Kimura, T. Komatsu, T. Ueno, T. Terai, H. Kimura and T. Nagano, J. Am. Chem. Soc., 2011, 133, 18003–18005 CrossRef CAS PubMed.
- F. Hou, L. Huang, P. Xi, J. Cheng, X. Zhao, G. Xie, Y. Shi, F. Cheng, X. Yao, D. Bai and Z. Zeng, Inorg. Chem., 2012, 51, 2454–2460 CrossRef CAS PubMed.
- F. Hou, J. Cheng, P. Xi, F. Chen, L. Huang, G. Xie, Y. Shi, H. Liu, D. Bai and Z. Zeng, Dalton Trans., 2012, 41, 5799–5804 RSC.
- X. Cao, W. Lin, K. Zheng and L. He, Chem. Commun., 2012, 48, 10529–10531 RSC.
- Data for Biochemical Research, ed. Dawson R. M. C., Oxford University Press, New York, NY, 3rd edn, 1987, pp. 16–17 Search PubMed.
- X. Wang, J. Sun, W. Zhang, X. Ma, J. Lv and B. Tang, Chem. Sci., 2013, 4, 2551–2556 RSC.
- Z. Wu, Z. Li, L. Yang, J. Han and S. Han, Chem. Commun., 2012, 48, 10120–10122 RSC.
- J. Zhang, Y.-Q. Sun, J. Liu, Y. Shi and W. Guo, Chem. Commun., 2013, 49, 11305–11307 RSC.
- S.-H. Park and H.-K. Choi, Int. J. Pharm., 2006, 321, 35–41 CrossRef CAS PubMed.
- M. Sun, D. Shangguan, H. Ma, L. Nie, X. Li, S. Xiong, G. Liu and W. Thiemann, Biopolymers, 2003, 72, 413–420 CrossRef CAS PubMed.
- S. Y. Kim and J.-I. Hong, Org. Lett., 2007, 9, 3109–3112 CrossRef CAS PubMed.
- M. G. Choi, S. Cha, J. E. Park, H. Lee, H. L. Jeon and S.-K. Chang, Org. Lett., 2010, 12, 1468–1471 CrossRef CAS PubMed.
- M.-G. Choi, J.-Y. Hwang, S.-Y. Eor and S.-K. Chang, Org. Lett., 2010, 12, 5624–5627 CrossRef CAS PubMed.
- W. Chen, Z. Li, W. Shi and H. Ma, Chem. Commun., 2012, 48, 2809–2811 RSC.
- H. G. Im, H. Y. Kim, M. G. Choi and S.-K. Chang, Org. Biomol. Chem., 2013, 11, 2966–2971 CAS.
- K. Cui, Z. Chen, Z. Wang, G. Zhang and D. Zhang, Analyst, 2011, 136, 191–195 RSC.
- W. Gao, B. Xing, R. Y. Tsien and J. Rao, J. Am. Chem. Soc., 2003, 125, 11146–11147 CrossRef CAS PubMed.
- C. A. Lipinski, F. Lombardo, B. W. Dominy and P. J. Feeney, Adv. Drug Delivery Rev., 1997, 23, 3–25 CrossRef CAS.
- P. Leeson, Nature, 2012, 481, 455–456 CrossRef CAS PubMed.
- J. M. Smith, F. Vitali, S. A. Archer and R. Fasan, Angew. Chem., Int. Ed., 2011, 50, 5075–5080 CrossRef CAS PubMed.
- T. Wada, A. Ohkubo, A. Mochizuki and M. Sekine, Tetrahedron Lett., 2001, 42, 1069–1072 CrossRef CAS.
- J. McNulty and K. Keskar, Org. Biomol. Chem., 2013, 11, 2404–2407 CAS.
- W. Sun, S. Nesic, D. Young and R. C. Woollam, Ind. Eng. Chem. Res., 2008, 47, 1738–1742 CrossRef CAS.
- Y. Shiraishi, K. Yamamoto, S. Sumiya and T. Hirai, Chem. Commun., 2013, 49, 11680–11682 RSC.
- M. D. Bentley and M. J. S. Dewar, J. Am. Chem. Soc., 1970, 92, 3991–3996 CrossRef CAS.
- K.-T. Liu, Y.-F. Duann and S.-J. Hou, J. Chem. Soc., Perkin Trans. 2, 1998, 2181–2186 RSC.
Footnote |
| † Electronic supplementary information (ESI) available: Additional experimental procedures, fluorescence spectra. See DOI: 10.1039/c4ra13086c |
| This journal is © The Royal Society of Chemistry 2015 |