
 Open Access Article
 This Open Access Article is licensed under a Creative Commons Attribution-Non Commercial 3.0 Unported Licence
Phase separation dynamics in sodium solid-state batteries with Na–K liquid anodes†
Daren
Wu
 a,
Zhuo
Li
a,
Michael
Drakopoulos
b,
Nghia T.
Vo
b,
Zhong
Zhong
b and
Kelsey B.
Hatzell
*acd
a,
Zhuo
Li
a,
Michael
Drakopoulos
b,
Nghia T.
Vo
b,
Zhong
Zhong
b and
Kelsey B.
Hatzell
*acd
aAndlinger Center for Energy and the Environment, Princeton University, Princeton, NJ 08540, USA. E-mail: kelsey.hatzell@princeton.edu
bNational Synchrotron Light Source II, Upton, NY 11973, USA
cDepartment of Mechanical and Aerospace Engineering, Princeton University, Princeton, NJ 08540, USA
dDepartment of Chemical and Biological Engineering, Princeton University, Princeton, NJ 08540, USA
First published on 13th June 2025
Abstract
Alkali metal anodes hold great promise for high-energy-density batteries for grid-scale applications. However, challenges such as void formation at the solid electrolyte interface during electrodissolution and dendrite or filament growth during plating hinder their high-rate and high-capacity performance. Contact between an alkali anode can be improved either via increasing external stack-pressure or via introducing materials that are flexible, compliant, and conformable. Herein, we investigate a conformable sodium-potassium (NaK) liquid alloy anodes with a sodium solid electrolyte. Our results reveal that the liquid–solid phase separation in NaK anodes affects their long-term stability and performance. Critical stripping capacity is correlated with the liquid to solid phase transition upon sodium depletion upon during electrodissolution. Using a combination of electrochemical characterization and synchrotron 3D X-ray computed tomography, it is shown that the interaction between the NaK liquid alloy and its carbon substrate plays a crucial role in anode behavior. This effect is particularly pronounced at higher potassium concentrations, where decreases in viscosity and surface tension further restrict liquid mobility. These findings highlight the potential of NaK anodes for improving the durability of solid-state batteries while emphasizing the need to optimize interfacial dynamics and mitigate phase separation for reversible operation.
Introduction
Stationary or grid energy storage systems require (1) long cycle lifetimes, (2) low costs, and (3) high energy densities. Thus, sodium-based batteries are potential low-cost alternatives to lithium ion batteries that could satisfy growing needs for long duration and grid energy storage. One of the most prominent examples of sodium ion batteries is the sodium–sulfur (Na–S) battery. Na–S batteries employ a molten sodium anode, a solid electrolyte (β-alumina), and sulfur cathode. These energy storage systems were developed nearly four decades ago for emergency power, electric transmission and distribution support, and load leveling applications.1,2 Despite industrial deployment, Na–S systems suffer in terms of performance, safety, and cost (>$500 per kWh). Decreasing the solid electrolyte thickness and operating temperature may decrease costs and areal specific resistance of the battery. Nevertheless, lowering the temperature of alkali metal electrodes is challenging because non-uniform electrodeposition and dissolution reactions can form solid dendrites, filaments, and solid electrolyte fracture.3Electrodeposition instabilities have been extensively studied in liquid binary electrolytes, composed of both anions and cations. Traditional liquid electrolytes can develop concentration gradients, leading to regions of with excess or depleted charge.4 These charge instabilities can drive localized ion transport, ultimately contributing to the formation of dendritic structures.5 In contrast, single-ion inorganic solid electrolytes, in theory, do not develop concentration gradients responsible for dendrite growth. Instead, dendrite formation in solid electrolytes is primarily driven by (1) non-uniform ionic flux, (2) chemo-mechanical effects, and (3) molar volume mismatch.6 Ensuring uniform contact between battery components is essential for the long-term cycling stability of solid-state batteries utilizing metal anodes.7–9 Theoretically, an infinitely elastic liquid metal or alloy anode can overcome traditional challenges associated with solid metal anodes (e.g. dendrite formation).10,11 However, most liquid metal batteries suffer from three primary challenges: (1) high melting temperatures (e.g. operation), (2) corrosion issues, (3) chemical compatibility issues, and (4) safety issues.
NaK alloy are liquid over a broad compositional window (∼30 wt% K to 86 wt% K) under room temperature.12–14 Using a liquid NaK alloy in a solid-state battery may enable uniform and continuous contact between the anode and solid electrolyte during volume changing charging and discharging processes. Anode–electrolyte failure due to contact loss, mechanical stress buildup or excessive Na metal filament penetration of the electrolyte can therefore be prevented.13–16 Nevertheless, little is known about the implications of a phase-change during electrodissolution and electrodeposition. The liquid form of NaK alloy is unlikely to be maintained during high rate and high capacity cycling.17 Sodium depletion and enrichment may lead to interfacial liquid–solid phase separation in the form of Na or K metal accumulation, severely limiting the liquid contact. The accumulation of such phase separation may lead to Na filament growth and electrolyte failure similar to SSSBs with Na metal anodes.
In this work, NaK liquid anodes at three concentrations (50 wt% K, 65 wt% K and 80 wt% K; NaK50, NaK65 and NaK80) are investigated to study the impact of electrochemical cycling on the liquid–solid phase separation behavior at the anode–electrolyte interface of SSSBs, and the corresponding effect on the cycling stability. Electrochemical testing and real-time 3D X-ray microscopy (X-ray computed tomography, XCT) on self-standing NaK anodes during operation revealed that the mechanical property changes to NaK alloys induced by both carbon substrates and compositional changes during cycling facilitate liquid–solid phase separation. The critical stripping capacity correlates with the phase change process (liquid-to-solid). However, phase-separation upon deposition severely limits the long-term cycling performance. Methods such as unique charging or modulation of operating pressure or temperature may be required for reversible operation.
Experimental methods
Preparation of Na–K liquid anodes
Na–K alloys with 50 wt%, 65 wt% and 80 wt% K (NaK50, NaK65 and NaK80) were prepared by placing Na and K metal chunks of the desired weight ratios in a glass vial together then shook vigorously until a uniform liquid was formed. For the preparation of self-standing NaK liquid anodes (NaK@CC), carbon cloth was annealed in Ar atmosphere at 750 °C for 6 hours, then punched into ϕ 6 mm disks. 5 μL of NaK50, NaK65 or NaK80 liquid was added to each piece of carbon cloth to form a self-standing electrode for electrochemical testing under external pressure.Preparation of Na3Zr2Si2PO12 (NASICON) solid-state electrolyte
Commercial Na3Zr2Si2PO12 powder (MSE Supplies) was cold pressed at 625 MPa then sintered at 1230 °C for 12 h with a ramping rate of 5 °C min−1 to form self-standing electrolyte pellets. The as-sintered pellets were used directly for cycling Na metal. For NASICON pellets to be used for cycling NaK, a 20 nm SnO2 coating was applied to the NASICON surface that's going to contact NaK based on the procedure reported previously.16 The as-sintered NASICON pellet surface was sputtered with 20 nm of Sn metal using a VCR IBS/TM200S Ion Beam Sputterer, then transferred to a tube furnace and annealed at 900 °C for 3 h to form SnO2. Upon contact with NaK liquid anodes, this SnO2 layer transforms into a ion-electron conductive layer K2O/KxSn,18 which acts as a selective interface to block K ions and conduct Na ions.19 The protective role of the SnO2 is further demonstrated in in situ EIS take over a resting period after assembly of NaK/NASICON/Na cell and NaK/SnO2-NASICON/Na cell (Fig. S1†). When bare NASICON contacts NaK, interfacial degradation occurs and results in increasing interfacial resistance; with SnO2 coating introduced, the interfacial resistance stabilizes after ∼30 min upon cell assembly.Assembly of solid-state electrochemical cells
For Na metal cells, Na metal chunks were rolled into foils and disks with a diameter of 6 mm were cut from the foils then stuck onto ϕ 10 mm Cu foil current collectors. Surface of Na metal was mechanically cleaned before attaching to NASCION electrolyte. Na/NASICON/Na symmetric cells were assembled between 10 mm stainless steel plungers inside PEEK-lined stainless steel cell body. A spring-loaded pressure frame was used to apply different external pressures to the whole cell. All Na metal cells were first assembled at 10 MPa and hold for 2 min to form a low-resistance Na/NASICON interface before re-adjusting to lower cycling pressures. For asymmetric NaK/NASICON/Na cells, the NASICON/Na half cell was prepared at 10 MPa first to form a Na counter electrode before NaK@CC anodes were placed on the other side with the same ϕ 10 mm Cu current collectors. Symmetric NaK/NASICON/NaK cells were directly assembled with Cu current collectors at desired pressures. Na quasi-reference electrodes (Na-QREs) are prepared according to previously reported procedure.20 Na/NASICON half cell stack was first assembled & vacuum-sealed inside plastic pouches, then transferred to an isostatic press for pressing under 100 MPa for 15 min to form a zero-resistance Na/NASICON interface. The Na-QRE half cell was then used for assembling NaK or Na metal cells for electrochemical impedance testing.Electrochemical testing
Critical current density (CCD), constant current cycling and critical stripping tests were performed on the solid-state cells with a Landt battery testing system. For critical stripping tests, theoretical capacities of NaK50, 65 and 80 alloys are calculated based on the total mass of the liquid NaK alloys assembled into the test cells, and their Na contents. Electrochemical Impedance Spectroscopy (EIS) and galvanostatic cycling tests were performed with a BioLogic SP-300 potentiostat. The frequency range of EIS tests was 7 MHz to 1 Hz. For in situ EIS tests, electrochemical cells were discharged/charged with a constant current until certain capacity increment was reached, followed by a resting period, during which EIS test will be performed before the cell was discharged/charged again. Collected EIS data was processed and analyzed with Relaxis software package. For distribution of relaxation time (DRT) analysis, both the real part and imaginary part of EIS data were used for DRT transformation, with a regularization parameter λ of 10−3.Synchrotron in situ X-ray computed tomography experiments
A custom designed cylindrical PEEK cell with 6 mm inner diameter was used for in situ synchrotron X-ray computed tomography experiments conducted at the 27-ID HEX beamline21 at National Synchrotron Light Source II, Brookhaven National Laboratory. Monochromatic X-ray beams at 45 keV was directed to the cell and the transmitted beams were converted to visible light by a scintillator, then collected by a CCD camera to obtain a single radiography image with a 4 × 4 mm field of view and 1.3 μm pixel size. For each tomography image, 3001 radiography projections were collected with an exposure time of 0.1 s each over a 180° cell rotation. As each 3D image takes ∼3 min to collect, the real-time NaK/NASICON interfacial evolution during Na stripping/plating can be directly visualized. The raw projection images were processed using the Algotom software,22 which includes the following data processing workflow: flat-field normalization, center-of-rotation determination, zinger removal, ring artifact removal,23 and filtered back-projection. The reconstructed images were converted, aligned and subtracted by custom Python scripts before imported into the AVIZO software package for further analysis.The 27-ID HEX beamline was configured for phase-contrast-enhanced absorption tomography during our experiments, where imaging contrast is dominated by the mass absorption coefficients of different materials in the FOV. As a reference, the mass absorption coefficients of Na metal, K metal and NaK65 alloys at 44.79 keV (close to our imaging energy 45 keV) are 0.319, 0.960 and 0.714 cm2 g−1, respectively.24 Such differences in X-ray absorption are sufficient to generate imaging contrast for observation and reconstruction. To better visualize and quantify anode evolution over the cycling, the 3D images collected during the critical stripping process are first aligned to the pristine scan to compensate stage shifting, then numerically subtracted voxel-to-voxel by the pristine scan to obtain 3D differential maps, as demonstrated in Fig. S2b.† During this image alignment process, 3D images were converted to stacks of cross-sectional virtual slices, where each slice is 1.3 μm thick in the z direction. The central slice from the target scan and the pristine scan were used to perform spatial alignment for the whole stack, where relative pixel shifts in x, y and z direction were visually determined by performing direct image subtraction of the two central slices. The obtained pixel shift values were then applied to the whole target stack before being subtracted by the pristine stack, thus minimizing imaging artifacts resulted from sample stage shifting during experiment.
Results and discussion
Electrochemical cycling of NaK liquid anodes
NaK alloys remain in a liquid state at room temperature across a broad compositional range (∼46–89 wt% K, Fig. S3a†).12 The three compositions examined in this study—NaK50, NaK65, and NaK80—fall within this liquid range. During electrodissolution, sodium is extracted from the NaK alloy, increasing the potassium concentration. If the local potassium concentration exceeds 89%, the alloy transitions from a liquid to a solid state. Conversely, sodium deposition increases the sodium concentration in the alloy. The mechanical properties of the alloy will change during electrochemical cycling because the alloy undergoes a concentration-dependent phase transition.NaK alloys have a high surface tension which hinders infiltration into carbon matrices. The spreading area of 2 μL NaK on a ϕ 6 mm carbon cloth differs between NaK50, 65 and 80 due to varying viscosities and surface tensions (Fig. S3b†).25,26 Infiltration of NaK alloys into a carbon matrix is a common approach in order to stabilize and reversibly cycle the liquid and semi-solid electrodes.13,16,17,27,28 NaK can partially react with carbon substrates as part of their wetting mechanism,17,29 therefore higher NaK loading per unit area of carbon is desired. Annealing the carbon cloth matrix improves the wettability and infiltration process (Fig. 1 a). Upon contacting carbon fibers, potassium within NaK alloys react with carbon to form a graphite infiltration compound KC8, which act as a conductive interface that significantly improves the wetting and binding between NaK and carbon cloth.30 The strengthened interactions between NaK and carbon cloth therefore partially restricts the liquid flow of NaK, effectively leading to a self-standing liquid NaK anode. These self-standing NaK@CC anodes can be combined with a NASICON solid electrolyte for electrochemical characterization. NASICON (Na3Zr2Si2PO12) chemically reacts when in direct contact with NaK, so a 20 nm SnO2 coating is applied to facilitate sodium conduction and prevent potassium ion integration into the solid electrolyte.16,19
 | ||
| Fig. 1 (a) Assembling solid-state NaK/NASICON pressure cells for electrochemical testing with free-standing NaK@CC electrodes and SnO2-coated NASICON pellets. (b) Critical current density (CCD) tests on Na, NaK50, NaK65 and NaK80 symmetric cells collected at 10 MPa external pressure. (c) CCD results collected on the same group at different external pressures. (d) Critical stripping capacity tests on NaK50, NaK65 and NaK80 collected with asymmetric cell setup at 10 MPa external pressure. (e) Critical stripping capacity of NaK alloys collected at different external pressures. Background color indicates capacity regions where different bulk phase compositions in NaK anodes are expected, based on Na–K phase diagram. | ||
Critical current density (Fig. 1b and c) and critical stripping capacity (Fig. 1d and e) tests were performed on all three NaK alloy anodes at 10 MPa, 2 MPa and 1 MPa stack pressures. At 10 MPa the critical current densities for sodium metal, NaK50, NaK65, and NaK80 were 3.2 mA cm−2, 1.2 mA cm−2, 0.8 mA cm−2, and 0.6 mA cm−2, respectively (Fig. 1b). The critical current density for the alloys decreases with increasing K content (Na > NaK50 > NaK65 > NaK80). The critical current density of sodium metal increases with stack pressure from 1.3 to 3.2 mA cm−2 as the stack pressure increases from 1 to 10 MPa. However, the NaK alloys demonstrate critical current densities that are independent of pressure (Fig. 1c). At low pressures the sodium metal electrode operates similarly to the NaK alloys (Fig. 1c). The decreasing CCD of Na metal with decreasing pressure suggests inhomogeneous Na/NASICON interfacial contact at reduced pressure, which leads to interfacial voiding and Na filament growth.20 As the CCD of NaK alloys are independent of stack pressure, it is likely that the NaK/NASICON interface morphology does not change significantly under various mechanical stress, which is consistent with the infinite elasticity of the NaK liquid alloy. However, the overall lower CCD value of NaK alloys is suggesting that Na filament growth and solid electrolyte interphase growth is not effectively suppressed. We note that the external pressure on NaK alloys may impact its phase-transition behavior, which may eventually affect their electrochemical response. However, based on previous study, hundreds of MPa of external pressure is needed to shift the Na–K phase diagram and change the phase transformation behavior.31 The impact of 10 MPa external pressure is therefore negligible.
Critical stripping capacity represents the total capacity that can be stripped from an electrode before failure is brought on by contact loss at the anode. The critical stripping capacity for the alloys is directly related to the concentration of active material (e.g. sodium metal) in the alloy. Critical stripping capacities for NaK80, NaK65, and NaK50 are approximately 150 mA h g−1, 300 mA h g−1, and 400 mA h g−1, respectively (Fig. 1d). Fig. 1e demonstrates the theoretical capacity of the anodes (red dashed line, calculated based on the Na content inside the NaK alloys) and the liquid-to-solid-phase transition as sodium is depleted and potassium is enriched upon electrodissolution (blue and green background). There is a considerable gap between the theoretical capacity and the critical stripping capacity of all NaK alloys. This gap can be directly correlated to onset of a phase change (liquid-to-solid),27 as Na stripping beyond the bulk phase transition limit leads to precipitation of K metal. Excessive precipitation of K metal blocks Na transport pathways to the solid electrolyte, contributing to the cell voltage increase reaching the cutoff voltage. In this case, alloys remain ‘active’ only during the domain that it remains a liquid. We also note that the calculated theoretical capacity is based on the Na–K phase diagram (Fig. S3†),12 which is a thermodynamic prediction. During the actual cycling, kinetic factors would further limit the Na transport at the interface and inside the NaK alloy, facilitating phase separation and interfacial degradations. The critical stripping capacity results suggest that liquid–solid phase separation likely impacts the mass transport inside NaK anodes, and at the NaK/NASICON interface, limiting the practical capacity.
Impedance spectra evolution during cycling
Electrochemical impedance spectroscopy was collected on pristine NaK50, 65 and 80 electrodes with a Na quasi-reference electrode (Na-QRE) to examine the differences among NaK/NASICON interfaces as a function of NaK composition. Fig. 2a shows the cell configuration for the EIS measurement, where the SnO2-coated side of NASICON is paired with NaK@CC electrodes, and the bare side of the NASICON is paired with Na metal and processed by isostatic pressing to form a Na-QRE. Fig. 2b shows the equivalent circuit used for fitting the EIS data collected on NaK, which separately accounts for the contributions from the resistances of the NASICON grain boundary (RGB), the SnO2 coating (RSnO2) and anode–electrolyte interface (Rint). A detailed breakdown of equivalent circuit components is shown in Fig. S4.† The EIS of as-prepared Na-QRE showed one semicircle in the measurement frequency range corresponding to NASICON grain boundary resistance20 and near-zero interfacial resistance (Fig. S4a†), therefore any interfacial impedance for cells assembled with Na-QRE would be coming from the working electrode side. By comparing the EIS spectra and fitting results of Na/NASICON/Na cells and Na/(SnO2)NASICON/NaQRE cell (Fig. S4b and c†), the impedance contributions of SnO2 can also be identified as a very small semicircle in the low frequency range (RSnO2). The NaK alloys demonstrate an increasing interfacial resistance with increasing K content (Fig. 2c). The resistance at the NaK/NASICON interface likely originates from the different microscopic contact area among NaK@CC anodes, as the spreading experiment (Fig. S3b†) results show increasing spread area with increase K content. The viscosity and surface tension of liquid NaK alloys decrease with increased K content.25,26 The lower viscosity and surface tension allows NaK alloys to better adhere onto the carbon surface with increased contact area and more chemical bonding between NaK and carbon fibers,17,29 which results in greater infiltration of the NaK80 than NaK50 and NaK65 (Fig. 2c). Such composition-dependent mechanical properties of NaK liquids and NaK@CC electrodes mean that the NaK/NASICON interfacial contact is also composition-dependent. In particular, large amount of Na stripping likely leads to contact loss due to both volume shrinkage and NaK infiltration into the carbon cloth. | ||
| Fig. 2 Electrochemical impedance spectroscopy results on NaK/(SnO2)NASICON/NaQRE cells. (a) Schematics of the cell setup for testing NaK. (b) Randles circuit used for fitting EIS data. (c–e) EIS data & fitting results of NaK50, 65 & 80 taken 1 hour after cell assembly. (f) Interfacial resistance between NaK and NASICON after assembly. | ||
Distribution of Relaxation Time (DRT) spectra of Na-QRE, Na metal and NaK50 working electrodes were collected to understand how interfacial resistances change during electrochemical cycling32 (Fig. 3a and b). The peak at τ ≈ 10−7 s corresponds to the grain boundary impedance of NASICON,20 the peak at τ ≈ 10−3 s corresponds to the impedance of the SnO2 coating,33,34 and the peak located between τ = 10−3 to 101 s corresponds to interfacial impedance due to mechanical constriction (voids).35,36 The relatively wide relaxation time (τ) distribution of interfacial impedance is related to the capacitance (τ = RC) of interfacial voids, which is dominated by both the area and depth of the voids. Given that C = εA/d where A is the contact area and d is the separation distance, deep and small interfacial voids generate peaks at smaller τ values corresponding to faster charge transfer, and large and shallow interfacial voids generate peaks at larger τ values corresponding to slower charge transfer.35,36
 | ||
| Fig. 3 In situ impedance results in DRT form. All cells were assembled with an external pressure of 10 MPa and cycled at a current density of 0.25 mA h cm−2. (a) DRT spectra of pristine cells with as-shown configurations. (b–d) Contour plots of DRT evolution over the Na stripping–plating–stripping process of NaK50 (b), NaK65 (c) and NaK80 (d). | ||
In situ monitoring of the distribution of relaxation time can be visualized by plotting the relaxation time as the x-axis and the time passed during electrochemical cycling as the y-axis (Fig. 3b–d). Cells are cycled at a constant current up to 1 mA h cm−2 capacity with impedance spectra recorded every 0.25 mA h cm−2 capacity. The plot color corresponds to the amplitude of the distribution function γ. In situ EIS on the control experiment (Na-QRE and Na metal) reveal negligible contribution to the DRT spectra upon Na stripping/plating for up to 4 mA h cm−2 of capacity (Fig. S5a†). Thus, the DRT evolution observed in Fig. 3b–d is dominated by the NaK anodes itself. The DRT spectra evolution during the three cycling steps demonstrates an asymmetric cycling behavior. The amplitudes and positions of interfacial impedance peaks changed significantly when the cells switched between sodium electrodissolution (stripping) and sodium deposition (plating) steps. This implies different interfacial morphology during Na stripping and plating processes. A dominant interfacial peak located at ∼100 s (dashed yellow lines) is observed upon stripping. The width (relaxation time distribution) and height (resistance) of this peak both increase with increasing K content, consistent with the higher interfacial resistance observed upon cell assembly (Fig. 2). Upon Na stripping, peak broadening and height increase correspond to the enlargement of existing interfacial voids and formation of new voids.35 Such interfacial constrictions worsen with higher K content. The ∼100 s peak diminishes and a peak at ∼10−2 to 100 s dominates the spectra (dashed blue lines) upon plating. This suggests that the interfaces is characterized by smaller/deeper voids upon Na plating of the NaK@CC anodes.
As the potassium content in the alloy increases from NaK50 to NaK80, the dominant peak upon plating shifts toward larger τ values (Fig. 3b–d), indicating slower kinetics associated with the deposition of sodium metal rather than an alloying mechanism. Increasing the initial content of potassium in the alloy results in a greater propensity for liquid–solid phase separation upon stripping, leading to slower kinetics upon plating (Fig. 2c). As more mechanical constrictions develop in NaK with higher K contents upon Na stripping, the active sites for Na plating are also further restricted, resulting in the slower kinetics. We note that the Na diffusivity differences among NaK alloys would have minimal contributions to this phenomenon, as the reported Na diffusivity in NaK alloys increases with increasing K content (Table S1†).37 Higher Na diffusivity should lead to faster deposition/alloying kinetics, which is contrary to our observation here. This asymmetric Na stripping–plating behavior significantly affects the integrity of the liquid–solid anode–electrolyte interface. During the second Na stripping, the overall interfacial impedance of the NaK anodes becomes substantially higher than during the initial Na stripping process, likely due to the accumulation of solid Na metal at the anode–electrolyte interface and interfacial decomposition due to thermodynamic instabilities. This phenomenon explains the lower CCD of NaK@CC anodes compared to Na metal under high external pressures (Fig. 1b). Na metal, being sufficiently soft, can undergo creep under pressure to form an almost ideal contact with the NASICON electrolyte.20 As a result, it can sustain higher current densities before inhomogeneous stripping/plating occurs, unlike NaK@CC anodes.
In situ EIS measurements were conducted during the critical stripping process of NaK50, NaK65, and NaK80 anodes to track interfacial evolution (Fig. S6†). The pristine alloys exhibit a broad interfacial impedance peak within the range of approximately ∼10−2 to 100 s. During Na stripping, this broad peak rapidly splits into two distinct peaks, with new peaks appearing at smaller τ values. The amplitude of all peaks gradually increases with continued stripping until a sharp rise occurs at the end of critical stripping, corresponding to a significant voltage increase. Such DRT evolution can be the results of both interfacial void formation/enlargement, and liquid–solid phase separation in the form of K metal precipitation, as Na stripping moves NaK anodes toward solid + liquid phase region where both K metal and liquid NaK are simultaneously present. When NaK anodes are stripped beyond the fully liquid region, substantial precipitation of K metal is expected within the NaK@CC anodes, further constricting active Na transport pathways. This phase separation, combined with contact loss, is likely responsible for the significant voltage rise observed at the end of the critical stripping process, as indicated by the DRT spectra.
In situ 3D imaging interfacial evolution
Synchrotron X-ray tomography was utilized to investigate the interfacial and bulk evolution of alloys during electrochemical cycling. A custom-designed cylindrical cell, consisting of a NaK50@CC working electrode, a NASICON electrolyte pellet, and a sodium metal counter electrode, was mounted vertically on the rotational sample stage of the beamline. The cell was electrically connected to a potentiostat for cycling control (Fig. 4a). Each 3D image required approximately 3 minutes for acquisition, providing sufficient temporal resolution to capture dynamic processes during long-term cycling. | ||
| Fig. 4 In situ synchrotron XCT collected during the critical stripping process of NaK50. (a) Schematics of the in situ XCT experiment. (b) voltage profile of the in situ cell. (c) Reconstructed virtual cross-section overlayed with mass variation map. (d) 3D mass variation map obtained by subtracting the fully stripped scan by pristine scan. (e) Total mass variation volume as a function of vertical distance. (f) Illustration of liquid–solid phase separation (K metal precipitation) as a result of Na stripping from NaK. | ||
A 2D radiograph of the NaK/NASICON interface distinctly differentiates the low-density carbon fiber matrix (white regions) from the dense solid electrolyte (dark gray) (Fig. S2b† and 4c). The NaK mass loading (5 μL on a 6 mm diameter carbon cloth) indicates that the entire carbon fiber matrix is not fully saturated with NaK liquid, leaving a portion of the pores unfilled. Cells underwent a critical stripping experiments at 1 mA cm−2 (Fig. 4b). During this in situ experiment, the synchrotron beamline camera was setup to capture absorption contrast images with a small fraction of phase contrast, therefore each voxel value in reconstructed 3D images is directly proportional to the X-ray mass attenuation coefficient of this point in space.38
The 3D mass differential maps, generated through 3D imaging alignment and subtraction, directly depict the mass variations within the imaged volume (Fig. S2b†). Mass increases may result from liquid migration or the addition of new material during deposition, while mass decreases are likely due to the removal of active material during electrodissolution or liquid migration away from a region due to flow. Fig. 4c overlays regions with mass increases (red) and mass decreases (blue) onto a 2-D radiography after reaching the critical stripping capacity. Three important observations can be made from this overlay image. First, Na stripping-induced mass density variations mostly occur around the edges of the carbon fibers and inside pore spaces. This is consistent with the wrap-around microscopic geometry of NaK@CC anodes illustrated in Fig. 2c, where NaK liquid adsorbs onto the surface of individual carbon cloth fibers rather than infiltrates into them. Second, mass density variations are more pronounced near the NaK/NASICON interface. This observation indicates that the interactions between carbon cloth fibers and NaK alloys are strong enough to not only confine NaK liquids, but also limit their mechanical flow. Such behavior contrasts conventional solid alloy anodes, i.e., Li–In and Li–Mg anodes, where mass density variations develop near the anode–electrolyte interface due to Li concentration gradient as a result of Li stripping/plating.33,39 In the Li–In case, Li diffusivity inside the alloy is on the scale of 10−13 to 10−9 cm2 s−1, which is not fast enough to compensate for the Li flux at the anode–electrolyte interface, causing the concentration gradient. In the NaK/NASICON system, however, this is unlikely the case, as the Na transport inside NaK liquid is orders of magnitudes larger than Li in Li–In alloys, on the scale of 10−5 cm2 s−1 (ref. 37) due to its liquid nature. With such a high diffusivity, Na concentration gradient is unlikely to develop inside NaK alloy, therefore the vertically inhomogeneous mass density variations observed in Fig. 4c is most likely a result of insufficient liquid flow to compensate for mass loss due to Na stripping at the interface. Third, apart from mass decrease regions, a visually comparable number of mass increase grains are also present near the NaK/NASICON interface as seen in both Fig. 4c and d, which is unusual given that Na stripping should be driving overall mass decrease inside the anode area.
Fig. 4e quantifies the total voxel volume of both mass increase and mass decrease across different vertical positions inside the NaK@CC anode after critical stripping. Mass increase and decrease steadily accumulates at the NaK/NASICON interface. Such interfacial mass accumulation is likely a sign of liquid–solid phase separation due to de-sodiation of the NaK50 alloy near the interface. As demonstrated in Fig. 4f, Na metal is constantly removed from the NaK during stripping process. As the NaK liquid flow is hindered by carbon cloths, NaK liquid near the NaK/NASICON interface stripped further than the bulk, and the resultant significant volume shrinkage will drive void formation. When the Na content reaches bulk phase transformation limit (Fig. S3a†), liquid–solid phase separation will occur in the form of K metal precipitation at the NaK/NASICON interface. Such phase separation would explain why mass accumulation is observed upon critical stripping of NaK50@CC anodes. A more comprehensive view of the stripping process is shown in Fig. S7† with a sequence of 3D mass variation maps obtained over critical stripping process of the NaK50@CC anode, demonstrating how such mass variation developed during the Na stripping process. Over the first half of the critical stripping process (maps 2-1 and 3-1), mass variation mostly occur over a small area in the FOV without significant interfacial developments, most likely due to liquid flow and volume changes triggered by Na stripping. Liquid flow upon Na stripping/plating is expected, as the critical stripping capacity of NaK alloys measured in Fig. 1e reaches up to 90% of theoretical capacities of NaK under low stripping current (0.25 mA cm−2). This suggests that the majority of NaK alloy must migrate across the whole thickness of the electrode (∼250 μm, Fig. S7a†) and reach the NaK/NASICON interface to participate in electrochemistry. Under the high stripping current (1 mA cm−2) during the in situ XCT measurement, however, liquid flow is insufficient to compensate for the fast pore formation. As Na stripping proceeded, the cell voltage rose significantly, accompanied by mass accumulation and voiding at the NaK/NASICON interface.
Fig. 5a shows the voltage profile of the in situ cell that strips 0.5 mA h cm−2 of sodium and then plates it back. The numbers correspond to times when imaging was conducted. Voids at the NaK/NASICON interface grow upon electrodissolution (Fig. 5b). Some of these voids are filled upon deposition (e.g. mass increase) while others remain unfilled. Sodium metal is heavily concentrated at the interface upon deposition rather than alloying with the potassium. To visualize and quantify the Na stripping–plating process, 3D mass variation maps I–IV and corresponding virtual grain average volume distribution plots (Fig. 5c–f) were obtained by subtracting the pristine or Na-plated scan from scans taken at different cycling stages (Fig. 5a). During Na stripping (map I, Fig. 5c), mass decrease grains near the NaK/NASICON dominate the map, with little to no mass increase grains observed. This is consistent with the Na removal process. Notably, the average mass decrease grain volume spiked at ∼350 μm region near the interface, which likely suggests void formation. No phase separation occurred at this point. After 0.5 mA h cm−2 of Na metal is stripped, however, the average volume of mass increase grains shows an increase near the NaK/NASICON interface, with the continued voiding and mass depletion (Fig. 5d). This shows that even at much lower current density and Na stripping capacity, NaK liquid flow inside NaK50@CC anodes is still not sufficient to compensate interfacial Na loss to prevent liquid–solid phase separation. Upon Na plating, mass increase grains begin to accumulate at the NaK/NASICON interface immediately while mass variation in other parts of the NaK50@CC anode is negligible (Fig. 5e). In particular, a spike in the average mass increase grain volume occurred at ∼350 μm near the interface, which likely corresponds precipitated large Na metal islands. The presence of Na metal islands is the result of both insufficient NaK liquid flow and residual interfacial voids that formed upon Na stripping, as Na metal would immediately dissolve if plated directly into NaK liquid at the anode–electrolyte interface due to facile Na diffusion inside NaK.37 Upon further plating, mass variations then propagates deeper into the NaK50@CC anode (Fig. 5f). The formation of Na islands upon Na plating is consistent with in situ EIS results on NaK@CC anodes shown in Fig. 3b–d, where the interfacial impedance peak configuration immediately changed when switching from Na stripping to Na plating with dominant peak overlapping with Na metal stripping–plating DRT (Fig. S5b†).
 | ||
| Fig. 5 In situ XCT collected over a Na stripping–plating cycle on NaK50. (a) Voltage profile of the in situ cell. (b) Sections of reconstructed virtual cross-section at pristine (scan 1), Na stripped (scan 3) and Na plated (scan 5) states. (c–f) 3D mass variation maps & virtual grain average volume distributions at different cycling stages. | ||
The in situ XCT results over the critical stripping and Na stripping–plating processes of NaK50@CC anodes demonstrate that although fibrous and porous carbon substrates help reduce the macroscopic surface tension of NaK liquids and confine liquid flow to achieve a self-standing liquid metal anode, the strong interactions between the NaK and carbon fibers becomes a severe drawback that almost annihilates the advantages of a liquid anode. The interfacial compound KC8 forms between carbon fibers and NaK liquids upon contact,30 resulting in higher NaK–C affinity, thus partially restricting the liquid flow. The insufficient liquid flow upon Na stripping eventually leads to interfacial contact loss due to voiding and liquid–solid phase separation, causing anode overpotential increase. Upon Na plating, interfacial heterogeneity worsens due to formation of isolated large Na islands. Such heterogeneous Na stripping–plating behavior of NaK50@CC anodes leads to severe interfacial degradation upon repeated cycling due to current focusing, which would explain the low CCD compared to Na metal under high external pressure (Fig. 1b).
Impact of phase separation on electrochemical cycling
To further probe the cycling behavior of NaK@CC anodes, 10-cycle cyclic voltammetry (CV) tests were performed on NaK/NASICON/Na cells with NaK@CC working electrodes and Na counter electrodes at 10 mV s−1 scan rate (Fig. 6). For reference, the first-cycle CV scans on Na metal, NaK50, 65 and 80 working electrodes are plotted together in Fig. S8a.† The CV of Na metal working electrode is a near-perfect straight line inside the voltage window, demonstrating facile interfacial Na transport without mass diffusion limitations.40 We note that a straight-line CV can also be interpreted as a sign of internal short circuit of the cell due to metal filament penetration of solid electrolytes,41 therefore EIS measurement was taken after the first CV scan on the Na work electrode (Fig. S8b†), demonstrating that the cell is electrochemically intact without short circuiting. In contrast to Na metal, NaK@CC working electrodes all demonstrate asymmetric CV curves, with a visible loop in the positive voltage (Na stripping) region and a semi-straight line in the negative voltage (Na plating) region. The current density over the Na stripping scans of NaK electrodes decreases with increasing K content, while the Na plating current density are almost the same for all including Na metal. The first-cycle CV results indicate two things. First, the mass transport of NaK@CC anodes worsens with increasing K content, which is likely caused by stronger interactions between carbon fibers and NaK liquids at high K content, consistent with the (in situ) EIS results and wrap-around NaK@CC geometry demonstrated in the above sections. Second, the uniform Na plating behavior is consistent with conclusions drawn from in situ EIS and in situ XCT experiments, where Na metal immediately precipitates upon Na plating. Such cycling behavior is further demonstrated in the 10-cycle CV results shown in Fig. 6a–c. For all three types of NaK@CC working electrodes, an oxidation peak emerged & intensified at ∼0.2 V over the cycles. This type of CV profile, with a near-linear current response in the negative potential region and a peak in the positive potential region, resembles metal anode plating–stripping behavior reported in conventional aqueous Zn batteries.42,43 In our case, the emerging oxidation peak at ∼0.2 V should then correspond to the electrochemical dissolution of Na metal (Na – e− → Na+). The peak area increase over the cycles suggests ever-increasing amount of Na metal accumulated at the NaK/NASICON interface. With NaK80@CC electrode having the worst interfacial contact, Na metal accumulation is the most severe. Based on electrochemical testing & characterization results so far, Fig. 6d–f demonstrates how anode–electrolyte interfacial degradation develops as a result of insufficient liquid flow inside NaK@CC anodes. Upon initial Na stripping, interfacial voiding occurs. During subsequent Na plating, regions where NaK liquid is present can maintain a liquid–solid anode electrolyte interface, however, regions with voids will see the nucleation and growth of Na metal. When the current flips again to proceed with a second Na stripping, regions with Na metal likely experiences heterogeneous stripping, leaving more voids behind. As this cycle continues, Na metal continue to accumulate at the NaK/NASICON interface, which would eventually lead to cell failure as heterogeneous solid–solid interface leads to Na filament growth. Long-term cycling experiments of Na metal & NaK@CC anodes demonstrates such degradation, as NaK anodes all showed continuous overpotential increase and short-circuit failure, while Na metal can operate steadily (Fig. S9a†). It's worth mentioning that although the impact of external pressure on electrochemistry of NaK@CC anodes is not apparent during CCD and critical stripping experiments, long term cycling results at 2 MPa shows that NaK50 & NaK65 suffered from soft short circuit very early into the cycling, while NaK80@CC anode experienced severe contact loss (Fig. S9b†).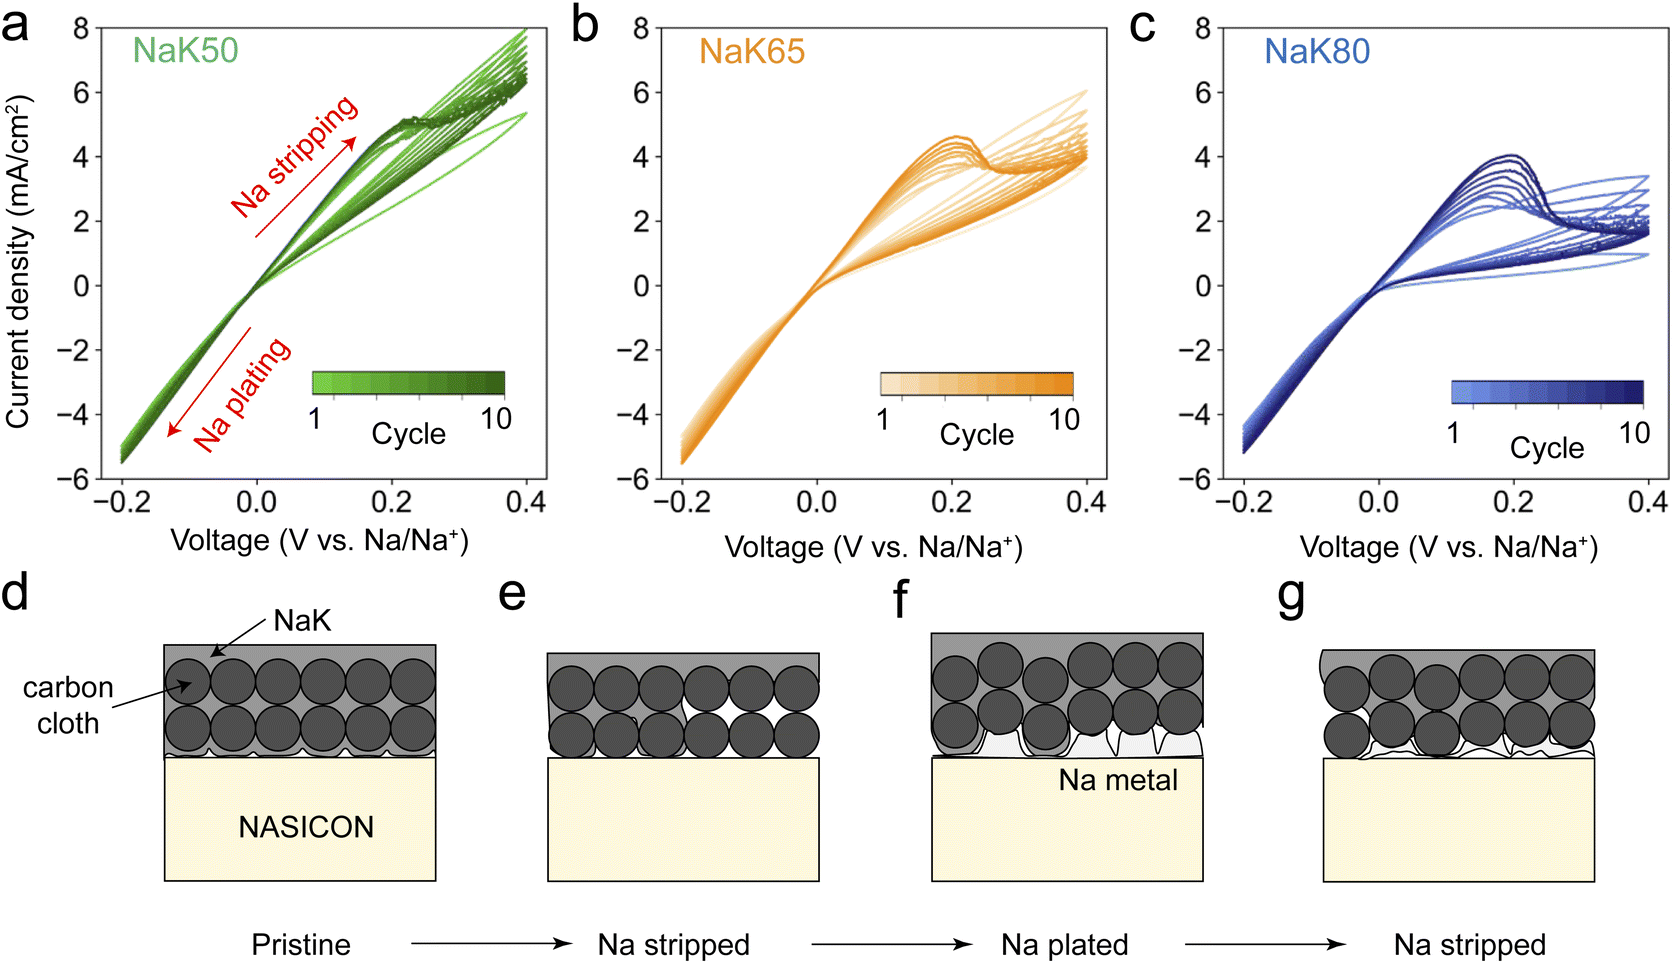 | ||
| Fig. 6 (a–c) 10-Cycle cycling voltammetry (CV) of NaK50 (a), NaK65 (b) and NaK80 (c) at 10 mV s−1 scan rate. (d–g) schematics showing the interfacial degradation mechanism resulted from interfacial voiding & Na metal accumulation over repeated Na stripping–plating process. | ||
Conclusions
In this work, electrochemical testing, diagnosis and in situ synchrotron imaging performed on self-standing liquid Na–K alloy anodes in solid-state Na-ion batteries demonstrated the difficulty to maintain a conformal liquid–solid anode–electrolyte interface with porous carbon substrates as a liquid metal substrate. The interaction between the liquid NaK alloys and carbon cloth fibers is a double-edged sword for this type of solid state battery: on the good side, carbon cloth reduces the macroscopic surface tension of NaK alloys to make better contact with solid-state NASICON electrolytes, at the same time confines the liquid flow so that no complex battery cell design is needed on the anode side; on the bad side, carbon cloth limits the microscopic liquid flow of NaK anodes, which cancels out the advantages of facile mass transport inside liquid metals and resulted in heterogeneous Na stripping–plating at the NaK/NASICON interface, causing liquid–solid phase separation and eventually lead to cell failure. To maintain the advantages of self-standing liquid metal anodes in solid-state batteries, structure engineering on the carbon substrates and chemical modifications on the NaK liquid alloys are needed to achieve the balance between mechanical integrity and fluidity.Data availability
The data supporting this article have been included as part of the ESI.†Conflicts of interest
There are no conflicts to declare.Acknowledgements
This work was funded by the U.S. Department of Energy (DOE) under grant DE-SC0023462. This research used resources of the National Synchrotron Light Source II, a DOE Office of Science user facility operated for the DOE Office of Science by Brookhaven National Laboratory. The authors acknowledge the use of the Imaging and Analysis Center (IAC) operated by the Princeton Materials Institute at Princeton University, which is supported in part by the Princeton Center for Complex Materials (PCCM), a National Science Foundation (NSF) Materials Research Science and Engineering Center (MRSEC; DMR-2011750). The research used resources from 27-ID (HEX_ of the National Synchrotron Light Source II, a U.S. Department of Energy Office of Science User Facility operated by Brookhaven National Laboratory under contract No. DE-SC0023462.References
- F. Yang, L. Xin, A. Uzunoglu, L. Stanciu, J. Ilavsky, S. Son and J. Xie, Investigation of Solvent Effects on the Dispersion of Carbon Agglomerates and Nafion Ionomer Particles in Catalyst Inks Using Ultra Small Angle X-Ray Scattering Method, ECS Trans., 2016, 75, 361–371 CrossRef CAS
.
- N. Yabuuchi, K. Kubota, M. Dahbi and S. Komaba, Research development on sodium-ion batteries, Chem. Rev., 2014, 114, 11636–11682 CrossRef CAS PubMed
- M. B. Dixit, N. Singh, J. P. Horwath, P. D. Shevchenko, M. Jones, E. A. Stach, T. S. Arthur and K. B. Hatzell,
In situ investigation of chemomechanical effects in thiophosphate solid electrolytes, Matter, 2020, 3, 2138–2159 CrossRef
- A. N. Mistry, K. Smith and P. P. Mukherjee, Secondary-Phase Stochastics in Lithium-Ion Battery Electrodes, ACS Appl. Mater. Interfaces, 2018, 10, 6317–6326 CrossRef CAS PubMed
- K. B. Hatzell, X. C. Chen, C. L. Cobb, N. P. Dasgupta, M. B. Dixit, L. E. Marbella, M. T. McDowell, P. P. Mukherjee, A. Verma and V. Viswanathan,
et al., Challenges in lithium metal anodes for solid-state batteries, ACS Energy Lett., 2020, 5, 922–934 CrossRef CAS
- A. Mistry and P. P. Mukherjee, Molar volume mismatch: A malefactor for irregular metallic electrodeposition with solid electrolytes, J. Electrochem. Soc., 2020, 167, 082510 CrossRef CAS
- M. Dixit, B. Harkey, F. Shen and K. B. Hatzell, Catalyst layer ink interactions that affect coatability, J. Electrochem. Soc., 2018, 165, F1–F8 CrossRef
- M. B. Dixit, A. Verma, W. Zaman, X. Zhong, P. Kenesei, J. S. Park, J. Almer, P. P. Mukherjee and K. B. Hatzell, Synchrotron imaging of pore formation in Li metal solid-state batteries aided by machine learning, ACS Appl. Energy Mater., 2020, 3, 9534–9542 CrossRef CAS
- M. B. Dixit, W. Zaman, N. Hortance, S. Vujic, B. Harkey, F. Shen, W.-Y. Tsai, V. De Andrade, X. C. Chen and N. Balke,
et al., Nanoscale Mapping of Extrinsic Interfaces in Hybrid Solid Electrolytes, Joule, 2020, 4(1), 207–221 CrossRef CAS
- X. Guo, L. Zhang, Y. Ding, J. B. Goodenough and G. Yu, Room-temperature liquid metal and alloy systems for energy storage applications, Energy Environ. Sci., 2019, 12, 2605–2619 RSC
- S. Zhang, Y. Liu, Q. Fan, C. Zhang, T. Zhou, K. Kalantar-Zadeh and Z. Guo, Liquid metal batteries for future energy storage, Energy Environ. Sci., 2021, 14, 4177–4202 RSC
- S. S. Leonchuk, A. S. Falchevskaya, V. Nikolaev and V. V. Vinogradov, NaK alloy: underrated liquid metal, J. Mater. Chem. A, 2022, 10, 22955–22976 RSC
- Y. Cheng, M. Li, X. Yang, X. Lu, D. Wu, Q. Zhang, Y. Zhu and M. Gu, Na–K Alloy Anode for High-Performance Solid-State Sodium Metal Batteries, Nano Lett., 2022, 22, 9614–9620 CrossRef CAS PubMed
- K. Yin, D. Chen, C. Yin, Y. Zhong, X. Wang and J. Tu, Suppressing Dendrite Growth with Quasi-liquid Anode in Solid-State Sodium Metal Batteries Enabled by the Design of Na-K Alloying Strategy, J. Electron. Mater., 2023, 52, 5352–5361 CrossRef CAS
- R. J.-Y. Park, C. M. Eschler, C. D. Fincher, A. F. Badel, P. Guan, M. Pharr, B. W. Sheldon, W. C. Carter, V. Viswanathan and Y.-M. Chiang, Semi-solid alkali metal electrodes enabling high critical current densities in solid electrolyte batteries, Nat. Energy, 2021, 6, 314–322 CrossRef CAS
- J. Suo, Q. Zhao, H. Tian, L. Wang, L. Dai, J. Luo and S. Liu, Designing a Quasi-Liquid Alloy Interface for Solid Na-Ion Battery, ACS Nano, 2023, 17, 10229–10235 CrossRef CAS PubMed
- H. Koh, M. H. Hassan, S. Lin, L. Wang, E. A. Stach and E. Detsi, Liquid Na-K alloy is not viable anode material for High-Performance Na-Ion batteries, Chem. Eng. J., 2024, 490, 151578 CrossRef CAS
- H. Tian, S. Liu, L. Deng, L. Wang and L. Dai, New-type Hf-based NASICON electrolyte for solid-state Na-ion batteries with superior long-cycling stability and rate capability, Energy Storage Mater., 2021, 39, 232–238 CrossRef
- X. Guo, Y. Liu, X. Zhang, Z. Ju, Y. Li, D. Mitlin and G. Yu, Revealing the Solid-State Electrolyte Interfacial Stability Model with Na–K Liquid Alloy, Angew. Chem., Int. Ed., 2022, 61, e202203409, DOI:10.1002/anie.202203409
- T. Ortmann, S. Burkhardt, J. K. Eckhardt, T. Fuchs, Z. Ding, J. Sann, M. Rohnke, Q. Ma, F. Tietz, D. Fattakhova-Rohlfing, C. Kübel, O. Guillon, C. Heiliger and J. Janek, Kinetics and Pore Formation of the Sodium Metal Anode on NASICON-Type Na3.4Zr2Si2.4P0.6O12 for Sodium Solid-State Batteries, Adv. Energy Mater., 2023, 13, 2202712, DOI:10.1002/aenm.202202712
-
M. Drakopoulos, Z. Zhong, N. Vo, A. Broadbent and M. Lucas, HEX: A New High Energy Beamline at NSLS-II, Synchrotron Radiation News, 2024, vol. 37, pp. 50–51 Search PubMed
- N. T. Vo, R. C. Atwood, M. Drakopoulos and T. Connolley, Data processing methods and data acquisition for samples larger than the field of view in parallel-beam tomography, Opt. Express, 2021, 29, 17849–17874 CrossRef PubMed
- N. T. Vo, R. C. Atwood and M. Drakopoulos, Superior techniques for eliminating ring artifacts in X-ray micro-tomography, Opt. Express, 2018, 26, 28396–28412 CrossRef PubMed
- X-Ray Mass Attenuation Coefficients, 2009, https://www.nist.gov/pml/x-ray-mass-attenuation-coefficients, accessed 04/14/2025 Search PubMed.
- S. Becker, N. Meyer, H. Xu and J.-F. Wax, Viscosity of liquid Na–K alloys from molecular dynamics simulations, J. Phys.: Condens. Matter, 2020, 32, 194005 CrossRef CAS PubMed
- B. B. Alchagirov, L. K. Afaunova, F. F. Dyshekova, Z. A. Kegadueva, A. G. Mozgovoi, R. K. Arkhestov, T. M. Taova and K. B. Khokonov, Surface tension and adsorption of components in the sodium-potassium alloy systems: Effective liquid metal coolants promising in nuclear and space power engineering, Inorg. Mater. Appl. Res., 2011, 2, 461–467 CrossRef
- S. S. Leonchuk, A. S. Falchevskaya, V. Nikolaev and V. V. Vinogradov, NaK alloy: underrated liquid metal, J. Mater. Chem. A, 2022, 10, 22955–22976 RSC
- X. Guo, J. Bae, Y. Ding, X. Zhang and G. Yu, Liquid Alloy Enabled Solid-State Batteries for Conformal Electrode–Electrolyte Interfaces, Adv. Funct. Mater., 2021, 31, 2010863, DOI:10.1002/adfm.202010863
- L. Zhang, Y. Li, S. Zhang, X. Wang, X. Xia, D. Xie, C. Gu and J. Tu, Non-Newtonian Fluid State K–Na Alloy for a Stretchable Energy Storage Device, Small Methods, 2019, 3, 1900383 CrossRef CAS
- L. Zhang, S. Peng, Y. Ding, X. Guo, Y. Qian, H. Celio, G. He and G. Yu, A graphite intercalation compound associated with
liquid Na–K towards ultra-stable and high-capacity alkali metal anodes, Energy Environ. Sci., 2019, 12, 1989–1998 RSC
- C. H. Kean, The Pressure-Temperature Phase Diagram of Na-K Alloys and the Effect of Pressure on the Resistance of the Liquid Phase, Phys. Rev., 1939, 55, 750–754 CrossRef CAS
- H. Schichlein, A. Müller, M. Voigts, A. Krügel and E. Ivers-Tiffée, Deconvolution of electrochemical impedance spectra for the identification of electrode reaction mechanisms in solid oxide fuel cells, J. Appl. Electrochem., 2002, 32, 875–882 CrossRef CAS
- Y. Lu, C.-Z. Zhao, R. Zhang, H. Yuan, L.-P. Hou, Z.-H. Fu, X. Chen, J.-Q. Huang and Q. Zhang, The carrier transition from Li atoms to Li vacancies in solid-state lithium alloy anodes, Sci. Adv., 2021, 7, eabi5520 CrossRef CAS PubMed
- Y. Lu, C.-Z. Zhao, J.-K. Hu, S. Sun, H. Yuan, Z.-H. Fu, X. Chen, J.-Q. Huang, M. Ouyang and Q. Zhang, The void formation behaviors in working solid-state Li metal batteries, Sci. Adv., 2022, 8, eadd0510 CrossRef CAS PubMed
- J. K. Eckhardt, P. J. Klar, J. Janek and C. Heiliger, Interplay of Dynamic Constriction and Interface Morphology between Reversible Metal Anode and Solid Electrolyte in Solid State Batteries, ACS Appl. Mater. Interfaces, 2022, 14, 35545–35554 CrossRef CAS PubMed
- C. G. Haslam, J. K. Eckhardt, A. Ayyaswamy, B. S. Vishnugopi, T. Fuchs, D. W. Liao, N. P. Dasgupta, P. P. Mukherjee, J. Janek and J. Sakamoto, Evaluating Pressure-dependent Discharge Behavior of Foil Versus In situ Plated Lithium Metal Anodes in Solid-State Batteries, Adv. Energy Mater., 2024, 2403614 Search PubMed
- R. V. Gopala Rao and A. K. Murthy, Self diffusion in liquid Na-K alloy, Pramana, 1977, 9, 587–592 CrossRef
- P. J. Withers, C. Bouman, S. Carmignato, V. Cnudde, D. Grimaldi, C. K. Hagen, E. Maire, M. Manley, A. Du Plessis and S. R. Stock, X-ray computed tomography, Nat. Rev. Methods Primers, 2021, 1, 1–21 CrossRef
- T. Krauskopf, B. Mogwitz, C. Rosenbach, W. G. Zeier and J. Janek, Diffusion Limitation of Lithium Metal and Li–Mg Alloy Anodes on LLZO Type Solid Electrolytes as a Function of Temperature and Pressure, Adv. Energy Mater., 2019, 9, 1902568 CrossRef CAS
- N. Elgrishi, K. J. Rountree, B. D. McCarthy, E. S. Rountree, T. T. Eisenhart and J. L. Dempsey, A Practical Beginner's Guide to Cyclic Voltammetry, J. Chem. Educ., 2018, 95, 197–206 CrossRef CAS
- C. Wang, T. Deng, X. Fan, M. Zheng, R. Yu, Q. Lu, H. Duan, H. Huang, C. Wang and X. Sun, Identifying soft breakdown in all-solid-state lithium battery, Joule, 2022, 6, 1770–1781 CrossRef CAS
- R. Zhao,
et al., Prioritizing Hetero-Metallic Interfaces via Thermodynamics Inertia and Kinetics Zincophilia Metrics for Tough Zn-Based Aqueous Batteries, Adv. Mater., 2023, 35, 2209288 CrossRef CAS PubMed
- S.-D. Han, N. N. Rajput, X. Qu, B. Pan, M. He, M. S. Ferrandon, C. Liao, K. A. Persson and A. K. Burrell, Origin of Electrochemical, Structural, and Transport Properties in Nonaqueous Zinc Electrolytes, ACS Appl. Mater. Interfaces, 2016, 8, 3021–3031 CrossRef CAS PubMed
Footnote |
| † Electronic supplementary information (ESI) available. See DOI: https://doi.org/10.1039/d5ta02407b |
| This journal is © The Royal Society of Chemistry 2025 |