
 Open Access Article
 This Open Access Article is licensed under a
 Creative Commons Attribution 3.0 Unported Licence
Dietary fiber mitigates the differential impact of beef and chicken meat consumption on rat intestinal health†
Núria
Elias Masiques
 a,
Jo
De Vrieze
bc,
Lieselot Y.
Hemeryck
d,
Lynn
Vanhaecke
de,
Stefaan
De Smet
a and
Thomas
Van Hecke
*a
a,
Jo
De Vrieze
bc,
Lieselot Y.
Hemeryck
d,
Lynn
Vanhaecke
de,
Stefaan
De Smet
a and
Thomas
Van Hecke
*a
aLaboratory for Animal Nutrition and Animal Product Quality, Department of Animal Sciences and Aquatic Ecology, Ghent University, Coupure Links 653, B-9000, Ghent, Belgium. E-mail: thomas.vanhecke@ugent.be; Tel: +32 9 264 90 03
bCenter for Microbial Ecology and Technology, Ghent University, Frieda Saeysstraat 1, B-9052 Gent, Belgium
cCentre for Advanced Process Technology for Urban Resource recovery (CAPTURE), Frieda Saeysstraat 1, B-9052 Gent, Belgium
dLaboratory of Integrative Metabolomics, Faculty of Veterinary Medicine, Ghent University, Salisburylaan 133, B-9820, Merelbeke, Belgium
eInstitute for Global Food Security, School of Biological Sciences, Queen's University, University Road, Belfast, UK
First published on 22nd April 2025
Abstract
In this rat feeding study, it was hypothesized that the impact of red (vs. white) meat consumption on gut health is more pronounced in fiber-deprived diets, whereas fiber-rich diets may attenuate meat-related differences. For this purpose, rats were fed a red (beef) or white (chicken) meat diet with and without fructo-oligosaccharides (FOS) for three weeks. Gut health was assessed through colonic microbiota, fermentation metabolites, oxidative stress, inflammation, DNA adducts and histology. In rats on the fiber-deprived diets, beef consumption resulted in higher abundance of mucin-degrading bacteria Akkermansia and lower blood glutathione levels compared to chicken-fed rats. Adding FOS to the meat diets modulated the gut microbiota and fermentation metabolites, affected oxidative stress and inflammation markers in tissues and blood, increased colon length, and reduced fat deposition and liver weight. Thus, results showed that the dietary context should be considered when evaluating the impact of red meat consumption on gut health.
1. Introduction
High red meat consumption has been linked to an increased risk of various chronic diseases in humans, although the mechanisms underlying these associations remain controversial and not yet fully elucidated.1,2 Heme iron, found in higher concentrations in red meat than in white meat, is hypothesized to be involved in intestinal inflammation, potentially by altering the composition of the gut microbiota.3Rodent feeding studies have shown that heme or heme-rich beef consumption can induce a microbial shift characterized by decreased abundance of Lactobacillus spp., and increased abundances of mucin-degrading Akkermansia muciniphila and sulfate-reducing bacteria Desulfovibrionaceae, along with higher fecal levels of hydrogen sulfide (H2S), carbon disulfide (CS2), and their derived metabolites.4–7 Hydrogen sulfide is hypothesized to reduce the disulfide bonds of the protective intestinal mucin layer, thereby exposing the underlying colon cells to bacteria and toxins, and promoting inflammation and oxidative stress.8 In addition, heme iron is proposed to stimulate the formation of N-nitroso compounds (NOCs) and lipid oxidation products in the lumen. In turn, these reactive compounds may initiate DNA damage via the formation of DNA adducts in colonocytes.4,9 High red meat consumption in human volunteers has been associated with higher levels of fecal NOCs and elevated levels of O6-carboxymethyl-guanine (O6CMG) in colonic exfoliated cells, presumably formed by the reaction of DNA with NOCs.10 Therefore, O6CMG has been proposed as a potential biomarker for DNA carboxymethylation linked to meat consumption.
A high dietary fiber intake has been associated with a reduced risk of developing various chronic diseases.11 The beneficial effects of dietary fiber are attributed to its direct influence on gut physiology and its indirect role in modulating the gut microbiota.11 Fiber-degrading bacteria use the undigested complex carbohydrates as an energy source, producing short-chain fatty acids (SCFA), primarily butyrate, acetate and propionate, along with smaller amounts of valerate and caproate.12 A diet low in dietary fiber may result in a reduction of fermentable carbohydrates available in the colon, increasing proteolytic fermentation as an energy source for bacteria.13 Protein fermentation yields a diverse range of metabolites, including the aforementioned H2S and CS2, but also ammonia, and indolic and phenolic compounds, among others.14 Hence, the dietary fiber to protein ratio in the colon is crucial for maintaining gut health. Indeed, fiber deprivation favours the growth of bacteria that utilize mucin glycans as an energy source, leading to the erosion of the colonic mucus layer.15 This highlights the significant relationship between diet, microbiota composition, and colonic health.
In this study, rats were fed a diet high in red (beef) or white (chicken) meat with or without added fructo-oligosaccharides (FOS), following a 2 × 2 factorial design. We hypothesized that the differential effects of red versus white meat consumption on gut health would be more pronounced in fiber-deprived diets and attenuated in fiber-rich diets. The FOS was chosen for its well-known prebiotic effects, and for its capacity to reduce protein fermentation during in vitro large intestinal fermentation of meats.16,17 Following three weeks on the experimental diets, the gut microbial composition in the colon, fecal and cecal metabolites related to fiber fermentation (SCFA), protein fermentation (indole, cresol, phenol, ammonia) and sulfur metabolites (CS2, dimethyl sulfides and methanethiol), oxidative stress (thiobarbituric acid reactive substances (TBARS), protein carbonyl compounds (PCC), glutathione and glutathione peroxidase activity), DNA adducts, histology, and inflammation (C-reactive protein) markers were assessed.
2. Materials and methods
2.1 Chemicals
Fructo-oligosaccharides (FOS) from chicory (F8052) and standards for volatile organic compound analysis (indole [>99%, I3408], p-cresol [>99%, C85751], dimethyl disulfide [>99%, 471569], and phenol [>99%, 33517]), as well as 1,1,3,3-tetramethoxypropane [>99%, 108383], glutathione [G1404], and oxidized glutathione [49740] were purchased from Merck (Diegem, Belgium). Analytical standards for the analysis of the DNA adducts pyrimidopurinone-guanine (M1–G), methylhydroxy-propano-deoxyguanosine (Cro-dG), O6-methyl-deoxyguanine (O6-Me–dG), and their internal standards M1G-13C3, Cro-dG-13C3,15N2 and O6-d3-MedG, along with N3-methyl-adenine (N3-MeA), N6-methyl-adenoside (N6-Me-dA), N7-methyl-guanine (N7-MeG), and N2-deoxy-N-ethylguanosine (N2-Et-dG) were acquired from Toronto Research Chemicals (Toronto, Canada). O6-carboxymethyl-deoxyguanine (O6-CM-dG) was kindly provided by Prof. S. Moore from Liverpool John Moores University (UK). O6-carboxymethyl-guanine (O6-CMG), O6-methyl-guanine (O6-MeG), N6-methyladenosine (N6-MeA), N2-ethyl-guanine (N2-EtG), and methylhydroxy-propanoguanine (Cro-G) were obtained by hydrolysis of their corresponding nucleosides (O6-CM-dG, O6-Me-dG, N6-Me-dA, N2-Et-dG and Cro-dG, respectively) in 0.1 M formic acid at 80° C for 30 min.2.2 Animals and experimental set-up
The rat experiment was conducted following the principles of laboratory animal care and the Belgian law on the protection of animals. The experiment was approved by the Ghent University Ethical Committee (ECD 21-68), and performed at the Core ARTH Animal Facilities of Ghent University (BOF/COR/2022/007). Forty male Sprague Dawley rats (±200 g, 7 weeks old) (Janvier Laboratories, Le Genest-Saint-Isle, France) were housed at four rats per cage during an adaptation period of 10 days under environmental conditions of 22.0 ± 0.6 °C, 75 ± 5% humidity and 15 h daylight. During this period, the rats were fed a standard laboratory diet (Ssniff R/M–N pellets) (Ssniff, Soest, Germany), and water was provided ad libitum. After the adaptation period, the rats were housed in pairs and randomly assigned to one of the four experimental diets. The rats were fed an experimental diet including beef or chicken, with or without 4% FOS addition to the diets, for 3 weeks. The specific composition of the experimental diets is shown in Table 1. Fresh diets were provided daily and offered ad libitum. Body weight and feed intake were monitored every 2 days at the cage level. On day 17, the rats were individually housed for 24 h for fecal collection. At the end of the experiment (21 days on the experimental diets), the rats were anaesthetized with 5% isoflurane gas, followed by blood collection by cardiac puncture into heparin tubes until death occurred. Immediately after blood collection, plasma and red blood cells (RBC) were separated by low-speed centrifugation and divided into several aliquots. Organs (colon mucosa, duodenal mucosa, heart, kidneys, and liver) and fat deposits (mesenteric and retroperitoneal) were carefully rinsed with 0.9% NaCl solution, weighed and divided into aliquots. The colon length was measured, and the tissue was subdivided. The colon mucosa of the proximal half was collected and stored as such for oxidative parameters, whereas the colon mucosa of the distal half was stored in 95% ethanol for the analysis of DNA adducts. One cm in the middle of the colon was stored in a 4% aqueous formaldehyde solution for histological analysis. All aliquots were snap-frozen in liquid nitrogen and stored at −80 °C until further analysis.| Beef | Chicken | ||||
|---|---|---|---|---|---|
| −FOS | +FOS | −FOS | +FOS | ||
| A modified Ca–P deficient mineral mixture (TD.79055, Harlan Laboratories, Indianapolis, USA) and the vitamin mixture AIN76 vitamin (MP Biomedicals, Brussels, Belgium) were used. FOS = fructo-oligosaccharides; SFA = saturated fatty acids; MUFA = monounsaturated fatty acids; PUFA = polyunsaturated fatty acids; LA = linoleic acid (C18:2n-6); LC n-6 PUFA = long chain n-6 polyunsaturated fatty acids (C20:2n-6; C20:3n-6; C20:4n-6; C22:4n-6; C22:5n-6); ALA = α-linolenic acid (C18:3n-3); LC n-3 PUFA = long chain n-3 polyunsaturated fatty acids (C20:4n-3; C20:5n-3; C22:5n-3; C22:6n-3); TBARS = thiobarbituric acid reactive substances; PCC = protein carbonyl compounds; FAME = fatty acid methyl esters. | |||||
| Ingredients | |||||
| Meat | g kg−1 | 650 | 650 | 650 | 650 |
| Muscle | g kg−1 | 553 | 553 | 553 | 553 |
| Lard | g kg−1 | 97.5 | 97.5 | 97.5 | 97.5 |
| Sucrose | g kg−1 | 247 | 207 | 247 | 207 |
| FOS | g kg−1 | 0.00 | 40.0 | 0.00 | 40.0 |
| Corn starch | g kg−1 | 60.0 | 60.0 | 60.0 | 60.0 |
| Cellulose | g kg−1 | 10.0 | 10.0 | 10.0 | 10.0 |
| Mineral mixture | g kg−1 | 13.4 | 13.4 | 13.4 | 13.4 |
| Vitamin mixture | g kg−1 | 6.31 | 6.31 | 6.31 | 6.31 |
| Calcium carbonate | g kg−1 | 1.09 | 1.09 | 1.09 | 1.09 |
| Choline bitartrate | g kg−1 | 1.20 | 1.20 | 1.20 | 1.20 |
| Safflower oil | g kg−1 | 10.8 | 10.8 | 10.8 | 10.8 |
| Macronutrients | |||||
| Dry matter | % | 58.5 | 57.4 | 57.2 | 57.1 |
| Crude fat | % | 8.60 | 7.71 | 7.74 | 7.92 |
| Crude protein | % | 13.9 | 14.2 | 15.4 | 14.8 |
| Crude ash | % | 1.67 | 1.78 | 1.67 | 1.73 |
| SFA | % FAME | 30.7 | 30.5 | 30.5 | 30.3 |
| MUFA | % FAME | 38.3 | 38.6 | 39.7 | 38.3 |
| PUFA | % FAME | 27.7 | 26.8 | 27.2 | 28.1 |
| LA | % FAME | 25.9 | 25.1 | 25.2 | 26.0 |
| LC n-6 PUFA | % FAME | 0.58 | 0.59 | 0.72 | 0.82 |
| ALA | % FAME | 0.95 | 0.97 | 1.01 | 1.06 |
| LC n-3 PUFA | % FAME | 0.09 | 0.05 | 0.26 | 0.27 |
| n-6/n-3 | 25.6 | 25.2 | 20.4 | 20.2 | |
| Heme iron | mg kg−1 | 9.34 | 9.83 | 0.78 | 0.72 |
| Oxidative status | |||||
| Total TBARS | nmol g−1 | 107 | 115 | 72.8 | 67.1 |
| PCC | nmol per mg protein | 2.55 | 2.90 | 2.65 | 2.26 |
2.3 Diet formulation and characterisation
Lard and lean muscle samples from beef (musculus semimembranosus) and chicken (musculus pectoralis profundus) were purchased as fresh as possible from a local meat retailer. Meats and lard were manually chopped and minced in a grinder (Omega T-12) equipped with a 10 mm plate. To minimize variations in the fatty acid profile of the diets, lard was added to the muscles at a proportion of 15% relative to the meat weight. Next, the meat batches were manually homogenized, vacuum packed in equal weights and cooked in an oven until the core temperature reached 70° C. Finally, meat samples were cooled to room temperature and stored at 4° C. The next day, FOS (4% in final diets) was added to half of each meat batch, after which other ingredients were added to produce the experimental diets (Table 1). The experimental diets were vacuum packed in daily portions (±120 g) and stored at −20° C.Contents of dry matter (ISO 1442-1973), crude protein (ISO 937-1978), crude fat (ISO 1444-1973) and crude ash (ISO 5984-2002) were determined in the diets. Lipids were extracted using chloroform/methanol (2/1; v/v), and subsequently, fatty acid methyl esters (FAME) were prepared using methanolic NaOH (0.5 M) and methanolic HCl (1/5 v/v). FAME was analyzed using gas chromatography (HP6890, Brussels, Belgium).18 Nonadecanoic acid (C19:0) was used as an internal standard to quantify the fatty acids. Levels of total SFA (sum of C08:0, C10:0, C12:0, C14:0, C15:0, C16:0, C17:0, C18:0, C20:0 and C22:0), MUFA (sum of C14:1, C16:1, C17:1, c9C18:1, c11C18:1, and C20:1), n-3 PUFA (C18:3n-3, C20:3n-3, C20:4n-3 and C20:5n-3), ALA (C18:3n-3), long chain (LC) n-3 PUFA (sum of C20:4n-3, C20:5n-3, C22:5n-3 and C22:6n-3), n-6 PUFA (C18:2n-6, C18:3n-6, C20:2n-6, C20:3n-6 and C20:4n-6), LA (C18:2n-6) and LC n-6 PUFA (sum of C20:2n-6, C20:3n-6, C20:4n-6, C22:4n-6, C22:5n-6) were calculated. Heme iron was determined spectrophotometrically in the meats and calculated for the diet.19
2.4 Histology
Colonic tissue samples were fixed in a formaldehyde solution and processed in an automatic tissue processor under standard conditions (Shandon, Pittsburgh, PA, USA). In brief, the tissue was cut into small and homogeneous sections to be dehydrated and embedded in paraffin wax. Next, the embedded tissue was trimmed and placed on a microscope slide. Lastly, histological staining was performed on paraffine-embedded colonic sections with periodic acid Schiff (PAS) staining to assess crypt depth and the number of goblet cells per crypt. A minimum of four sections of colon tissue were assessed, with a total of 20 reads of well-oriented crypts per animal.2.5 Colonic microbial composition
The DNA extraction of colonic content was performed using bead beating with a PowerLyzer (Qiagen, Venlo, the Netherlands) and phenol/chloroform extraction.20 The DNA extract was sent out to LGC Genomics GmbH (Berlin, Germany) for library preparation and sequencing on an Illumina Miseq platform with v3 chemistry with the primers 341F (5′-CCT ACG GGN GGC WGC AG-3′) and 785Rmod (5′-GAC TAC HVG GGT ATC TAA KCC-3′). The total number of bacteria (bacterial density) was quantified using qPCR.21 A table containing the amplicon sequence variant (ASV) with their taxonomic assignments was generated. The raw fastq files have been deposited in the National Center for Biotechnology Information (NCBI) database (accession number PRJNA1164493). Differences in colonic bacterial communities were identified by using LEfSe (linear discriminant analysis effect size) (https://huttenhower.sph.harvard.edu/galaxy) between (1) dietary treatments as a main class, (2) FOS as a main class and meat as a subclass, and (3) meat as a main class and FOS as a subclass.22 The following conditions were applied: (1) alpha values for the factorial Kruskal–Wallis test among classes, and for the pairwise Wilcoxon test among subclasses were <0.05, (2) the threshold on the logarithmic LDA score for discriminative features was set to 2.0, and (3) the strategy for multi-class analysis was all-against-all.2.6 Fecal and cecal fermentation metabolites
Volatile organic compounds in feces were extracted using solid phase micro-extraction (SPME) with a carboxy-polydimethylsiloxane coated fibre (85 μm) and a Combi PAL autosampler (CTC Analytics, Zwingen, Switzerland). The gas chromatography-mass spectrometry (GC–MS) (Thermo, Finnigan) analyses were carried out on a fused silica capillary column (HP-5 column) of 30 m × 0.320 mm and 0.25 μm (Supelco, Bellefonte, PA, USA), according to Vossen et al.23 Peaks were integrated for area quantification by targeting the quantification ion as follows (m/z): indole 117; phenol 94; cresol 108; carbon disulfide 76; methanethiol 48; dimethyl disulfide 94; dimethyl trisulfide 126; hexanal 44; propionate 74; acetate 60, butyrate 60, and valerate 60. Results were expressed as area under the curve (AUC) per g of feces.Branched-chain fatty acids (iso-butyrate and iso-valerate) in cecal contents were measured by gas chromatography (HP 7890A, Agilent Technologies, Diegem, Belgium), equipped with a flame ionization detector and a Supelco Nukol capillary column (30 m × 0.25 mm × 0.25 μm, Sigma-Aldrich, Diegem, Belgium) as described by Gadeyne et al.24 In brief, 10% formic acid solution containing 2-ethylbutanoic acid as the internal standard was added to the cecal content. Following centrifugation (22![[thin space (1/6-em)]](https://www.rsc.org/images/entities/char_2009.gif) 000g at 4 °C), the supernatant was filtered and transferred into a glass vial, followed by injection on the GC. Ammonia was measured spectrophotometrically at 625 nm in the same supernatant of the cecal content, with a calibration curve of NH4Cl following the reaction with phenol, sodium nitroprusside, sodium hydroxide and sodium hypochlorite.25
000g at 4 °C), the supernatant was filtered and transferred into a glass vial, followed by injection on the GC. Ammonia was measured spectrophotometrically at 625 nm in the same supernatant of the cecal content, with a calibration curve of NH4Cl following the reaction with phenol, sodium nitroprusside, sodium hydroxide and sodium hypochlorite.25
2.7 Oxidative stress
Phosphate buffer (pH 7, 50 mM) was added to the frozen tissues at a 1:5 ratio (w/v). Samples were homogenized using Ultra Turrax and centrifuged (10 min, 12000g, 4° C). The supernatant was filtered through glass wool and transferred into different aliquots to immediately determine the activity of glutathione peroxidase (GSH-Px) and the content of TBARS. GSH-Px activity in plasma and organ extracts was measured by the oxidation of NADPH, whereby one unit of GSH-Px activity was defined as the amount of extract needed to oxidize 1 μmol NADPH per min at 25 °C.26 The total fraction (free + bound) of TBARS was measured in plasma, stomach content and tissue extracts, by measuring the absorbance at 532 nm following the reaction with 2-thiobarbituric acid and quantified using a standard curve with 1,1,3,3-tetramethoxypropane, as described by Grotto et al.27 Concentrations of PCC in the stomach content were determined spectrophotometrically following a reaction with 2,4-dinitrophenylhydrazine.28 The concentrations of glutathione and oxidised glutathione in the RBC fraction were determined by HPLC using γ-glutamyl glutamate as an internal standard.29
2.8 C-Reactive protein and low-density lipoprotein
Quantification of C-reactive protein (CRP) (RAB0097, Merck, Diegem, Belgium) and low-density lipoprotein (LDL) (E-EL-R0579, Elabscience, Texas, USA) in plasma was performed using a commercial ELISA kit and measured on a microplate reader (Infinite M Nano, Tecan, Grödig, Austria), according to the manufacturer's instructions.2.9 DNA adducts
The extraction of DNA adducts in colonic samples was performed following the protocol described by Hemeryck et al.30 In brief, DNA was extracted using a commercial extraction kit, following the manufacturer's protocol (DNeasy Blood & Tissue Kits, QIAgen, Hilden, Germany). The DNA concentration and purity were determined with a Nanodrop ND-1000 spectrophotometer (Isogen Lifescience, Ijsselstein, The Netherlands). The DNA was hydrolyzed using 0.1 M formic acid at 80 °C for 30 min, after which DNA adducts were purified with solid-phase extraction (SPE) (Oasis® HLB cartridges (1 cc, 30 mg), Waters (Milford, USA)). Finally, samples were evaporated to dryness under vacuum and suspended in 100 μl of 0.05% acetic acid in water. Samples were stored at −20° C until analysis.The DNA adduct analysis was performed by ultrahigh-performance liquid chromatography coupled to high-resolution mass spectrometry (UHPLC-HRMS), in line with Hemeryck et al.31 In brief, the detection of DNA adducts was performed using an Orbitrap Exploris 120 MS (Thermo Fisher Scientific, San José, CA, USA), preceded by heated electrospray ionization (HESI-II source). Targeted analysis included the detection of the DNA adducts N3-MeA, N7-MeG, N2-EtG, M1-G, O6-CMG, O6-MeG, N6-MeA and Cro-G. Targeted data processing was carried out using XCalibur 3.0 software (Thermo Fisher Scientific, San José, CA, USA), where adducts were screened based on their m/z and retention time matching the internal standard. Untargeted data preprocessing was performed using Compound Discoverer 3.1 software (Thermo Fisher Scientific, San José, CA, USA). The data were also subjected to a normalization process (total ion count normalization, TIC), log transformation and Pareto scaling prior to multivariate statistical modelling using Simca 17 software (Umetrics AB, Umea, Sweden). Principal component analysis (PCA) was used to assess clustering of the data, followed by supervised modelling using Orthogonal Partial Least Squares-Discriminant Analysis (OPLS-DA). The putative models were created to compare the untargeted DNA adductome fingerprint according to meat type and/or the addition of FOS to the meats (i.e., chicken vs. beef, chicken without FOS vs. chicken with FOS, beef without FOS vs. beef with FOS, chicken with FOS vs. beef with FOS). The model validity was confirmed following a cross-validation strategy by assessing R2(X) and Q2(Y), permutation testing (n = 100) and cross-validated ANOVA (CV-ANOVA) (p-value < 0.05), as described by De Graeve et al.32
2.10 Statistical analysis
Performance data (feed intake and body weight) were statistically analysed using a repeated-measures ANOVA procedure with ‘rat ID’ as a random factor and ‘feeding day’ as a repeated effect. A mixed model ANOVA procedure (SAS Enterprise Guide 8) was used with the fixed effects ‘meat type’ (Pm), ‘FOS’ (Pf) and their interaction term (Pm*f), and the random factor ‘euthanasia day’. Tukey-adjusted post hoc tests were performed for pairwise comparisons with a p-value <0.05 considered significant, and p-value between 0.05 and 0.1 considered a significant trend. The distribution of the residuals was evaluated to test normality and homogeneity of variance. When data normality and/or homogeneity of variance were violated, an independent samples Kruskal–Wallis test with pairwise comparisons was performed (SPSS Statistics 27), using the effect ‘meat type’ (Pm), ‘FOS’ (Pf) or ‘dietary treatment’ (Pd) as the independent variables. Significant p-values were adjusted using the Bonferroni correction for multiple tests. The α-diversity of the microbiota was assessed by determining the Shannon and Inverted Simpson indexes. The β-diversity was assessed using Principal Coordinate Analysis (PCoA) based on the Bray–Curtis dissimilarity metric, and Permutational Multivariate Analysis of Variance (PERMANOVA) to test the statistical significance (Rstudio packages vegan and ggplot). Spearman correlation analysis was performed to explore the associations between discriminant bacterial genera identified through LEfSe, restricted to those with relative abundances ≥1%. P-Values were corrected for multiple tests using the Benjamini–Hochberg procedure (Rstudio packages corrplot and circlize).3. Results
3.1 Experimental meat diets
The experimental diets contained similar contents of dry matter, crude fat, crude protein, crude ash, and similar proportions of SFA, MUFA, PUFA, LA and ALA (Table 1). The beef diets contained lower contents of LC n-6 PUFA (−24%) and LC n-3 PUFA (4-fold) compared to the chicken diets, which resulted in a somewhat higher n-6/n-3 PUFA ratio in the beef diets (+25%). The beef diets contained higher levels of heme iron (13-fold) and TBARS (+59%) than the chicken diets, whereas no differences were found in PCC levels.3.2 Animal performance
Rats consumed less of the chicken with FOS diet compared to the beef with FOS diet (−9%, p = 0.005), but body weight was not influenced by dietary treatment (Fig. 1, p > 0.05). Following euthanasia, rats on the FOS diets had a somewhat bloated colon with higher colon length (+23%, p = 0.001) compared to rats on the diets without FOS, whereas rats fed the chicken diets (with or without FOS) tended to have a somewhat shorter colon length (−4%, p = 0.089) compared to rats fed the beef diets (Table 2). Remarkably, when FOS was added to the meat diets, rats had a lower weight of liver (−9%, p = 0.028), mesenteric (−14%, p = 0.016) and retroperitoneal fat (−17%, p = 0.018). The weights of the heart and kidneys were not affected by the dietary treatments (p > 0.05). | ||
| Fig. 1 Average feed intake and body weight, and morphological changes in organs and fat deposition in rats on the beef or chicken without (grey) or with (blue) FOS diets. For feed intake and body weight, a repeated-measures ANOVA procedure with ‘rat ID’ as a random factor and ‘feeding day’ as a repeated effect was used to test the significance. For the rest, a mixed model ANOVA procedure was used with the fixed effects ‘meat type’ (Pm), ‘FOS’ (Pf) and their interaction term (Pm*f), and the random factor ‘euthanasia day’. Tukey-adjusted post hoc tests were performed for pairwise comparisons. | ||
| Organ | Unit | Beef | Chicken | SEM | P m | P f | P m*f | ||
|---|---|---|---|---|---|---|---|---|---|
| −FOS | +FOS | −FOS | +FOS | ||||||
| Mean values were analysed using a mixed model ANOVA of the fixed factors meat source (Pm), FOS (Pf) and their interaction term (Pm*f), and the random factor ‘euthanasia day’. Tukey-adjusted post hoc tests were performed for pairwise comparisons. SEM = standard error of the mean. Different subscripts (a, b) indicate significant differences among diets (p < 0.05). | |||||||||
| Body | g | 499 | 516 | 525 | 488 | 6.12 | 0.924 | 0.369 | 0.021 |
| Colon length | cm | 15.3 a | 18.8 b | 14.6 a | 18.0 b | 0.41 | 0.090 | 0.001 | 0.857 |
| Liver | g | 20.8 | 20.4 | 21.2 | 18.1 | 0.02 | 0.301 | 0.028 | 0.200 |
| Kidneys | g | 1.56 | 1.54 | 1.56 | 1.50 | 0.02 | 0.680 | 0.202 | 0.651 |
| Heart | g | 1.44 | 1.42 | 1.36 | 1.36 | 0.39 | 0.259 | 0.628 | 0.587 |
| Mesenteric fat | g | 4.84 | 4.48 | 4.81 | 3.81 | 0.17 | 0.554 | 0.016 | 0.315 |
| Retroperitoneal fat | g | 9.91 | 8.68 | 10.8 | 8.61 | 0.48 | 0.436 | 0.018 | 0.488 |
3.3 Histology
Snapshots of the colonic mucosa are presented in ESI Fig. 1.† Rats on the FOS diets had a larger colon crypt depth compared to rats on the diets without FOS (273 ± 20 μm vs. 246 ± 23 μm, p < 0.001), whereas meat type had no effect (p = 0.722). The number of goblet cells per crypt was not affected by dietary treatment (33 ± 4 and 34 ± 3 in the meat without and with FOS groups, respectively, p > 0.05).3.4 Colon microbiota
Due to missing colon content in some animals, the number of replicates was 10 for rats on the diet containing beef without FOS, 8 for beef with FOS, 7 for chicken without FOS, and 6 for chicken with FOS. The colonic contents of rats on the FOS diets showed higher bacterial density (3-fold, p = 0.001), and a lower bacterial richness, as indicated by a lower Shannon index (−34%, p = 0.002) and Inverted Simpson index (−50%, p = 0.041) compared to rats on the diets without FOS. These aforementioned parameters were not affected by the meat type, but the interaction term was significant for the bacterial enumeration (Pd = 0.001), and a statistical trend was seen for the Inverted Simpson index (Pm*f = 0.097). The β-diversity was different among treatments (R2 = 0.212, PERMANOVA p = 0.001) (Fig. 2). | ||
| Fig. 2 Colonic microbiota characterization. (A) Bacterial density and α-diversity measured by Shannon index and Inverted Simpson index in rats following the beef or chicken without (grey) or with (blue) FOS diets. (B) PCoA plot based on the Bray–Curtis dissimilarity metric. (C) Relative abundance at the phylum and family levels, where each bar represents one animal (left bars) or the median per dietary treatment (right bars). For bacterial density (median with 95% confidence interval), an independent samples Kruskal–Wallis test with pairwise comparisons was performed, using the effect ‘meat type’ (Pm), ‘FOS’ (Pf) or ‘dietary treatment’ (Pd) as independent variables. Significant p-values were adjusted by the Bonferroni correction for multiple tests. For Shannon and Inverted Simpson (mean with standard deviation) indices, a mixed model ANOVA procedure was used, with the fixed effects ‘meat type’ (Pm), ‘FOS’ (Pf) and their interaction term (Pm*f), and the random factor ‘euthanasia day’. Tukey-adjusted post hoc tests were performed for pairwise comparisons. | ||
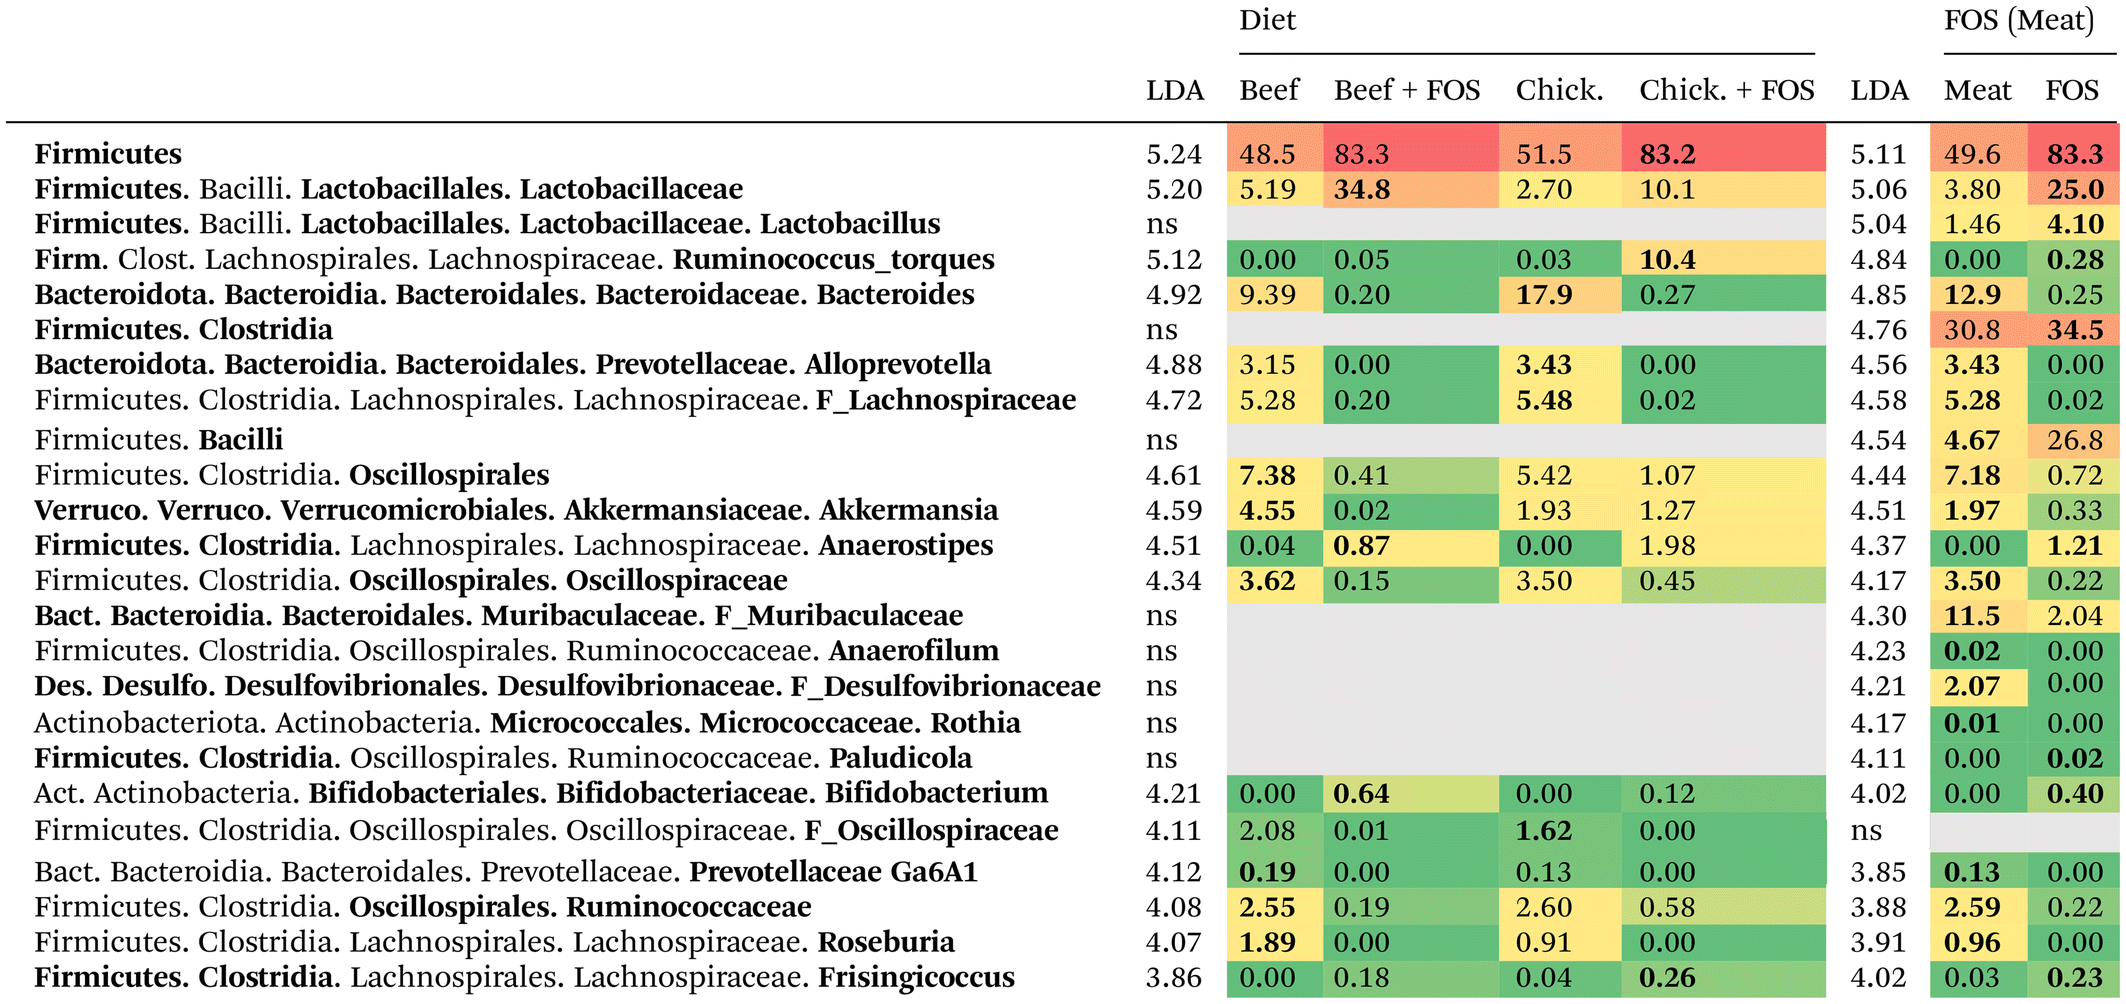
In general, the phyla Firmicutes and Bacteroidota were the most abundant irrespective of the diet. Compared to rats without FOS, rats on the FOS diets had colon contents with higher median relative abundances of Firmicutes (83 ± 21% vs. 50 ± 20%), lower Bacteroidota (6.0 ± 17% vs. 35 ± 17%), lower Verrucomicrobiota (0.3 ± 2% vs. 2.0 ± 13%) and an absence of Desulfobacterota (0% vs. 2.1 ± 4%). The increased relative abundance of Firmicutes in rats on the FOS diets was mainly attributed to an outgrowth of members of Lactobacillaceae and Lachnospiraceae. These descriptive observations were generally found to be significant using the LEfSe analysis, showing 78 discriminant bacterial groups when the LDA was set to 2.0 (50 beef without FOS, 10 beef with FOS, 13 chicken without FOS, and 5 chicken with FOS) (ESI Fig. 2†). To filter the most discriminant groups, LDA was set to 4.0 to account for major differences, resulting in 26 discriminant features (9 beef without FOS, 6 beef with FOS, 9 chicken without FOS, and 2 chicken with FOS) (ESI Fig. 3†). A cladogram representing the significant discriminant groups per dietary treatment is shown in Fig. 3. These discriminant groups were subsequently ranked in a heatmap from higher to lower LDA in Table 3. The most discriminant bacteria per dietary treatment were the order Oscillospirales (p = 0.004) (including the families Oscillospiraceae (p = 0.002) and Ruminococcaceae (p = 0.017)), Akkermansia (p = 0.027) and Roseburia (p = 0.004) for rats consuming the beef diets; Lactobacillaceae (p = 0.042), Bifidobacterium (p < 0.001) and Anaerostipes (p = 0.005) for beef with FOS; Bacteroides (p < 0.001), Alloprevotella (p < 0.001) and two unclassified genera of Lachnospiraceae (p < 0.001) and Oscillospiraceae (p < 0.001) in chicken without FOS; and Ruminococcus torques group (p < 0.001) in chicken with FOS. Rats on the FOS diets had higher relative abundances of Firmicutes (p = 0.005), mainly due to the higher abundances of the orders Clostridia (p = 0.017) and Bacilli (p = 0.035), the latter mainly consisting of the family of Lactobacillaceae (p = 0.005). The colonic bacterial community of rats on the meat diets without FOS was characterized by higher relative abundances of the phyla Bacteroidota (p = 0.002) (mainly Bacteroides (p < 0.001), Alloprevotella (p < 0.001), and Muribaculaceae (p = 0.007)), Desulfobacterota (p < 0.001) (Desulfovibrionaceae (p < 0.001)) and Verrucomicrobiota (p = 0.010) (Akkermansia (p = 0.010)). These rats also had higher relative abundances of various bacterial groups within the Firmicutes phylum, including Oscillospiraceae (p < 0.001), Ruminococcaceae (p < 0.001) and Roseburia (p < 0.001). No discriminant bacterial groups were observed for the factor ‘meat’ used as the main class when the LDA was set to 4.0. With the LDA set to 2.0, four groups of bacteria were significant (ESI Fig. 2C†): Ruminococcus gnavus group (p = 0.046) for rats consuming the chicken diets, and Actinobacteriota (p = 0.041), Faecalitalea (p = 0.012), and Eggerthella (p = 0.001) for the beef diets.
 | ||
| Fig. 3 Discriminant bacteria features across diets. (A) Cladogram representing the results of LEfSe, highlighting taxa with significant differences among diets. (B) Network analysis of bacterial genera with strong correlations (|r| ≥ 0.65), showing positive (blue) and negative (red) correlations. (C) Spearman correlation matrix of discriminant bacteria at the genus level, displaying only statistically significant correlations. P-Values were corrected for multiple tests using the Benjamini–Hochberg procedure. | ||
| Data are ranked from high to low linear discriminant analysis (LDA) score with the factor ‘dietary treatment’ as the main effect (column ‘Diet’). For the column ‘FOS (Meat)’, the factor FOS was used as a main class and meat as a subclass. Data are presented as median relative abundance (%). Taxonomic levels in bold are significant by LEfSe analysis (p < 0.05). |
|---|
|
Correlation analysis identified 65 significant associations among bacterial genera (ESI Table 3†). Strong correlations (|r| ≥ 0.65) are visualised in a Chord diagram to illustrate potential relationships among bacterial genera (Fig. 3).
3.5 Fermentation metabolites
The consumed meat type did not alter any of the analyzed fecal fermentation parameters, except for a trend in higher cresol levels in rats on the chicken (vs. beef) diets (2-fold, Pm = 0.063), and higher valerate levels found in the feces of rats consuming chicken with FOS compared to the other diets (7-fold, Pm = 0.026) (Fig. 4). The presence of FOS in the diet decreased CS2 (−56%, Pf = 0.001), dimethyl disulfide (−38%, Pf = 0.019) and cresol (−89%, Pf = 0.001) in feces and ammonia (−59%, Pf = 0.001), iso-butyrate (−84%, Pf = 0.001) and iso-valerate (−75%, Pf = 0.001) in cecal content, whereas levels of dimethyl trisulfide, phenol and indole were not affected (ESI Fig. 4†). Levels of CS2 showed a decreasing trend due to the inclusion of FOS in the beef diet (p = 0.066). As expected, levels of all individual SCFA were increased 2 to 11-fold by adding FOS to the diets (all Pf = 0.001, except valerate levels Pf = 0.056). Methanethiol was not detected in any fecal sample. | ||
| Fig. 4 Levels of fecal and cecal fermentation metabolites (median with 95% confidence interval) in rats with the beef or chicken without (grey) or with (blue) FOS diets. An independent samples Kruskal–Wallis test with pairwise comparisons was performed, using the effect ‘meat type’ (Pm), ‘FOS’ (Pf) or ‘dietary treatment’ (Pd) as independent variables. Significant p-values were adjusted by the Bonferroni correction for multiple tests. | ||
3.6 Oxidative stress
The consumption of beef (vs. chicken) resulted in higher levels of TBARS in the stomach content (+81%, Pm = 0.001) and a trend was observed for higher levels in plasma (+23%, Pm = 0.070) and kidneys (+8%, Pm = 0.074). A higher GSH-Px activity was also seen in the plasma of rats consuming beef (+12%, Pm = 0.028). The activity of this enzyme was also higher in the kidneys of rats fed beef with FOS vs. chicken with FOS (+6%, p = 0.021), but not between meats when FOS was not added to the diets. In the absence of dietary FOS, lower levels of glutathione (−29%, p = 0.023) were found in RBC of rats on the beef diet, compared to the chicken diet. The addition of FOS to the diets resulted in lower levels of TBARS in the liver (−10%, Pf = 0.021), lower fecal hexanal levels (−87%, Pf = 0.001), and a lower GSH-Px activity in the colon mucosa of rats (2-fold, Pf = 0.001) (Fig. 5). In contrast, rats on the FOS diets had higher levels of TBARS in their duodenal mucosa (+12%, Pf = 0.046) and tended to have higher TBARS concentrations in their colon mucosa (+16%, Pf = 0.062). Rats on the beef with FOS diet showed higher levels of TBARS in the heart (+7%, Pf = 0.017) compared to rats that consumed beef without FOS, whereas this FOS effect was not observed in the heart of rats on the chicken diet. The activity of GSH-Px and TBARS levels in other organs, and PCC levels in stomach contents were not affected by the experimental diets (ESI Table 1,†p > 0.05). | ||
| Fig. 5 Oxidative stress markers in tissue, blood and feces; and inflammatory levels in plasma, in rats on the beef or chicken without (grey) or with (blue) FOS diets. A mixed model ANOVA procedure was used, with the fixed effects ‘meat type’ (Pm), ‘FOS’ (Pf) and their interaction term (Pm*f), and the random factor ‘euthanasia day’. Tukey-adjusted post hoc tests were performed for pairwise comparisons. | ||
3.7 C-reactive protein and low-density lipoprotein
The addition of FOS to the meat diets decreased the CRP levels in plasma only in rats fed chicken (−50%, p = 0.006), whereas this was not observed in rats fed beef (Fig. 5). This was also evident by the significant interaction term (Pm*f = 0.010). Without FOS, a trend was seen for higher CRP levels in rats consuming chicken compared to beef (+46%, p = 0.069). Plasma LDL levels were not different between dietary treatments, but rats on the chicken (vs. beef) diets showed a trend for higher LDL values (+28%, p = 0.094) (ESI Fig. 4†).3.8 DNA adducts
Few DNA adducts could be detected in colon mucosa samples. The N6-MeA adduct was only detected in 2 colonic tissues of rats on the beef with FOS diet. The N7-MeG adduct was detected in a total of 7 colonic tissue samples, spread over rats consuming the beef without FOS (2), beef with FOS (3) or chicken without FOS (2) diets (ESI Table 2†). The DNA adducts N3-MeA, N2-EtG, M1-G, O6-CMG, O6-MeG and Cro-G were not found in any sample of the colon mucosa. For the untargeted analysis, the OPLS-DA models could not be validated (CV-ANOVA p-value > 0.05).4. Discussion
This study investigated the effects of red and white meat consumption, with and without FOS supplementation, on gut metabolism in rats. In the fiber-deprived diets, beef consumption showed a relatively higher colonic abundance of the genus Akkermansia and lower blood glutathione levels, whereas rats fed chicken had higher abundances of Bacteroides. These differences between meats were not observed when FOS was added to the diets. The addition of FOS to the meat diets modulated systemic health to a larger extent than the differential heme iron content between meats. This was evidenced by shifts in the gut microbiota composition and fermentation metabolite abundances, reduced oxidative stress markers in liver tissue, lower plasma inflammation levels, an elongated colon length, decreased mesenteric and retroperitoneal fat deposition, and liver weight. In contrast, the addition of FOS in the diet surprisingly increased lipid oxidation in intestinal mucosa and heart tissue.4.1 Dietary fiber reduces the abundance of Akkermansia and Desulfovibrio
Previous research demonstrated that, in a fiber-deprived environment, the colonic microbiota use mucus glycoproteins as a nutrient source, thereby damaging the colonic protective mucus barrier.15 The abundances of Akkermansia muciniphila and Desulfovibrio piger in the gut were increased when mice were given a fiber-deprived diet, along with a corresponding decrease in the abundances of fiber-degrading species, and a shortening of the colon length.15 Consistent with our findings, a recent study demonstrated that a short-term fiber deprivation of three weeks led to an increase in mucolytic and sulfate-reducing bacteria, accompanied by elevated enzymatic activity targeting mucin glycan linkages and sulfate bonds.33 A decrease in crypt depth was observed in mice following a fiber-deprived diet,34 as also found in the present study. Consistent with these findings, in the present study, the inclusion of dietary FOS resulted in lower abundances of Akkermansia, a complete absence of Desulfovibrionaceae, and a longer colon length. Desai et al.15 related these parameters to an erosion of the mucus barrier in the fiber-deprived diet, bringing luminal bacteria closer to the epithelium, which could trigger deleterious intestinal effects. More recently, Akkermansia muciniphila was demonstrated to play different roles depending on dietary fiber intake, facilitating susceptibility to pathogen infection in a dietary fiber-deprived diet and being protective against pathogens in the presence of fiber.35 Syntrophic interactions between Akkermansia muciniphila and sulfate-reducing bacteria were previously described. The sulfate released during mucin degradation may be used by sulfate-reducing bacteria to produce H2S, while Akkermansia muciniphila might also take part in the detoxification mechanism of H2S.364.2 Red meat increased the abundance of Akkermansia but not Desulfovibrio
The heme iron content of red meat is also proposed to alter microbial metabolism. Ijssennagger et al.4 reported that dietary heme increased colonic abundance of Akkermansia and sulfate-reducing bacteria. These bacteria modulate the production of H2S, a metabolite capable of reducing the disulfide bonds of mucin in the mucus layer by forming trisulfides and promoting inflammation. Herein, we hypothesized that these alterations would be exacerbated when heme iron is consumed in the context of a low-fiber diet. In the present study, Akkermansia was more abundant in the beef without FOS diet, but no differences in Desulfovibrio abundances or levels of sulfur metabolites in the colon were seen between meat types. In some of the previous rat feeding studies conducted by our group, with similar diets high in meat and low in fiber, a higher colonic abundance of Desulfovibrionaceae6 or CS27 was found in rats consuming beef compared to chicken. The outgrowth of Desulfovibrionaceae in the former study was especially evident when beef was consumed in combination with high dietary levels of sucrose (vs. corn starch), which is in accordance with the low-fiber model in the present study. The varying potential to stimulate the outgrowth of Desulfovibrio and the formation of sulfur metabolites in the gut of rats consuming heme iron or red meat in multiple similar studies suggest a delicate balance, most likely impacted by complex interactions between nutrients and bacterial metabolites in the gut.
4.3 Microbial dynamics in the gut ecosystem: a symphony orchestra?
In the present study, although no significant correlations were detected between Desulfovibrionaceae and Akkermansia, positive correlations were found between Akkermansia and unclassified genera from the families Muribaculaceae and Lachnospiraceae. These families are known as facultative mucin monosaccharide foragers because of their ability to metabolize mucin-derived sugars.37 Since these bacterial families were also enriched in the colon of rats on the fiber-deprived diets, these associations suggest that the obligate mucin-degrading activity of Akkermansia may increase the availability of mucin-derived substrates, promoting the growth of these bacteria. In contrast, a negative correlation was observed between the unclassified Desulfovibrionaceae and Ruminococcus torques, potentially reflecting competition for mucin or mucin-derived substrates, as both taxa can metabolise mucin.38,39 Nonetheless, correlation does not imply causation, especially in the complex context of gut microbial interactions.40 Understanding the mechanisms underlying these microbial relationships is crucial for assessing the impact of meat consumption on gut health, particularly as meat is typically consumed with other food items.4.4 The addition of FOS to the meat diets affected both gut and systemic health
The relationship between gut dysbiosis and the homeostasis of other organs has become increasingly evident.41 In the present study, the addition of FOS to the diets not only altered gut microbial abundances and metabolism but also reduced liver weight, fat deposition, oxidative stress and the inflammation marker CRP. The intestinal barrier acts as a protective gate between the gut and the liver. In our study, dietary FOS reduced protein fermentation (ammonia, BCFA and cresol) and sulfur metabolites (CS2 and dimethyl disulfide), whereas the formation of SCFA was enhanced, as previously observed during in vitro fermentation of various animal muscle types.42 Phenol and cresol are known to increase gut permeability, whereas indole and SCFA enhance the intestinal epithelial barrier function.43 An increased permeability in the intestine allows a higher flux of bacteria and their metabolites into the liver, negatively affecting overall systemic health.44 For instance, the efficacy of FOS supplementation to mitigate metabolic changes caused by a high-fat and high-cholesterol diet was previously reported to modulate the gut microbiota and lipid metabolism in the liver.45 The SCFA produced can not only improve intestinal integrity and reduce oxidative stress, but also be metabolised in the liver, reducing inflammation and influencing lipid metabolism,41,46 as observed by the lower liver weight and lower mesenteric and retroperitoneal fat deposition in our study. In addition, Zeng et al.47 reported that FOS supplementation disrupted the enterohepatic circulation of bile salts in mice fed a high-fat diet. It could be hypothesized that FOS reduced the emulsifying capacity of bile salts, thereby impairing micelle formation and decreasing fat absorption in the small intestine. This could have resulted in reduced energy availability, contributing to the observed reductions in liver weight and mesenteric and retroperitoneal fat deposition. Concurrently, undigested lipids remaining in the intestinal lumen may act as substrates for oxidation, promoting localized oxidative stress in the intestinal mucosa and potentially explaining the unexpected elevated levels of TBARS observed in the intestinal mucosa of rats on FOS diets.Previous studies have reported elevated levels of O6-CMG and O6-MeG in colonocytes of individuals consuming high red meat, which was inhibited by the intake of butyrylated high-amylose maize starch.10,48 The formation of these DNA adducts in the colon tissue caused by the beef diet, or its prevention by the addition of FOS, could not be observed in the present study. A potential explanation for the observed differences is the variation in sampling procedures between experiments. In previously cited studies, adducts were detected in colonic exfoliated cells, whereas our method involves mucosal scraping in rats. This approach may collect underlying cells, leading to adduct dilution and complicating detection. Alternatively, a longer intervention may be required for DNA adduct detection in our experiment. In addition, it should be noted that DNA adductomics is an evolving field, in which methodologies are continuously being improved to enhance the detection and analysis of trace level DNA adducts.
4.5 The pro-oxidant effects of heme iron may be mitigated by fiber intake
Heme iron in red meat has also been implicated in promoting oxidative stress, thereby affecting gut health.49 In our experiment, rats consuming beef showed higher levels of TBARS in the stomach content, increased plasma GSH-Px activity, and a trend towards elevated TBARS in plasma compared to those consuming chicken. The observed decrease in blood glutathione levels following beef consumption suggests an increased antioxidant demand, likely due to the pro-oxidant properties of heme iron. These results align with our previous studies, where beef intake in various dietary contexts led to lower blood glutathione levels and/or higher lipid oxidation products in stomach contents.6,7,50 Glutathione is pivotal in mitigating cellular damage from oxidative stress through its role as a substrate for GSH-Px. Glutathione can also detoxify reactive lipid oxidation products by conjugation, leading to the formation of mercapturic acid conjugates, which are subsequently excreted in urine.51 Interestingly, the addition of FOS to the beef diets prevented a decrease in blood glutathione levels, potentially through a sparing effect mediated by the antioxidant and metabolic actions of SCFA.Unexpectedly, adding FOS to the beef diets resulted in higher TBARS levels in heart tissue. The underlying mechanism remains unclear, but one possible explanation could involve interactions between dietary components and microbial metabolism. It is known that trimethylamine N-oxide (TMAO) levels increase following beef compared to chicken consumption in rats, likely due to the microbial fermentation of carnitine into trimethylamine (TMA), which is further converted to TMAO in the liver.41,52 While the role of TMAO in cardiovascular health remains debated, carnitine may have cardioprotective effects.53 Although we did not measure carnitine, TMA, or TMAO levels, it is conceivable that the microbial shifts induced by FOS supplementation may have influenced TMAO formation, potentially affecting oxidative balance in heart tissue. However, further research is needed to confirm this hypothesis.
5. Conclusion
In summary, beef consumption in a fiber-deprived diet resulted in a higher abundance of Akkermansia and lower glutathione levels in blood. The consumed meat type did not alter the levels of sulfur or protein fermentation metabolites in the colon or inflammation markers. DNA adduct formation was not observed in the present study. The addition of FOS to the meat diets resulted in a significant shift in the microbial community and activity in the colon, reducing oxidative stress in the liver and inflammation markers, liver weight and fat depositions, and increasing colon length. The reasons for the unexpectedly increased lipid oxidation in intestinal tissue of rats on the FOS diets should be elucidated in further research. However, given species-specific differences in gut microbiota composition and metabolism, caution is needed when extrapolating these findings from rodents to humans.Abbreviations
| AUC | Area under the curve |
| BCFAs | Branched-chain fatty acids |
| CRP | C-reactive protein |
| FOS | Fructo-oligosaccharides |
| GSH-Px | Glutathione peroxidase activity |
| LDA | Linear discriminant analysis |
| LDL | Low-density lipoprotein |
| LEfSe | Linear discriminant analysis effect size |
| NOCs | N-Nitroso compounds |
| PCC | Protein carbonyl compounds |
| PUFA | Polyunsaturated fatty acids |
| RBC | Red blood cells |
| SCFA | Short-chain fatty acids |
| TBARS | Thiobarbituric acid reactive substances |
| TMA | Trimethylamine |
| TMAO | Trimethylamine N-oxide |
Author contributions
Núria Elias Masiques: writing – original draft, investigation, formal analysis, data curation, and visualization. Jo De Vrieze: writing – review & editing and methodology. Lieselot Y. Hemeryck: writing – review & editing, methodology, supervision, and validation. Lynn Vanhaecke: writing – review & editing, methodology, and resources. Stefaan De Smet: writing – review & editing, resources, methodology, supervision, funding acquisition, and conceptualization. Thomas Van Hecke: writing – review & editing, supervision, resources, project administration, methodology, funding acquisition, and conceptualization.Data availability
The data supporting this article have been included as part of the ESI.†Conflicts of interest
The authors report there are no competing interests to declare.Acknowledgements
This work was funded by the Flanders Research Foundation (FWO) project G038620N. Lieselot Y. Hemeryck (1297623N) is supported by the Flanders Research Foundation (FWO). The authors acknowledge the assistance of Sabine Coolsaet and Dr Els Vossen from LANUPRO; Prof. Robrecht Raedt, Dr Maxime Mahu, Sabine De Groote and all the team from the Core ARTH Animal Facilities of Ghent University (BOF/COR/2022/007); and Dirk Stockx and Mieke Naessens at the Laboratory of Integrative Metabolomics (LIMET). We acknowledge the use of OpenAI's ChatGPT for editorial assistance in enhancing the clarity of the introduction and discussion sections of this manuscript.During the preparation of this work the author(s) used OpenAI's ChatGPT in order to improve the clarity of the introduction and discussion sections of this manuscript. After using this tool, the author(s) reviewed and edited the content as needed and take(s) full responsibility for the content of the publication.
References
- S. De Smet and T. Van Hecke, Meat products in human nutrition and health – About hazards and risks, Meat Sci., 2024, 218, 109628 CrossRef CAS PubMed.
- E. R. Hill, L. E. O'Connor, Y. Wang, C. M. Clark, B. S. McGowan, M. R. Forman and W. W. Campbell, Red and processed meat intakes and cardiovascular disease and type 2 diabetes mellitus: An umbrella systematic review and assessment of causal relations using Bradford Hill's criteria, Crit. Rev. Food Sci. Nutr., 2024, 64, 2423–2440 CrossRef CAS PubMed.
- N. Seiwert, J. Adam, P. Steinberg, S. Wirtz, T. Schwerdtle, P. Adams-Quack, N. Hövelmeyer, B. Kaina, S. Foersch and J. Fahrer, Chronic intestinal inflammation drives colorectal tumor formation triggered by dietary heme iron in vivo, Arch. Toxicol., 2021, 95, 2507–2522 CrossRef CAS.
- N. Ijssennagger, C. Belzer, G. J. Hooiveld, J. Dekker, S. W. C. van Mil, M. Müller, M. Kleerebezem and R. van der Meer, Gut microbiota facilitates dietary heme-induced epithelial hyperproliferation by opening the mucus barrier in colon, Proc. Natl. Acad. Sci. U. S. A., 2015, 112, 10038–10043 CrossRef CAS PubMed.
- S. Jiang, D. Xue, M. Zhang, Q. Li, H. Liu, D. Zhao, G. Zhou and C. Li, Myoglobin diet affected the colonic mucus layer and barrier by increasing the abundance of several beneficial gut bacteria, Food Funct., 2022, 13, 9060–9077 RSC.
- T. Van Hecke, J. Vrieze, N. Boon, W. H. Vos, E. Vossen and S. Smet, Combined Consumption of Beef–Based Cooked Mince and Sucrose Stimulates Oxidative Stress, Cardiac Hypertrophy, and Colonic Outgrowth of Desulfovibrionaceae in Rats, Mol. Nutr. Food Res., 2019, 63, 1800962 CrossRef PubMed.
- T. Van Hecke, E. Vossen, S. Goethals, N. Boon, J. De Vrieze and S. De Smet, In vitro and in vivo digestion of red cured cooked meat: oxidation, intestinal microbiota and fecal metabolites, Food Res. Int., 2021, 142, 110203 CrossRef CAS PubMed.
- N. Ijssennagger, R. van der Meer and S. W. C. van Mil, Sulfide as a Mucus Barrier-Breaker in Inflammatory Bowel Disease?, Trends Mol. Med., 2016, 22, 190–199 CrossRef CAS PubMed.
- N. M. Bastide, F. Chenni, M. Audebert, R. L. Santarelli, S. Taché, N. Naud, M. Baradat, I. Jouanin, R. Surya, D. A. Hobbs, G. G. Kuhnle, I. Raymond-Letron, F. Gueraud, D. E. Corpet and F. H. F. Pierre, A Central Role for Heme Iron in Colon Carcinogenesis Associated with Red Meat Intake, Cancer Res., 2015, 75, 870–879 CrossRef CAS PubMed.
- M. H. Lewin, N. Bailey, T. Bandaletova, R. Bowman, A. J. Cross, J. Pollock, D. E. G. Shuker and S. A. Bingham, Red Meat Enhances the Colonic Formation of the DNA Adduct O6 -Carboxymethyl Guanine: Implications for Colorectal Cancer Risk, Cancer Res., 2006, 66, 1859–1865 CrossRef CAS PubMed.
- I. S. Waddell and C. Orfila, Dietary fiber in the prevention of obesity and obesity-related chronic diseases: From epidemiological evidence to potential molecular mechanisms, Crit. Rev. Food Sci. Nutr., 2022, 1–16 Search PubMed.
- S. Macfarlane and G. T. Macfarlane, Regulation of short-chain fatty acid production, Proc. Nutr. Soc., 2003, 62, 67–72 CrossRef CAS PubMed.
- N. E. Diether and B. P. Willing, Microbial Fermentation of Dietary Protein: An Important Factor in Diet–Microbe–Host Interaction, Microorganisms, 2019, 7, 19 CrossRef CAS PubMed.
- F. Blachier, Amino Acid-Derived Bacterial Metabolites in the Colorectal Luminal Fluid: Effects on Microbial Communication, Metabolism, Physiology, and Growth, Microorganisms, 2023, 11, 1317 CrossRef CAS PubMed.
- M. S. Desai, A. M. Seekatz, N. M. Koropatkin, N. Kamada, C. A. Hickey, M. Wolter, N. A. Pudlo, S. Kitamoto, N. Terrapon, A. Muller, V. B. Young, B. Henrissat, P. Wilmes, T. S. Stappenbeck, G. Núñez and E. C. Martens, A Dietary Fiber-Deprived Gut Microbiota Degrades the Colonic Mucus Barrier and Enhances Pathogen Susceptibility, Cell, 2016, 167, 1339–1353 CrossRef CAS PubMed.
- A. de C. Correa, M. S. Lopes, R. F. Perna and E. K. Silva, Fructan-type prebiotic dietary fibers: Clinical studies reporting health impacts and recent advances in their technological application in bakery, dairy, meat products and beverages, Carbohydr. Polym., 2024, 323, 121396 CrossRef CAS PubMed.
- R. Jackson, T. Yao, N. Bulut, T. M. Cantu-Jungles and B. R. Hamaker, Protein combined with certain dietary fibers increases butyrate production in gut microbiota fermentation, Food Funct., 2024, 15, 3186–3198 RSC.
- K. Raes, S. de Smet and D. Demeyer, Effect of double-muscling in Belgian Blue young bulls on the intramuscular fatty acid composition with emphasis on conjugated linoleic acid and polyunsaturated fatty acids, Anim. Sci., 2001, 73, 253–260 CrossRef CAS.
- H. C. Hornsey, The colour of cooked cured pork. I.—Estimation of the Nitric oxide-Haem Pigments, J. Sci. Food Agric., 1956, 7, 534–540 CrossRef CAS.
- R. Vilchez-Vargas, R. Geffers, M. Suárez-Diez, I. Conte, A. Waliczek, V. S. Kaser, M. Kralova, H. Junca and D. H. Pieper, Analysis of the microbial gene landscape and transcriptome for aromatic pollutants and alkane degradation using a novel internally calibrated microarray system, Environ. Microbiol., 2013, 15, 1016–1039 CrossRef CAS PubMed.
- J. De Vrieze, L. Raport, B. Willems, S. Verbrugge, E. Volcke, E. Meers, L. T. Angenent and N. Boon, Inoculum selection influences the biochemical methane potential of agro-industrial substrates, Microb. Biotechnol., 2015, 8, 776–786 CrossRef CAS.
- N. Segata, J. Izard, L. Waldron, D. Gevers, L. Miropolsky, W. S. Garrett and C. Huttenhower, Metagenomic biomarker discovery and explanation, Genome Biol., 2011, 12, R60 CrossRef PubMed.
- E. Vossen, S. Goethals, J. De Vrieze, N. Boon, T. Van Hecke and S. De Smet, Red and processed meat consumption within two different dietary patterns: Effect on the colon microbial community and volatile metabolites in pigs, Food Res. Int., 2020, 129, 108793 CrossRef CAS PubMed.
- F. Gadeyne, K. D. Ruyck, G. V. Ranst, N. D. Neve, B. Vlaeminck and V. Fievez, Effect of changes in lipid classes during wilting and ensiling of red clover using two silage additives on in vitro ruminal biohydrogenation, J. Agric. Sci., 2016, 154, 553–566 CrossRef CAS.
- A. L. Chaney and E. P. Marbach, Modified Reagents for Determination of Urea and Ammonia, Clin. Chem., 1962, 8, 130–132 CrossRef CAS.
- P. Hernández, L. Zomeño, B. Ariño and A. Blasco, Antioxidant, lipolytic and proteolytic enzyme activities in pork meat from different genotypes, Meat Sci., 2004, 66, 525–529 CrossRef PubMed.
- D. Grotto, L. D. Santa Maria, S. Boeira, J. Valentini, M. F. Charão, A. M. Moro, P. C. Nascimento, V. J. Pomblum and S. C. Garcia, Rapid quantification of malondialdehyde in plasma by high performance liquid chromatography–visible detection, J. Pharm. Biomed. Anal., 2007, 43, 619–624 CrossRef CAS PubMed.
- R. Ganhão, D. Morcuende and M. Estévez, Protein oxidation in emulsified cooked burger patties with added fruit extracts: Influence on colour and texture deterioration during chill storage, Meat Sci., 2010, 85, 402–409 CrossRef.
- J. Degroote, J. Michiels, E. Claeys, A. Ovyn and S. De Smet, Changes in the pig small intestinal mucosal glutathione kinetics after weaning, J. Anim. Sci., 2012, 90, 359–361 CrossRef.
- L. Y. Hemeryck, T. Van Hecke, E. Vossen, S. De Smet and L. Vanhaecke, DNA adductomics to study the genotoxic effects of red meat consumption with and without added animal fat in rats, Food Chem., 2017, 230, 378–387 CrossRef CAS PubMed.
- L. Y. Hemeryck, A. I. Decloedt, J. Vanden Bussche, K. P. Geboes and L. Vanhaecke, High resolution mass spectrometry based profiling of diet-related deoxyribonucleic acid adducts, Anal. Chim. Acta, 2015, 892, 123–131 CrossRef CAS PubMed.
- M. De Graeve, E. Van De Walle, T. Van Hecke, S. De Smet, L. Vanhaecke and L. Y. Hemeryck, Exploration and optimization of extraction, analysis and data normalization strategies for mass spectrometry-based DNA adductome mapping and modeling, Anal. Chim. Acta, 2023, 1274, 341578 CrossRef CAS PubMed.
- C. Rous, J. Cadiou, H. Yazbek, E. Monzel, M. S. Desai, J. Doré, M. van de Guchte and S. Mondot, Temporary dietary fiber depletion prompts rapid and lasting gut microbiota restructuring in mice, Microbiol. Spectrum, 2025, 13, e01517–e01524 Search PubMed.
- A. Overbeeke, M. Lang, B. Hausmann, M. Watzka, G. Nikolov, J. Schwarz, G. Kohl, K. De Paepe, K. Eislmayr, T. Decker, A. Richter and D. Berry, Impaired Mucosal Homeostasis in Short-Term Fiber Deprivation Is Due to Reduced Mucus Production Rather Than Overgrowth of Mucus-Degrading Bacteria, Nutrients, 2022, 14, 3802 CrossRef CAS PubMed.
- M. Wolter, E. T. Grant, M. Boudaud, N. A. Pudlo, G. V. Pereira, K. A. Eaton, E. C. Martens and M. S. Desai, Diet-driven differential response of Akkermansia muciniphila modulates pathogen susceptibility, Mol. Syst. Biol., 2024, 20, 596–625 CrossRef CAS PubMed.
- S. Y. Geerlings, I. Kostopoulos, W. M. De Vos and C. Belzer, Akkermansia muciniphila in the Human Gastrointestinal Tract: When, Where, and How?, Microorganisms, 2018, 6, 75 CrossRef CAS PubMed.
- F. C. Pereira, K. Wasmund, I. Cobankovic, N. Jehmlich, C. W. Herbold, K. S. Lee, B. Sziranyi, C. Vesely, T. Decker, R. Stocker, B. Warth, M. von Bergen, M. Wagner and D. Berry, Rational design of a microbial consortium of mucosal sugar utilizers reduces Clostridiodes difficile colonization, Nat. Commun., 2020, 11, 5104 CrossRef CAS PubMed.
- H. Earley, G. Lennon, A. Balfe, M. Kilcoyne, M. Clyne, L. Joshi, S. Carrington, S. T. Martin, J. C. Coffey, D. C. Winter and P. R. O'Connell, A Preliminary Study Examining the Binding Capacity of Akkermansia muciniphila and Desulfovibrio spp., to Colonic Mucin in Health and Ulcerative Colitis, PLoS One, 2015, 10, e0135280 CrossRef PubMed.
- S. R. Schaus, G. Vasconcelos Periera, A. S. Luis, E. Madlambayan, N. Terrapon, M. P. Ostrowski, C. Jin, G. C. Hansson and E. C. Martens, Ruminococcus torques is a keystone degrader of intestinal mucin glycoprotein, releasing oligosaccharides used by Bacteroides thetaiotaomicron, bioRxiv, 2024, 2024.01.15.575725.
- M. Van Hul, T. Le Roy, E. Prifti, M. C. Dao, A. Paquot, J.-D. Zucker, N. M. Delzenne, G. G. Muccioli, K. Clément and P. D. Cani, From correlation to causality: the case of Subdoligranulum, Gut Microbes, 2020, 12, 1849998 CrossRef PubMed.
- S. Anand and S. S. Mande, Host-microbiome interactions: Gut-Liver axis and its connection with other organs, npj Biofilms Microbiomes, 2022, 8, 1–10 CrossRef.
- N. Elias Masiques, E. Vossen, J. De Vrieze, S. De Smet and T. Van Hecke, The formation of sulfur metabolites during in vitro gastrointestinal digestion of fish, white meat and red meat is affected by the addition of fructo-oligosaccharides, Food Funct., 2024, 15, 8729–8739 RSC.
- M. Beaumont and F. Blachier, Amino Acids in Intestinal Physiology and Health, Adv. Exp. Med. Biol., 2020, 1265, 1–20 CrossRef CAS PubMed.
- J. Plaza-Díaz, P. Solís-Urra, F. Rodríguez-Rodríguez, J. Olivares-Arancibia, M. Navarro-Oliveros, F. Abadía-Molina and A. I. Álvarez-Mercado, The Gut Barrier, Intestinal Microbiota, and Liver Disease: Molecular Mechanisms and Strategies to Manage, Int. J. Mol. Sci., 2020, 21, 8351 CrossRef PubMed.
- X. Huang, Q. Chen, Y. Fan, R. Yang, G. Gong, C. Yan, Y. Song, B. Zhang, S. Xi, Y. Huang and H. Xu, Fructooligosaccharides attenuate non-alcoholic fatty liver disease by remodeling gut microbiota and association with lipid metabolism, Biomed. Pharmacother., 2023, 159, 114300 CrossRef CAS PubMed.
- M. Schoeler and R. Caesar, Dietary lipids, gut microbiota and lipid metabolism, Rev. Endocr. Metab. Disord., 2019, 20, 461–472 CrossRef CAS PubMed.
- F. Zeng, S. He, Y. Sun, X. Li, K. Chen, H. Wang, S. Man and F. Lu, Abnormal enterohepatic circulation of bile acids caused by fructooligosaccharide supplementation along with a high-fat diet, Food Funct., 2024, 15, 11432–11443 RSC.
- R. K. Le Leu, J. M. Winter, C. T. Christophersen, G. P. Young, K. J. Humphreys, Y. Hu, S. W. Gratz, R. B. Miller, D. L. Topping, A. R. Bird and M. A. Conlon, Butyrylated starch intake can prevent red meat-induced O-6-methyl-2-deoxyguanosine adducts in human rectal tissue: a randomised clinical trial, Br. J. Nutr., 2015, 114, 220–230 CrossRef CAS PubMed.
- O. C. B. Martin, M. Olier, S. Ellero-Simatos, N. Naud, J. Dupuy, L. Huc, S. Taché, V. Graillot, M. Levêque, V. Bézirard, C. Héliès-Toussaint, F. B. Y. Estrada, V. Tondereau, Y. Lippi, C. Naylies, L. Peyriga, C. Canlet, A. M. Davila, F. Blachier, L. Ferrier, E. Boutet-Robinet, F. Guéraud, V. Théodorou and F. H. F. Pierre, Haem iron reshapes colonic luminal environment: impact on mucosal homeostasis and microbiome through aldehyde formation, Microbiome, 2019, 7, 72 CrossRef PubMed.
- T. Van Hecke, L. M. A. Jakobsen, E. Vossen, F. Guéraud, F. De Vos, F. Pierre, H. C. S. Bertram and S. De Smet, Short-term beef consumption promotes systemic oxidative stress, TMAO formation and inflammation in rats, and dietary fat content modulates these effects, Food Funct., 2016, 7, 3760–3771 RSC.
- J. Alary, F. Bravais, J. P. Cravedi, L. Debrauwer, D. Rao and G. Bories, Mercapturic acid conjugates as urinary end metabolites of the lipid peroxidation product 4-hydroxy-2-nonenal in the rat, Chem. Res. Toxicol., 1995, 8, 34–39 Search PubMed.
- L. M. A. Jakobsen, C. C. Yde, T. Van Hecke, R. Jessen, J. F. Young, S. De Smet and H. C. Bertram, Impact of red meat consumption on the metabolome of rats, Mol. Nutr. Food Res., 2017, 61(3) DOI:10.1002/mnfr.201600387.
- J. Delgado, D. Ansorena, T. Van Hecke, I. Astiasarán, S. De Smet and M. Estévez, Meat lipids, NaCl and carnitine: Do they unveil the conundrum of the association between red and processed meat intake and cardiovascular diseases?_Invited Review, Meat Sci., 2021, 171, 108278 CrossRef CAS PubMed.
Footnote |
| † Electronic supplementary information (ESI) available. See DOI: https://doi.org/10.1039/d5fo00900f |
| This journal is © The Royal Society of Chemistry 2025 |