
High power lithium-ion battery based on a LiMn2O4 nanorod cathode and a carbon-coated Li4Ti5O12 nanowire anode†
Xiuli Su,
Jingyuan Liu,
Congcong Zhang,
Tao Huang,
Yonggang Wang and
Aishui Yu*
Department of Chemistry, Shanghai Key Laboratory of Molecular Catalysis and Innovative Materials, Institute of New Energy, iChEM (Collaborative Innovation Center of Chemistry for Energy Materials), Fudan University, Shanghai 200433, China. E-mail: asyu@fudan.edu.cn
First published on 26th October 2016
Abstract
Lithium-ion batteries have been widely applied to power various devices because of their high energy density. However, their power performance is generally limited by the Li+ diffusion in the bulk of electrode-active materials and is much lower than that of a supercapacitor. Herein, nano-structured cathode (spinel LiMn2O4 nanorods) and anode materials (carbon-coated Li4Ti5O12 nanowires) are prepared by hydrothermal approaches with subsequent heat treatments or a chemical vapor deposition treatment. Electrochemical investigation demonstrates that the nano-size and one-dimensional structure of the prepared electrode materials can efficiently shorten Li+ diffusion length and reduce interface impedance, and thus they exhibit much higher rate capability than that of the micro-sized LiMn2O4 and Li4Ti5O12. The LiMn2O4 nanorods and carbon-coated Li4Ti5O12 nanowires were then used to build a full cell that exhibits supercapacitor-like power performance (a maximum power density of 6880 W kg−1), long life (500 cycles with a capacity retention of 81%) and high energy density (a maximum energy density of 140 W h kg−1).
1. Introduction
As a typical power source, rechargeable lithium-ion batteries (LIBs) have been widely used in various applications, including portable devices and electric vehicles (EVs).1 It is well known that the operation of current LIBs depends on Li+ insertion/de-insertion in electrode materials. Therefore, the charge/discharge rate is generally limited by the Li+ diffusion in the bulk of electrode-active materials.1 Accordingly, LIBs can take hours to recharge when they run down. To overcome this limitation, much efforts have been focused on nano-sized electrode materials to shorten the Li+ diffusion length.1,2 However, the interface between nano-sized particles generally increases the interface impedance in the electrode, which limits efficient electron transfer. In recent years, morphology control of nano-sized electrode materials was developed to solve this problem. For instance, one-dimensional nano-structures, e.g. nanowires and nanorods, can not only shorten diffusion length but also facilitate electron transfer.3–11In addition to the nano size and morphology, the inherent characteristics of electrode-active materials are important to build high performance LIBs. In particular, the desired LIBs should have high safety, promising energy density and long life in addition to high power performance. For current LIBs, the anode is still dominated by carbon materials (i.e. graphite). One of the safety issues in LIBs will arise from dendritic lithium growth on the graphite surface over high rate charge/discharge process, because the Li-insertion potential of graphite anodes almost approaches 0 V (vs. Li/Li+).12 In recent years, spinel Li4Ti5O12 has been widely investigated as a promising anode material for high safety LIBs, owing to its Li insertion operating at about 1.5 V (vs. Li/Li+).12–14 In addition, as a zero-expansion electrode material over the charge/discharge cycle, Li4Ti5O2 exhibits a very long cycle life.15 Therefore, it is also a promising anode candidate for long life LIBs. However, the rate capability of Li4Ti5O12 generally is limited by its insulating character and slow Li-ion diffusion coefficient over Li+ insertion. Various methods, including carbon coating, conductive modification,16–18 metal/non-metal ion doping,19–22 and nano-sizing/nano-structuring,23–25 have been developed to increase the rate capability of Li4Ti5O12. With these efforts, the rate performance of Li4Ti5O12 has been considerably improved, and some advanced Li4Ti5O12 electrodes even exhibit the high rate capability that is close to a supercapacitor electrode.16,26–28 For example, nano-sized Li4Ti5O12 (anode) has been coupled with activated carbon (cathode) to fabricate the hybrid Li-ion supercapacitor with supercapacitor-like high power and long cycle life.16,29–31 However, the energy density of the hybrid Li-ion supercapacitor is much limited by the carbon cathode, because the charge storage of activated carbon only depends on the surface ions' adsorption/desorption.16,29–31 On the other hand, a Li4Ti5O12 anode was also combined with a conventional intercalation compound cathode, such as LiCoO2, LiNi0.33Co0.33Mn0.33O2, LiMn2O4, LiNi0.5Mn1.5O4, LiFePO4, LiFexMn(1−x)PO4 and LiCoPO4, to develop LIBs with promising energy density and long life.32–38 However, the achieved power performance of these Li4Ti5O12-based LIBs is far from that of supercapacitors or hybrid Li-ion supercapacitors. Therefore, it is necessary to further design and optimize the morphology and nano-size of both electrode materials (anode and cathode) to build Li4Ti5O12-based LIBs with supercapacitor-like high power, long life and high energy density.
In this study, LiMn2O4 (LMO) nanorods and carbon-coated Li4Ti5O12 (LTO) nanowires were prepared by a hydrothermal approach with subsequent heat treatments and a hydrothermal method, followed by a chemical vapor deposition treatment. Their electrochemical performances were then investigated in comparison with micro-sized LiMn2O4 (LMO) and Li4Ti5O12 (LTO), which were prepared by solid-state methods. Finally, the prepared LMO nanorods and carbon-coated LTO nanowires were used as cathode and anode, respectively, to build a LIB with supercapacitor-like power performance, long life and high energy density.
2. Experimental section
2.1 Preparation of LMO nanorods
The precursor of MnO2 was prepared by a chemical method that is similar to a previous report.39 In a typical synthesis, KMnO4 (2.5 mmol) was added into deionized water (80 mL), and the solution was stirred continuously to maintain homogeneity. Then, sulfuric acid (1.25 mmol) was dropped into the abovementioned solution. Finally, 3.0 mL of ethanol was injected to act as a reductant. During the reaction, the solution turned dark-brown and MnO2 was precipitated. After centrifugation and water washing, the prepared MnO2 was mixed with 0.1 M LiOH solution and stirred for 1 h, and then moved to a 100 mL Teflon-lined autoclave at 160 °C for 48 h. The end-product was filtered, washed and dried at 70 °C, finally calcined at 550 °C for 6 h and then at 800 °C for 1 h. The content of Li and Mn in the prepared LMO product was analyzed by inductively coupled plasma ΣICPΠ technology. The result shows that the molar ratio of Li and Mn was 1.1![[thin space (1/6-em)]](https://www.rsc.org/images/entities/char_2009.gif) :2, indicating that the prepared product is a Li-rich (or Li-doped) spinel (i.e. Li1.1Mn2O4). For convenience, the prepared product was written as LiMn2O4 (LMO) in the present study. Micro-sized LMO was prepared by a conventional solid-state method (see ESI for details†).
:2, indicating that the prepared product is a Li-rich (or Li-doped) spinel (i.e. Li1.1Mn2O4). For convenience, the prepared product was written as LiMn2O4 (LMO) in the present study. Micro-sized LMO was prepared by a conventional solid-state method (see ESI for details†).
2.2 Synthesis of carbon-coated LTO nanowires
In this synthesis, Na–Ti–O nanowires precursor was prepared by a hydrothermal method using anatase TiO2 and 10 M NaOH solution as raw materials, which is as previously reported.18,40 Then, the resulting Na–Ti–O nanowires were dispersed in a 1 M HCl solution for 12 hours under stirring condition; furthermore, the ion exchange between H+ and Na+ results in the formation of H2Ti3O7. After filtration and washing treatment, H2Ti3O7 powder was obtained. Next, the prepared H2Ti3O7 was transferred into a Teflon-lined autoclave containing 0.6 M LiOH aqueous solution and then maintained at 100 °C for 24 hours. The resulting suspension was filtered and washed until the pH value reached 7 to obtain the Li4Ti5O12 precursor. Finally, a chemical vapor deposition (CVD) process was employed to convert the obtained precursor into carbon-coated Li4Ti5O12 nanowires. After being maintained at 600 °C for 1.5 h and 800 °C for 2 h with argon-carried toluene vapor, the black powder of carbon-coated LTO nanowires was obtained. Micro-sized LTO was prepared by a conventional solid-state method (see ESI for details†).2.3 Materials characterization
Powder X-ray diffraction (XRD) data of LMO and LTO products were collected with a Bruker D8 Advance diffractometer using a Cu-Kα radiation source with a step size of 10° min−1 from 10° to 90°. The morphology of these products was characterized by field-emission scanning electron microscopy (SEM, Hitachi S-4800A) and transmission electron microscopy (TEM, JEM-2100F). Thermogravimetric (TG) measurements were conducted using a Perkin-Elmer TGA 7 to clarify the carbon content in the LTO products.2.4 Electrochemical measurements
Prior to the measurement of full cells, the electrochemical profile of the prepared LMO nanorods and carbon-coated LTO nanowires was investigated by half-cells (coin cells) using metallic lithium as the reference and counter electrode. Micro-sized LMO and LTO were also investigated under the same conditions for comparison. In the preparation of the electrode, LMO or LTO powders (85 wt%), carbon conductive agent of super P (5 wt%) and polyvinylidene difluoride (PVDF) binder (10 wt%) were dispersed in N-methyl-2-pyrrolidone (NMP) solvent to form a slurry. The slurry of the mixture was coated on an Al or Cu foil using a coating device, which has a scale on it to control the layer thickness. After coating, the electrodes were dried at 80 °C to remove the solvent before pressing. The electrodes were then punched in the form of disks and dried at 80 °C for 12 h under vacuum. The electrodes have a weight load of active material ca. 3.5 mg cm−2. The cells were assembled in an argon-filled glove box. The electrolyte solution was 1 M LiPF6 in ethylene carbonate (EC)/dimethyl carbonate (DMC) with a volumetric ratio of 1:1, and the separator was a polypropylene microporous film (Celgard® 2300). Cyclic voltammetry (CV) tests were carried out on a CHI 660 electrochemical workstation. The galvanostatic charge–discharge tests were conducted using a LAND cycler (Wuhan Land Electronic Co. Ltd.). EIS measurement was carried out on ZAHNER IM6ex electric workstation (Germany). The amplitude of the AC signal was 5 mV over a frequency range from 100 kHz to 10 mHz. Impedance spectra of the LMO (or LTO) electrodes were obtained at 4.1 V (or 1.54 V) vs. Li/Li+. The electrochemical performance of full cells was also determined using coin cells in which the LMO (mass loading: ∼3.5 mg cm−2) and LTO (mass loading: ∼2.8 mg cm−2) electrodes were used as cathode and anode, respectively. The assembly process, electrolyte and separator were as same as that of the half-cell mentioned above.
3. Results and discussion
XRD pattern of the prepared LMO nanorods is given in Fig. 1a. The reflections located at 18.6°, 36.1°, 37.8°, 43.8°, 48.1°, 58.2°, 63.9° and 67.3° (2θ) can be indexed to (111), (311), (222), (400), (311), (511), (440) and (531) planes of the spinel structure with Fd3m space group (JCPS card no. 89-0106). The locations of these major reflections are the same as that of micro-sized LMO prepared by the solid-state method (Fig. S1 and S2†), indicating that there are no impurity phases in the prepared LMO nanorods. It can be detected from the SEM image (Fig. 1b) that the prepared LMO are typically 50–100 nm in diameter and can be up to ∼1 μm in length. It should be noted that some LMO nanoparticles can also be detected in the SEM image (Fig. 1b), indicating that the prepared LMO does not display very uniform morphology of nanorods. The TEM image (Fig. 1c) confirms that the diameter and length of the prepared LMO nanorods are 50–100 nm and ∼1 μm, respectively. Furthermore, it can also be observed from the TEM image that there are some LMO nanoparticles on top of the LMO nanorods, which is consistent with the SEM image (Fig. 1b). In the high resolution TEM image (Fig. 1d), the crystalline framework of the prepared LMO can be observed clearly.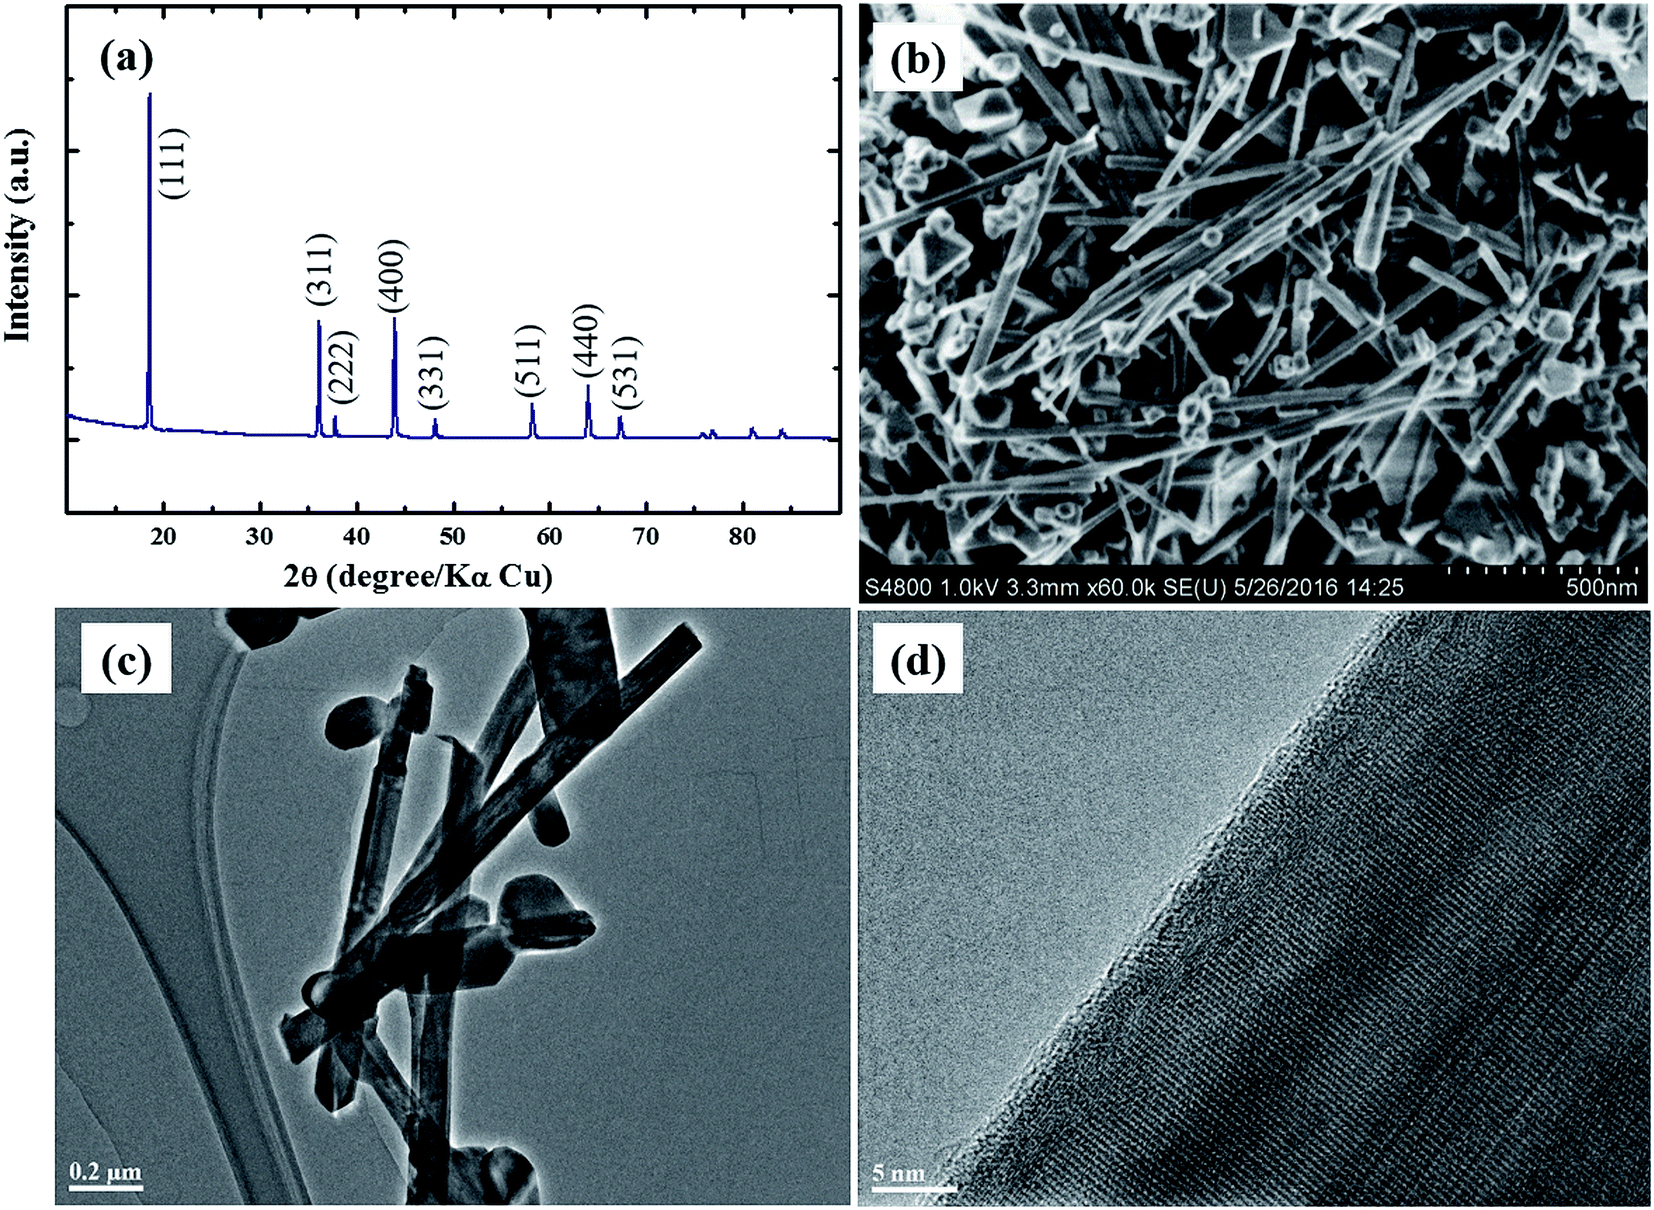 | ||
| Fig. 1 XRD pattern (a), SEM image (b) and TEM image (c and d) of prepared LMO nanorods. | ||
Fig. 2a presents the XRD pattern of the prepared carbon-coated LTO nanowires, which shows features of spinel Li4Ti5O12 with the typical Fd3m space group. The SEM image of the prepared LTO is shown in Fig. 2b, where it can be observed that the prepared LTO displays a bundle-like microstructure that is constructed from LTO nanowires. As shown in the TEM image (Fig. 2c), the typical sizes of the prepared LTO are 50–100 nm in diameter and 1–2 μm in length, indicating the morphology of nanowires. In the high resolution TEM image (Fig. 2d), it can be clearly detected that the LTO nanowire is coated with a uniform carbon layer with a typical thickness of 1–2 nm, which arises from the CVD treatment. TG analysis indicates that the carbon content in the LTO product is ∼5 wt%. The XRD pattern and SEM image of micro-sized Li4Ti5O12 are given in Fig. S3 and S4,† respectively.
 | ||
| Fig. 2 XRD pattern (a), SEM image (b) and TEM image (c and d) of prepared carbon-coated LTO nanowires. | ||
Cyclic voltammetry (CV) measurements at a sweep rate of 0.1 mV s−1 were employed to characterize the primary electrochemical performance of the prepared LMO nanorods, micro-sized LMO, carbon-coated LTO nanowires, and micro-sized LTO. As shown in Fig. 3a and b, both LMO samples display the same CV profile that includes two pairs of typical peaks: anodic peaks at 4.09 and 4.20 V (vs. Li/Li+) and cathodic peaks at 3.99 and 4.11 V (vs. Li/Li+). According to previous reports,41 the Li-ion de-intercalation from LiMn2O4 involves two continuous steps: the first step located at 4.09 V arises from an extraction of Li ion from half of the tetrahedral sites (8a) in the spinel; and the second step at 4.20 V is ascribed to an extraction of Li ions from the remaining tetrahedral sites. It can also be observed that the gap between the two steps for LMO nanorods (Fig. 3a) seems slightly smaller than that for micro-sized LMO (Fig. 3b). This phenomenon may be attributed to their different Li content. To clarify this point, ICP technology was used to determine the molar ratio of Li and Mn in the prepared products. The results of ICP show that the molar ratios Li:Mn are 1.1:2 for LMO nanorods and 1.07:2 for micro-sized LMO, indicating that both samples are Li-rich (or Li-doped) LiMn2O4 spinels (i.e. Li1.1Mn2O4 nanorods and micro-sized Li1.07Mn2O4). It has been well demonstrated that Li-doped spinel can alleviate Mn dissolution and increase cycle life of LMO.42 It was also found that Li-doped spinel (i.e. Li1+xMn2O4) exhibits smaller potential gap between the two voltage plateaus than that of pure LiMn2O4.43 CV curves of the carbon-coated LTO nanowires and micro-sized LTO are given in Fig. 3c and d, respectively. Both samples exhibit a pair of redox peaks that locate in the potential window of 1.4–1.7 V (vs. Li/Li+) during the negative-scan and positive-scan processes, which corresponds to the intercalation and de-intercalation reactions of Li ion.
 | ||
| Fig. 3 CV curves at the sweep rate of 1 mV s−1 of LMO nanorods (a), micro-sized LMO (b), carbon-coated LTO nanowires (c) and micro-sized LTO (d). | ||
To examine the effects of particle size and morphology on the electrochemical performance of LMO, the rate and cycling capabilities of the two types of LMO were characterized and are given in Fig. 4. The half-cell was charged/discharged at the same C-rates in the potential window from 3.0 to 4.5 V (vs. Li/Li+). As shown in Fig. 4a, the specific capacity of LMO nanorods is 103 mA h g−1 at 1C (110 mA g−1). As the current rate increases from 5C to 20C, the specific capacity only slightly decreases from 100 mA h g−1 to 92 mA h g−1. Even at 50C, the specific capacity is still as high as 50 mA h g−1, corresponding to 48.54% of the specific capacity at 1C. When it comes to micro-sized LMO (Fig. 4b), the specific capacity is 107 mA h g−1 at 1C (110 mA g−1). Different from LMO nanorods, the specific capacity falls quickly from 96 mA h g−1 to 69 mA h g−1 when the rate changes from 5C to 20C. When the C-rate is set as 50C, the specific capacity is only 21 mA h g−1, corresponding to 19.62% of the specific capacity at 1C. Obviously, LMO nanorods have a much better rate capability compared with micro-sized LMO. Fig. 4c and d present cycling performance of LMO nanorods and micro-sized LMO, respectively, in the potential window from 3.0 to 4.5 V at 1C. LMO nanorods maintain 95.24% of the initial capacity after 500 cycles, and micro-sized LMO delivers a capacity retention of 85.18% after 500 cycles. The good cycling performance achieved for both samples should be attributed to their lithium-rich characteristics. According to Xia et al.'s early report,42 lithium richness (or lithium doping) can efficiently improve the cycle life of LMO spinels. The TEM image of LMO nanorods after the cycling test is given in Fig. S5† wherein it can be observed that the one-dimensional structure is well maintained.
 | ||
| Fig. 4 Rate performance from 1C to 50C and cycle test at 1C of LMO nanorods (a and c) and micro-sized LMO (b and d). | ||
Fig. 5 summarizes the rate and cycling performance of the two types of LTO. As seen in Fig. 5a, carbon-coated LTO nanowires display a discharge capacity of 162 mA h g−1 at the rate of 1C (160 mA g−1) with a flat potential plateau at about 1.5 V (vs. Li/Li+). When the current rate increases from 5C to 30C, the specific discharge capacity decreases from 125 mA h g−1 to 62 mA h g−1. Even with the high rate of 50C, the carbon-coated LTO nanowires still exhibit a discharge capacity of about 45 mA h g−1. It can be observed from Fig. 5b that the initial discharge capacity of micro-sized LTO reaches 145 mA h g−1 at the low rate of 1C. However, the discharge capacity of micro-sized LTO reduces to 18 mA h g−1 at the rate of 30C. In particular, at the high rate of 50C, the micro-sized LTO cannot deliver any capacity, indicating that its rate performance is much lower than that of the carbon-coated LTO nanowires. The cycle profile of the carbon-coated LTO nanowires is shown in Fig. 5c. It can be seen that the discharge capacity of carbon-coated LTO nanowires reduces from 161 mA h g−1 to 140 mA h g−1 over 500 cycles, indicating a capacity retention of 87%. The TEM image shown in Fig. S6† indicates that the carbon-coated LTO nanowires kept their one-dimensional structure well after the cycling test. As shown in Fig. 5d, micro-sized LTO delivers a capacity retention of 70% after 500 cycles, which is lower than that of carbon-coated LTO nanowires.
 | ||
| Fig. 5 Rate performance from 1C to 50C and cycle test at 1C of carbon-coated LTO nanowires (a and c) and micro-sized LTO (b and d). | ||
The abovementioned results (Fig. 4 and 5) clearly demonstrate that the LMO nanorods (or carbon-coated LTO nanowires) display much better rate performance than micro-sized LMO (or LTO). The improved rate performance arises from the shortened diffusion length from the nano-size and the reduced interface resistance from one-dimensional morphology. EIS measurements were employed to further clarify this point. The impedance spectra of these samples (i.e. LMO nanorods, micro-sized LMO, carbon-coated LTO nanowires, and micro-sized LTO) tested at a discharge depth of ∼50% (4.1 V vs. Li/Li+ for LMO samples; 1.54 V vs. Li/Li+ for LTO samples) are given in Fig. 6. All samples exhibit dispersed semicircles in their impedance spectra. It can also be seen that diameters of the dispersed semicircles of micro-sized LMO and LTO are larger than those of LMO nanorods and carbon-coated LTO nanowires, indicating higher resistance. To further determine the impedance difference of these samples, electrochemical impedance spectra were simulated by an equivalent circuit (inset in Fig. 6a or b). In the equivalent circuit, Ri, representing the internal resistance of electrode and electrolyte, corresponds to the intercept at high frequency. The other impedance could be considered as the surface film resistance (Rsf) in parallel with a capacitance (CPE1) in the high frequency region, the charge-transfer impedance (Rct) combined with a double-layer capacitance (CPE2) in the medium frequency region and the Warburg resistance (W) related to the diffusion of Li+ into the bulk electrode in the low frequency region. The fitting results are summarized in Table 1. As shown in Table 1, the interface impedance (Rsf) of LMO nanorods or LTO nanowires is much lower than that of micro-sized LMO or LTO, which should be attributable to their one-dimensional morphology. As a result, the LMO nanorods or LTO nanowires also display lower charge-transfer impedance (Rct), which results in their high rate performance.
 | ||
| Fig. 6 Impedance spectra of LMO nanorods/micro-sized LMO (a) and carbon-coated LTO nanowires/micro-sized LTO (b). | ||
| Sample | Ri (Ω) | Rsf (Ω) | Rct (Ω) |
|---|---|---|---|
| LMO nanorods | 4.32 | 9.12 | 8.27 |
| Micro-sized LMO | 4.67 | 15.23 | 17.15 |
| Carbon-coated LTO nanowires | 3.47 | 17.81 | 20.35 |
| Micro-sized LTO | 3.73 | 67.23 | 42.07 |
After the half-cell investigation, the LMO nanorods and carbon-coated LTO nanowires were employed as cathode and anode, respectively, to fabricate full cells. The mass ratios of LMO:LTO was 5:4 (3.5/2.8 mg cm−2) and the anode was slightly excessive. The full cells were cycled in the voltage window of 1.2–3.5 V. The achieved rate performance of a carbon-coated LTO nanowire//LMO nanorod cell from 1C to 50C is summarized in Fig. 7a wherein the rates and the specific capacities were calculated on the basis of the mass of LMO on the cathode. As given in Fig. 7a, discharge capacities for 1C (110 mA gLMO−1) and 5C rates are 104 mA h g−1 and 94 mA h g−1, respectively. With the rates of 20C and 30C, the specific capacities can still reach 78 mA h g−1 and 67 mA h g−1, respectively, corresponding to 75% and 61% of specific capacity at 1C. Even at a very high rate of 50C, the cell still exhibits a specific capacity of 47 mA h g−1. Micro-sized LMO and LTO were also used to fabricate full cells, and the rate capability was investigated under the same conditions for comparison (Fig. 7b). It can be seen from Fig. 7b that the micro-sized LTO//LMO cell displays a discharge capacity of 106 mA h g−1 at the low rate of 1C. However, when C-rate is set as 50C, the micro-sized LTO//LMO cell just delivers a very small discharge capacity of 12 mA h g−1.
 | ||
| Fig. 7 Rate performance from 1C to 50C of LTO nanowires//LMO nanorods full cell (a) and micro-sized LTO//LMO full cell (b). | ||
Energy density and power density of carbon-coated LTO nanowires//LMO nanorods and micro-sized LTO//LMO cells were calculated on the basis of the total mass of the LMO and LTO, and the consequences are given in the form of a Ragone plot (Fig. 8). As shown in Fig. 8, both cells exhibit the same maximum energy density of 140 W h kg−1. However, the achieved energy density (58 W h kg−1) at the maximum power density (6880 W kg−1) of the carbon-coated LTO nanowires//LMO nanorods cell is much higher than that of the micro-sized LTO//LMO cell (12 W h kg−1 at the maximum power density of 5911 W kg−1). Furthermore, the performances (energy/power density) of some reported LTO-based hybrid Li-ion supercapacitors16,29–31 and other supercapacitors44–52 are also summarized in Fig. 8 for comparison. It can be observed that the power performance of the carbon-coated LTO nanowires//LMO nanorods cell is close to that of supercapacitors;16,28–30,40–48 however, its energy density is much higher than them. Cycling profiles at a rate of 1C of the carbon-coated LTO nanowires//LMO nanorods cell and the micro-sized LTO//LMO cell are shown in Fig. 9a and b, respectively. As shown in Fig. 9, both cells can maintain their coulombic efficiency around 100% during 500 cycles with a capacity retention of ∼81% for the carbon-coated LTO nanowires//LMO nanorods cell and ∼75% for the micro-sized LTO//LMO cell.
 | ||
| Fig. 8 Ragone plots of LTO nanowires//LMO nanorods and micro-sized LTO//LMO full cells. | ||
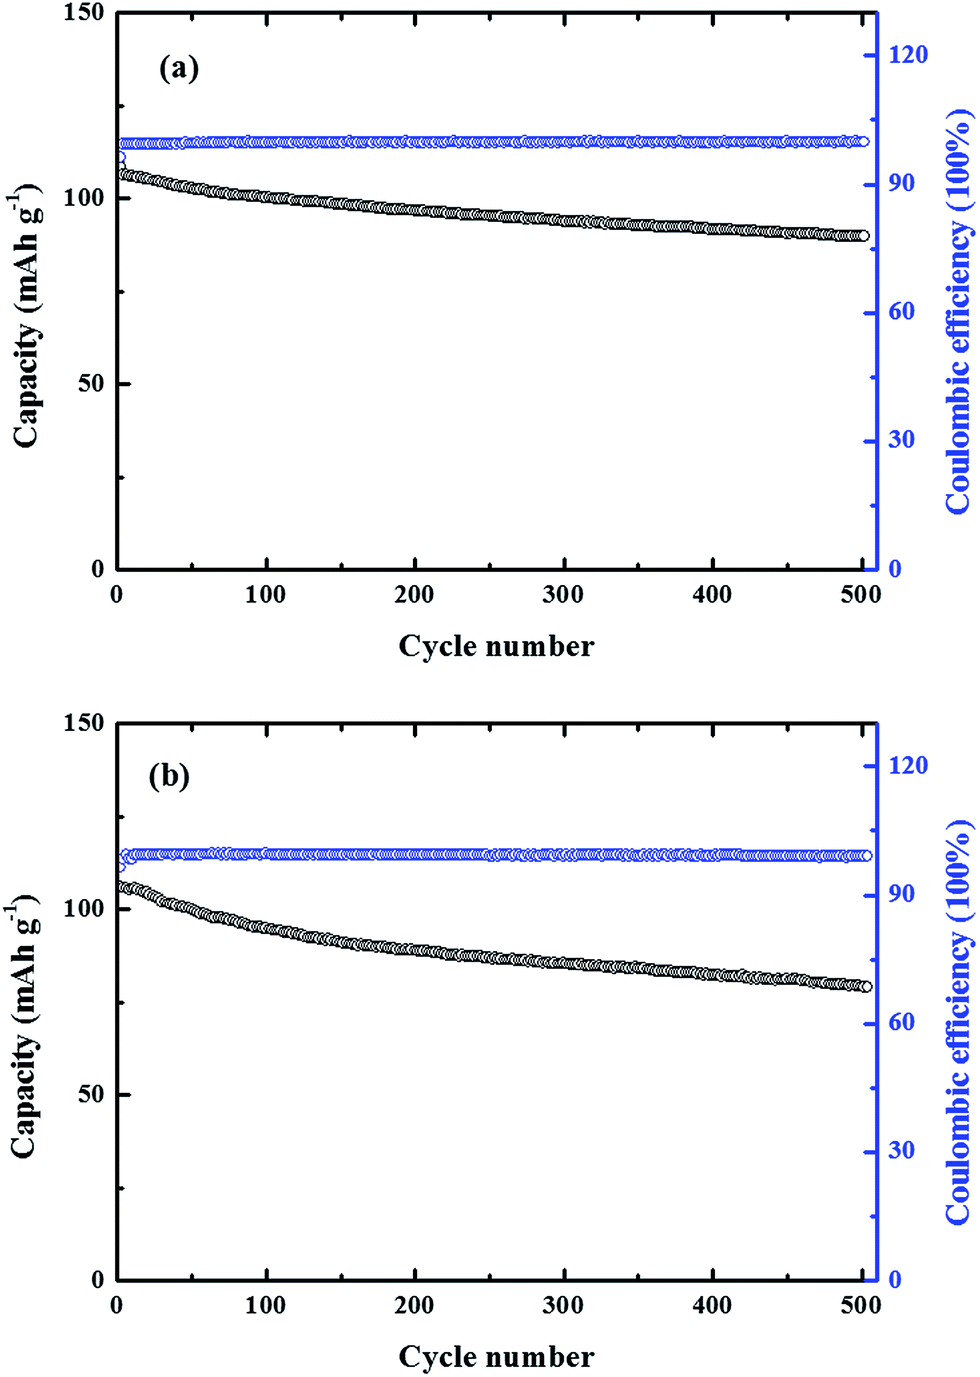 | ||
| Fig. 9 Cycle performance of LTO nanowires//LMO nanorods full cell (a) and micro-sized LTO//LMO full cell (b). | ||
4. Conclusion
In the present study, LMO nanorods and carbon-coated LTO nanowires were prepared by a conventional hydrothermal approach with a subsequent heat treatment or a chemical vapor deposition treatment. It was demonstrated that the nano-size and one-dimensional structure of the prepared LMO nanorods and carbon-coated LTO nanowires can efficiently shorten the Li+ diffusion length and reduce interface impedance, and thus exhibit much higher rate capabilities than micro-sized LMO and LTO. Finally, the LMO nanorods and carbon-coated LTO nanowires were employed as cathode and anode, respectively, to fabricate a full cell. The achieved results indicate that the full cell displays high power performance, close to supercapacitors, long life and high energy density. It is thus believed that the full cell unites the advantages of supercapacitors and LIBs.Acknowledgements
The authors acknowledge funding support from the 973 Program (2013CB934103) and the Science & Technology Commission of Shanghai Municipality (12dz1200402 & 08DZ2270500), China.References
- P. G. Bruce, B. Scrosati and J. M. Tarascon, Angew. Chem., Int. Ed., 2008, 47, 2930–2946 CrossRef CAS PubMed.
- Q. F. Zhang, E. Uchaker, S. L. Candelaria and G. Z. Cao, Chem. Soc. Rev., 2013, 42, 3127–3171 RSC.
- W. H. Li, M. S. Li, Z. Z. Yang, J. Xu, X. W. Zhong, J. Q. Wang, L. C. Zeng, X. W. Liu, Y. Jiang, X. Wei, L. Gu and Y. Yu, Small, 2015, 11, 2762–2767 CrossRef CAS PubMed.
- H. S. Li, L. F. Shen, B. Ding, G. Pang, H. Dou and X. G. Zhang, Nano Energy, 2015, 12, 18–27 CrossRef.
- L. Y. Liang, Y. M. Xu, Y. Lei and H. M. Liu, Nanoscale, 2014, 6, 3536–3539 RSC.
- T. B. Lan, J. Dou, F. Y. Xie, P. X. Xiong and M. D. Wei, J. Mater. Chem. A, 2015, 3, 10038–10044 CAS.
- J. F. Ni, S. D. Fu, C. Wu, Y. Zhao, J. Maier, Y. Yu and L. Li, Adv. Energy Mater., 2016, 6, 1502568 CrossRef.
- C. J. Niu, J. S. Meng, C. H. Han, K. N. Zhao, M. Y. Yan and L. Q. Mai, Nano Lett., 2014, 14, 2873–2878 CrossRef CAS PubMed.
- X. S. Zhou, L. Yu and X. W. Lou, Nanoscale, 2016, 8, 8384–8389 RSC.
- E. Hosono, T. Kudo, I. Honma, H. Matsuda and H. S. Zhou, Nano Lett., 2009, 9, 1045–1051 CrossRef CAS PubMed.
- X. W. Li, S. L. Xiong, J. F. Li, X. Liang, J. Z. Wang, J. Bai and Y. T. Qian, Chem.–Eur. J., 2013, 19, 11310–11319 CrossRef CAS PubMed.
- G. N. Zhu, Y. G. Wang and Y. Y. Xia, Energy Environ. Sci., 2012, 5, 6652–6667 CAS.
- Y. B. He, B. H. Li, M. Liu, C. Zhang, W. Lv, C. Yang, J. Li, H. D. Du, B. Zhang, Q. H. Yang, J. K. Kim and F. Y. Kang, Sci. Rep., 2012, 2, 913 Search PubMed.
- Y. M. Jiang, K. X. Wang, X. Y. Wu, H. J. Zhang, B. M. Bartlett and J. S. Chen, ACS Appl. Mater. Interfaces, 2014, 6, 19791–19796 CAS.
- T. Ohzuku, A. Ueda and N. Yamamoto, J. Electrochem. Soc., 1995, 142, 1431–1435 CrossRef CAS.
- N. S. Xu, X. Z. Sun, X. Zhang, K. Wang and Y. W. Ma, RSC Adv., 2015, 5, 94361–94368 RSC.
- X. Bai, T. Li, C. Wei, Y. K. Sun, Y. X. Qi, H. L. Zhu, N. Lun and Y.-J. Bai, Electrochim. Acta, 2015, 155, 132–139 CrossRef CAS.
- J. Y. Liu, Y. Shen, L. Chen, Y. G. Wang and Y. Y. Xia, Electrochim. Acta, 2015, 156, 38–44 CrossRef CAS.
- S. S. Qian, H. X. Yu, L. Yan, P. Li, X. T. Lin, Y. Y. Zhang, N. B. Long, M. Shui and J. Shu, J. Power Sources, 2016, 322, 68–76 CrossRef CAS.
- J. G. Kim, M. S. Park, S. M. Hwang, Y. U. Heo, T. Liao, Z. Q. Sun, J. H. Park, K. J. Kim, G. Jeong, Y. J. Kim and J. H. Kim, ChemSusChem, 2014, 7, 1451–1457 CrossRef CAS PubMed.
- Q. Y. Zhang, M. G. Verde, J. K. Seo, X. Li and Y. S. Meng, J. Power Sources, 2015, 280, 355–362 CrossRef CAS.
- Z. Zhao, Y. L. Xu, M. Ji and H. Zhang, Electrochim. Acta, 2013, 109, 645–650 CrossRef CAS.
- E. Pohjalainen, T. Rauhala, M. Valkeapää, J. Kallioinen and T. kallio, J. Phys. Chem. C, 2015, 119, 2277–2283 CAS.
- L. Wang, Y. M. Zhang, M. E. Scofield, S. Y. Yue, C. Mcbean, A. C. Marschilok, K. J. Takeuchi, E. S. Takeuchi and S. S. Wong, ChemSusChem, 2015, 8, 3304–3313 CrossRef CAS PubMed.
- L. Zhao, Y. S. Hu, H. Li, Z. X. Wang and L. Q. Chen, Adv. Mater., 2011, 23, 1385–1388 CrossRef CAS PubMed.
- H. G. Jung, S. T. Myung, C. S. Yoon, S. B. Son, K. H. Oh, K. Amine, B. Scrosati and Y. K. Sun, Energy Environ. Sci., 2011, 4, 1345–1351 CAS.
- G. N. Zhu, H. J. Liu, J. H. Zhuang, C. X. Wang, Y. G. Wang and Y. Y. Xia, Energy Environ. Sci., 2011, 4, 4016–4022 CAS.
- J. Liu, K. P. Song, P. A. van Aken, J. Maier and Y. Yu, Nano Lett., 2014, 14, 2597–2603 CrossRef CAS PubMed.
- L. Cheng, X. L. Li, H. J. Liu, H. M. Xiong, P. W. Zhang and Y. Y. Xia, J. Electrochem. Soc., 2007, 154, A692–A697 CrossRef CAS.
- H. H. Xu, X. L. Hu, Y. M. Sun, W. Luo, C. J. Chen, Y. Liu and Y. H. Huang, Nano Energy, 2014, 10, 163–171 CrossRef CAS.
- S. Y. Dong, X. Y. Wang, L. F. Shen, H. S. Li, J. Wang, P. Nie, J. J. Wang and X. G. Zhang, J. Electroanal. Chem., 2015, 757, 1–7 CrossRef CAS.
- V. Aravindan, Y. S. Lee and S. Madhavi, Adv. Energy Mater., 2015, 5, 1402225 CrossRef.
- I. Belharouak, Y. K. Sun, W. Lu and K. Amine, J. Electrochem. Soc., 2007, 154, A1083–A1087 CrossRef CAS.
- X. Y. Liu, T. Huang and A. S. Yu, J. Alloys Compd., 2015, 648, 7–12 CrossRef CAS.
- J.-H. Kim, N. P. W. Pieczonka, Y.-K. Sun and B. R. Powell, J. Power Sources, 2014, 262, 62–71 CrossRef CAS.
- Q. Q. Zou, G. N. Zhu and Y. Y. Xia, J. Power Sources, 2012, 206, 222–229 CrossRef CAS.
- J. Liu, W. Liu, S. M. Ji, Y. C. Zhou, P. Hodgson and Y. C. Li, ChemPlusChem, 2013, 78, 636–641 CrossRef CAS.
- W. Liu, J. Liu, K. F. Chen, S. M. Ji, Y. L. Wan, Y. C. Zhou, D. F. Xue, P. Hodgson and Y. C. Li, Chem.–Eur. J., 2014, 20, 824–830 CrossRef CAS PubMed.
- W. W. Sun, H. Q. Liu, Y. M. Liu, G. X. Bai, W. Liu, S. S. Guo and X. Z. Zhao, Nanoscale, 2015, 7, 13173–13180 RSC.
- V. Gentili, S. Brutti, L. J. Hardwick, A. R. Armstrong, S. Panero and P. G. Bruce, Chem. Mater., 2012, 24, 4468–4476 CrossRef CAS.
- W. Liu, K. Kowal and G. C. Farringtion, J. Electrochem. Soc., 1998, 2, 459–465 CrossRef.
- Y. Y. Xia, T. Sakai, T. Fujieda, X. Q. Yang, X. Sun, Z. F. Ma, J. Mcbreen and M. Yoshio, J. Electrochem. Soc., 2001, 148, A723–A729 CrossRef CAS.
- Y. Y. Xia, H. Noguchi and M. Yoshio, J. Solid State Chem., 1995, 119, 216–218 CrossRef CAS.
- H. G. Jung, N. Venugopal, B. Scrosati and Y. K. Sun, J. Power Sources, 2013, 221, 266–271 CrossRef CAS.
- J. Zhang, X. F. Liu, J. Wang, J. L. Shi and Z. Q. Shi, Electrochim. Acta, 2016, 187, 134–142 CrossRef CAS.
- V. Aravindan, W. Chuiling and S. Madhavi, J. Mater. Chem., 2012, 22, 16026 RSC.
- Q. Wang, Z. H. Wen and J. H. Li, Adv. Funct. Mater., 2006, 16, 2141–2146 CrossRef CAS.
- H. Kim, M. Y. Cho, M. H. Kim, K. Y. Park, H. Gwon, Y. Lee, K. C. Roh and K. Kang, Adv. Energy Mater., 2013, 3, 1500–1506 CrossRef CAS.
- V. Aravindan, Y. L. Cheah, W. F. Mak, G. Wee, B. V. R. Chowdari and S. Madhavi, ChemPlusChem, 2012, 77, 570–575 CrossRef CAS.
- V. Aravindan, W. Chuiling, M. V. Reddy, G. V. Rao, B. V. Chowdari and S. Madhavi, Phys. Chem. Chem. Phys., 2012, 14, 5808–5814 RSC.
- Z. J. Fan, J. Yan, T. Wei, L. J. Zhi, G. Q. Ning, T. Y. Li and F. Wei, Adv. Funct. Mater., 2011, 21, 2366–2375 CrossRef CAS.
- W. C. Jiang, D. S. Yu, Q. Zhang, K. Goh, L. Wei, Y. L. Yong, R. R. Jiang, J. Wei and Y. Chen, Adv. Funct. Mater., 2015, 25, 1063–1073 CrossRef CAS.
Footnote |
| † Electronic supplementary information (ESI) available. See DOI: 10.1039/c6ra23590e |
| This journal is © The Royal Society of Chemistry 2016 |