
Revisiting the crystallization behavior of stearyl alcohol![[thin space (1/6-em)]](https://www.rsc.org/images/entities/h2_char_2009.gif) :stearic acid (SO:SA) mixtures in edible oil
:stearic acid (SO:SA) mixtures in edible oil
Carolin Blacha,
Andrew J. Gravelleb,
Fernanda Peyronelb,
Jochen Weissa,
Shai Barbutb and
Alejandro G. Marangoni*b
aDepartment of Food Physics and Meat Science, Institute of Food Science and Biotechnology, University of Hohenheim, Garbenstrasse 25, 70599 Stuttgart, Germany
bDepartment of Food Science, University of Guelph, Guelph, Ontario, Canada. E-mail: amarango@uoguelph.ca; Tel: +1 519-824-4120
First published on 22nd August 2016
Abstract
Mixtures of stearyl alcohol and stearic acid were some of the first identified oleogelators with potential for food applications. Previously, a synergistic enhancement in gel strength was identified at a stearyl alcohol![[thin space (1/6-em)]](https://www.rsc.org/images/entities/char_2009.gif) :stearic acid (SO:SA) ratio of 7:3 and 8:2, which was attributed to their needle-like crystal morphology. In the present study, we have meticulously characterized this system with a variety of techniques at different gelator ratios. Accelerated oil loss tests showed the stability of the gels mirrors the mechanical strength with ∼1 wt% oil loss in the firm gels and >10 wt% in the weak formulations. X-ray diffraction and light microscopy suggest that the crystal networks which form the hardest gels (8:2, 7:3) and weakest gels (5:5, 4:6) are similar, and thus crystal morphology and crystal size cannot solely explain the observed enhancement in mechanical strength and stability. Scanning electron micrographs clarified that all oleogels crystalized in a platelet-like, rather than needle-like microstructure. Using the scaling theory of cellular solids, the enhancement in mechanical strength of the 8:2 SO:SA oleogel was shown to be mainly due to an increase in the scaling exponent of the hardness to the mass fraction of the crystalline material, and not the total amount of crystalline network solids, the size of the platelets or the interactions between them.
:stearic acid (SO:SA) ratio of 7:3 and 8:2, which was attributed to their needle-like crystal morphology. In the present study, we have meticulously characterized this system with a variety of techniques at different gelator ratios. Accelerated oil loss tests showed the stability of the gels mirrors the mechanical strength with ∼1 wt% oil loss in the firm gels and >10 wt% in the weak formulations. X-ray diffraction and light microscopy suggest that the crystal networks which form the hardest gels (8:2, 7:3) and weakest gels (5:5, 4:6) are similar, and thus crystal morphology and crystal size cannot solely explain the observed enhancement in mechanical strength and stability. Scanning electron micrographs clarified that all oleogels crystalized in a platelet-like, rather than needle-like microstructure. Using the scaling theory of cellular solids, the enhancement in mechanical strength of the 8:2 SO:SA oleogel was shown to be mainly due to an increase in the scaling exponent of the hardness to the mass fraction of the crystalline material, and not the total amount of crystalline network solids, the size of the platelets or the interactions between them.
1. Introduction
Solid fats in food products are not only responsible for the organoleptic properties such as melt-in-mouth effects, but also for physical and functional properties such as hardness, texture, crispiness and spreadability.1 In conventional oil structuring strategies, these desirable traits can be attributed to the presence of higher melting point triglycerides, which form a colloidal network of crystalline particles capable of immobilizing the liquid oil component. However, these higher melting triglycerides are often predominantly made up of saturated and/or trans-fatty acids.2,3 The latter are particularly prevalent in partially hydrogenated oils (PHOs), which represents the main source of industrially-produced trans-fats in the food supply.4Trans-fatty acids in particular are known to have negative effects on lipoprotein (cholesterol) profiles, and their consumption has been associated with increased incidences of heart disease and metabolic syndrome.5 For this reason, the U.S. Food and Drug Administration (FDA) has removed the generally recognized as safe (GRAS) status from PHOs and provided a three-year mandatory compliance period, ending June 18, 2018, so as to remove industrial sources of trans-fats from food products.4 As a result, the food industry is under pressure to identify alternatives for PHOs, without compromising their desirable functional properties. Although saturated fats have more recently been shown to have less negative health effects than was previously thought,6,7 they still carry a negative stigma with consumers, and should thus not be considered a viable replacement.
In recent years, alternative oil structuring agents, known as oleogelators, have been investigated as a possible strategy to eliminate industrial sources of trans-fatty acids and reduce saturated fats from the diet.8–10 Extensive work has been done on different oleogelator systems, which has been summarized in several recent reviews.9–13 Briefly, the structurants can be divided into four main categories;9,10 oil can be immobilized by using (a) colloidal systems including inorganic particles and emulsion droplets,14,15 (b) polymers such as ethylcellulose,16,17 (c) low molecular weight compounds, which self-assemble into fibers, strands, tubules, reverse micelles, or mesophases,18,19 or (d) crystalline particles such as mono- and diglycerides, natural waxes, fatty alcohols, and fatty acids.20–24 Some oleogelators which form crystalline networks, such as mono-and diglycerides or 12-hydroxystearic acid, are used as single components,12,21 while others require the combination of two different gelator molecules to achieve the desired structuring effect. One such two-component gelator system is the mixture of fatty alcohols and fatty acids. Within this group it has been reported that combinations of stearyl alcohol and stearic acid have the highest oil structuring capacity in edible oils.25 It has been shown that the ratio between the alcohol and the acid strongly influences the textural and structural properties of these oleogels, such as hardness and elastic modulus.25,26 In particular, a synergistic enhancement was reported at a stearyl alcohol:stearic acid (SO:SA) ratio of 7:3 in soybean and sunflower oil, and 8:2 in rapeseed oil. Gandolfo et al. suggested that the larger number of smaller crystals observed in this particular mixture relative to the pure components led to a higher mechanical strength. In addition to changes in crystal size, Schaink et al. also reported formulation-based differences in crystal morphology.26 The latter group found that the pure components form platelet-like crystals, while those formed in oleogels with SO:SA mixtures are more needle-shaped. X-ray diffraction analysis led the authors to conclude that those molecules form a mixed crystal containing both structurants. These observation seems to confirm the correlation between the increase in gel strength and differences in microstructure.26 In the present study we will revisit the system in order to prove or disprove this hypothesis and to define the structural basis for the synergistic increase in mechanical strength of these polycrystalline oleogels. Moreover, we also address an issue which has previously been overlooked: that certain intermediate combinations of these molecules also produce oleogels with decreased mechanical strength (such as a SO:SA ratio 5:5), whereas these gels show similar X-ray patterns, microstructure and melting behavior to that of the synergistic formulation.
2. Material and methods
2.1. Sample preparation
All gels were prepared using canola oil from a national Canadian brand (Saporito Foods Inc., Markham, ON, Canada). Unless otherwise stated, as a structurant, 5% (wt/wt) of stearyl alcohol (1-octadecanol) C18H37OH (95% purity; Acros Organics, Fisher Scientific, Ottawa, ON, Canada), stearic acid (1-octadecanoic acid) C18H35OOH (97% purity; Acros Organics, Fisher Scientific), and combinations thereof were used. In total 11, different stearyl alcohol:stearic acid (SO:SA) formulations were prepared: 10:0, 9:1, 8:2, 7:3, 6:4, 5:5, 4:6, 3:7, 2:8, 1:9, 0:10. To eliminate any influence of crystal memory, the canola oil with added powder mixtures of all different proportions of SO:SA was heated to 100 °C in an oven for 1 hour. After heating, the mixture was stirred for 10 seconds and either split into 5 glass test tubes for mechanical testing or the solution was poured into a 20 ml scintillation vial for other experiments. The samples were transferred to a refrigerator (∼10 °C) immediately after pouring and allowed to crystallize overnight. Each formulation was prepared in triplicate and all subsequent measurements were performed after 24 h of storage at ∼10 °C in three independent replicates.
2.2. Analysis
800g. The maximum temperature the samples would reach during centrifugation was ∼18 °C. After centrifugation the expelled oil was removed with a pipette and the sample was reweighed. The amount of oil loss was reported as the weight percent.:1 gel:solvent ratio). The de-oiled gel was dried for 60 h prior to imaging to ensure that all of the solvent had evaporated. The filter papers containing the gel were mounted to the surface of a copper holder using Tissue-Tek O.C.T. Compound (Canemco Supplies, St. Laurent, Quebec, Canada). The copper holder was placed in an Emitech K1250X cryo-preparation unit (Ashford, Kent, UK) and then plunged into liquid nitrogen slush (−210 °C), immobilizing the crystals in the residual oil phase. Samples were sputter coated with ∼30 nm of gold and transferred under vacuum to the SEM unit (Hitachi S-570, Tokyo, Japan). Samples were imaged using an acceleration voltage of 10 kV. Quartz PCI imaging software version 8 (Quartz Imaging Corp., Vancouver, BC, Canada) was used to capture digital images.:SA ratio, a series of gels with 7, 9 and 11% total structurant at all 11 SO:SA ratios were prepared as described above. The hardness of these gels and the SFC at 10 °C were measured with the previously described methods (Sections 2.2.1; 2.2.5).3. Results and discussion
3.1. Back extrusion
The average hardness of the gels with varying SO:SA formulations is shown in Fig. 1. The gels with a ratio of 8:2 exhibited the greatest hardness (2.38 ± 0.05 N), followed by the 7:3 formulation (1.84 ± 0.09 N). This is consistent with the synergistic ratio reported by Gandolfo et al., where they observed a drastic increase in gel strength at a SO:SA ratio of 7:3 in sunflower and soybean oil, and 8:2 in rapeseed oil.25 Schaink et al. also reported that a SO:SA ratio of 7:3 produced the hardest gels in sunflower oil.26 Furthermore, we observed a minor depression in gel strength at intermediate ratios, with a minimum (0.53 ± 0.01 N) occurring at a ratio of 4:6 (Fig. 1). In contrast, Gandolfo et al. reported a minor synergistic increase at a ratio of 3:7, however this could not be reproduced in the present work, nor by Schaink et al. It may therefore be worth noting that in the previous works, the gels were simply heated until the solids were dissolved, before being allowed to cool. In the present investigation, all samples were heated above the melting temperature for 1 hour to avoid possible crystal memory effects. Some of the discrepancies between the mentioned works may be in part due to sample preparation. However, from the data presented in Fig. 1, it seems that the combination of stearyl alcohol and stearic acid can produce either harder gels (e.g. formulation 8:2) or softer gels, (e.g. formulation 4:6) as compared to those structured with the pure components.
 | ||
| Fig. 1 Large deformation mechanical strength of oleogels prepared with varying ratios of stearyl alcohol:stearic acid (SO:SA) in canola oil. All gels were prepared with a total of 5% structurant. | ||
3.2. Oil loss
In Fig. 2, the oil loss from the oleogels with 11 different formulations is shown. This test provides an indication of both gel stability and the oil structuring capabilities of the crystal network for each formulation. These results correlate well with the observed strength of these oleogels (Fig. 1). The hardest gels with a SO:SA ratio of 8:2 and 7:3 exhibited the greatest stability, as they did not expel any oil during centrifugation. In contrast, the softer gels, formulated with a SO:SA ratio in the range of 5:5 to 2:8 showed an average oil loss >8%. The gel formulated with a ratio of 4:6 yielded the highest oil loss of 15.7 ± 1.5%. Although this was not significantly different from a statistical basis, it is consistent with the fact that this gel was the softest in the large deformation mechanical test. In agreement with the results presented here, a positive correlation between mechanical strength and reduced oil loss has been reported previously for semi solid fat matrices.28
 | ||
| Fig. 2 Accelerated oil loss in wt% of oleogels with different formulations of 5% stearyl alcohol:stearic acid (SO:SA) mixtures in canola oil at 10 °C. | ||
3.3. X-ray diffraction
Fig. 3 shows the small and wide angle X-ray scattering (SAXS and WAXS) pattern of selected oleogels made with different SO:SA ratios. Fig. 4 highlights separately the SAXS region for all 11 oleogel formulations and the WAXS region for 5 selected formulations. The position of the Bragg peaks in the SAXS region has typically been used to identify the longitudinal molecular packing arrangement, as peaks observed in this region can correspond to the (001) d-spacing of consecutive atomic crystallographic planes.33 Due to detection limits of the diffractometer, the d-spacing for the (001) plane are reported using the third order reflection (visible in Fig. 3 only). The reported d-spacings are average values of three repetitions with a standard deviation smaller than 0.05 Å. For simplification, only the X-ray patterns for one repetition are shown in Fig. 3 and 4, thus the naming “representative”. Table 1 shows a summary of d-spacings reported in the literature for pure stearyl alcohol and pure stearic acid, as well as for oleogels structured with this two components, separately.
 | ||
| Fig. 3 Representative X-ray diffraction patterns of oleogels formulated with stearyl alcohol:stearic acid (SO:SA) ratios of 10:0, 8:2, 4:6, 3:7, 0:10 in canola oil with a total of 5% structurant. | ||
 | ||
| Fig. 4 Representative X-ray diffraction patterns of stearyl alcohol:stearic acid (SO:SA) oleogels in canola oil with a total of 5% structurant; (A) small angle X-ray scattering (SAXS) region of all 11 oleogel formulations; (B) wide angle X-ray scattering (WAXS) region of oleogels with the SO:SA ratios of 10:0, 8:2, 4:6, 3:7, 0:10. | ||
| Material | SAXS d-spacing (Å) | Molecular arrangement | WAXS d-spacing (Å) | Associated polymorphic form |
|---|---|---|---|---|
| a Ref. 29.b Ref. 30.c Ref. 26.d Ref. 31.e Ref. 32. | ||||
| Pure stearyl alcohol | 49.0a | 4.19a | αa | |
| 49.7a | Double layerb | 4.09, 3.73, 3.64a | Sub αa | |
| 49.57b | — | |||
| 41.8a | Double layerb | 4.3, 4.08, 3.62a | βa,b | |
| 40.96b | — | |||
| Stearyl alcohol in oil | 50.0c | Double layerc | 4.2, 3.8c | β′c |
| 41.5c | Triple layerc | |||
| Pure stearic acid | 38.4d | Double layerd,e | 4.1, 3.7d | C-Formd,e |
| 41.1e | 4.1, 3.7e | |||
| Stearic acid in oil | 41.1e | Double layere,c | 4.1, 3.7e | C-Forme |
| 40.0c | 4.2, 3.8, 3.4c | β′c | ||
The WAXS region of the oleogel with stearyl alcohol exhibited the d-spacings: 4.3, 4.2, 4.1, 3.7 and 3.6 Å. Bragg peaks in this region are used to identify different crystalline polymorphic forms.33 Stearyl alcohol is known to crystalize in three different polymorphic forms: α, sub-α and β.29,34 Kolb et al. correlated an atomic d-spacing of 4.19 Å in the WAXS region and a stearyl alcohol lamellar length of 49.0 Å in the SAXS region to the appearance of the metastable α form. These authors also characterized a sub-α form arising from the α form through further cooling. This polymorphic form was associated with WAXS d-spacings at 4.09, 3.73, 3.64 Å, and 49.7 Å in the SAXS region. Furthermore, they attributed atomic d-spacings at 4.3, 4.08, 3.62 Å and a lamellar length of 41.8 Å to the more stable β form, which was observed after 30 days of storage (Table 1). In another study, Wilson et al. reported values of 49.57 Å for the α form (named sub-α according to Kolb et al.) and 40.9 Å for the β form (Table 1). Following Kolb et al.'s information, the data of the current study suggested that stearyl alcohol crystals in oleogels were packed in two different double layer arrangements consistent with two polymorphic forms: the sub-α and the β form.
![[thin space (1/6-em)]](https://www.rsc.org/images/entities/b_char_2009.gif) :SA ratios: SAXS. The observed SAXS peak positions of the oleogel with a SO:SA ratio of 9:1 were similar to those of the 10:0 gel, while the intensity of the peaks was reversed (Fig. 4a). It was not evident from the SAXS pattern whether stearic acid was completely dissolved, or the amount of crystals containing stearic acid was too low to be detected. However, it seemed that the presence of a small amount of stearic acid affected the packing arrangements of stearyl alcohol.
:SA ratios: SAXS. The observed SAXS peak positions of the oleogel with a SO:SA ratio of 9:1 were similar to those of the 10:0 gel, while the intensity of the peaks was reversed (Fig. 4a). It was not evident from the SAXS pattern whether stearic acid was completely dissolved, or the amount of crystals containing stearic acid was too low to be detected. However, it seemed that the presence of a small amount of stearic acid affected the packing arrangements of stearyl alcohol.The pattern of the 8:2 gel displayed a (001) d-spacing at 41.3 Å and its third order reflection, similar to the peak observed in the 10:0 and 9:1 gels (Fig. 3 and 4a). The d-spacing at 50.0 Å was no longer present; however, a new peak with a d-spacing at 46.7 Å was detected. The third and fifth order reflections of this new peak were also clearly discernible (Fig. 3). The appearance of the peak at d = 46.7 Å indicated that a different simultaneous molecular packing arrangement co-existed with the β form of stearyl alcohol (given by the 41.3 Å) in this particular SO:SA ratio. As the ratio was shifted in favor of stearic acid towards 7:3, 6:4, 5:5, and 4:6, all gels showed the same pattern: a singular peak with a d-spacing at 46.7 Å and its higher order reflections (Fig. 3 and 4a). This d-spacing could not be associated with d-spacings apparent in gels structured with only stearyl alcohol or stearic acid (Table 1). This single peak suggested the formation of a new crystal, which included both stearyl alcohol and stearic acid molecules. Such co-crystallization behavior has been proposed previously.26
The d-spacing at 46.7 Å also appeared in oleogels with a SO:SA ratio of 3:7 and 2:8. Additionally, another d-spacing at 40.2 Å occurred in these two samples (Fig. 4a). Both peaks exhibited higher order reflections (Fig. 3). The presence of these two distinct d-spacings once again indicated the coexistence of two different packing arrangements. Finally, the 1:9 gel showed the same X-ray pattern as the previously discussed 0:10 gel, namely only the peak with a d-spacing at 40.2 Å. It can thus be suggested that the d-spacing at 40.2 Å observed in gels with a SO:SA ratio of 3:7, 2:8 and 1:9 was due to the presence of pure stearic acid crystals.
:SA ratios: WAXS. Comparing the WAXS pattern of the 9:1 gel to the one of the 10:0 gel, only the peaks corresponding to a d-spacing at 4.1 and 3.6 Å were detectable, while the d-spacings of 4.3, 4.2, and 3.7 Å were not present (data not shown). The two peaks could be correlated to the β form of stearyl alcohol (Table 1). The results of the SAXS region for this particular formulation (Fig. 4a) supported this correlation: the peak with a d-spacing of 41.3 Å, which could also be correlated to the β form (Table 1), showed a higher intensity as the peak correlated with the sub-α form of stearyl alcohol (50 Å). The introduction of stearic acid seemed to promote the formation of stearyl alcohol crystals in the β-form, while preventing them from crystallizing in the sub-α form in this particular SO:SA formulation.The 8:2 gel, which was described as forming two different packing arrangements in the SAXS region (Fig. 4a), also suggested the co-existence of two polymorphic forms (Fig. 4b). The d-spacing at 4.1 Å could be correlated with the β form of the stearyl alcohol, while those at 4.6, 4.5, 3.8 and 3.6 Å indicated the presence of a second polymorphic form. The oleogels with SO:SA ratios of 7:3, 6:4, 5:5 and 4:6 showed only the d-spacings at 4.6, 4.5, 3.8 and 3.6 Å. These spacings can thus be associated with a mixed crystal formed at these intermediate SO:SA ratios, as well as the 8:2 formulation.
In the 3:7 gel, new d-spacings at 4.1 and 3.7 Å appeared, while those associated with the mixed crystal persisted (with the exception of the spacing at 3.6 Å). Consistent with the trend in the SAXS region, the 2:8 gel displayed the same pattern (data not shown). The pattern of the 1:9 gel showed the d-spacings at 4.1 and 3.7 Å executively, and was therefore similar with that of the 0:10 gel. These two d-spacings have been correlated with the C-form of stearic acid by previous authors (Table 1). The 1:9 gel showed only the Bragg peaks of the stearic acid crystals, while the 3:7 and 2:8 formulations showed both Bragg peaks corresponding to the mixed crystals and to the stearic acid crystals.
The data of the present study showed that a mixed crystal was formed by SO:SA at intermediate ratios. This mixed crystal showed both a different lamellar length and polymorphic form, as compared to the pure stearyl alcohol or stearic acid crystals. Schaink et al. explained the increased hardness of the 7:3 formulation by the formation of such a mixed crystal. They suggested that the mixed crystal is more likely formed at a SO:SA ratio of 7:3 ratio than at 3:7. From the results presented here, the formation of a new mixed crystal was apparent; however, a correlation between the presence of this crystal formation and the increase in hardness did not exist (see Section 3.1); i.e. the X-rays spectra in the SAXS and the WAXS region for the oleogels with ratios 7:3, 6:4, 5:5 and 4:6 were the same, while the mechanical strength of these gels varied greatly (Fig. 1).
3.4. Differential scanning calorimetry (DSC)
In Fig. 5, the DSC melting profiles for oleogels of varying SO:SA ratios with (a) 5% and (b) 20% structurant are shown. All 5% gels exhibited one defined endotherm. However, some individual runs of these samples showed minor evidence of a secondary endotherm. Additionally, Gandolfo et al. reported multiple endotherms for solid mixtures of stearyl alcohol and stearic acid (in the absence of oil). Therefore, an additional set of oleogels with a concentration of 20% (wt/wt) structurant were analyzed under the same conditions. The 20% gels with a SO:SA ratio between 10:0 and 4:6 maintained a single dominant endotherm, while those with a ratio of 3:7, 2:8, and 1:9 exhibited two distinct endotherms; the latter indicating a splitting in the melting behavior. The melting temperature of the dominant endotherm in these formulations was higher than that of the other oleogels. Having a peak melting temperature close to 60 °C indicated that this endotherm was consistent with that observed in the pure stearic acid gel (Fig. 5b). We therefore propose the dominate endotherm can be attributed to the melting of pure stearic acid crystals, while the minor endotherm observed at lower temperatures could be attributed to the melting of the mixed crystal. Both crystal forms were observed in the X-ray diffraction patterns of the 3:7 and 2:8 gel (see preceding section). The 1:9 gel with 20% structurant also clearly exhibited two endotherms in the DSC melting profile, while in the X-ray diffraction pattern of the 5% gel, only the stearic acid crystal was visible. The amount of mixed crystals was therefore probably below the detection limit of the X-ray analysis. Furthermore, the X-ray diffraction patterns suggested the gel with a ratio of 8:2 also consisted of two different crystals, that of the mixed crystal and the pure stearyl alcohol crystal. However, as only a single endotherm was present in the gels containing 20% structurant, these two different types of crystals seemed to melt at similar temperatures and overlap each other.
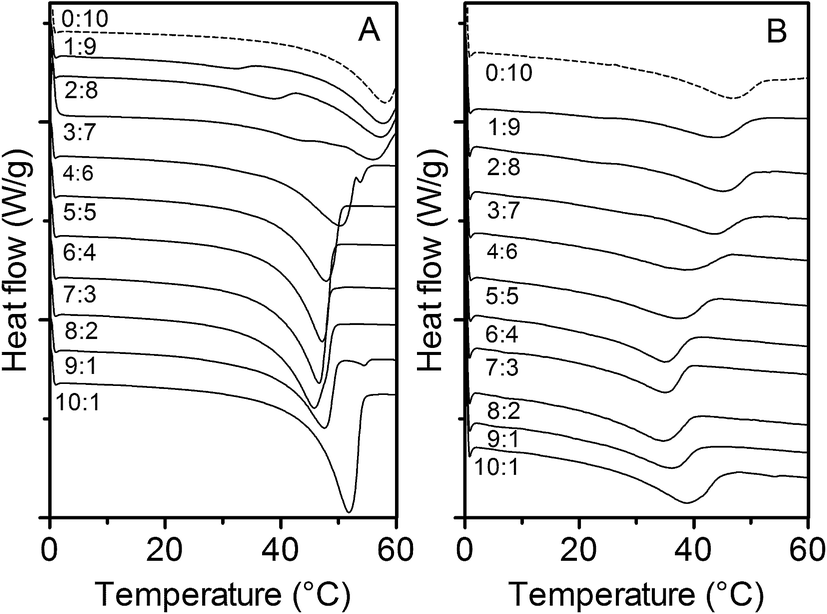 | ||
| Fig. 5 Representative DSC melting profiles of oleogels with varying stearyl alcohol:stearic acid (SO:SA) ratios in canola oil. (A) 20% total structurant; (B) 5% total structurant. Data of the second cooling run. | ||
Fig. 6a shows the peak melting temperatures of the 5% SO:SA oleogels. The pure stearyl alcohol gel (10:0) displayed a peak melting temperature of 37.8 ± 1.2 °C. As stearic acid was introduced, the peak melting temperature initially decreased, reaching a slight minimum of 34.7 ± 0.3 °C at a ratio of 8:2. The peak melting temperature stayed in about the same range until the ratio of 5:5. With a further increase in stearic acid content, the melting temperature more-or-less continuously increased, reaching a maximum (47.2 ± 0.7 °C) in the pure stearic acid gel (0:10). Observing the onset melting temperatures, the same trend was evident (Fig. 6b). The melting behavior of the gels with a higher stearic acid content, beginning at a ratio of 3:7, seemed to be dominated by the amount of stearic acid. This trend is in direct agreement with the appearance of pure stearic acid crystals in these formulations observed in the X-ray diffraction analysis.
 | ||
| Fig. 6 Thermal behavior of oleogels with 5% stearyl alcohol:stearic acid (SO:SA) in canola oil. Peak melting (A) and onset melting (B) temperatures; peak crystallization (C) and onset crystallization (D) temperatures. | ||
Fig. 6c shows a peak crystallization temperature of 30.1 ± 2.0 °C for the pure stearyl alcohol gel (10:0). Again the crystallization temperature initially decreased upon addition of stearic acid, reaching a clear minimum at a ratio of 5:5 and then increasing with increasing stearic acid content, reaching a maximum of 36.0 ± 0.2 °C for the pure stearic acid gel (0:10). The crystallization onset temperatures (Fig. 6d) showed the same trend as that of the peak crystallization temperature.
Takiguchi et al. observed a eutectic phase behavior for binary mixtures of fatty alcohols and fatty acids in general.36 They found a eutectic composition at a ratio of 5:5 for mixtures of behenyl alcohol and behenic acid (C22). Gandolfo et al. predicted a eutectic SO:SA ratio of 7:3 in sunflower oil.25 DSC melting profiles of neat SO:SA mixtures supported this theoretical prediction;37 however, the onset crystallization temperatures reported in their study exhibited a minimum at a ratio of 5:5. The authors explained the shift in the minimum of the crystallization temperature compared to the melting temperature was due to the ability of stearic acid molecules to form dimers, which increased the solubility of the acid in the alcohol. This shift is consistent with the shift in the data of the present study. If stearyl alcohol and stearic acid in oleogels would show eutectic behavior, the X-ray diffraction pattern of the gel which do not match the eutectic ratio should show evidence of both pure stearyl alcohol and pure stearic acid crystals, simultaneously (i.e. the hypo- and hyper-eutectic ratios). The X-ray patterns in this study (Section 3.3) showed that stearyl alcohol and stearic acid form a mixed crystal at the intermediate ratios, with no evidence of additional crystal forms over a range of formulations (7:3 to 4:6). In the 8:2 gel, the putative eutectic composition, stearyl alcohol and the mixed crystal were both evident, but none of the formulations showed a co-existence of pure stearyl alcohol and pure stearic acid. Considering the findings in both previous studies and the results reported in the present work, it seems that mixtures of stearyl alcohol and stearic acid exhibit a more complex phase behavior than that of a classic eutectic system. The observed differences within the peak melting temperatures of formulations in the range of 9:1 to 4:6 were not obvious enough to confidently confirm the existence of such eutectic behavior, in consideration of both the experimental error and the samples not being in an equilibrium state.
3.5. Solid fat content (SFC)
Fig. 7 shows the SFC-temperature profile of all 5% SO:SA oleogels formulations from 10 to 55 °C, measured by pulsed NMR. The gels with a ratio of 7:3, 6:4, and 5:5 exhibited the highest SFC at low temperatures (∼4.5% at 10 °C). Moreover, the melting profiles of these three formulations were similar (Fig. 7a). These observations can be correlated to the formation of the mixed crystal (see Section 3.3) in oleogels at these SO:SA ratios (Fig. 3). Gels structured with only stearyl alcohol (10:0) and those with a SO:SA ratio of 8:2 exhibited similar SFC, up to 25 °C. The 9:1 formulation exhibited the lowest SFC between 10 °C and 30 °C, among samples with ratios 10:1 to 5:5. The melting profiles of gels formulated with ratios of 10:0 to 4:6 exhibited a similar line-shape, with a sharp decrease in SFC from 30–40 °C. In contrast, the SFC profile of gels formulated with a higher stearic acid content (3:7 and above) changed more gradually upon heating. In the latter formulations, stearic acid seemed to dominate the melting behavior, which could also be recognized by the peak and onset melting temperatures determined by DSC (Fig. 6). The NMR data also showed that the 2:8 and 3:7 gels had a gradual, continuous melting profile, possibly due to the simultaneous presence of two crystal forms observed in the X-ray diffraction patterns of these formulations (the mixed crystal and the pure stearic acid crystal). Consistent with the DSC results shown in Fig. 6, oleogels with the highest stearic acid content (1:9 and 0:10) did not show an appreciable change in SFC until they were heated above 30 °C. Furthermore, their initial SFC was the lowest of all formulation evaluated (1:9:2.2%; 0:10:2.0%). Overall, the decrease in SFC with increasing stearic acid content at 10 °C indicated that these molecules had a greater solubility in the oil phase. It can be assumed that this also caused the lower SFC in the 9:1 gel as compared to the SFC in the 10:0 and 8:2 formulations, and the presence of only the stearyl alcohol crystal in the X-ray pattern. The stearic acid component in this particular formulation likely did not co-crystallize with the stearyl alcohol component. The 8:2 blend had the lowest SFC value at 35 °C, in agreement with DSC results, where this gel showed the lowest peak melting temperature (34.5 °C). It is also noteworthy that both the SFC and the melting profiles were almost identical for the 8:2 and 4:6 formulations; however, these two gels exhibited the highest and the lowest mechanical strength, respectively (Fig. 1). This suggests that the amount of solids is not the sole factor influencing the mechanical strength of SO:SA oleogels.
 | ||
| Fig. 7 Solid fat content (SFC) of oleogels in canola oil structured with 5% of varying stearyl alcohol:stearic acid (SO:SA) ratios, as a function of temperature; (A) gels with SO:SA ratios 10:0–5:5; (B) gels with SO:SA ratios 5:5–0:10; (C) comparison of gels with a SO:SA ratio of 8:2 and 4:6. | ||
3.6. Microstructure
The microstructure of the oleogels was studied using microscopy for samples crystallized directly on a microscope slide (thin film crystallization) and for samples crystallized in bulk and then transferred to a microscope slide (bulk crystallization). Comparing the bright field micrographs of the 10:0, 9:1, 8:2, 7:3 gels crystallized on a temperature-controlled stage, (Fig. 8a–d) no remarkable differences were recognizable. All gels appeared to contain needle-like structures with an average size of roughly 30–60 μm. It has been previously reported that pure stearyl alcohol gels form platelets, while the 7:3 formulation produces needle-like structures.26 The crystals present in the gel with a ratio of 4:6 departed from the needle-like morphology found in the four aforementioned formulations, and appeared to resemble elongated ellipsoids, while the crystals present in the 0:10 gel exhibited more hexagonal and spherical platelet-like shapes (Fig. 8). It is worth noting that the synergistic enhancement in gel strength at a ratio of 7:3 (and 8:2) was previously attributed to crystal morphology, quantity and size of crystals.25,26 These formulations were reported to have a greater number of smaller, needle-like crystals, in contrast to the large, platelet-like structures seen in the weaker formulations. Here we see insufficient evidence to support this conclusion, as the softer formulations (10:0, 9:1) exhibited a similar morphology to that at the formulations with the highest mechanical strength (8:2, 7:3).
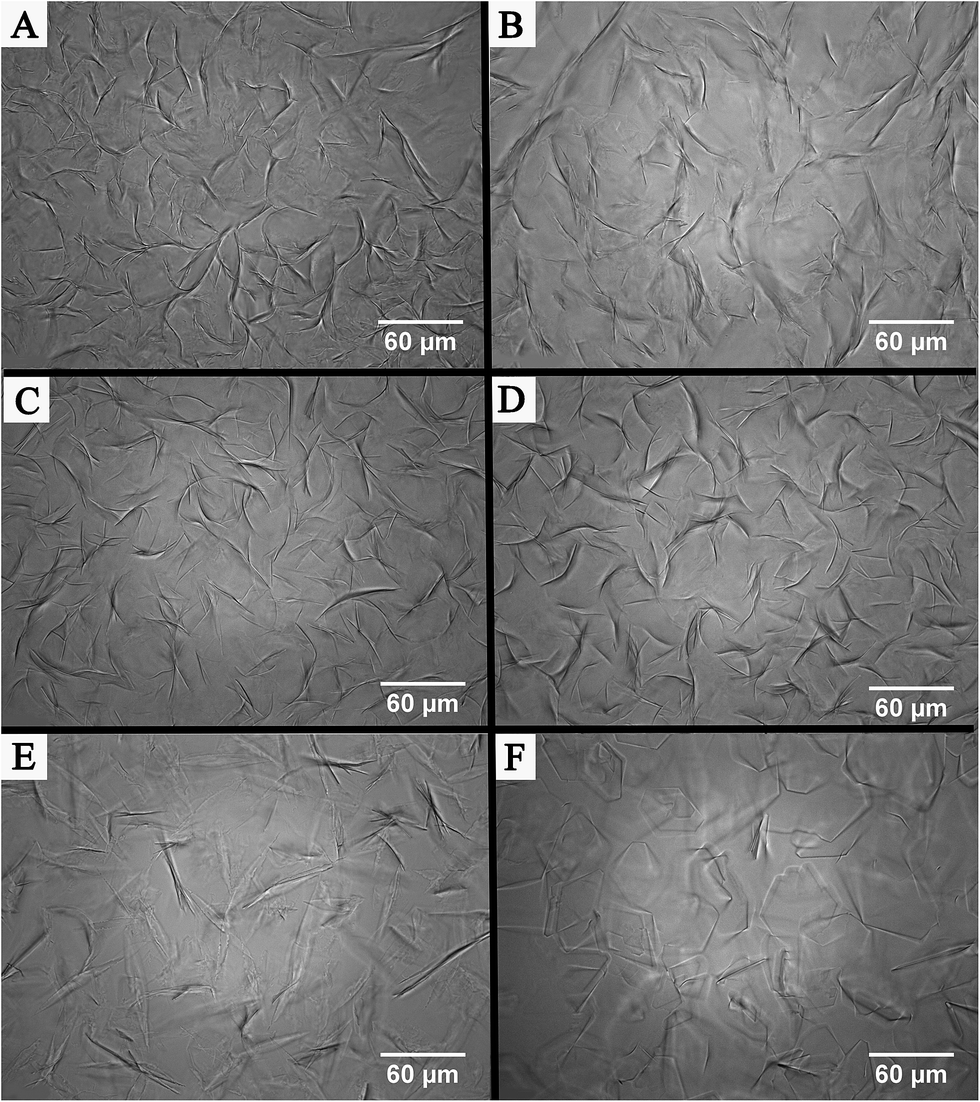 | ||
| Fig. 8 Bright field microscopy images of oleogels with 5% structurant and stearyl alcohol:stearic acid (SO:SA) ratios of 10:0 (A), 9:1 (B), 8:2 (C), 7:3 (D), 4:6 (E), 0:10 (F). Samples were crystallized at 5 °C min−1 in a temperature-controlled stage prior to imaging. | ||
To address the possibility that the crystallization conditions may influence the microstructure, a second set of micrographs were obtained by first crystallizing the gels in bulk, and transferring a portion of the gel to a microscope slide, without re-melting. When comparing images of the bulk samples, different crystal habits became apparent (Fig. 9). In both the pure stearyl alcohol gel (10:0) and the 9:1 formulation, the expected platelet-like crystals were present, and were oriented in such a way that the face of the platelets were parallel to the glass slide. Some evidence of these platelets was also apparent in the bulk crystallized 8:2 gel; however, mostly needle-shaped crystals were visible. The 7:3 gel also predominantly exhibited a needle-like morphology and the same was observed for the 4:6 gel; however, the latter contained smaller crystals. The appearance of a greater number of smaller crystals in this gel is in disagreement with the hypothesis that a network of smaller crystals produces a harder gel,25,26 as the 4:6 formulation was the softest tested. The pure stearic acid gel still exhibited platelets, although of a larger size as compared to those observed in the gel crystallized as a thin film (Fig. 8f vs. 9f). It is worth noting that the size distribution is not homogeneous throughout the sample; therefore, it would be difficult to accurately report a characteristic crystal size for the different formulations, and was thus not reported.
 | ||
| Fig. 9 Brightfield microscope images of gels at 5% structurant and stearyl alcohol:stearic acid (SO:SA) ratios of 10:0 (A), 9:1 (B), 8:2 (C), 7:3 (D), 4:6 (E), 0:10 (F). Samples were prepared by placing a small amount of previously prepared gel on a microscope slide. | ||
Using these two different preparation techniques highlights the fact that the observed crystal morphology and size strongly depends on the crystallization conditions; i.e., in bulk or as a thin film. Observing needles in samples crystallized on microscope slides does not mean that needles exist in the bulk samples. It is worth noting that plant wax oleogels such as those prepared with rice bran wax or sunflower wax have also been shown to have needle-like morphology, when prepared in a similar fashion to those in Fig. 8.23 However, it was recently shown by cryo-SEM that these structures are actually platelet-like structures, which most likely orient so that the platelet edge aligns with the glass slide or coverslip.38 Comparing Fig. 8a and b to 9a and b, this seems to be the case for the pure stearyl alcohol crystals (presuming stearic acid is fully solubilized in the latter). This can also be seen for the pure stearic acid gels in Fig. 8f and 9f, which were also previously reported as having needle-like morphology.32 The intermediate formulations are not as straight-forward to interpret solely from the bright-field microscope images.
3.7. Cryogenic scanning electron microscopy (cryo-SEM)
For further clarification of the microstructure of oleogels with different SO:SA ratios, as discussed in the previous section, cryo-SEM images were taken. Fig. 10 shows the pure stearyl alcohol gel (a), the 8:2 gel, which displayed the highest mechanical strength (b), the 4:6 gel with the lowest mechanical strength (c), and the pure stearic acid oleogel (d). It is obvious that all four SO:SA formulations showed platelet-like structures. There seems to be no conspicuous difference between the stearyl alcohol gel and the gel with the 8:2 composition (Fig. 10a and b). The 4:6 gel exhibited smaller, thinner and more disordered platelets. This decrease in size is consistent with the observation of smaller, needle like structures by light microscopy in the 4:6 gel crystalized in bulk (Fig. 9e). The SEM image of the stearic acid gel showed a more defined, oriented platelet-like structure relative to the other samples shown. The 8:2 gel, which showed needle-like structure using both preparation techniques by light microscopy, also appeared as platelets. These findings are consistent with the findings reported by Blake and Marangoni,38 who suggested the platelets orient such that their edges face the glass surface of microscope slides. We thus conclude that the appearance of needle-like crystals in oleogels with different SO:SA ratios is most likely an artifact of sample preparation, and that all formulations exhibit platelet-like morphology. Therefore, it is difficult to correlate the observed differences in gel strength and stability to the crystal morphology.
 | ||
| Fig. 10 Cryogenic scanning electron microscope (cryo-SEM) images of gels with 5% structurant at stearyl alcohol:stearic acid (SO:SA) ratios 10:0 (A), 8:2 (B), 4:6 (C), 0:10 (D). | ||
3.8. Scaling behavior and microstructure effects on mechanical strength
In previous work by our group,39 the relationship between the mechanical properties of wax crystal networks and their microstructure was successfully modelled using the cellular-solid approach of Gibson and Ashby.40 This model relates the Young's modulus of the wax cellular network to the volume fraction of crystalline solids in a power-law fashion, namely E = γΦn, where n can have values 1 < n < 4, while for a closed cell solid, n has been found in the range 1 < n < 2. This value depends on spatial distribution of network mass, or multicellular disorder, but is also highly dependent on the yielding mechanism.41 The pre-exponential factor, γ, was predicted to be inversely proportional to the size of the “cells” (or pores) in the network, and directly proportional to the strength (Young's modulus) of the cell walls, and the macroscopic size of the system.39 Thus, n is sensitive to how the network mass is distributed in space, i.e., the geometry of this network, while γ is related to the properties of the structuring material itself, and the size of the structural units. The hardness of the SO:SA gels scaled in a power-law fashion as a function of the mass fraction of crystalline solids, as shown in Fig. 11, except for gels prepared with pure stearyl alcohol (10:0), pure stearic acid (0:10), and the 1:9 SO:SA blend. From the linear regression of the log–log plots in Fig. 11, both a scaling exponent, n, and a pre-exponential factor, γ, could be derived from the slope and y-intercept at ln(x) = 0, respectively. Armed with these parameters, we proceeded to explore the effects of the total amount of crystalline solids (SFC), the scaling exponent, n, and the pre-exponential as a function of SOSA ratio (Fig. 12). Interestingly, none of these parameters fully described the experimentally obtained hardness variation as a function of SO:SA ratio (Fig. 1 and 13A). However, when these parameters are put together, it is obvious that the maximum hardness at the 8:2 SOSA ratio was clearly given by a combined increase in network mass (Fig. 13A), strongly influenced by the way this network mass was distributed in space (Fig. 13B). The ultimate hardness of the oleogel required input from γ (compare Fig. 13A and C), but the observed peak and valleys are mainly a consequence of changes in the spatial distribution of network mass. Interestingly, increases in the scaling exponent for cellular solids is generally associated with a transformation from a closed cell foam to an open cell foam.40,41 The observed increase in the scaling exponent observed at intermediate SO:SA concentrations could be associated with a transformation from a closed to an open cellular structure, which would partially explain the observed increase in oil loss observed in this range (Fig. 2). Similar behavior has also recently been reported in another mixed oleogelator system, where altering the ratio of monoglycerides and phytosterols produced a more uniform distribution of the crystalline material, and thus impacted both the rheological properties and hardness of the resulting gels.42
 | ||
| Fig. 11 log–log plot of hardness as a function of mass fraction of solids (SFC/100) of oleogels with a total concentration of 5%, 7%, 9% and 11% of structurant in canola oil. (A) Gels with a stearyl alcohol:stearic acid (SO:SA) ratio of 10:0, 9:1, 8:2, 7:3; (B) gels with a SO:SA ratio of 6:4, 5:5, 4:6, 3:7; (C) gels with a SO:SA ratio of 2:8; 1:9, 0:10. Straight lines show linear regression. | ||
 | ||
| Fig. 12 (A) Solid Fat Content (SFC) at 10 °C of oleogels as a function of stearyl alcohol:stearic acid (SO:SA) ratio; 5% total structurant in canola oil; (B) scaling exponent, n, derived from the slope of linear regression lines in Fig. 11 as a function of SO:SA ratio; (C) pre-exponential factor, γ, derived from the y-intercept of the linear regression lines in Fig. 11 (when ln(y) = 1) as a function of the SO:SA ratio. | ||
 | ||
| Fig. 13 (A) Measured hardness at 10 °C of oleogels as a function of stearyl alcohol:stearic acid (SO:SA) ratio; 5% total structurant in canola oil; (B) combined effect of mass fraction of crystalline solids scaled in a power-law fashion using the scaling exponent, n; (C) combined effects of mass fraction of crystalline solids, scaling exponent and pre-exponential factor γ on the predicted hardness of the oleogels as a function of the SO:SA ratio. | ||
4. Conclusion
A detailed analysis of oleogels with 5% stearyl alcohol and stearic acid was performed for 11 different SO:SA ratios (10:0, 9:1, 8:2, 7:3, 6:4, 5:5, 4:6, 3:7, 2:8, 1:9, 0:10). The gels with a ratio of 7:3 and 8:2 showed significantly higher mechanical strength compared to the other formulations, which has been previously reported.25,26 Stronger gels also displayed no oil loss during an accelerated stability test. The X-ray diffraction patterns of the gels showed that at a mixed crystal was formed at intermediate SO:SA ratios (8:2–2:8). However, these mixed crystal could not be correlated with the increased mechanical strength. Furthermore, none of the formulations exhibited a co-existence of the pure stearyl alcohol crystal and the pure stearic acid crystal in the X-ray diffraction analysis. For that reason we conclude that stearyl alcohol and stearic acid had a more complex phase behavior than that of an ideal eutectic system, although the peak (and onset) melting temperatures showed a slight minimum at a ratio of 8:2. Observing the same melting profiles analyzed by NMR for the hardest (8:2) and the softest (4:6) gel showed that the SFC alone is also not responsible for the differences in mechanical strength. It was also shown that the sample preparation technique strongly influences the characterization of microstructure of oleogels when imaged using light microscopy. However, cryo-SEM micrographs clarified that both the gels made out of the pure components and the gels with the highest (8:2) and the lowest (4:6) mechanical strength were crystallized in platelet-like structures. The increase in mechanical strength could therefore neither be correlated to needle shaped-crystal morphology, nor to a higher amount of smaller crystals, as previously reported. The mechanical behavior was successfully modelled using a mesoscale structural mechanical model developed for cellular solids structured by platelets developed by our group. We could predict that the differences in hardness were mostly attributed to slight increases in the amount of crystalline mass, but strongly influenced by the spatial distribution of such mass.
Acknowledgements
The authors would like to thank Reed Nicholson for his assistance in the preparation and analysis of the oleogels. This project was supported by the Natural Sciences and Engineering Research Council, Canada (NSERC) and the German Academic Exchange Service (DAAD).References
- A. G. Marangoni, N. Acevedo, F. Maleky, E. Co, F. Peyronel, G. Mazzanti, B. Quinn and D. Pink, Soft Matter, 2012, 8, 1275 RSC.
- A. G. Marangoni and L. Wesdorp, Structure and Properties of Fat Crystal Networks, CRC Press, Boca Raton, FL, USA, 2013 Search PubMed.
- A. Marangoni, Structure-function analysis of edible fats, AOCS Press, Urbana, IL, USA, 2012 Search PubMed.
- FDA, Fed. Regist., 2015, 80(116), 34650–34670 Search PubMed.
- A. Aro, M. Jauhiainen, R. Partanen, I. Salminen and M. Mutanen, Am. J. Clin. Nutr., 1997, 65, 1419–1426 CAS.
- A. Ascherio, E. B. Rimm, E. L. Giovannucci, D. Spiegelman, M. Stampfer and W. C. Willett, Br. Med. J., 1996, 313(7049), 84–90 CrossRef CAS PubMed.
- C. B. Dias, R. Garg, L. G. Wood and M. L. Garg, Med. Hypotheses, 2014, 82, 187–195 CrossRef CAS PubMed.
- M. Pernetti, K. F. van Malssen, E. Flöter and A. Bot, Curr. Opin. Colloid Interface Sci., 2007, 12, 221–231 CrossRef CAS.
- A. R. Patel, Alternative Routes to Oil Structuring, Springer, New York, NY, USA, 2015 Search PubMed.
- E. D. Co and A. G. Marangoni, J. Am. Oil Chem. Soc., 2012, 89, 749–780 CrossRef.
- L. Samuditha, K. Dassanayake, D. R. Kodali and S. Ueno, Curr. Opin. Colloid Interface Sci., 2011, 16, 432–439 CrossRef.
- M. A. Rogers, A. J. Wright and A. G. Marangoni, Soft Matter, 2008, 4, 1483 RSC.
- F. C. Wang, A. J. Gravelle, A. I. Blake and A. G. Marangoni, Current Opinion in Food Science, 2016, 7, 27–34 CrossRef.
- T. Jones, Clay Miner., 1983, 18, 399–410 CAS.
- D. J. McClements, Annu. Rev. Food Sci. Technol., 2010, 1, 241–269 CrossRef CAS PubMed.
- M. Davidovich-Pinhas, S. Barbut and A. G. Marangoni, Carbohydr. Polym., 2015, 117, 869–878 CrossRef CAS PubMed.
- A. J. Gravelle, S. Barbut and A. G. Marangoni, Food Res. Int., 2012, 48, 578–583 CrossRef CAS.
- A. Bot and E. Flöter, in Edible oleogels: structure and health implications, ed. A. G. Marangoni and N. Garti, AOCS Press, Urbana, Il, USA, 2011, pp. 49–79 Search PubMed.
- A. J. Wright and A. G. Marangoni, J. Am. Oil Chem. Soc., 2006, 84, 3–9 CrossRef.
- H.-S. Hwang, S. Kim, M. Singh, J. K. Winkler-Moser and S. X. Liu, J. Am. Oil Chem. Soc., 2011, 89, 639–647 CrossRef.
- O. G. Rocha-Amador, J. A. Gallegos-Infante, Q. Huang, N. E. Rocha-Guzman, M. R. Moreno-Jimenez and R. F. Gonzalez-Laredo, Int. J. Food Sci., 2014, 2014, 1–8 CrossRef PubMed.
- J. Daniel and R. Rajasekharan, J. Am. Oil Chem. Soc., 2003, 80, 417–421 CrossRef CAS.
- A. I. Blake, E. D. Co and A. G. Marangoni, J. Am. Oil Chem. Soc., 2014, 91, 885–903 CrossRef CAS.
- J. F. Toro-Vazquez, J. A. Morales-Rueda, E. Dibildox-Alvarado, M. Charó-Alonso, M. Alonzo-Macias and M. M. González-Chávez, J. Am. Oil Chem. Soc., 2007, 84, 989–1000 CrossRef CAS.
- F. G. Gandolfo, A. Bot and E. Flöter, J. Am. Oil Chem. Soc., 2004, 81, 1–6 CrossRef CAS.
- H. M. Schaink, K. F. van Malssen, S. Morgado-Alves, D. Kalnin and E. van der Linden, Food Res. Int., 2007, 40, 1185–1193 CrossRef CAS.
- A. J. Gravelle, S. Barbut, M. Quinton and A. G. Marangoni, J. Food Eng., 2014, 143, 114–122 CrossRef CAS.
- E. Dibildox-Alvarado, J. N. Rodrigues, L. A. Gioielli, J. F. Toro-Vazquez and A. G. Marangoni, Cryst. Growth Des., 2004, 4, 731–736 CAS.
- D. G. Kolb and E. S. Lutton, J. Am. Chem. Soc., 1951, 73, 5593–5595 CrossRef.
- D. A. Wilson and E. Ott, J. Chem. Phys., 1934, 2, 231 CrossRef CAS.
- A. C. T. Teixeira, A. R. Garcia, L. M. Ilharco, A. M. P. S. Gonc and A. C. Fernandes, Chem. Phys. Lipids, 2010, 163, 655–666 CrossRef CAS PubMed.
- S. S. Sagiri, V. K. Singh, K. Pal, I. Banerjee and P. Basak, Mater. Sci. Eng., C, 2015, 48, 688–699 CrossRef CAS PubMed.
- S. H. J. Idziak, in Structure-Function Analysis of Edible Fats, ed. A. G. Marangoni, AOCS Press, Urbana, IL, USA, 2012, pp. 79–106 Search PubMed.
- T. Yamamoto, K. Nozaki and T. Hara, J. Chem. Phys., 1990, 92, 631–641 CrossRef CAS.
- N. Garti and K. Sato, Crystallization and Polymorphism of Fats and Fatty Acids, Surfactant Sci. Ser., Marcel Dekker, New York, 1988, vol. 31 Search PubMed.
- H. Takiguchi, K. Iida, S. Ueno, J. Yano and K. Sato, J. Cryst. Growth, 1998, 193, 641–647 CrossRef CAS.
- F. G. Gandolfo, A. Bot and E. Flöter, Thermochim. Acta, 2003, 404, 9–17 CrossRef CAS.
- A. I. Blake and A. G. Marangoni, Food Struct., 2015, 3, 30–34 CrossRef.
- Y. Miyazaki and A. G. Marangoni, Mater. Res. Express, 2014, 1, 025101 CrossRef.
- L. J. Gibson, Mater. Sci. Eng., A, 1989, 110, 1–36 CrossRef.
- A. P. Roberts and E. J. Garboczi, Acta Mater., 2001, 49, 189–197 CrossRef CAS.
- M. D. B. Sintang, T. Rimaux, D. Van de Walle, K. Dewettinck and A. R. Patel, Eur. J. Lipid Sci. Technol., 2016 DOI:10.1002/ejlt.201500517.
| This journal is © The Royal Society of Chemistry 2016 |