
Cooperative assembly synthesis of mesoporous SrTiO3 with enhanced photocatalytic properties†
Buğra E. Kayaalpa,
Young Joo Leea,
Andreas Kornowskib,
Silvia Grosscd,
Massimiliano D'Arienzoe and
Simone Mascotto*a
aInstitut für Anorganische und Angewandte Chemie, Universität Hamburg, Martin-Luther-King Platz 6, D-20146 Hamburg, Germany. E-mail: simone.mascotto@chemie.uni-hamburg.de
bInstitut für Physikalische Chemie, Universität Hamburg, Grindelallee 117, D-20146 Hamburg, Germany
cDipartimento di Scienze Chimiche, Università Degli Studi di Padova, via Marzolo, 1, I-35131, Padova, Italy
dIstituto per l'Energetica e le Interfasi, IENI-CNR and INSTM, UdR Padova, via Marzolo, 1, I-35131, Padova, Italy
eDipartimento di Scienza Dei Materiali, INSTM, Università di Milano-Bicocca, via R. Cozzi, 55, I-20125, Milano, Italy
First published on 14th September 2016
Abstract
The synthesis of mesoporous SrTiO3 by using the cooperative assembly of metal chelate complexes and alkoxysilanes is here presented. The high affinity and intimate mixing between the two precursors fostered the formation, via polycondensation, of interpentrating organic and inorganic polymers. Hence, after calcination and removal of the siliceous phase, aggregates of mesoporous, polycrystalline SrTiO3 with interconnected pores of ca. 10 nm and surface areas as high as 240 m2 g−1 were obtained. Systems using different SrTiO3![[thin space (1/6-em)]](https://www.rsc.org/images/entities/char_2009.gif) :SiO2 molar ratios were prepared to vary the porosity and microstructure. The templating action of the silica and its effect on the physicochemical properties of the final porous materials were addressed by a multi-technique approach. Finally, the activity of the bulk mesoporous SrTiO3 systems was exemplarily demonstrated by photodegradation tests of methylene blue under UV light. The dye conversion progressively increased with the content of silica template, proving the higher activity of the proposed mesoporous materials.
:SiO2 molar ratios were prepared to vary the porosity and microstructure. The templating action of the silica and its effect on the physicochemical properties of the final porous materials were addressed by a multi-technique approach. Finally, the activity of the bulk mesoporous SrTiO3 systems was exemplarily demonstrated by photodegradation tests of methylene blue under UV light. The dye conversion progressively increased with the content of silica template, proving the higher activity of the proposed mesoporous materials.
Introduction
Strontium titanate (SrTiO3) can be considered as a model perovskite system, thanks to the ease in accommodating non-stoichiometry and to its polarizability. The ferroelectric properties,1 relatively high band gap (3.25 eV, λ = 361 nm)2 and mixed ionic-electronic conductivity3,4 make this material very interesting for a wide range of applications, such as thermoelectrics,5,6 memristive devices,7 capacitors,8 photocatalysis9 and anode materials in solid oxide fuel cells.10In order to profit from this wide application potential, the improvement of the textural properties is crucial. With respect to this, a central issue is the achievement of a high specific surface area and pore volume.
Recently, diverse works showed the preparation of mesoporous SrTiO3 nanoparticles for photocatalytic applications.11–16 Ouyang & Ye12 presented the synthesis of mesoporous SrTiO3 nanoparticles by hydrothermal method using silica spheres (10–20 nm) as nanotemplate. The materials showed interesting activity in photodegradation of 2-propanol to acetone. A molten salts route was employed by Liu et al.13 for the synthesis of porous SrTiO3 nanocrystals with improved photocatalytic hydrogen evolution. Hydroxide salt melts acted both as solvent and template generating porous crystalline nanostructures by aggregative growth mechanism.
The synthesis protocols for mesoporous SrTiO3 nanoparticles are usually based on low temperature (T < 250 °C) solvothermal processes. Hence, potential structural and morphological modifications of the porous texture limit their employment to room temperature applications, e.g. photocatalysis. The preparation of mesoporous bulk SrTiO3 would be therefore desirable to widen the application range, exploiting the larger particle size and higher thermal stability. However, with respect to the nanoparticulate systems, the synthesis of bulk materials is much more challenging and therefore less represented in the literature.
Among the diverse wet synthesis approaches (e.g. sol–gel, co-precipitation), perovskite oxide materials can be prepared using molar excess of chelating agent such as citric acid, ethylene glycol or oxalate to ensure homogeneous mixing of the cations at the molecular scale and avoid secondary phase formation.17–19
In this respect, synthesis strategies commonly used for porous oxide structures such as evaporation induced self-assembly (EISA)20 may not be the best choice to prepare SrTiO3 with large surface area. Firstly, metal chelate complexes are poor nanobuilding blocks for self-assembly.21 Secondly, soft templates used in EISA process usually decompose at temperatures below the crystallization of perovskite, causing collapse of the mesostructure. Hence, only few works report the preparation of nanoporous bulk SrTiO3 systems via soft templating.22,23
In the past years, the co-assembly, i.e. cooperative assembly, process of alkoxysilane and resol was successfully adopted to prepare carbon/silica nanocomposites.24,25 The main point of this approach is the intimate molecular intermixing of the inorganic and organic precursors given by their high concentration of hydroxyl groups. These functionalities promote sol–gel reactions to form highly homogeneous interpenetrating networks. After removal of one of the polymers, either highly porous carbon or silica can be obtained.
Herein, we show how the co-assembly principle can be used as an easy and reproducible approach towards the synthesis of bulk mesoporous polycrystalline SrTiO3 with large porosity. Chelating agents such as citric acid and glycerol represent here the carbon precursors and are further used to complex the metal ions. Pre-hydrolyzed alkoxysilane is added as silica source and porogen. Subsequently, the reaction temperature is increased to promote polycondensation, i.e. co-assembly, of the carboxy and silanol groups until gelation occurs. After removal of the carbonaceous component by high temperature treatment, interpenetrating SrTiO3/SiO2 nanocomposites are obtained. The presence of the hard siliceous endotemplate allows the formation and the stabilization of the crystalline SrTiO3 network at high temperatures preventing the mesostructured from shrinking. Hence, further etching of silica network by NaOH leads to highly porous perovskite with well interconnected pores and pore volume and surfaces area as high as 0.39 cm3 g−1 and 240 m2 g−1, respectively. The composition ratio SiO2/SrTiO3 was tuned between 0.1 and 1 to modulate the textural properties such as porosity and crystallinity of the final system. The physicochemical properties of the materials were investigated by a multi-technique approach in order to determine the structure–function relationships. The activity of the proposed porous bulk SrTiO3 was studied in regard to photochemical dye degradation under UV-light and compared with the conventional nanoparticulate systems.
Experimental
Chemicals and materials
Strontium nitrate (99%, Acros Organics), titanium(IV) isopropoxide (98%, ABCR), TEOS (98%, Alfa Aesar), citric acid (99%, ABCR), glycerol (99%, Alfa Aesar), sodium hydroxide (98.5%, Acros Organics), hydrochloric acid (37%, VWR), ethanol (99.8%, VWR) and glacial acetic acid (HOAc 99%, VWR) were used as received without further purifications. Nanoparticulate SrTiO3 (np_SrTiO3) was purchased from chemPUR.Synthesis of the pre-hydrolyzed TEOS solution
61 ml of TEOS were mixed with 61 ml of ethanol. Subsequently 6.9 ml of HCl (0.02 M) were added dropwise. The mixture was stirred for 90 min at 60 °C and then stored at 4 °C.26Synthesis of the mesoporous SrTiO3
Mesoporous SrTiO3 was prepared via the chelate complex method using the co-assembly approach. In a typical synthesis 5.43 mmol of titanium(IV) isopropoxide were added to 11.9 ml of glycerol by stirring at room temperature for 30 min. Glycerol was preferred over the standardly used ethylene glycol owing to its better chelating and crosslinking properties. Subsequently, 40.7 mmol of citric acid were added and the temperature was raised up to 60 °C. 5.43 mmol of Sr(NO3)2 were added to the mixture at this temperature and, after complete dissolution, the silica source was finally introduced in stoichiometric ratios SiO2/SrTiO3 from 0.1 to 1. After equilibration for 2 hours, the temperature was raised up to 130 °C under vigorous stirring to promote the polycondensation reactions between the chelating agents. The resulting polymer gel was calcined at 600 °C for 2 h in air to eliminate the organic component. The temperature was increased at a rate of 2 °C min−1 and held at 350 °C for 2 h before reaching the final temperature. The SiO2/SrTiO3 nanocomposites (Scheme 1) were treated with 2 M NaOH solution at 90 °C to remove the silica phase. After neutralization to pH = 7 with water, the materials were washed with 1.75 mM glacial acetic acid at room temperature to eliminate SrCO3 impurities.27 Both treatments were carried out one time using 50 ml of solution for each 350 mg of material, under stirring in a closed vessel for 24 h. The prepared materials were named after the SrTiO3:SiO2 molar ratios. The sample labeled as “no template” represents SrTiO3 obtained without SiO2 template.
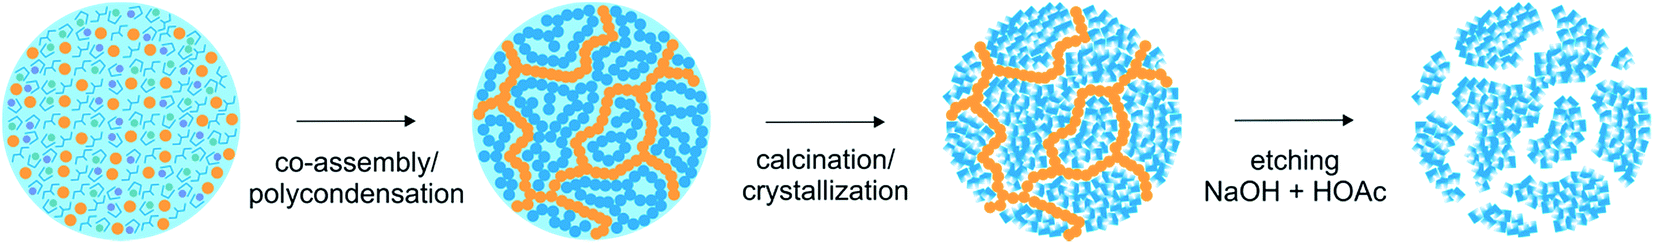 | ||
| Scheme 1 Formation mechanism of the nanoporous SrTiO3. The yellow and blue symbols represent the silica and the complex-polymer/SrTiO3 respectively. At the beginning all the molecular precursors are homogeneously distributed in the reaction environment. Once the polycondensation takes place silica and polyester networks grow intimately. The NaOH and HOAc treatment of the SiO2/SrTiO3 nanocomposites obtained after calcination leads to nanoporous SrTiO3 with interconnected pores. | ||
X-ray diffraction
X-ray diffraction analysis was carried out with an X'Pert Pro diffractometer (PANalytical Corp.) with 1.5406 Å Ni-filtered Cu-Kα radiation, operating at 45 kV and 40 mA, step size 0.0130°, step time 74 s per step. The mean crystallite sizes were calculated from the full width at half maximum (FWHM) of the most intense reflection using the Scherrer equation.Nitrogen physisorption
The nitrogen sorption isotherms were obtained at 77 K using a Quadrasorb SI-MP by Quantachrome. Outgassing was performed with a Masterprep Degasser (Quantachrome Corp.) at 120 °C for 10 h. Specific surface areas were determined with the Brunauer–Emmett–Teller (BET) method28 at p/p0 = 0.07–0.3. Pore size distribution was determined with the NLDFT method29 applying the model for cylindrical pores on the adsorption branch by using the Quantachrome ASiQWin software.29Si NMR spectroscopy
29Si cross polarization magic angle spinning nuclear magnetic resonance (CPMAS NMR) experiments were performed at an operating frequency of 79.52 MHz on a Bruker AvanceII 400 spectrometer equipped with a 4 mm double resonance probe. 1H 90°pulse length of 4.4 µs, contact time of 2 ms, and recycle delay of 5 s were used. All the measurements were performed at room temperature and with the MAS frequency of 5 kHz. Continuous wave decoupling was used during the acquisition. 16000 transients were acquired for all the samples and the spectra were plotted in a calibrated intensity scale, taking into account the analyzed sample mass.
Infrared spectroscopy
Infrared (IR) spectra were obtained on KBr pellets in the region 400–4000 cm−1 in transmission mode with a Bruker Vertex 70 FTIR spectrophotometer.Thermogravimetric analysis
Thermal characterization was carried out using a NETZSCH STA 449F3 coupled with Äeolos QMS403C (TG – MS) with 10 °C min−1 heating rate in an Ar/O2 stream (volume ratio 78/22).Electron microscopy
Scanning electron microscopy (SEM) images were obtained on a LEO1550 with a spatial resolution of ≈1 nm. The powder was fixed on a standard carbon conductive tab and was investigated without further conductive coating.Transmission electron microscopy (TEM) measurements were carried out on a JEOL JEM 2200 FS at 200 kV equipped with two CEOS Cs correctors (CETCOR, CESCOR), a Gatan 4K UltraScan 1000 camera and a HAADF (high angle annular dark field) detector. The sample was crushed into a fine powder, which was suspended in toluene by sonication and dropped on a carbon coated 400 mesh TEM grid. The excess of solvent was removed with a filter paper and by drying the grid under air.
X-rays photoelectron spectroscopy (XPS)
XPS spectra were acquired by using a Perkin-Elmer Φ 5600ci spectrometer using standard Al radiation (1486.6 eV) working at 250 W. The working pressure in the analysis chamber was <5 10−8 Pa. The spectrometer was calibrated by assuming the binding energy (BE) of the Au 4f7/2 line at 83.9 eV with respect to the Fermi level. The standard deviation for the BE values was 0.15 eV. The reported BE were corrected for the charging effects, assigning to the C 1s line of adventitious carbon the BE value of 284.6 eV.30,31Survey scans (187.85 pass energy, 1 eV per step, 25 ms per step) were obtained in the 0–1350 eV range. Detailed scans (29.35 eV pass energy, 0.1 eV per step, 100–150 ms per step) were recorded for the C 1s, O 1s, Ti 2p, Sr 3d, Si 2p, TiLMM regions. The atomic composition of the powders, after a Shirley type background subtraction32 was evaluated using sensitivity factors supplied by Perkin-Elmer.31 The assignments of the peaks was carried out by using the values reported in the reference handbook.31
Photocatalytic dye degradation
Dye degradation tests were performed with a 125 W high pressure mercury vapor UV lamp (Philips HPK-125W, maximum radiation at λ = 365 nm, full spectrum Fig. S1†) encased in constant coolant water circulation apparatus. Accordingly to ref. 11 and 33 50 ml of water-based methylene blue solution (50 mg l−1) was treated with 50 mg SrTiO3 photocatalyst powder in a 100 ml glass beaker placed 10 cm directly under the light source (irradiance at surface ca. 30 Wm−2 nm−1, see ESI†). Saturation of dye adsorption was reached after 1 h of dark stirring (Fig. S2a†). Methylene blue samples were investigated via UV-Vis spectroscopy after 0 min, 20 min, 60 min and 120 min of irradiation. Additional experiments were performed without catalyst to exclude spontaneous dye degradation under UV light (Fig. S2b†). Each sample (1 ml) was diluted with H2O to 10 ml and centrifuged at 10000 rpm for 30 min to eliminate possibly suspended SrTiO3 particles. The UV/Vis spectra of the methylene blue solutions and of the porous SrTiO3 samples were recorded with a Cary 5000 UV/Vis-NIR spectrophotometer of Varian. The powder measurements were performed using a Praying Mantis Diffuse Reflection Accessory by Harrick, dispersing 50 mg of material in 150 mg of BaSO4 standard. Obtained reflectance spectra were converted to the Kubelka Munk function F(R) with Cary WinUV software.
Results and discussion
Thermogravimetric analysis was at first performed to verify the thermal stability of the nanocomposite systems. Thermograms (Fig. 1) show mass loss for all the samples up to ca. 550 °C. Based on these results, 600 °C was chosen as final temperature for the calcination of the materials. The microstructure was investigated using powder X-ray diffraction. The nanocomposites, especially those with high silica amount, present mixed phases ascribed to SrTiO3, SrCO3 and SiO2-based compounds (Fig. 2a–c). Conversely, after etching, pure SrTiO3 phase was detected. The average crystallite size (Φ, Table 1) decreases upon increasing SiO2 content as a result of the diffusion barrier on the mass transport. | ||
| Fig. 1 Thermograms of the polymer-gels with different SrTiO3:SiO2 molar ratios. | ||
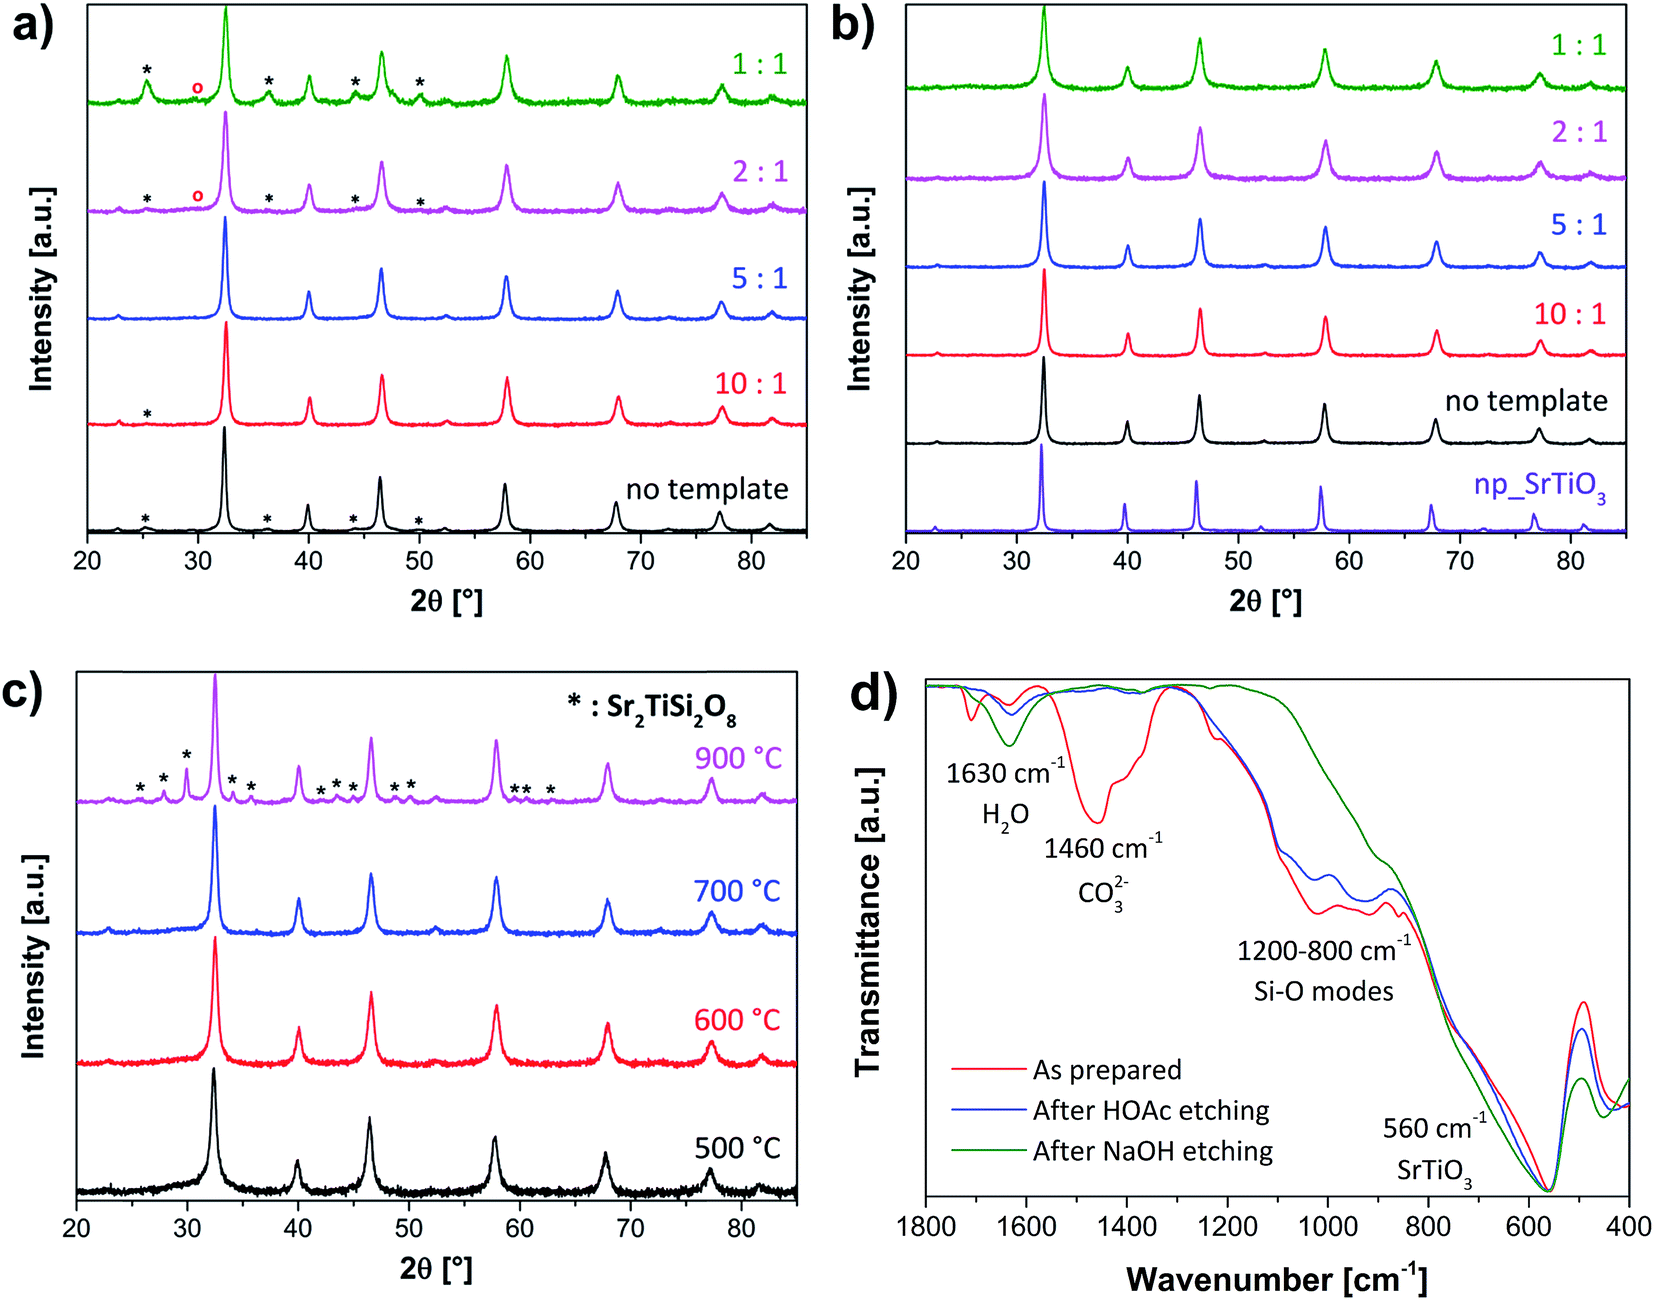 | ||
| Fig. 2 (a–c) X-ray diffractograms of different SrTiO3 samples: (a) as-prepared systems with different SrTiO3:SiO2 molar ratios calcined at 600 °C. The asterisks identify SrCO3 impurities whereas the siliceous phase is marked with the red circles; (b) final mesoporous materials obtained with different SrTiO3:SiO2 molar ratios calcined at 600 °C along with commercially available nanoparticulate SrTiO3 (np_SrTiO3); (c) as-prepared sample 2:1 (molar ratio SrTiO3:SiO2) at different calcination temperatures. The asterisks indicate Sr2TiSi2O8 phase. (d) Infrared spectra of the 2:1 sample at different synthesis steps, taken as representative example for all the materials. | ||
| Sample | SBET [m2 g−1] | VP [cm3 g−1] | Φ [nm] | EBG [eV] | kapp [min−1] | Knorm [gm−2 min−1] | C [% at] | O [% at] | Ti [% at] | Sr [% at] | Si [% at] | Sie [% at] |
|---|---|---|---|---|---|---|---|---|---|---|---|---|
| No template | 60 | 0.22 | 31 | 3.20 | 2.1 × 10⁻³ | 3.5 × 10⁻⁵ | 15.5 | 55.3 | 14.9 | 14.2 | — | — |
| 10:1 |
79 | 0.23 | 26 | 3.24 | 3.0 × 10⁻³ | 3.8 × 10⁻⁵ | 9.8 | 58.4 | 15 | 13.8 | 3.2 | 1.1 |
| 5:1 |
114 | 0.29 | 23 | 3.24 | 4.4 × 10⁻³ | 3.9 × 10⁻⁵ | 15.2 | 54.8 | 13.8 | 12.1 | 4.1 | 2.2 |
| 2:1 |
216 | 0.36 | 17 | 3.27 | 7.2 × 10⁻³ | 3.3 × 10⁻⁵ | 8.2 | 61.8 | 13.6 | 9.5 | 6.7 | 1.7 |
| 1:1 |
239 | 0.39 | 15 | 3.27 | 1.1 × 10⁻² | 4.6 × 10⁻⁵ | 12.3 | 59.3 | 9.9 | 7.2 | 11.2 | 3 |
| np_SrTiO3 | 38 | — | 48 | 3.31 | 2.0 × 10⁻⁴ | 5.3 × 10⁻⁶ | — | — | — | — | — | — |
In order to deeply investigate the complete etching of silica and carbonates, and have a clear picture of the materials composition, spectroscopic methods (IR, 29Si NMR, XPS) were employed. Infrared spectroscopy could clearly determine the effective removal of carbonates (ν = 1460 cm−1) after the acetic acid etching procedure (Fig. 2d). The same trend can be observed for silica after NaOH etching. However, in this case no precise conclusions can be drawn from the IR spectra due to the broad and blunt signal at ca. ν = 1000 cm−1.
Better understanding of the silica structure and its removal could be obtained by 29Si MAS NMR spectroscopy. In Fig. 3 the silicon spectra of the different materials before and after etching are depicted. Interestingly, depending on the concentration of the pre-hydrolized TEOS solution different siliceous species could be formed. For low amounts (10:1 and 5:1 samples) the presence of Q0, Q1 and Q2 sites suggests the formation of monomeric, dimer and oligomeric units. At higher contents (2:1 and 1:1 samples) the condensation reaction is promoted, and Q3 and Q4 signals, ascribed to a pure SiO2 structure, further appear. After treatment with NaOH, the silica was completely removed and only a small fraction of Q0 and Q1 sites was left. These siliceous rests can be associated with silicate phases.34 This finding is corroborated also by XRD measurements of the materials calcined at higher temperature (700–900 °C, Fig. 2c).
 | ||
| Fig. 3 29Si CP-MAS NMR spectra of the SrTiO3 samples before (a) and after NaOH etching (b). Q0 site at ca. −78 ppm; Q1 at −85 ppm; Q2 at ca. −90 ppm; Q3 at −100 ppm and Q4 at −110 ppm. | ||
The atomic ratios in the materials could be determined by XPS, providing also information on chemical environment and oxidation state of the species of interest. First, a survey spectrum was acquired for all samples. In Fig. 4, the spectrum of sample 1:1 before and after etching is plotted, to representative show that all element of interest (Si, Sr, Ti, O, C) can be identified. The retrieved binding energies are in agreement with the expected oxidation states, i.e. Si(IV), Sr(II) and Ti(IV). Afterwards, selected regions were acquired with higher resolution for the quantitative determination of the atomic percentages. In this way, it could be shown that the stoichiometric ratios SrTiO3:SiO2 of the as prepared materials correspond well to the nominal values (Table 1). However, slight deviations can be found especially for the Ti/Sr ratio, which is higher in the 1:1 and 2:1 materials than in the others. This result can be ascribed to a surface effect determined by silica enrichment, which affects the distribution of the metal species.35
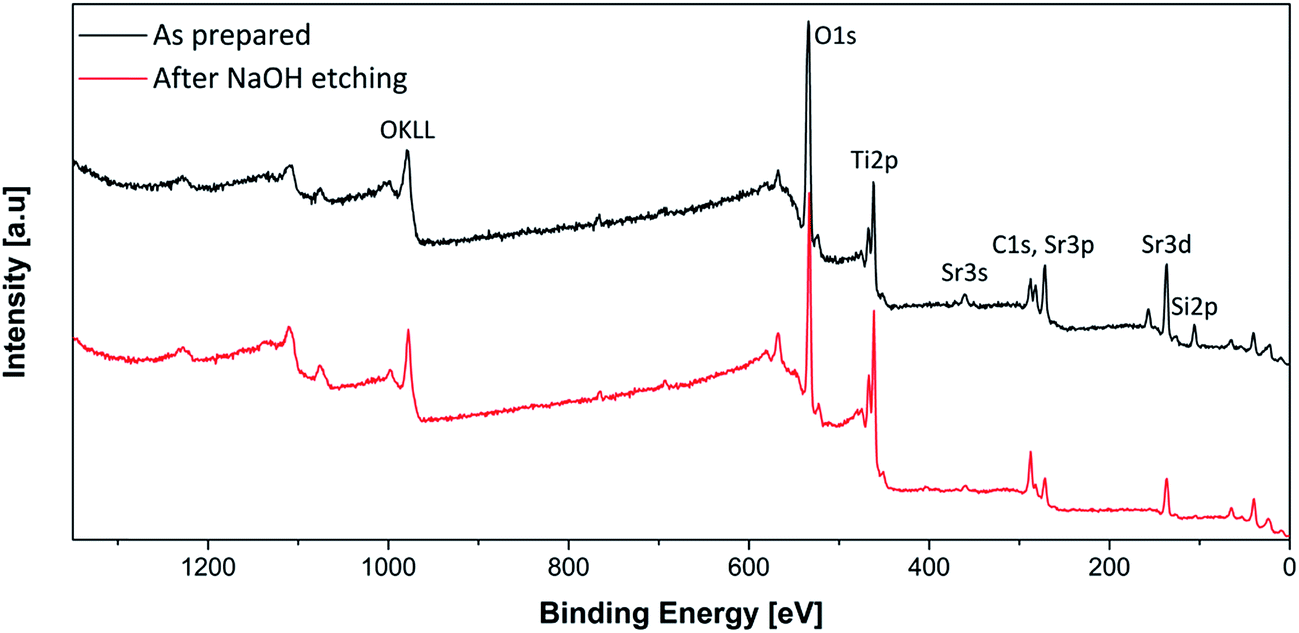 | ||
| Fig. 4 Survey spectrum of the sample 1:1 before and after NaOH etching. | ||
The relatively high carbon amount originates from both carbonates and surface contaminations contributions. Moreover, the efficacy of the etching procedure is proven by the very little residual atomic amount of silicon (Sie), in very good agreement with the NMR results.
Nitrogen physisorption was used to assess the porosity of the materials. In Fig. 5, the physisorption analyses of the nanoporous SrTiO3 obtained by different amounts of silica template are displayed. All curves are characterized by type IV(a) isotherms36 with broad hysteresis. The steep increase close to the saturation pressure can be assigned to interparticle porosity. As expected, specific surface area and pore volume constantly increase upon silica loading (Table 1). The effect of the hard template on the textural properties is more evident for the size of the pores (Fig. 5b). Very broad distributions are formed for low silica content and “no template” SrTiO3. Here, the siliceous phase poorly participates to the pore generation, most probably because the oligomeric structure and the low concentration are not sufficient to build a three-dimensional network. For quantities larger than 20% more condensed silica species are built (Fig. 3a), which interpenetrate the SrTiO3 matrix and form additional porosity. This templating action is clearly visible by the progressive narrowing of the pore size distribution towards 6 nm.
 | ||
| Fig. 5 N2 physisorption isotherms (a) and pore size distribution (b) of the different mesoporous SrTiO3 materials. Each isotherm is shifted upward by 50 cm3 g−1 for clarity except for the data referring to pure SrTiO3. | ||
Only slight differences can be distinguished between the 2:1 and 1:1 samples. In the light of NMR results (Fig. 3a), one would expect much larger porosity and pore size for the 1:1 system. The larger amount of Q3 and Q4 sites observed by 29Si MAS NMR apparently does not actively participate to the templating and eventually belong to SiO2 domains which phase-separate.
Additional information on material and pore morphology could be obtained by electron microscopy analyses. All porous SrTiO3 forms grains of several micrometers with surfaces studded with pores of ca. 20 nm (Fig. 6b). For the samples prepared with high SiO2 content, TEM analysis shows disordered distribution of interconnected pores of approx. 10 nm (Fig. 6c) and crystalline pore walls in very good agreement with nitrogen physisorption and XRD.
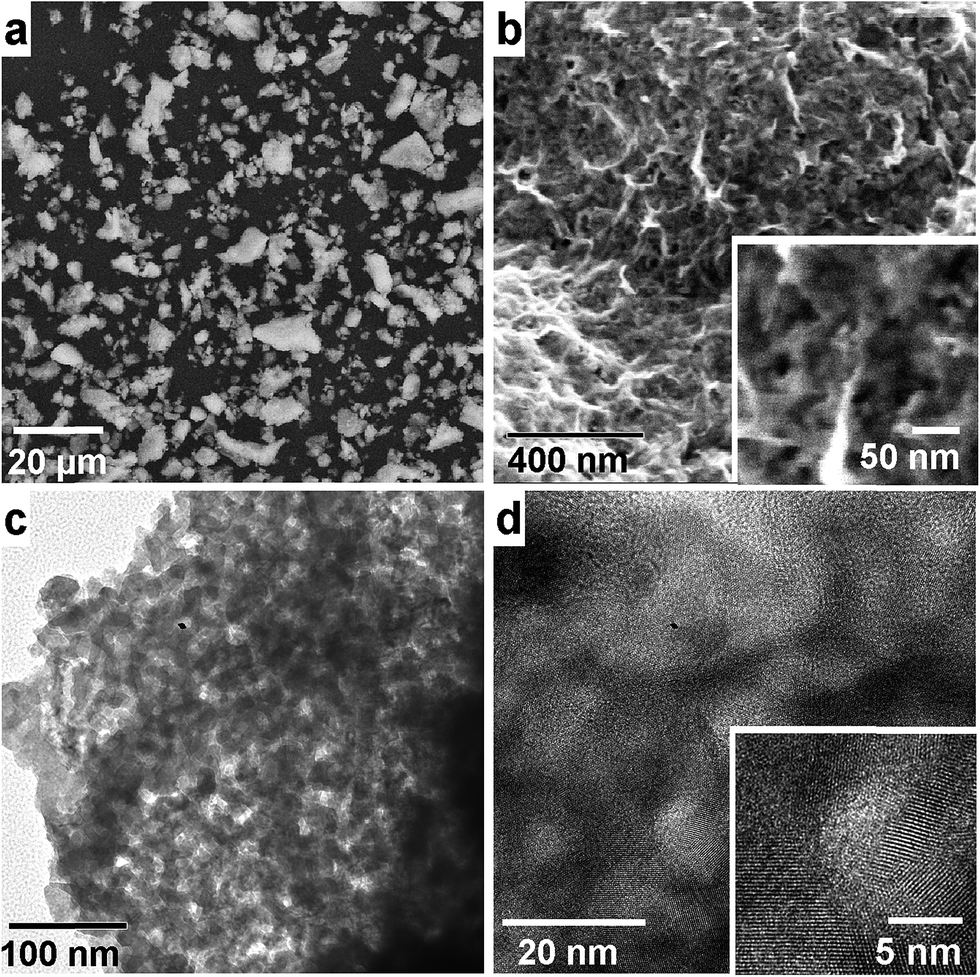 | ||
| Fig. 6 SEM (a, b), TEM overview (c) and HRTEM (d) micrographs of mesoporous 2:1 sample chosen as representative system. The insets are enlarged viewings of the corresponding SEM and HRTEM micrographs. | ||
Diffuse reflectance UV spectroscopy (DR-UV) was used to determine the light absorption properties of the investigated materials. The band gap energy (EBG) was calculated from the linear fit of the modified Kubelka-Munk function (F(R)hν)0.5 vs. hν (Tauc plot, Fig. 7a).37 The values of the linearization fitting are given in Table S1.† All the systems have similar band gap of ca. 3.25 eV, in line with literature results.13,38 Slight variations are evident, which can be ascribed to both diverse nanostructure and preparation method. The band gap increase in the bulk materials (Table 1) is explained both by the higher porosity,39,40 and by the decrease of crystallite size. Such structure variation triggers quantum size effects, which determine the band gap widening.41,42 As a consequence, a blueshift of the UV spectra is clearly visible, especially for the 1:1 sample. These results are in very good agreement with values published by Li et al.13 on similar mesoporous SrTiO3 nanoparticels. The material synthesis conditions have also significant impact on the band gap of metal oxides,37 which might explain the larger value for commercial SrTiO3 nanoparticles (np_SrTiO3). Moreover, the different absorption behavior of the templated systems with respect to pure SrTiO3 can be justified by alkalinization of the material surface occurring during the NaOH treatment.38
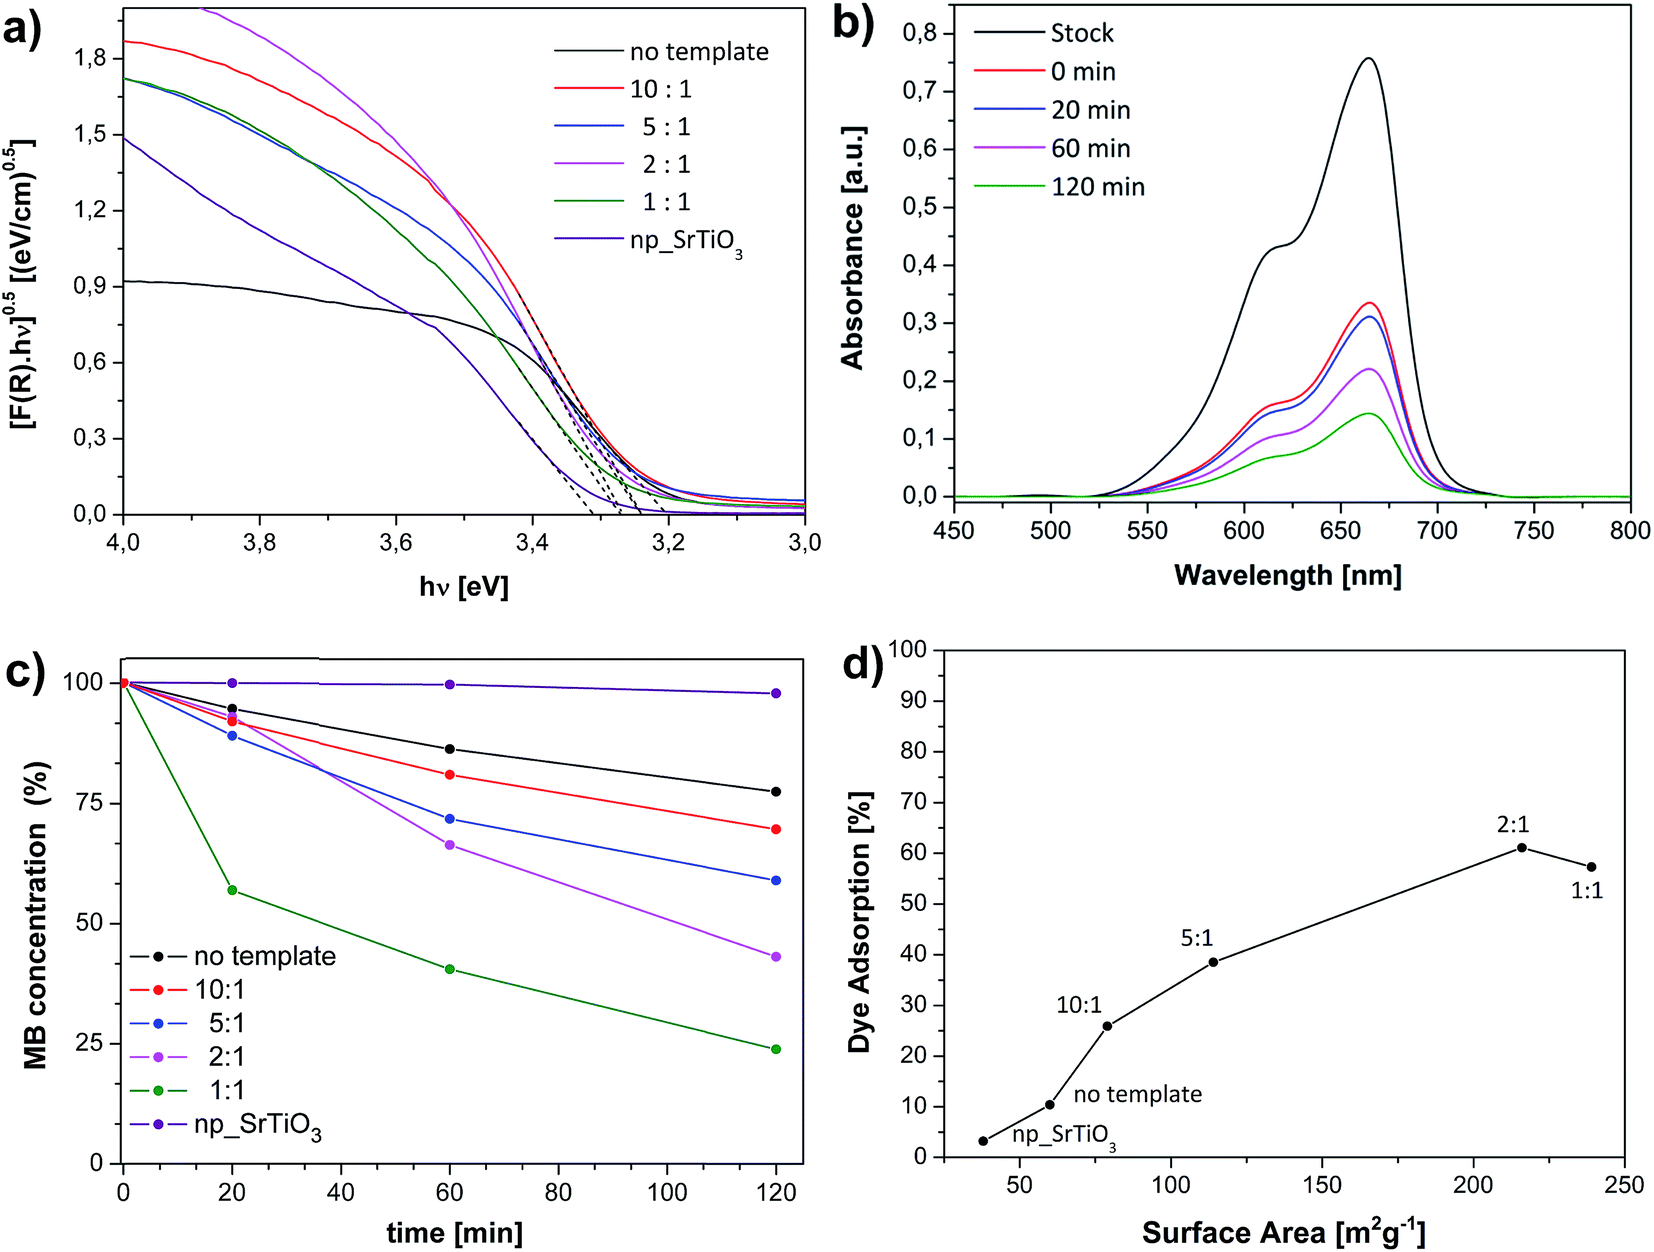 | ||
| Fig. 7 UV-Vis spectra of the tested materials (Tauc plot, a) and of methylene blue over the mesoporous 2:1 sample after different irradiation times (b). Extent of dye degradation achieved upon 2 h irradiation (c) and dye adsorption after 1 h dark-stirring of the stock solution (d) for the tested SrTiO3 samples. | ||
As mentioned before, SrTiO3 has been reported to exhibit interesting photocatalytic properties.12,13,27 The catalytic activity of our systems was exemplary studied by the photodegradation of methylene blue (MB) dye for potential waste-water treatment applications (Fig. 7b, S2b†). The effect of the silica template on the degradation of the MB can be observed in Fig. 7c. As reference, commercially available nanoparticulate SrTiO3 was used. The SiO2-free sample, prepared by the standard chelate complex method, resulted to be 15% more active than np_SrTiO3. The extent of dye degradation progressively increased with the increasing template content until a maximum of 75% for the nanoporous 1:1 sample. In addition, a basic analysis of the kinetic was performed to obtain better insight into the MB photodegradation. For each catalyst, the plot of ln(C/C0) vs. reaction time yielded almost a straight line (Fig. S3†), the slope of which indicates the apparent reaction constant kapp. This suggests that the photocatalytic decomposition of MB by all SrTiO3 samples follows an apparent kinetics law of first order, as can be also deduced by Fig. 7c. In particular, 1:1 nanoporous aggregates display an apparent degradation rate constant of 1.1 × 10⁻² min−1, which is much higher compared to the values obtained for nanoparticulated and no templated SrTiO3 (Table 1). Moreover, the normalized rate constant Knorm defined as Knorm = kapp/SBET for the degradation of MB revealed that the enhanced catalytic properties of the porous materials can be clearly related with their larger surface area, as expected.
In general, the photocatalytic dye degradation on transition metal oxides depends on two important processes namely, the absorption of the light followed by the separation of the e−/h+ pairs and the adsorption of organic molecules on the catalyst surface.43 These phenomena depend respectively by the microstructure and the porosity of the materials, and their analysis can help to better understand the photocatalytic behavior of the materials. Dye adsorption over the porous SrTiO3 samples after 1 h dark-stirring of the stock solution has shown to constantly increase with the surface area of the materials up to approx. 6 times with respect to the template-free material (Fig. 7d). Interestingly, it can be observed that the adsorption for the 10:1 sample is ca. 150% more than for the not templated one, even though both systems have similar surface area and porosity. With respect to pure SrTiO3, the 10:1 sample underwent NaOH treatment, which have possibly alkalized the surface.38 Hence, this process mighty have not only modified the absorption of the light (Fig. 7a) but also created stronger adsorption sites, thus explaining the higher dye adsorption and conversion. Moreover, although the materials obtained with larger concentration of silica have comparable dye adsorption capacities, the degradation potential of the 1:1 sample is significantly larger. This effect depends thus exclusively by light absorption capacity and is most probably determined by the prominent quantum size effects (blueshift of the material UV-spectrum), which enable good separation of the charge carriers.11,43
Hence, the mutual variation of porous and microstructural properties clearly explains the superior catalytic properties of the samples prepared with larger amount of silica with respect to the non-porous ones. Moreover we could observe that the activity of our systems is nicely in agreement with similar dye photodegradation studies on mesoporous SrTiO3 nanoparticles.11
Conclusions
Mesoporous bulk SrTiO3 was synthesized by a novel route, using the cooperative assembly of metal chelate complexes and alkoxysilanes. The high affinity and intimate mixing between the two precursors fostered the formation, via polycondensation of interpentrating organic–inorganic polymers. Pure crystalline mesoporous SrTiO3 with highly interconnected pores resulted after calcination of the organic phase and removal of the silica phase via NaOH etching.Variation of porosity and crystallinity were obtained using different SiO2-to-SrTiO3 molar ratios (0.1–1). The templating action of the silica and its effect on the structure and morphology of the final systems were addressed by a multi technique approach.
In particular, 29Si-MAS NMR analyses pointed out that at low concentrations of template only monomeric and oligomeric domains of silica could be formed. On the contrary, significant condensation of the siloxane groups and formation of dense domains occurred for concentrations larger than 20%. All the siliceous species were successfully removed via etching with exception of a small fraction of silicates.
The porous properties of the final perovskite reproduce very well the structural evolution of the silica in the nanocomposite materials. Hence, only at high SiO2 concentrations the condensed silica species acted as real template leading to the formation of large surface areas with narrower pore sizes. In addition, constant decrease of the SrTiO3 crystallite size upon increasing SiO2 content was observed owing to the hampered mass transport of the perovskite phase.
Finally, the activity of the mesoporous perovskites was exemplarily demonstrated by photocatalytic degradation tests of methylene blue. The dye conversion progressively increased with the content of silica template up to 7 times than for the corresponding non-porous system, as a result of the combined increase of porosity and decrease of crystallite size.
The presented cooperative assembly synthesis approach represents therefore an easy and reproducible approach to obtain photoactive mesoporous bulk crystalline SrTiO3 materials with large porosity and interconnected mesopores. Moreover, the high thermal stability of the porous structure and the flexible tuning of the composition offered by the metal complexes allow the implementation for other pure and doped perovskite oxide systems for energy-relevant (e.g. redox) catalysis applications.
Acknowledgements
Uta Sazama, Sandra König and Isabelle Nevoigt of the University of Hamburg are gratefully acknowledged for the help with the thermal, physisorption and X-ray diffraction analyses.References
- J. H. Haeni, P. Irvin, W. Chang, R. Uecker, P. Reiche, Y. L. Li, S. Choudhury, W. Tian, M. E. Hawley, B. Craigo, A. K. Tagantsev, X. Q. Pan, S. K. Streiffer, L. Q. Chen, S. W. Kirchoefer, J. Levy and D. G. Schlom, Nature, 2004, 430, 758–761 CrossRef CAS PubMed.
- K. van Benthem, C. Elsässer and R. H. French, J. Appl. Phys., 2001, 90, 6156 CrossRef CAS.
- R. A. De Souza, Adv. Funct. Mater., 2015, 25, 62326–66342 CrossRef.
- P. Lupetin, G. Gregori and J. Maier, Angew. Chem., Int. Ed., 2010, 49, 10123–10126 CrossRef CAS PubMed.
- H. Ohta, S. Kim, Y. Mune, T. Mizoguchi, K. Nomura, S. Ohta, T. Nomura, Y. Nakanishi, Y. Ikuhara, M. Hirano, H. Hosono and K. Koumoto, Nat. Mater., 2007, 6, 129–134 CrossRef CAS PubMed.
- A. V. Kovalevsky, A. A. Yaremchenko, S. Populoh, A. Weidenkaff and J. R. Frade, J. Phys. Chem. C, 2014, 118, 4596–4606 CAS.
- F. Messerschmitt, M. Kubicek, S. Schweiger and J. L. M. Rupp, Adv. Funct. Mater., 2014, 24, 7448–7460 CrossRef CAS.
- T. Sakuma, S. Yamamichi, S. Matsubara, H. Yamaguchi and Y. Miyasaka, Appl. Phys. Lett., 1990, 57, 2431 CrossRef CAS.
- P. Reunchan, S. Ouyang, N. Umezawa, H. Xu, Y. Zhang and J. Ye, J. Mater. Chem. A, 2013, 1, 4221 CAS.
- X. Zhou, N. Yan, K. T. Chuang and J. Luo, RSC Adv., 2014, 4, 118–131 RSC.
- H. Zhan, Z. G. Chen, J. Zhuang, X. Yang, Q. Wu, X. Jiang, C. Liang, M. Wu and J. Zou, J. Phys. Chem. C, 2015, 119, 3530–3537 CAS.
- S. Ouyang, P. Li, H. Xu, H. Tong, L. Liu and J. Ye, ACS Appl. Mater. Interfaces, 2014, 6, 22726–22732 CAS.
- H. Liu, X. Chen, S. Yan, Z. Li and Z. Zou, Eur. J. Inorg. Chem., 2014, 23, 3731–3735 CrossRef.
- J. H. Pan, C. Shen, I. Ivanova, N. Zhou, X. Wang, W. C. Tan, Q. H. Xu, D. W. Bahnemann and Q. Wang, ACS Appl. Mater. Interfaces, 2015, 7, 14859–14869 CAS.
- G. Xu, S. Deng, Y. Zhang, X. Wei, X. Yang, Y. Liu, G. Shen and G. Han, CrystEngComm, 2014, 16, 2025 RSC.
- J.-Q. Zheng, Y.-J. Zhu, J.-S. Xu, B.-Q. Lu, C. Qi, F. Chen and J. Wu, Mater. Lett., 2013, 100, 62–65 CrossRef CAS.
- M. Kakihana, T. Okubo, M. Arima, Y. Nakamura, M. Yashima and M. Yoshimura, J. Sol-Gel Sci. Technol., 1998, 12, 95–109 CrossRef CAS.
- M. Kakihana and M. Yoshimura, Bull. Chem. Soc. Jpn., 1999, 72, 1427–1443 CrossRef CAS.
- S. Diodati, L. Nodari, M. M. Natile, A. Caneschi, C. de J. Fernandez, C. Hoffmann, S. Kaskel, A. Lieb, V. Di Noto, S. Mascotto, R. Saini and S. Gross, Eur. J. Inorg. Chem., 2014, 5, 875–887 CrossRef.
- C. Sanchez, C. Boissière, D. Grosso, C. Laberty and L. Nicole, Chem. Mater., 2008, 20, 682–737 CrossRef CAS.
- B. L. Cushing, V. L. Kolesnichenko and C. J. O'Connor, Chem. Rev., 2004, 104, 3893–3946 CrossRef CAS PubMed.
- D. Grosso, C. Boissière, B. Smarsly, T. Brezesinski, N. Pinna, P. A. Albouy, H. Amenitsch, M. Antonietti and C. Sanchez, Nat. Mater., 2004, 3, 787–792 CrossRef CAS PubMed.
- T. Puangpetch, T. Sreethawong, S. Yoshikawa and S. Chavadej, J. Mol. Catal. A: Chem., 2008, 287, 70–79 CrossRef CAS.
- J. Lee, J. Kim, Y. Lee, S. Yoon, S. M. Oh and T. Hyeon, Chem. Mater., 2004, 16, 3323–3330 CrossRef CAS.
- R. Liu, Y. Shi, Y. Wan, Y. Meng, F. Zhang, D. Gu, Z. Chen, B. Tu and D. Zhao, J. Am. Chem. Soc., 2006, 128, 11652–11662 CrossRef CAS PubMed.
- O. Sel, S. Sallard, T. Brezesinski, J. Rathouský, D. R. Dunphy, A. Collord and B. M. Smarsly, Adv. Funct. Mater., 2007, 17, 3241–3250 CrossRef CAS.
- X. Fan, Y. Wang, X. Chen, L. Gao, W. Luo, Y. Yuan, Z. Li, T. Yu, J. Zhu and Z. Zou, Chem. Mater., 2010, 22, 1276–1278 CrossRef CAS.
- S. Brunauer, P. H. Emmett and E. Teller, J. Am. Chem. Soc., 1938, 60, 309–319 CrossRef CAS.
- P. I. Ravikovitch and A. V. Neimark, J. Phys. Chem. B, 2001, 105, 6817–6823 CrossRef CAS.
- D. Briggs and M. P. Seah, Practical surface analysis: by auger and X-ray photo-electron spectroscopy, Wiley, 1983 Search PubMed.
- J. F. Moulder, W. F. Stickle, P. E. Sobol and K. D. Bomben, Handbook of X-ray Photoelectron Spectroscopy, Eden Praire, 1992 Search PubMed.
- D. A. Shirley, Phys. Rev. B: Condens. Matter Mater. Phys., 1972, 5, 4709–4714 CrossRef.
- T. M. Breault and B. M. Bartlett, J. Phys. Chem. C, 2012, 116, 5986–5994 CAS.
- M. Andrianainarivelo, R. Corriu, D. Leclercq, P. H. Mutin and A. Vioux, J. Mater. Chem., 1996, 6, 1665 RSC.
- D. C. M. Dutoit, M. Schneider and A. Baiker, Chem. Eng., 1996, 439, 433–439 Search PubMed.
- M. Thommes, K. Kaneko, A. V. Neimark, J. P. Olivier, F. Rodriguez-Reinoso, J. Rouquerol and K. S. W. Sing, Pure Appl. Chem., 2015, 1051–1069 CAS.
- R. López and R. Gómez, J. Sol-Gel Sci. Technol., 2012, 61, 1–7 CrossRef.
- S. Ouyang, H. Tong, N. Umezawa, J. Cao, P. Li, Y. Bi, Y. Zhang and J. Ye, J. Am. Chem. Soc., 2012, 134, 1974–1977 CrossRef CAS PubMed.
- K. Wang, Y. Liu and Q. S. Yang, Ultrasonics, 2015, 61, 25–32 CrossRef PubMed.
- Y. Liu, J. Y. Su, Y. L. Xu and X. C. Zhang, Ultrasonics, 2009, 49, 276–280 CrossRef CAS PubMed.
- E. Monaico, V. V. Ursaki, I. M. Tiginyanu, Z. Dashevsky, V. Kasiyan and R. W. Boyd, J. Appl. Phys., 2006, 100, 1–6 CrossRef.
- N. Satoh, T. Nakashima, K. Kamikura and K. Yamamoto, Nat. Nanotechnol., 2008, 3, 106–111 CrossRef CAS PubMed.
- X. Chen, S. Shen, L. Guo and S. S. Mao, Chem. Rev., 2010, 110, 6503–6570 CrossRef CAS PubMed.
Footnote |
| † Electronic supplementary information (ESI) available. See DOI: 10.1039/c6ra13800d |
| This journal is © The Royal Society of Chemistry 2016 |