DOI:
10.1039/C5RA28167A
(Paper)
RSC Adv., 2016,
6, 16387-16394
Enhanced ferroelectricity/piezoelectricity, bright blue/yellow emission and excellent thermal stability in Ca1−x(LiDy)x/2Bi4Ti4O15 lead-free multifunctional ceramics
Received
31st December 2015
, Accepted 4th February 2016
First published on 4th February 2016
Abstract
A new lead-free solid solution of Ca1−x(LiDy)x/2Bi4Ti4O15 has been developed and prepared by a conventional solid state reaction method. The partial substitution of (Li0.5Dy0.5)2+ for Ca2+ ions in CaBi4Ti4O15 leads to great multi-improvement in the ferroelectricity/piezoelectricity, luminescence and thermal stability of the materials. All the ceramics possess a bismuth-layer structure; and the crystal structure of the ceramics is transformed from four layer bismuth-layer structure to a three layer structure with x increasing. For the ceramic with x = 0.2, high resistivity (R = 3.0 × 10¹¹ Ω cm), good piezoelectricity (d33 = 10.5 pC N−1), strong ferroelectricity (Pr = 9.92 μC cm−2) and improved luminescence are simultaneously obtained. These enhancements in multifunctional properties are greatly attributed to the contribution of (Li0.5Dy0.5)2+ in the ceramics. Under the excitation of 451 nm light, the (LiDy)2+-modified ceramics exhibit bright blue and yellow emission peaks centered at 484 nm and 574 nm, corresponding to the transition of the 4F9/2 → 6H15/2 and 4F9/2 → 6H13/2 levels of Dy3+ ions, respectively. Interestingly, excellent temperature stability of the ferroelectricity/piezoelectricity and luminescence is also observed in the ceramic with x = 0.2. These results show that Ca1−x(LiDy)x/2Bi4Ti4O15 multifunctional ceramics may have promising potential in high temperature multifunctional devices.
1. Introduction
Rare earth ions are commonly used to prepare highly efficient phosphor materials as activators ions and improve the electrical properties of the ferroelectric materials as dopants.1–4 In recent years, there is a huge interest in the field of multifunctional optical–electrical materials with rare earth ion doping because of the increasing demand in the miniaturization and multifunction of electronic/microelectronic devices.5–7 As promising candidates for multifunctional materials, rare earth ions-modified perovskite ferro/piezoelectric ceramics have been extensively investigated due to the simultaneous existence of fluorescent and ferro/piezoelectric characteristics. For instances, Sm/Er-doped K0.5Na0.5NbO3, Pr-doped (1 − x)Na0.5Bi0.5TiO3–xBaZr0.05Ti0.95O3, Er-activated BaTiO3–(Na0.5Er0.5)TiO3 and Ho-doped Na0.5Bi0.5TiO3-based ceramics have been fabricated and exhibit good multifunctional properties.5–9 However, these classic ceramics with simple perovskite structure usually exhibit poor temperature stability due to their low depolarization temperature or room-temperature coexistence of tetragonal and orthorhombic phases. Therefore, it is necessary to develop new multifunctional optical–electrical materials with good multifunctional properties and temperature stability.
As promising high temperature piezoelectric materials, bismuth oxide layer-structured ferroelectrics (BLSFs) have been extensively investigated due to their high Curie temperature.10–13 Recently, rare earth-doped BLSFs have received significant attention because of the coexistence of ferro-/piezoelectricity and luminescence.14–16 As typical materials with fourth-layer bismuth layer structure, CaBi4Ti4O15 (CBT) possesses high Curie temperature of 790 °C and has been considered as one of promising multifunctional materials. For instances, Er/Eu/Ho-doped CBT ceramics17–19 have been reported and the materials show excellent ferroelectric/piezoelectric properties and luminescence. However, to our knowledge, there is no report on rare earth elements Dy-doped CBT ceramics. As an crucial activator ions, Dy3+ ions play an important role in developing luminescent materials20,21 because of its two main emission bands. One is located at the blue region (470–500 nm) due to the 4F9/2 → 6H15/2 transition of Dy3+ ions, while the other is the yellow (560–600 nm) region because of 4F9/2 → 6H13/2 transition of Dy3+ ions. The blue emission is an magnetic dipole transition and hardly varies with the crystal field environment around Dy3+ ions. The yellow emission belongs to the electric dipole transition and it can be strongly influenced by the crystal field environment surrounding Dy3+ ions.22 Nevertheless, the charge of Dy3+ ion is different from Ca2+ ion. Therefore, the substitution of Dy3+ ion for Ca2+ ion will cause positive charges, which is undesirable for the luminescence of the materials.23 It has been noted that several investigations have confirmed that the addition of Li+ ions can enhance the luminescence of the materials.24,25 Moreover, the doping of Li+ ion can also enhance the application temperature of the KNN-based ceramics, which has been frequently reported.26,27 Therefore, for our experiment, Li ion is choosed as a charge compensator and (Li0.5Dy0.5)2+ complex ions are used to substitute Ca2+ ions in CBT materials. As a result, it may be expected that the ferro-/piezoelectricity, luminescence and temperature stability of multifunctional properties can be improved by Li+ and Dy3+ ions doping in the CBT ceramics. In this work, Ca1−x(LiDy)x/2Bi4Ti4O15 ceramics was synthesized by traditional solid state reaction method, and their structure, ferroelectric, piezoelectric, luminescent properties and temperature stability were studied in detail. As a promising multifunctional candidate, the present material exhibits great multi-improvement in ferroelectricity, piezoelectricity, luminescence and temperature stability of multifunctional properties.
2. Experimental
Ca1−x(LiDy)x/2Bi4Ti4O15 (CBT-LiDy-x) ceramics were fabricated by a traditional solid state reaction method using metal oxides and carbonate as powders: Bi2O3 (99.0%), CaCO3 (99.9%), TiO2 (99.9%), Li2CO3 (99.99%) and Dy2O3 (99.9%). All raw materials in the stoichiometric ratio of CBT-LiDy-x were mixed thoroughly in ethanol using zirconia balls for 8 h. Then, the mixtures were dried and calcined at 850 °C for 4 h in an alumina crucible. After calcination, the mixtures were ball-milled again. The powders were mixed with a PVA binder solution, then pressed to disk-shaped samples. Finally, the samples were sintered at 1000–1060 °C for 2 h in air. Silver electrodes were fired on the top and bottom surfaces of the samples at 650 °C for 30 min. The samples were poled at 180 °C in a silicone oil bath for 20 min and then cooled to room temperature under a dc field of 10 kV mm−1.
The crystalline structure of the sintered samples was identified by an X-ray diffractometer (XRD) with CuKα (λ = 1.540598 Å) radiation (Smart Lab; Rigaku), 0.01° scan step and continuous scanning type in the 2θ range of 20–70°. A scanning electron microscopy (SEM, FEI-Quanta 250; FEI, Portland, OR) was used to characterize the microstructures of the ceramics. The spectrofluorometer F-7000 (Hitachi High-Tech.) using a 150 W xenon lamp as the excitation source was used to record the photoluminescence (PL) and photoluminescence excitation (PLE) spectra of the materials. The temperature-dependent luminescent properties were measured on a spectrofluorometer (F-4600, Hitachi, Japan). The polarization hysteresis (P–E) loops were measured at 200 °C in a silicone oil bath using a precision material measuring system (Premier II, Radiant Technologies, Inc.). The planar electromechanical coupling factor kp was determined by the resonance method according to the IEEE Standards 176 using an impedance analyzer (Agilent 4294A; Agilent Technologies Inc.). The piezoelectric constant d33 was measured by a piezo-d33 meter (ZJ-6A, Institute of Acoustics).
3. Results and discussion
3.1 Structural characterization
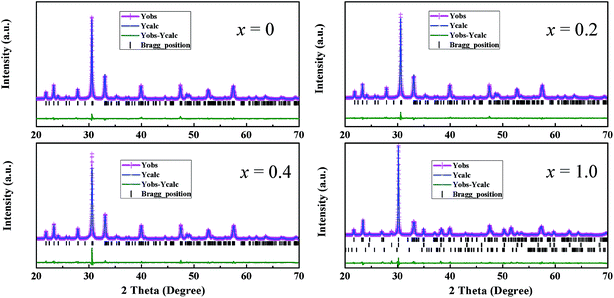
Fig. 1 shows the XRD patterns of the (LiDy)-doped CBT ceramics with different x values. It is obvious that the diffraction peaks of the samples for these compositions with x = 0–0.4 can be exactly indexed according to orthorhombic space group A21am. Therefore, the ceramics with x = 0–0.4 possess typical Aurivillius type structure with m = 4, suggesting that the doped Li+ and Dy3+ ions have been successfully incorporated into the CBT lattice to form a solid solution. It has been known that the most intense reflection planes are from the type of (112m + 1) planes in the BLSFs.28,29 So, it can be noted that the (119) diffraction peak of these compositions for our materials possesses the highest intensity, which is consistent with the rule observed in the BLSFs. As x increases from 0.6 to 1.0, the several diffraction peaks of (115)/(0012) and (1119)/(2016) gradually weaken and disappear compared to the compositions with x = 0–0.4, and the second phases Dy2TiO5 and Li2TiO3 are formed. In addition, the strongest diffraction peak shifts gradually to the lower 2θ angles and three layer structure become gradually dominant at high (Li0.5Dy0.5)2+ doping level. This can be explained as follows: after the addition of excess (Li0.5Dy0.5)2+ ions, Li+ and Dy3+ ions can not be completely incorporated into CBT lattice and lead to the destruction of the pristine bismuth-layer structure with m = 4. Thus, bismuth-layer structure varies from four layer to three layer with x increasing. At x = 1.0, the Bi4Ti3O12 with a stable Aurivillius type three layer structure is formed, and the diffraction peaks can be indexed by orthorhombic space group B2cb. It can be concluded that the level of (Li0.5Dy0.5)2+ has an important effect on crystal structure of the ceramics. After a small amount of (Li0.5Dy0.5)2+ doping, the ceramics possess typical bismuth-layer structure with m = 4; however, the crystal structure of the ceramics is transformed gradually to the bismuth-layer structure with m = 3 after the addition of excess (Li0.5Dy0.5)2+ ions.
 |
| | Fig. 1 XRD patterns of the CBT-LiDy-x ceramics: (a) 2θ = 20–70°; and (b) 2θ = 29.5–31°. | |
To further investigate the crystal structure of the ceramics, the Rietveld refinements of the CBT-LiDy-x (x = 0, 0.2, 0.4 and 1.0) ceramics have been performed using the general structure analysis system (FULLPROF) system program.30 Fig. 2 and Table 1 show the refinement pattern and the final refined structural parameters of the CBT-LiDy-x (x = 0, 0.2, 0.4 and 1.0) ceramics, respectively. The good refined factors (Rwp, Rp and χ2) are obtained and shown in Table 1. For the ceramics with x = 0, 0.2 and 0.4, the lattice parameters a, b, c and V are 5.4303(0)/5.4275(1)/5.4218(1) Å, 5.4096(2)/5.4077(4)/5.4057(0) Å, 40.7203(8)/40.7162(7)/40.7142(8) Å and 1196.1893(8)/1195.0323(5)/1193.2771(9) Å3, respectively. It can be observed that the lattice parameters decrease gradually after the addition of a small amount of (Li0.5Dy0.5)2+ ions, which is attributed to the smaller ions radius of Li+ and Dy3+ ions than Ca2+ ions. Ultimately, as x further increases to 1.0, the lattice parameters a, b, c and V are changed to 5.4248(1) Å, 5.3951(3) Å, 32.7941(2) Å and 959.7960(2) Å3, respectively. It is obvious that the lattice parameters c and V exhibit a large decrement, suggesting that the crystal structure of the materials has been changed from bismuth-layer structure with m = 4 to m = 3 after the addition of excess Li+ and Dy3+ ions.
 |
| | Fig. 2 Rietveld refinement patterns of the powder diffraction of the CBT-LiDy-x (x = 0, 0.2, 0.4 and 1.0) ceramics at room temperature. | |
Table 1 Refined structural parameters of CBT-LiDy-x (x = 0, 0.2, 0.4 and 1.0) ceramics
| Parameters |
x = 0 |
x = 0.2 |
x = 0.4 |
x = 1.0 |
| Refined factor |
| Rwp (%) |
7.35 |
7.11 |
8.69 |
8.24 |
| Rp (%) |
6.25 |
6.26 |
7.6 |
9.31 |
| χ2 |
2.79 |
2.5 |
1.84 |
2.21 |
![[thin space (1/6-em)]](https://www.rsc.org/images/entities/char_2009.gif) |
| Phase constitution (%) |
| CaBi4Ti4O15 |
100 |
100 |
100 |
— |
| Bi4Ti3O12 |
— |
— |
— |
93.82 |
| Dy2TiO5/Li2TiO3 |
— |
— |
— |
4.92/1.26 |
|
| Lattice parameters |
| a (Å) |
5.4303(0) |
5.4275(1) |
5.4218(1) |
5.4248(1) |
| b (Å) |
5.4096(2) |
5.4077(4) |
5.4057(0) |
5.3951(3) |
| c (Å) |
40.7203(8) |
40.7162(7) |
40.7142(8) |
32.7941(2) |
| V (Å3) |
1196.1893(8) |
1195.0323(5) |
1193.2771(9) |
959.7960(2) |
Fig. 3 shows the SEM images of the as-sintered surface microstructure of the CBT-LiDy-x ceramics with x = 0, 0.2, 0.6 and 1.0. From Fig. 3, all the ceramics show typical plate-like grains with random orientation, which can be attributed to the faster growth rate along the a–b plane compared with the c-axis in the BLSFs.31 It can be also noted that the grain shapes and sizes hardly change with the Li+ and Dy3+ ions doping concentration, while a small amount of grains possessing rounded edges are observed for the composition with x = 1.0, which may be ascribed to the appearance of secondary phases (Dy2TiO5 and Li2TiO3). After the addition of excess (Li0.5Dy0.5)2+ ions, secondary phases may concentrates near the grain boundaries,32 which makes the ions transportation near the grain boundaries weaken and the mobility of the grain boundary decrease. As a result, the grain growth is inhibited at high level of Li+ and Dy3+.
 |
| | Fig. 3 SEM graphs of the surface microstructure of the CBT-LiDy-x ceramics with x = 0 (a), 0.2 (b), 0.6 (c) and 1.0 (d). | |
3.2 Electrical properties
3.2.1 Electrical insulation. Fig. 4a shows the leakage current density J of the CBT-LiDy-x ceramics on the electric field E, while Fig. 4b gives the dependence of the resistivity R of the CBT-LiDy-x ceramics on x under 3 kV mm−1. From Fig. 4a, the leakage current density J almost retains a constant of 6.7 × 10⁻⁸ A cm−2 for the ceramics with x = 0–0.3 and gradually increases up to 1.9 × 10⁻⁶ A cm−2 with x further increasing to 1.0. From Fig. 4b, under the electric field of 3 kV mm−1, for the composition with x = 0–0.3, the resistivity R exhibits large values of ∼3.0 × 10¹¹ Ω cm, suggesting that the ceramics possess good electrical insulation. However, it decreases gradually as x further increases and the low value of 1.3 × 10¹⁰ Ω cm is observed at x = 1.0, which should be attributed to the conversion of crystal structure and appearance of secondary phases (Fig. 1).
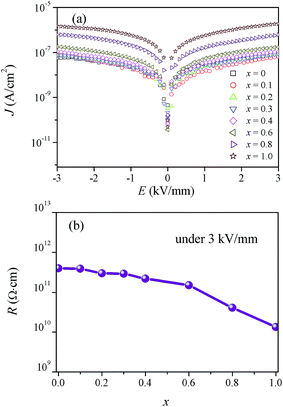 |
| | Fig. 4 (a) Variations of leakage current density J with electric field E, (b) composition dependence of the resistivity R for the CBT-LiDy-x ceramics. | |
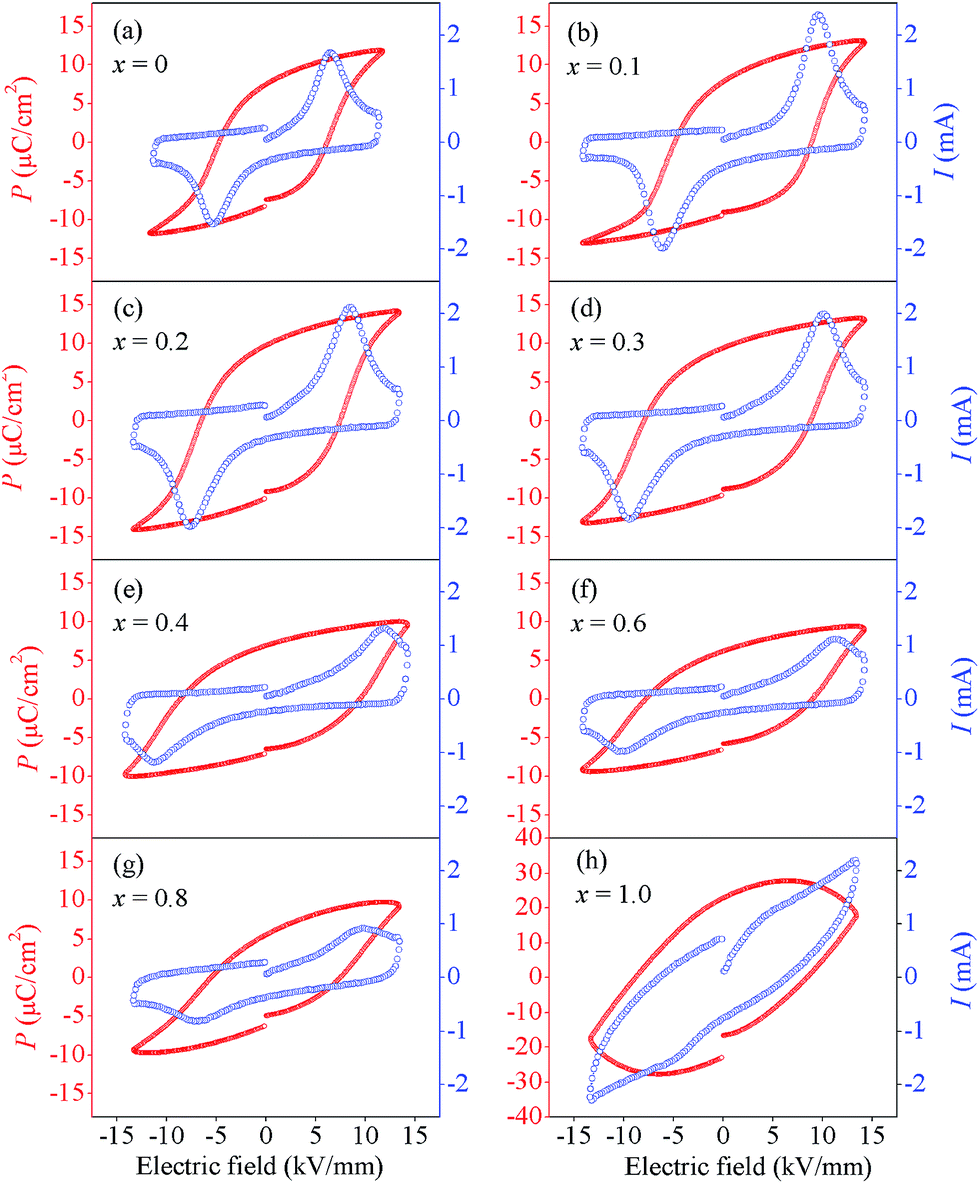
3.2.2 Ferroelectric properties. Fig. 5a–h shows the P–E and I–E loops of the CBT-LiDy-x ceramics measured under an electric field of 13.5 kV mm−1 at 200 °C, while composition dependences of the remanent polarization Pr and coercive filed Ec for the CBT-LiDy-x ceramics are displayed in Fig. 6. From Fig. 5a–d, typical and saturated P–E loops are obtained for the ceramics with x = 0–0.3. As x further increases, P–E loops become gradually un-saturated and then round, which may be caused by the poor electric insulation and impurity phases. On the other hand, two obvious current peaks in the I–E curves are observed with x = 0–0.3, suggesting that these ceramics experience reversible electric-field-induced ferroelectric phase. However, the current peaks gradually becomes weak and even disappears with x increasing from 0.4 to 1.0, (Fig. 5e–h), indicating that the poor polarization switching behavior and ferroelectric properties are observed after excess (Li0.5Dy0.5)2+ ions doping. As shown in Fig. 6, the observed coercive field Ec increases from 6.22 to 8.52 kV mm−1 with x increasing from 0 to 0.4 and then decreases to 6.5 kV mm−1 with x further increasing to 0.8. The observed remanent polarization Pr increases initially and then decreases, giving a maximum value of 9.92 μC cm−2 with x = 0.2. Therefore, the addition of a small amount of (Li0.5Dy0.5)2+ ions can enhance the ferroelectricity of the ceramics. This may be attributed to the appearance of the compressive stress caused by the substitution of the smaller Li+ and Dy3+ ions for the larger Ca2+ ions; as a result, rattling space for TiO6 octahedra is more and rotation of TiO6 octahedra in the a–b plane is larger,17 leading to improve the ferroelectric properties of the ceramics. However, as x further increases, the poor ferroelectricity is obtained, which may be related to the crystal structure transformation and the decreasement of electrical insulation after excess (Li0.5Dy0.5)2+ ions doping.
 |
| | Fig. 5 (a–h) P–E and I–E loops of the CBT-LiDy-x ceramics measured under an electric field of 13.5 kV mm−1 at 200 °C. | |
 |
| | Fig. 6 Composition dependences of the remanent polarization Pr and coercive filed Ec for the CBT-LiDy-x ceramics. | |
3.2.3 Piezoelectric properties. The electric field is a key factor to effect the piezoelectric properties of the ceramics. The d33 value of the ceramics increases with the electric field increasing, while the ceramics are easy to breakdown under an overhigh electric field. Therefore, in order to compare with the piezoelectricity of all the ceramics in the same temperature and electric field conditions, we select the electric field of 10 kV mm−1 to pole the ceramics and the piezoelectric coefficient of all the ceramics is measured. The composition dependences of d33, kp, εr and tanδ for the CBT-LiDy-x ceramics are shown in Fig. 7. From Fig. 7a, for the CBT-LiDy-x ceramics, both d33 and kp vary in a similar trend. The observed d33 and kp increase firstly and reach their maximum values of 10.5 pC N−1 and 7.5% at x = 0.2, and then decreases gradually with x further increasing. The good piezoelectricity of the ceramics should be attributed to strong ferroelectricity and good electrical insulation which makes the ceramic withstand high poling fields.33 However, as x increases from 0.6 to 1.0, the d33 and kp decreases significantly from 6.5 to 2.4 pC N−1 and 6.1% to 4.3% due to the decreased electrical insulation produced by the secondary phases (Fig. 1 and 4). This makes the possible polarization direction diminish and thus the piezoelectricity of the ceramics decreases. From Fig. 7b, the observed εr increases firstly from 155 to 180 with x increasing from 0 to 0.6 and then decreases gradually with x further increasing. The observed tanδ decreases to 0.29% with x increasing from 0 to 0.2 and then increases gradually with x further increasing.
 |
| | Fig. 7 Composition dependences of (a) piezoelectric constant d33, electromechanical coupling factor kp, (b) dielectric constant εr and loss factor tanδ for the CBT-LiDy-x ceramics. | |
3.3 Luminescent properties
The excitation spectra of the CBT-LiDy-x ceramics by monitoring at 574 nm at room temperature are shown in Fig. 8. From Fig. 8, effective energy absorption caused by the 4f–4f transition of Dy3+ ions are mainly concentrated in the range of 380–500 nm. The strong excitation peak at 451 nm corresponds to the 6H15/2 → 4I15/2 transition. The relatively weak excitation peaks around 387 nm, 425 nm and 474 nm are assigned to the 6H15/2 → 4I13/2, 6H15/2 → 4G11/2 and 6H15/2 → 4F9/2 transitions, respectively. Moreover, it can be noted that the excitation peaks are the same in the band shape and position except the emission intensity with x increasing.
 |
| | Fig. 8 Excitation spectra of the CBT-LiDy-x ceramics monitored at 574 nm. | |
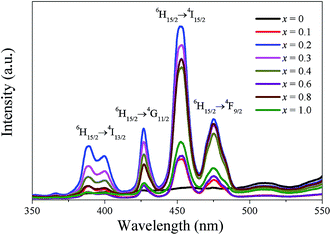
The emission spectra of the CBT-LiDy-x ceramics under 451 nm excitation at room temperature are shown in Fig. 9a. It is noticeable that there have no significant changes for the emission peak position and shape, while the strong change of the peak intensities are evident for the materials with different compositions. Two main emission peaks are displayed in the emission spectra: one is the blue emission located at 484 nm, which is assigned to the 4F9/2 → 6H15/2 transition of Dy3+ ions, and the other is the yellow emission centered at 574 nm, which is corresponded to the 4F9/2 → 6H13/2 transition of Dy3+ ions. As well known, the yellow emission belongs to the hypersensitive electric dipole transition and it is strongly influenced by the crystal field environment of surrounding Dy3+ ions.34,35 When Dy3+ ions is at a low symmetry site (without inversion symmetry), the yellow emission is stronger. However, the blue emission belongs to the magnetic dipole transition and it is less sensitive to crystal field environment of surrounding Dy3+ ions compared with the yellow emission. Fig. 9b shows the dependence of yellow-to-blue ratio (Y/B) as a function of x. For the present ceramics, the (Y/B) ratio increases gradually and close to 1 with x increasing from 0 to 0.4, indicating that both the magnetic and electric dipole transition are dominant in these compositions. As x further increases, the (Y/B) ratio decreases gradually and blue emission is dominant, which may be attributed to the crystal structure transformation after the excess addition of Li+ and Dy3+ ions. To further reveal luminescence process of Dy3+ ions, the simplified energy level diagram is shown in Fig. 9c. According to the energy level diagram for Dy3+ ions and selection rules, the electrons with 6H15/2 ground state are excited to the higher energy levels (e.g., 4I13/2, 4G11/2, etc.) under the 451 nm light excitation, and the excited states electrons can non-radiatively relax to the 4F9/2 state and then subsequently recombine to the lower level of 6H15/2 and 6H13/2, respectively. As a result, the strong blue and yellow emission is observed as shown in Fig. 9a. Fig. 10 shows a CIE chromaticity coordinates of the CBT-LiDy-x ceramics with the emission spectra excited 451 nm. According to the CIE standards, the chromaticity coordinates based on the emission spectrum of the CBT-LiDy-x ceramics were calculated. From Fig. 10, the CIE coordinates (x, y) varies systematically from x = 0.2 (0.3334, 0.4064), x = 0.4 (0.3282, 0.4077) to x = 1.0 (0.3003, 0.4025) as the (Li0.5Dy0.5)2+ ions content increases.
 |
| | Fig. 9 (a) Emission spectra of the CBT-LiDy-x ceramics under 451 nm excitation. (b) The dependence of yellow-to-blue ratio (Y/B) as a function of x. (c) Energy level scheme of Dy3+ ions. | |
 |
| | Fig. 10 CIE chromaticity coordinates of the CBT-LiDy-x (x = 0.2, 0.4 and 1.0) ceramics with the emission which excited at 451 nm. | |
3.4 Temperature stability of ferro-/piezoelectricity and luminescence
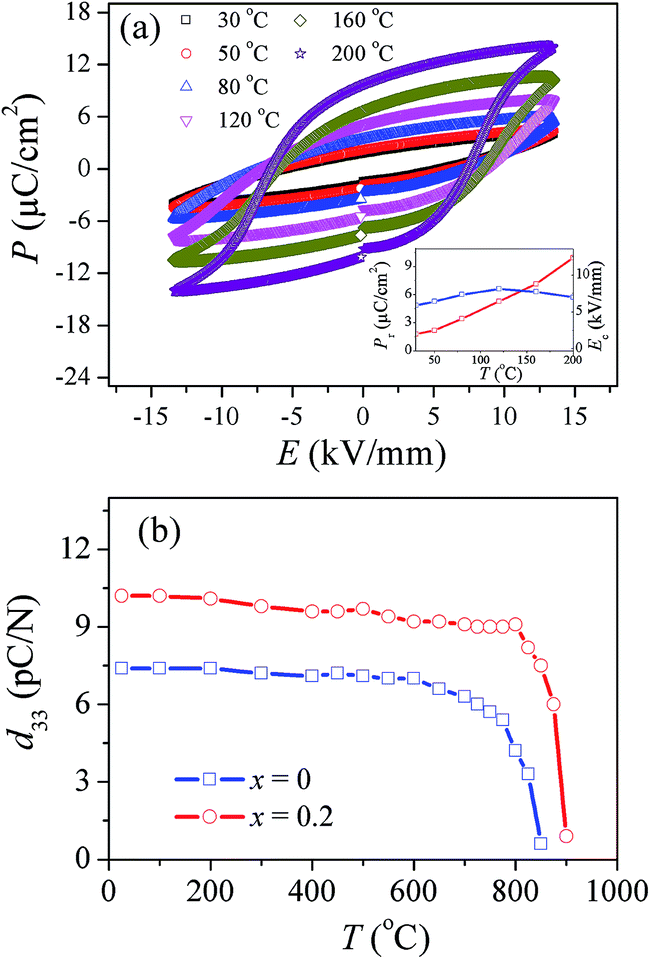
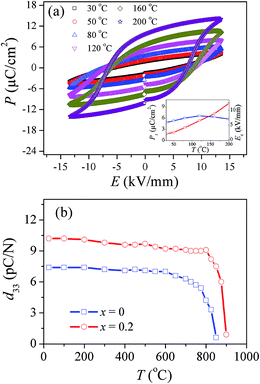
Fig. 11a shows the P–E loops of the CBT-LiDy-0.2 ceramic measured under an electric field of 13.5 kV mm−1 at different temperatures, and the inset shows the temperature dependence on the remanent polarization Pr and coercive filed Ec for the CBT-LiDy-0.2 ceramic. The temperature plays an important role on the ferroelectric P–E loops.36 From Fig. 11a, the un-saturated P–E loop is observed and a low Pr of 1.8 μC cm−2 is obtained at 30 °C. As the temperature increases from 50 °C to 200 °C, the P–E loops become gradually saturated and Pr increases monotonously. At 200 °C, a high Pr of 9.92 μC cm−2 is obtained. The above result indicates that the increasement of temperature is an effective way to enhance the ferroelectric domain switching and obtain the high Pr. On the other hand, the observed Ec increases initially and then decreases gradually as x increases, giving a maximum of 8.1 kV mm−1 at 120 °C.
 |
| | Fig. 11 (a) P–E loops of the CBT-LiDy-0.2 ceramic at different measuring temperatures (inset: temperature dependences on Pr and Ec for the CBT-LiDy-0.2 ceramic); (b) effect of thermal depoling on piezoelectric properties for the CBT-LiDy-x (x = 0 and 0.2) ceramics. | |
As well know, the thermal stability of piezoelectric properties of the ceramics is a key factor for the high-temperature applications of lead-free piezoelectric ceramics. Here, the thermal depoling behaviors of piezoelectric constant of the CBT-LiDy-x (x = 0 and 0.2) ceramics are shown in Fig. 11b. The ceramic were annealed at selected temperature for 1 h, and their d33 was re-measured at room temperature. From Fig. 11b, For the ceramic with x = 0, the observed d33 value remains almost unchangeable as temperature increases from 20 °C to 600 °C and then decreases gradually with temperature further increasing. For the ceramic with x = 0, the depolarization temperature is ∼600 °C. For the ceramic with x = 0.2, the observed d33 retains nearly unchanged (∼10.3 pC N−1) as the temperature increases from 20 °C to 800 °C, and then decreases sharply to 0.9 pC N−1 when the temperature further increases to 900 °C, indicating that the thermal stability is greatly improved after the addition of 20 mol% (Li0.5Dy0.5)2+. It can be seen that the depolarization temperature is increased by ∼200 °C with x increasing from 0 to 0.2. This should be ascribed to the substitution of the smaller Li+ and Dy3+ ions for the larger Ca2+ ions. The temperature stability of piezoelectricity for the present materials is much better than the traditional lead-free materials (e.g., KNN- (∼230 °C),37 BNT- (∼168 °C),38 BaTiO3 (BT)-based (∼70 °C)39 ceramics), suggesting that the present ceramic may have potential applications in high-temperature devices.
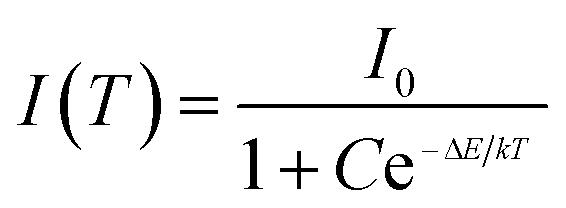
The thermal stability of luminescence of the materials is an important aspect for the application of high-powered LEDs.40 The emission spectra of the CBT-LiDy-0.2 ceramic under 451 nm excitation measured at different temperature in the range of 25–250 °C are shown in Fig. 12a. There is no evident shift in the positions and shapes of the emission peaks except for the intensity. Fig. 12b shows temperature dependence of the emission intensity assigned to the 4F9/2 → 6H15/2 and 4F9/2 → 6H13/2 transition of Dy3+ ions. Obviously, the blue and yellow emission intensities of the ceramic are still strong (∼75% of its initial value) when the temperature increases to 100 °C, indicating that the material possesses a good thermal quenching effect. This can be explained as follows: the excited luminescent center is thermally activated by phonon interaction and subsequently released by crossover. Thus, the emission intensity of the material decreases with the temperature increasing. Similar phenomenon has been reported by Shi et al. and Lee et al. in the Eu-activated phosphors.40,41 To illustrate clearly the thermal quenching behavior, the temperature dependence of the luminescent intensity are described by following Arrhenius equation:5,41
where
I0 and
I(
T) are the luminescent intensity at initial and measured temperature, respectively.
C is a constant,
k is the Boltzmann constant and the value is 8.617 × 10
−5 eV K
−1, Δ
E is the active energy for temperature quenching. According to equation, it can be inferred that ln(
I0/
IT − 1)
vs. 1/
kT exist a line relation and the fitting line is plotted in
Fig. 12c. The activation energy is the slope of the straight line. The value of Δ
E can be calculated to be 0.413 eV after fitting.
 |
| | Fig. 12 (a) Emission spectra (λex = 451 nm) of the CBT-LiDy-0.2 ceramic measured at different temperatures in the range of 25–250 °C. (b) Temperature dependence of the emission intensity assigned to the 4F9/2 → 6H15/2 and 4F9/2 → 6H13/2 transition of Dy3+ ions. (c) A ln(I0/IT − 1) vs. 1/kT activation energy graph for the thermal quenching of the CBT-LiDy-0.2 ceramic. | |
4. Conclusions
New Ca1−x(LiDy)x/2Bi4Ti4O15 ceramics were successfully fabricated by a traditional solid state processing, and the effects of (LiDy) doping on the phase structure, ferroelectric, piezoelectric, luminescent properties of the ceramics and temperature stability of multifunctional properties were investigated. Typical bismuth-layer structure and plate-like grains are observed in all ceramics. The ceramic with x = 0.2 simultaneously exhibits strong ferroelectricity, good piezoelectricity and improved luminescent properties. Under the excitation of 451 nm light, two main emission peaks around 484 nm and 574 nm corresponding to the 4F9/2 → 6H15/2 and 4F9/2 → 6H13/2 transition of Dy3+ ions are obtained, respectively. The excellent temperature stability of ferroelectricity, piezoelectricity and luminescence is obtained. This is greatly associated with the contribution of a small amount of (Li0.5Dy0.5)2+ ions. Our results suggest that the present materials may have a potential application in optical–electrical devices.
Acknowledgements
This work was supported by the projects of National Natural Science Foundation of China (Grant No. 51572178), Education Department of Sichuan Province (15ZA0034 and 15ZB0032), Science and Technology Bureau of Sichuan Province (2014JY0040).
References
- Z. Xia, S. Miao, M. Chen, M. S. Molokeev and Q. Liu, Inorg. Chem., 2015, 54, 7684–7691 CrossRef CAS PubMed.
- D. Geng, M. Shang, Y. Zhang, H. Lian and J. Lin, Inorg. Chem., 2013, 52, 13708–13718 CrossRef CAS PubMed.
- U. Chon, J. S. Shim and H. M. Jiang, J. Appl. Phys., 2003, 93, 4769–4775 CrossRef CAS.
- D. Guo, L. Zhang, M. Li, J. Liu and B. Yu, J. Am. Ceram. Soc., 2008, 91, 3280–3284 CrossRef CAS.
- Q. Zhang, K. Chen, L. Wang, H. Sun, X. Wang and X. Hao, J. Mater. Chem. C, 2015, 3, 5275–5284 RSC.
- H. Sun, Q. Zhang, X. Wang and M. Gu, Ceram. Int., 2014, 40, 2581–2584 CrossRef CAS.
- P. Du, L. Luo, W. Li, Y. Zhang and H. Chen, J. Alloys Compd., 2013, 559, 92–96 CrossRef CAS.
- J. Li, X. Chai, D. Peng, H. Zou, X. Wang and X. Yao, Appl. Phys. Lett., 2014, 105, 082901–082905 CrossRef.
- T. Wei, Z. Chang, Q. J. Zhou, D. M. An, Z. P. Li and F. C. Sun, Mater. Lett., 2014, 115, 129–131 CrossRef CAS.
- Z. Peng, Q. Chen, Y. Wang, D. Xin, D. Xiao and J. Zhu, Mater. Lett., 2013, 107, 14–16 CrossRef CAS.
- X. Hui, D. Peng, H. Zou, J. Li, Q. Cao, Y. Li, X. Wang and X. Yao, Ceram. Int., 2014, 40, 12477–12483 CrossRef CAS.
- P. Sarah, Procedia Eng., 2011, 10, 2684–2689 CrossRef CAS.
- R. Z. Hou and X. M. Chen, J. Eur. Ceram. Soc., 2006, 26, 1379–1383 CrossRef CAS.
- T. Wei, Q. J. Zhou, C. Z. Zhao, Y. B. Lin, Y. L. Zou, Y. Li and L. S. Zhang, Ceram. Int., 2013, 39, 7211–7215 CrossRef CAS.
- T. Wei, C. Li, Q. Zhou, Y. Zou and L. Zhang, Mater. Lett., 2014, 118, 92–95 CrossRef CAS.
- Q. Cao, D. Peng, H. Zou, J. Li, X. Wang and X. Yao, J. Adv. Dielectr., 2014, 4, 1450018–1450026 CrossRef CAS.
- D. Peng, X. Wang, C. Xu, X. Yao, J. Lin and T. Sun, J. Am. Ceram. Soc., 2013, 96, 184–190 CrossRef CAS.
- X. Wu, P. Xiao, Y. Guo, Q. Zheng and D. Lin, J. Electron. Mater., 2015, 44, 3696–3703 CrossRef CAS.
- P. Xiao, Y. Guo, M. Tian, Q. Zheng, N. Jiang, X. Wu, Z. Xia and D. Lin, Dalton Trans., 2015, 44, 17366–17380 RSC.
- H. Dong, G. Liu, D. Liang, Q. Wei, F. Zhou and X. Li, J. Nanopart. Res., 2013, 15, 1854–1857 CrossRef.
- M. C. S. Reddy, B. A. Rao, M. G. Brik, A. P. Reddy, P. R. Rao, C. K. Jayasankar and N. Veeraiah, Appl. Phys. B, 2012, 108, 455–461 CrossRef CAS.
- L. Li, W. Zi, G. Li, S. Lan, G. Ji, S. Gan, H. Zou and X. Xu, J. Solid State Chem., 2012, 191, 175–180 CrossRef CAS.
- M. Jiao, Y. Jia, W. Lü, W. Lv, Q. Zhao, B. Shao and H. You, Dalton Trans., 2014, 43, 3202–3209 RSC.
- S. H. Byeon, M. G. Ko, J. C. Park and D. K. Kim, Chem. Mater., 2002, 14, 603–608 CrossRef CAS.
- Y. Zhang and J. Hao, J. Mater. Chem. C, 2013, 1, 5607–5618 RSC.
- D. Lin and K. W. Kwok, Int. J. Appl. Ceram. Technol., 2011, 8, 684–690 CrossRef CAS.
- D. Lin, J. Appl. Phys., 2007, 102, 034102–034108 CrossRef.
- C. Wang, J. Wang, L. Zheng, M. Zhao and C. Wang, Mater. Sci. Eng., B, 2010, 171, 79–85 CrossRef CAS.
- C. Wang, S. Zhang, J. Wang, M. Zhao and C. Wang, Mater. Chem. Phys., 2009, 118, 21–24 CrossRef CAS.
- J. Rodriguez-Carvajal, Recent develoements of the program FULLPROF, in CPD newsletters, 2001, vol. 26, p. 12, http://www.ill.eu/sites/fullprof/index.html Search PubMed.
- H. Du, X. Shi and H. Li, Bull. Mater. Sci., 2011, 34, 1201–1207 CrossRef CAS.
- L. Shi, B. Zhang, Q. Liao, L. Zhu, L. Zhao, D. Zhang and D. Guo, Ceram. Int., 2014, 40, 11485–11491 CrossRef CAS.
- S. Kumar, S. Kundu, D. A. Ochoa, J. E. Garcia and K. B. R. Varma, Mater. Chem. Phys., 2012, 136, 680–687 CrossRef CAS.
- H. Lai, A. Bao, Y. Yang, W. Xu, Y. Tao and H. Yang, J. Lumin., 2008, 128, 521–524 CrossRef CAS.
- L. Jing, X. Liu, Y. Li and Y. Wang, J. Lumin., 2015, 162, 185–190 CrossRef CAS.
- H. Yan, F. Inam, G. Viola, H. Ning, H. Zhang, Q. Jiang, T. Zeng, Z. Gao and M. J. Reece, J. Adv. Dielectr., 2011, 1, 107–118 CrossRef CAS.
- X. Wang, J. Wu, X. Cheng, B. Zhang, D. Xiao, J. Zhu, X. Wang and X. Lou, J. Phys. D: Appl. Phys., 2013, 46, 495305–495306 CrossRef.
- C. Xu, D. Lin and K. W. Kwok, Solid State Sci., 2008, 10, 934–940 CrossRef CAS.
- W. Lin, L. Fan, D. Lin, Q. Zheng, X. Fan and H. Sun, Curr. Appl. Phys., 2013, 13, 159–164 CrossRef.
- P. Shi, Z. Xia, M. S. Molokeev and V. V. Atuchin, Dalton Trans., 2014, 43, 9669–9676 RSC.
- G. Lee, J. Y. Han, W. B. Im, S. H. Cheong and D. Y. Jeon, Inorg. Chem., 2012, 51, 10688–10694 CrossRef CAS PubMed.
|
| This journal is © The Royal Society of Chemistry 2016 |
Click here to see how this site uses Cookies. View our privacy policy here.