
Titanium aminophosphates: synthesis, characterization and orange G dye degradation studies
Anumula Rajinia,
Muralasetti Nookarajub,
Suman Chirraa,
Ajay Kumar Adepua and
Narayanan Venkatathri*a
aDepartment of Chemistry, National Institute of Technology, Warangal 506 004, Telangana, India. E-mail: venkatathrin@yahoo.com; Tel: +91-9491319976
bDepartment of Chemistry, Anil Neerukonda Institute of Technology and Sciences, Vishakapatnam – 531162, Andhra Pradesh
First published on 5th November 2015
Abstract
Titanium aminophosphates are prepared using titanium tetraisopropoxide, orthophosphoric acid and aliphatic amines. The synthesized TNPAP, TNOAP and TNDDAP titanium aminophosphates are characterized using various physicochemical techniques. The catalytic activity of TNPAP, TNOAP and TNDDAP is studied for the degradation of orange G dye. TNDDAP is found to be most effective catalyst. The optimum conditions required for efficient orange G degradation are found to be pH = 3.0, [H2O2] = 1.0 × 10⁻³ M, [OG] = 1.0 × 10⁻⁴ M and a TNDDAP catalyst dosage of 150 mg. TNDDAP efficiently catalyzes the degradation of orange G dye with 97.3% degradation after 250 min. These catalysts exhibit good reusability over five successive cycles. They have potential to be used as economical catalysts for dye degradation for industrial waste waters.
Introduction
Organic dyes are major pollutants released into water systems during their manufacturing and processing at industrial sites. These compounds are highly coloured and cause serious problems in the aquatic environment as they affect photosynthetic activity by reducing light penetration. Their presence in low concentrations such as 1 mg L−1 in effluent is considered to be undesirable and needs to be removed before the wastewater can be discharged into the environment.1 In addition, their presence in drinking water constitutes a potential human health hazard. They are difficult to degrade due to their complex structure which makes them mutagenic and carcinogenic. Thus, efficient colour removal from wastewater involving physical, chemical and biological methods has attracted the interest of environmentalists and researchers. The majority of the dyes consumed on an industrial scale have azo, anthraquinone, triphenylmethane, phthalocyanine, formazin or oxazine functional groups.2 These dyes are used extensively in textile industries owing to their brilliant colour, high wet fastness, easy application and minimum requirement for energy during the process.Specifically, azo dyes are non-degradable, carcinogenic, teratogenic and toxic.3 Approximately 50–70% of the commercially available dyes are azo compounds.4 They are very important pollutants; even at low concentrations they can affect water sources by imparting undesirable colour which reduces the light penetration through the water column.5 Therefore, studies on the decolourisation and detoxification of azo dye effluents have received increasing attention. Orange G (Fig. 1) is a synthetic azo dye used in histology in many staining formulations.
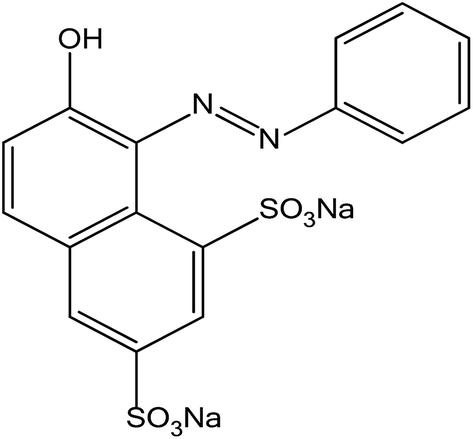 | ||
| Fig. 1 Structure of orange G dye. | ||
Synthetic dyes are recalcitrant to removal by conventional wastewater treatment technologies such as adsorption, photodegradation,6–13 coagulation, flocculation, chemical oxidation, electrochemical oxidation and biological process. The available physical and chemical treatment methods have limited use and are operationally expensive. Research efforts are needed to develop powerful techniques for the removal of azo dyes from aqueous medium to avoid their accumulation. Hence there is a need for efficient water treatment technologies to degrade hazardous contaminants present in effluents and make water resources both safe and potable for human consumption.
Phosphate based materials are important in several industrial acid catalysed reactions.14 In recent years inorganic phosphorous containing materials have received much attention on account of their ability to selectively uptake specific ions, their resistance to oxidation, and their high thermal and chemical stability. In addition, the presence of phosphate in materials seems to enhance the catalytic properties, stabilize the surface area and crystal phase, improve surface acidity and make the material porous.15 Research on phosphate based materials with open frameworks is currently in progress due to their applications in catalysis and gas separation.16 The study of transition metal phosphates has received great attention in recent years. Phosphate frameworks stabilize lower oxidation states, due to their high charge (PO43−), and hence favour the formation of anionic frameworks with a high degree of chemical, mechanical and thermal stability.
Aminophosphates are amine and phosphorous based materials.17 The organic functionality in an aminophosphate framework enhances the hydrophobicity and shows high activity in base catalysed reactions. The incorporation of transition metals such as titanium, vanadium or palladium into aminophosphates leads to novel materials with redox properties. In particular, the titanium cation Ti4+ in framework positions is found to exhibit good activity in shape selective redox reactions. This manuscript deals with the synthesis and characterization of a group of titanium aminophosphates. Owing to the presence of titanium that provides a redox site, the Bronsted acid sites, Lewis acid sites, and Lewis base nitrogen donor alkyl groups in the titanium aminophosphates, the materials are expected to have peculiar catalytic properties. The titanium aminophosphates are investigated for their catalytic application towards the degradation of orange G dye at room temperature using hydrogen peroxide as an oxidant.
Experimental
Synthesis of the titanium aminophosphates was carried out at room temperature. In a typical synthesis, n-propyl amine (10.9 mL), n-octyl amine (22.0 mL) or n-dodecyl amine (30.6 mL) was added to 0.05 mL of titanium tetraisopropoxide and was stirred. To this mixture, 1.87 mL of orthophosphoric acid was added and stirred vigorously to yield solid products (0.02 TiO2![[thin space (1/6-em)]](https://www.rsc.org/images/entities/char_2009.gif) :P2O5:8 RNH2). The products thus obtained were thoroughly washed with ether, dried at 40 °C for about 30 min and ground to a fine powder to obtain the respective titanium aminophosphates.
:P2O5:8 RNH2). The products thus obtained were thoroughly washed with ether, dried at 40 °C for about 30 min and ground to a fine powder to obtain the respective titanium aminophosphates.
Qualitative phase analysis of the titanium aminophosphates was performed using a Bruker AXS D8 Advance diffractometer at room temperature with a Cu-Kα X-ray source of wavelength 1.5406 Å using a Si (Li) PSD detector. The morphology and surface elemental composition of the material was investigated using scanning electron microscopy (SEM/EDAX) on a JEOL Model JSM-6390LV. Fourier transform infrared spectroscopy (FT-IR) was carried out using a Thermo Nicolet, Avatar 370 spectrophotometer equipped with a pyroelectric detector (DTGS type); a resolution of 4 cm−1 was adopted with a KBr beam splitter. Dispersive Raman spectroscopy was performed on a Bruker senterra at a wavelength of 532 nm using a laser radiation source. The co-ordination and oxidation state of the titanium was examined using diffuse reflectance UV-visible spectroscopy (UV-Vis DRS) on a Varian, Cary 5000 in the wavelength range of 175–800 nm. X-ray photoelectron spectroscopic analysis was carried out using an ESCA-3000 (VG Scientific, UK) instrument. 31P magic-angle spinning (MAS) nuclear magnetic resonance (NMR) spectroscopy was performed at room temperature on a Bruker DRX-500 AV-III 500(S) spectrometer, with a spinning rate of 10–12 KHz operating at 121.49 MHz using a 5 mm dual probe. 13C cross polarization magic-angle spinning (CP-MAS) nuclear magnetic resonance (NMR) spectroscopy was performed at room temperature on a DSX-300 Avance-III 400(L) NMR spectrometer with a spinning rate of 10–12 KHz operating at 75.47 MHz using a 5 mm dual probe.
Degradation of the orange G dye (Fig. 1) using hydrogen peroxide as an oxidant in the presence of the titanium aminophosphates was studied at room temperature. A stock solution of dye with a concentration of 1 × 10⁻³ M was prepared and solutions of the desired concentrations were obtained by successive dilution of the stock solution. The degradation was studied using a UV-visible spectrophotometer by measuring the decrease in absorbance of the dye solution with respect to time at the λmax of the dye, 476 nm for orange G. The effect of the pH, concentration of the dye, concentration of the oxidant H2O2 and amount of catalyst on the degradation was studied. All the studies were carried out at room temperature.
Results and discussion
The powder X-ray diffraction patterns of titanium n-propylamino phosphate (TNPAP), titanium n-octylaminophosphate (TNOAP) and titanium n-dodecylaminophosphate (TNDDAP) are shown in Fig. 2. TNPAP exhibits peaks at 2θ degrees of 22.9°, 24.1°, 26.1°, 27.9° and 30.7°, which indicates the presence of a –Ti–O– linkage.18 Similarly, the X-ray diffraction patterns of TNOAP and TNDDAP show peaks at 2θ degrees of 5.6°, 8.2°, 8.3°, 13.7° and 19.7°, corresponding to the presence of –Ti–O– with a mesoporous structure.18–20 TNOAP and TNDDAP exhibit low angle diffraction peaks at 4.1° and 4.2°, respectively, characteristic of a mesoporous structure. | ||
| Fig. 2 Powder XRD patterns of (a) TNPAP, (b) TNOAP and (c) TNDDAP. | ||
The SEM-EDAX images of TNPAP, TNOAP and TNDDAP are shown in Fig. 3. The SEM images of TNPAP and TNOAP reveal that the materials possess micron sized irregular flakes throughout the surface of the materials. The SEM image of TNDDAP shows that the material has a tubular like morphology. The EDAX analysis of TNPAP, TNOAP and TNDDAP showed the distribution of the constituent elements O, C, P, N and Ti.
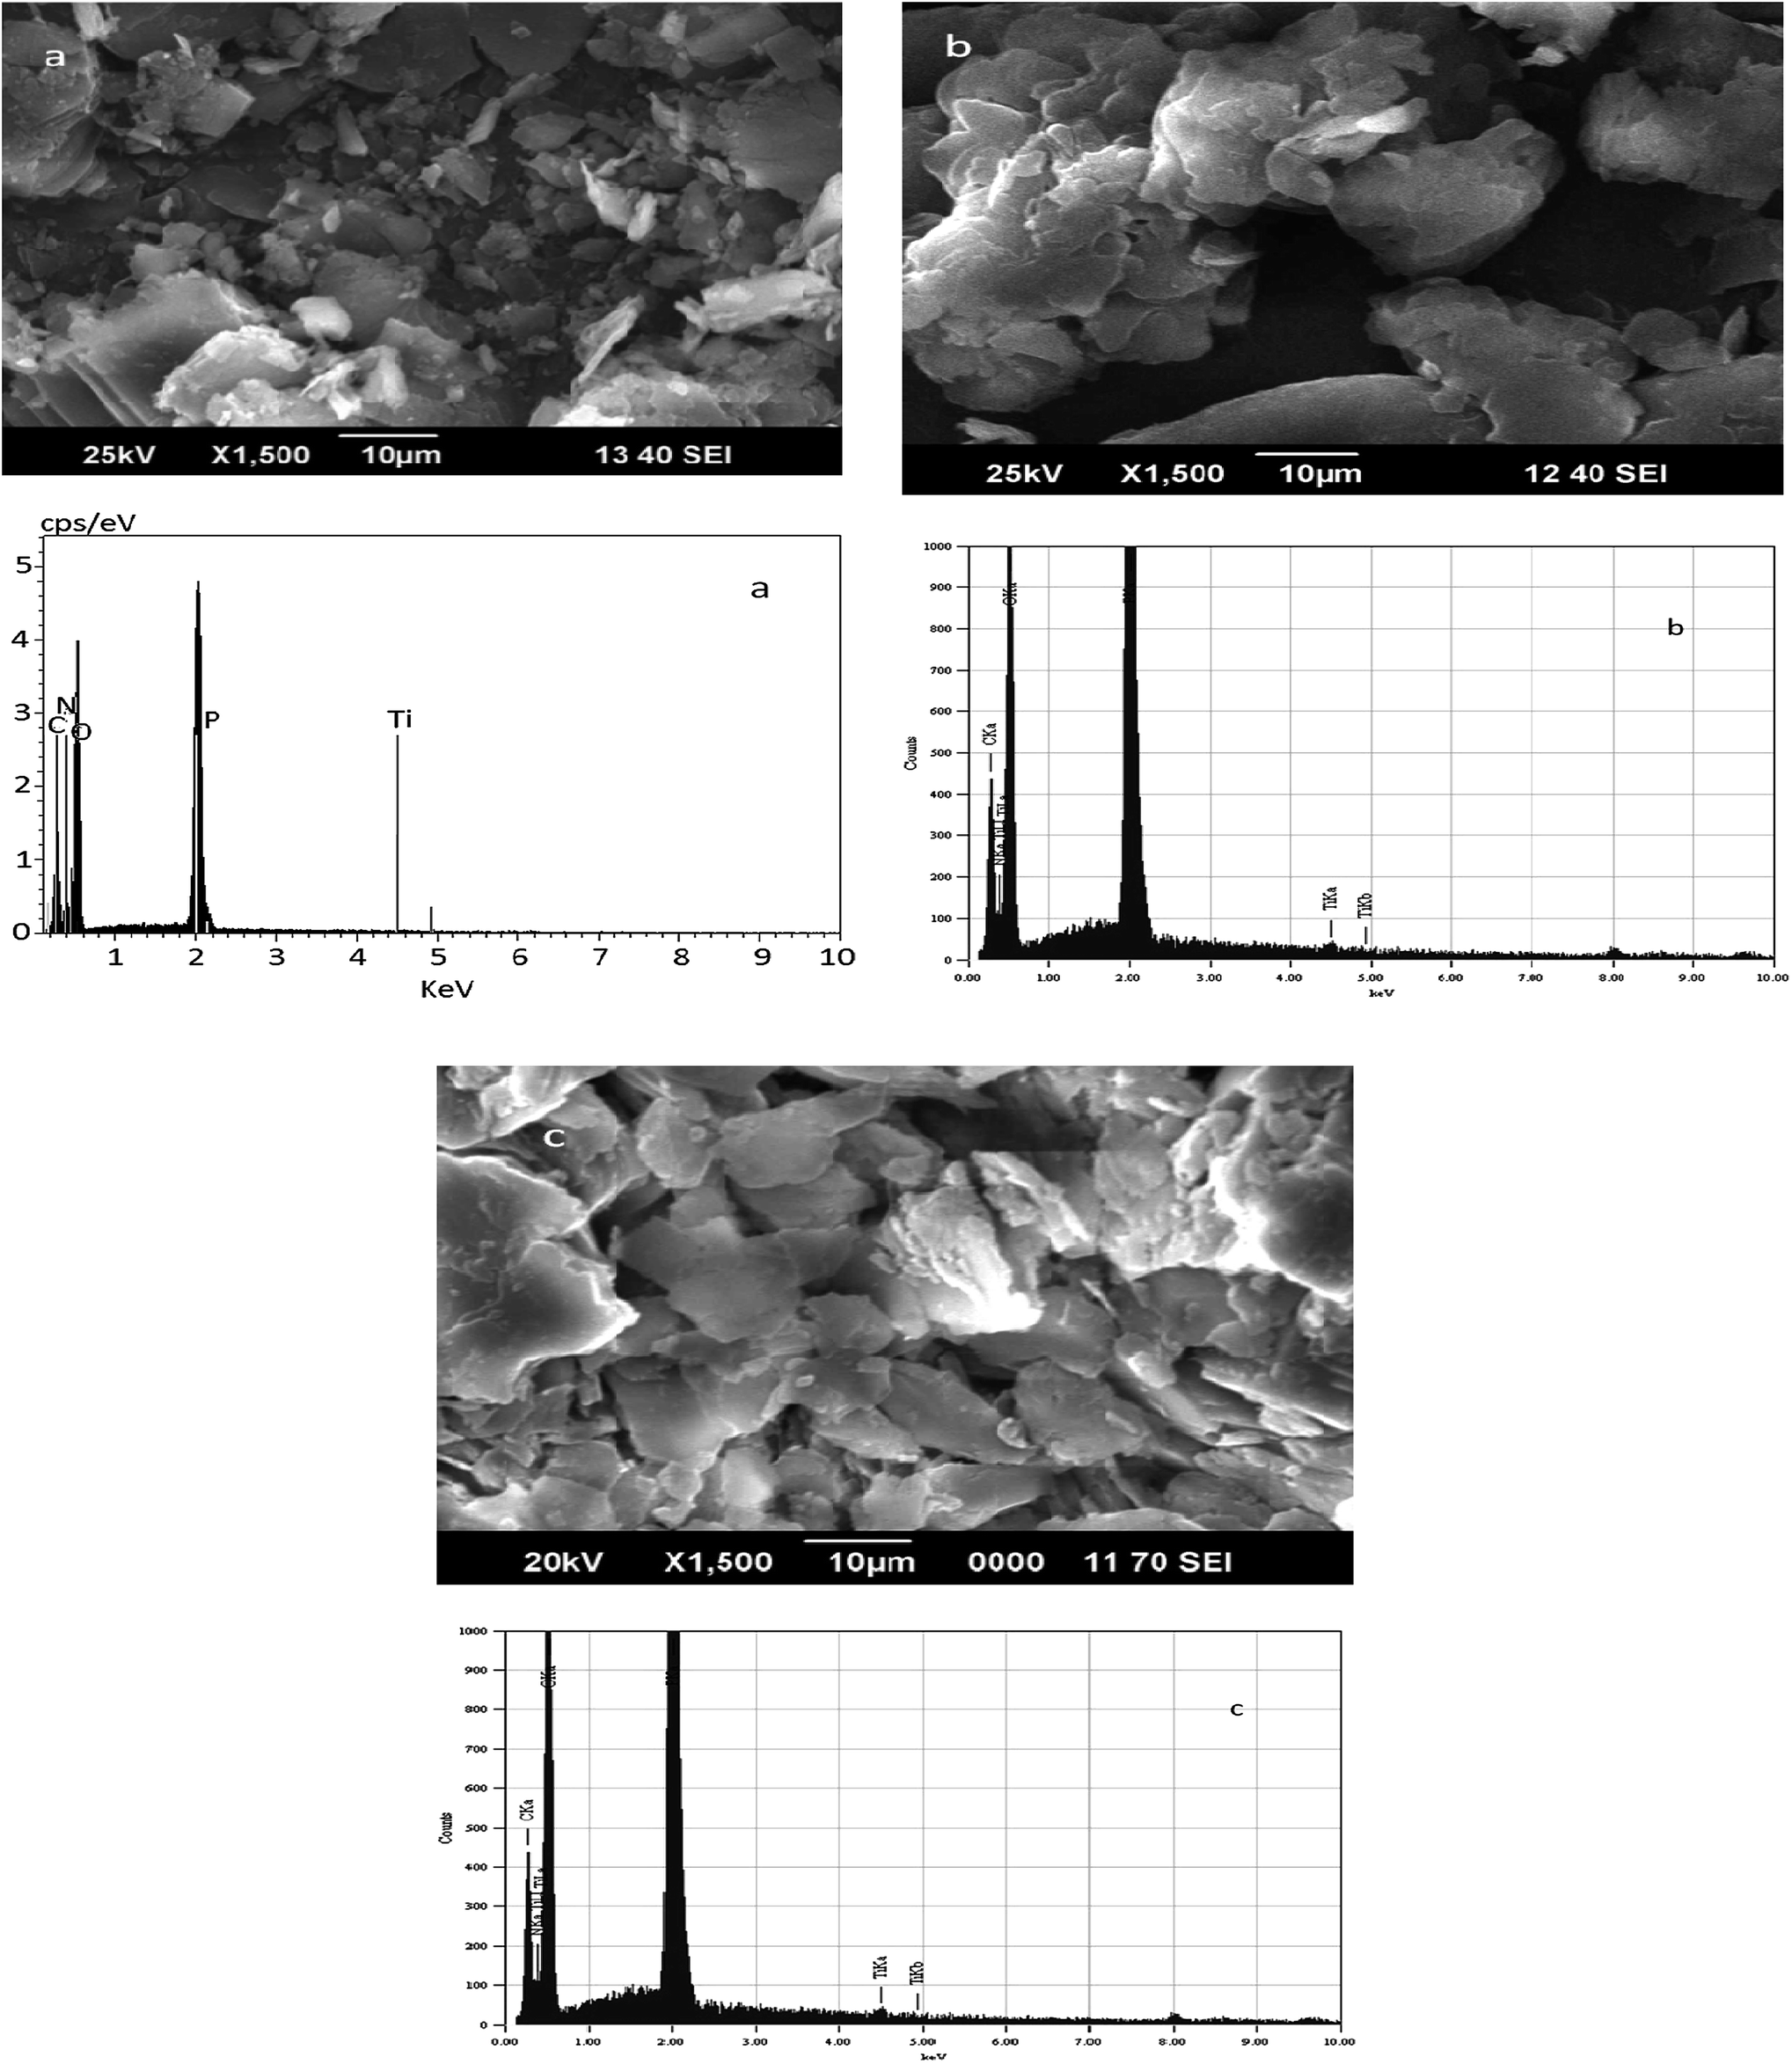 | ||
| Fig. 3 SEM-EDAX images of (a) TNPAP, (b) TNOAP and (c) TNDDAP. | ||
TG/DTA of TNPAP, TNOAP and TNDDAP showed that the thermogravimetric analysis results exhibit a continuous weight loss up to 400 °C. This may be due to the removal of polymerized molecules. Thereafter, the weight remains constant, which indicates the decomposition, combustion and crystallization of organic material present in the titanium aminophosphates. The DTA showed exothermic peaks for the oxidative decomposition of organic amine species and endothermic peaks which are due to the dehydration and evaporation of a part of the organic component.
BET surface area analysis of the titanium aminophosphates revealed values of 50, 71 and 112 m2 g−1 for TNPAP, TNOAP and TNDDAP respectively (Table 1 & Fig. 4). The lesser surface area compared to that reported for zeolites is due to blockage of the pores by alkyl groups present in the amines.
| S. no. | Catalyst | Surface area (m2 g−1) | Pore volume (cm3 g−1) | Pore size (Å) | Horvath–Kawazoe pore width (Å) |
|---|---|---|---|---|---|
| 1 | TNDDAP | 112 | 0.55 | 239 | 301 |
| 2 | TNOAP | 71 | 0.51 | 178 | 231 |
| 3 | TNPAP | 50 | 0.32 | 138 | 198 |
 | ||
| Fig. 4 BET adsorption isotherm of (A) TNDDAP, (B) TNOAP and (C) TNPAP. | ||
The FT-IR spectra of TNPAP, TNOAP and TNDDAP show a broad absorption band at 3420 cm−1, which corresponds to O–H or N–H stretching vibrations for TNPAP. The peaks in the range of 3020–2850 cm−1 correspond to alkyl symmetrical and asymmetrical stretching vibrations of the amine groups in the titanium aminophosphates.21 The peaks in the range of 1640–1630 cm−1 are attributed to O–H bending vibrations of adsorbed water in the titanium aminophosphates. The peaks observed at 1469 and 1467 cm−1 are due to asymmetric deformation vibrations of the alkyl groups in TNOAP and TNDDAP.22 The bands at 1079 and 1085 cm−1 for TNOAP and TNDDAP are attributed to P–O stretching vibrations.23,24 The bands at 1038 and 1034 cm−1 for TNPAP and TNOAP are due to Ti–O–P stretching vibrations. The bands around 980 cm−1 are attributed to the vibrational frequencies of the P–O groups in the titanium aminophosphates.33 The peaks at 1240 and 1222 cm−1 for TNOAP and TNDDAP correspond to a characteristic absorbance of C–N bonds.25 The peaks at 887 and 892 cm−1 for TNOAP and TNDDAP are due to asymmetric stretching vibrations of P–O–P groups. The peaks at 759 and 758 cm−1 for TNPAP and TNOAP are attributed to non-bridging Ti–O bond vibrations.26,27 The peaks at about 725 and 723 cm−1 for TNOAP and TNDDAP are assigned to symmetric stretching vibrations of P–O–P groups. The peaks in the range of 700–400 cm−1 are attributed Ti–O and Ti–O–Ti vibrations in the titanium aminophosphates. The peaks at 538, 492, 530 and 540 cm−1 for the titanium aminophosphates are attributed to P–O bending vibrations.28,29
The Raman spectra of TNPAP, TNOAP and TNDDAP show small peaks at 568 cm−1 and 939 cm−1 for TNPAP that correspond to a stretching vibration of Ti–O bonds.30,31 The band at 1200 cm−1 for TNPAP is associated with an asymmetric stretching vibration of the P–O bond of phosphate groups.32 The weak intensity of the peaks for the other catalysts is due to the presence of a low density of titanium.
The UV-visible diffuse reflectance spectra of TNPAP, TNOAP and TNDDAP show peaks around 215 nm due to charge transfer transitions between empty 3d-orbitals of Ti(IV) cations and 2p-orbitals of oxygen anions (O2−). The charge transfer transitions infer the presence of titanium in tetrahedral co-ordination. TNPAP, TNOAP and TNDDAP show peaks at 343, 330 and 325 nm respectively. These peaks can be attributed to the existence of titanium in tetrahedral co-ordination.
The X-ray photoelectron spectroscopy (XPS) spectra of the carbon, oxygen, nitrogen, phosphorous and titanium ions (TNPAP) show that a carbon 1s peak occurs at 288.0 eV. This can be attributed to carbon bonded to oxygen, nitrogen and hydrogen respectively.33 The peak around 534.0 eV corresponds to an oxygen 1s binding energy. This peak is due to chemisorbed water and weakly adsorbed oxygen molecules on the surface. The binding energies of 534.2 eV and 532.4 eV are ascribed to oxygen and co-contributed by Ti–O and P–O.34 The peaks at 462 and 468 eV correspond to the binding energies of Ti 2p3/2 and 2p1/2 electrons, which are due to nitrogen being doped interstitially into the titania matrix.31 The higher binding energy value of titanium is due to different electronic interactions with nitrogen compared to oxygen. This suggests considerable modification of the lattice due to N substitution. Titanium binds to nitrogen or oxygen atoms in the lattice to form O–Ti–N or Ti–N–O.35 The P 2p peak occurs at 136.0 eV, corresponding to the presence of phosphorous oxide (P2O5) in the TNPAP.
The 31P MAS-NMR spectra of TNPAP, TNOAP and TNDDAP show peaks at 4.654 ppm and −0.73 ppm with side bands for TNPAP. The peaks are in a 1:3 intensity ratio and suggest the existence of two crystallographically non-equivalent phosphorous atoms. The 31P MAS-NMR spectra of TNOAP and TNDDAP show peaks at 5.824 and 1.924 ppm, respectively. The presence of only one peak in the TNOAP and TNDDAP spectra indicates that the phosphorous atoms are present in a unique chemical environment. The 31P peaks in the range of −5 to 3 ppm correspond to the presence of a mesoporous crystalline titanium aminophosphate framework.36
The 13C MAS-NMR spectra of TNPAP, TNOAP and TNDDAP are shown in Fig. 5. They show peaks at 41.12 and 39.80 ppm, which correspond to C1, the carbon bonded to the nitrogen atom of the amine group. The peaks at 34.46 and 32.12 ppm for TNOAP can be assigned to the C2 and C3 carbons linked to the C1 carbon which is directly attached to the nitrogen of the amine group. The peak at 21.47 ppm for TNPAP can be assigned to the carbon of the methylene (–CH2–) group. The peaks at 29.93, 28.37 and 24.49 ppm for TNOAP can be assigned to the carbon atoms of the methylene (–CH2–) groups. The peaks at 12.30 and 14.98 ppm for TNPAP and TNOAP can be attributed to the carbon of the terminal –CH3 group of the amine molecules.22,37 Fig. 5c shows the characteristic peaks of dodecylamine carbon atoms.
 | ||
| Fig. 5 13C MAS-NMR spectra of (a) TNPAP, (b) TNOAP and (c) TNDDAP. | ||
Based on the above characterization, we have proposed a plausible mechanism for titanium aminophosphate synthesis and a basic structure for the catalysts (Fig. 6). It is a tetrafunctional catalyst due to the presence of the titanium ion (redox, Lewis acid), amine (Lewis base) and exchangeable proton (Bronsted acid) sites. As the reaction was carried out under solvent free conditions, there was no residue from the synthesis of the catalyst (100% yield was obtained). So all the inputted titanium and amine species are present in the basic structure. The presence of solid acid sites was deduced from the proposed structure, and is confirmed using a NaCl ion exchange experiment.
 | ||
| Fig. 6 Schematic synthesis mechanism and proposed basic structure of the titanium aminophosphates. | ||
In order to test the generality of the titanium aminophosphates as catalysts for dye degradation purposes, the degradation of orange G dye was studied. The % degradation of orange G was evaluated by measuring the decrease in the absorbance of an orange G solution with respect to time at 476 nm, the λmax of orange G.
The effect of pH on the degradation of orange G by hydrogen peroxide in the presence of the titanium aminophosphate catalysts has been studied at room temperature in the pH range of 2.0 to 7.0 at an orange G dye concentration of 1.0 × 10⁻³ M and catalyst dosage of 150 mg. The degradation of orange G was found to increase with the increase of the pH from 2.0 to 3.0 in the presence of all three titanium aminophosphate catalysts (Table 2). A further increase in the pH from 3.0 to 7.0 did not affect the percentage degradation. These results indicate that the degradation of orange G was significantly influenced by the pH of the solution and the maximum degradation of orange G dye was found to be at pH 3.0. Hence, pH 3.0 was chosen as the optimum for orange G dye degradation at room temperature.
| pH | % degradation | ||
|---|---|---|---|
| TNPAP | TNOAP | TNDDAP | |
| 2.0 | 43.8 | 47.9 | 72.6 |
| 3.0 | 71.9 | 77.1 | 97.3 |
| 4.0 | 57.1 | 67.3 | 96.4 |
| 5.0 | 56.2 | 65.4 | 95.1 |
| 6.0 | 56.4 | 64.1 | 94.2 |
| 7.0 | 55.7 | 63.8 | 92.8 |
The effect of varying the concentration of hydrogen peroxide on the orange G dye degradation was investigated at room temperature for a range of 0.1 × 10⁻³ M to 2.0 × 10⁻³ M H2O2. The degradation of the orange G dye increased up to a H2O2 concentration of 1.0 × 10⁻³ M and further increase of the concentration did not have an appreciable effect on the degradation (Table 3). The increase in the degradation with the increase in H2O2 concentration, up to 1.0 × 10⁻³ M, has the basis of the availability of more peroxy radicals for the attack on adsorbed orange G. The further increase in H2O2 concentration may not have contributed to the increase in O–O˙ radicals due to a scavenging effect. The % degradation of orange G was found to be maximal at a 1.0 × 10⁻³ M concentration of H2O2 after a period of 250 min, with a % degradation of 97.1. Consequently all the other experiments concerning the degradation were carried out using a 1.0 × 10⁻³ M concentration of H2O2.
| [H2O2] × 10−3 M | % degradation | ||
|---|---|---|---|
| TNPAP | TNOAP | TNDDAP | |
| 0.1 | 26.8 | 38.9 | 38.7 |
| 0.2 | 42.2 | 47.1 | 42.9 |
| 0.5 | 53.7 | 58.2 | 54.4 |
| 0.75 | 61.5 | 68.6 | 78.3 |
| 1.00 | 71.9 | 77.1 | 97.3 |
| 1.50 | 70.8 | 76.5 | 96.4 |
| 2.00 | 69.1 | 75.7 | 95.8 |
The effect of the amount of catalyst on the degradation of orange G was studied by varying the amount of catalyst from 25 mg to 200 mg at pH 3.0 and keeping the concentrations of H2O2 & orange G constant. It was observed that the percentage degradation of orange G increased from 39.8 to 97.3 with an increase in the amount of TNDDAP catalyst from 25 mg to 150 mg (Table 4). The further increase in the amount of catalyst did not show much influence on the % degradation. Hence, 150 mg of TNDDAP was chosen as the optimum dosage at which to carry out all the other investigations.
| Catalyst dosage (mg) | % degradation | ||
|---|---|---|---|
| TNPAP | TNOAP | TNDDAP | |
| 0 | 13.9 | 13.9 | 13.9 |
| 25 | 28.2 | 31.7 | 39.8 |
| 50 | 34.1 | 36.4 | 45.4 |
| 75 | 46.5 | 41.3 | 49.6 |
| 100 | 53.3 | 57.4 | 74.8 |
| 150 | 71.9 | 77.1 | 97.3 |
| 175 | 70.2 | 76.9 | 96.1 |
| 200 | 69.3 | 76.1 | 95.2 |
The degradation of orange G was studied in the presence of the TNDDAP catalyst by varying the concentration of orange G in the range of 1.0 × 10⁻³ M to 4.0 × 10⁻³ M at pH 3.0, and with a H2O2 concentration of 1.0 × 10⁻³ M and TNDDAP dosage of 150 mg. The % degradation of orange G at the different initial concentrations of orange G is shown in Table 5. The conversion did not vary considerably with the change in orange G concentration for this concentration range.
| S. no | [OG] × 10−3 M | % degradation |
|---|---|---|
| 1 | 1.0 | 97.3 |
| 2 | 2.0 | 97.0 |
| 3 | 3.0 | 96.7 |
| 4 | 4.0 | 96.3 |
From the above studies, it can be concluded that titanium aminophosphates are efficient catalysts for the degradation of orange G with H2O2 as the oxidant. Among the catalysts studied, TNDDAP was found to be more effective. We have also established the optimum conditions for efficient degradation of orange G. The effect of various titanium aminophosphate catalysts on the degradation of the orange G dye was investigated using a catalyst dosage of 150 mg, pH of 3.0 and H2O2 concentration of 1.0 × 10⁻³ M. It was observed that the degradation of orange G proceeds much more rapidly in the presence of TNDDAP compared to TNOAP and TNPAP. The increased catalytic activity of TNDDAP is attributed to the enhanced pore size and adsorption due to the bulkier dodecyl group than for TNPAP and TNOAP. The percentage degradation was found to be 97.3% for TNDDAP whereas it was 77% for TNOAP and 71% for TNPAP after 250 min. The higher adsorption can be related to a higher affinity of the dye for the surface, which is affiliated with a higher number of active centres on the catalyst’s surface. Surface nitrogen is also important for the basic catalytic activity of these materials. Studies on the reusability (Fig. 7) of the catalyst for the degradation of orange G were carried out using TNDDAP, the most efficient among the catalysts studied. The catalyst was separated by centrifugation after the maximum % of dye was degraded. It was thoroughly washed with water and then with ethanol. The recovered catalyst was reused in the next cycle under the optimum reaction conditions. It was observed that TNDDAP effectively catalyzes the degradation of orange G, without much loss of its activity, for at least five successive runs (Table 6).
 | ||
| Fig. 7 Scanning electron microscopy picture/powder X-ray diffraction pattern of (A) titanium dodecylaminophosphate, (B) water treated (2 h) titanium dodecylaminophosphate, (C) H2O2/H2O (1:1) treated (2 h) titanium dodecylaminophosphate, and (D) H2O2/H2O/orange G dye (1:1:1) treated (2 h) titanium dodecylaminophosphate. | ||
| Catalyst | Fresh | Recycled 1 | Recycled 2 | Recycled 3 | Recycled 4 | Recycled 5 |
|---|---|---|---|---|---|---|
| % degradation | 97.3 | 96.8 | 95.7 | 95.0 | 94.9 | 94.9 |
The results presented above reveal that titanium aminophosphates act as efficient catalysts for the degradation of orange G dyes. The catalytic effect can be due to the tetrahedral co-ordination geometry of the titanium ion in the framework. Tetrahedrally co-ordinated metal ions in the framework, being unsaturated, will activate oxidant species and create desirable transition states in the vicinity of active centres for subsequent activation of the substrates. On the other hand, six co-ordinate metal species have not been found to be as effective as four co-ordinate analogues as they are co-ordinatively saturated. As a result, interaction of the oxidant with the catalyst is retarded making the system comparatively inactive.38 TNDDAP is more effective in the case of orange G degradation, indicating a specificity of the catalysts. This observation can be partly rationalized on the basis of the structural features of orange G (azo dye) which influence the binding forces between the dye molecules and the titanium aminophosphate frameworks.39 In the orange G dye, the azo bonds are more labile. The degradation of orange G may occur due to initial electrophilic cleavage of the chromophoric azo group (–N![[double bond, length as m-dash]](https://www.rsc.org/images/entities/char_e001.gif) N–) by the reaction of peroxy radicals, and the generation of nitrosoaryl intermediates or C–N bonds resulting in aniline as one of the intermediate products.
N–) by the reaction of peroxy radicals, and the generation of nitrosoaryl intermediates or C–N bonds resulting in aniline as one of the intermediate products.
Conclusions
Titanium aminophosphates were prepared by using titanium tetraisopropoxide, orthophosphoric acid and aliphatic amines. The synthesized TNPAP, TNOAP and TNDDAP titanium aminophosphates were characterized using various physicochemical techniques. Powder XRD patterns of the titanium aminophosphates suggest the presence of a –Ti–O– phase. The % of titanium incorporated into the frameworks of the titanium aminophosphates was confirmed from an EDAX analysis. The infrared and Raman spectra show the presence of peaks due to vibrational bands of the Ti–O, P–O and Ti–O–P linkages. The UV-Vis diffuse reflectance spectra reveal the presence of a tetrahedral co-ordination of Ti in the framework. The XPS spectra suggest the presence of –O–Ti–N– or –Ti–N–O– frameworks in TNPAP. The 31P MAS-NMR spectra of the titanium aminophosphates indicate the presence of a crystalline titanium aminophosphate framework. The catalytic activity of TNPAP, TNOAP and TNDDAP were studied for the degradation of orange G dyes. TNDDAP was most effective in the case of orange G dye degradation, indicating a specificity of the catalysts. The optimum conditions for efficient degradation of orange G were found to be pH = 3.0, [H2O2] = 1.0 × 10⁻³ M, [OG] = 1.0 × 10⁻³ M and a TNDDAP catalyst dosage of 150 mg. TNDDAP efficiently catalyzed the degradation of the orange G dye with 97.3% degradation after 250 min. These catalysts exhibited a good reusability over five successive cycles. They have potential to be used as economical catalysts for dye degradation for industrial waste waters.Acknowledgements
The authors are thankful to MHRD, New Delhi for a fellowship.References
- P. C. Vandevivere, R. Bianchi and W. Verstraete, J. Chem. Technol. Biotechnol., 1998, 72, 289 CrossRef CAS.
- D. Karadag, S. Tok, E. Akgul, K. Ulucan, H. Evden and M. A. Kaya, Ind. Eng. Chem. Res., 2006, 45, 3969 CrossRef CAS.
- M. Stylidi, D. I. Kondarides and X. E. Verykios, Appl. Catal., B, 2003, 40, 271 CrossRef CAS.
- C. Bauer, P. Jacques and A. Kalt, J. Photochem. Photobiol., A, 2001, 140, 87 CrossRef CAS.
- W. Huang, Y. Ji, Z. Yang, X. Feng, C. Liu, Y. Zhu and X. Lu, Ind. Eng. Chem. Res., 2010, 49, 6243 CrossRef CAS.
- L. Ren, Y. Li, J. Hou, X. Zhao and C. Pan, ACS Appl. Mater. Interfaces, 2014, 6, 1608 CAS.
- Y. Zhang, Z. Tang, X. Fu and Y.-J. Xu, ACS Nano, 2010, 4, 7303 CrossRef CAS PubMed.
- N. Zhang, M. Yang, S. Liu, Y. Sun and Y.-J. Xu, Chem. Rev., 2015, 115, 10307 CrossRef CAS PubMed.
- S. Liu, Z. Tang, Y. Sun, J. Colmenares and Y.-J. Xu, Chem. Soc. Rev., 2015, 44, 5053 RSC.
- W. Xie, Y. Li, W. Sun, J. Huang, H. Xie and X. Zhao, J. Photochem. Photobiol., A, 2010, 216, 149 CrossRef CAS.
- H. Xie, Y. Li, S. Jin, J. Han and X. Zhao, J. Phys. Chem. C, 2010, 114, 9706 CAS.
- Y. Li, H. Zhang, Z. Guo, J. Han, X. Zhao, Q. Zhao and S. Kim, Langmuir, 2008, 24, 8351 CrossRef CAS PubMed.
- Y. Li, W. Xie, X. Hu, G. Shen, X. Zhou, Y. Xiang and X. Zhao, Langmuir, 2010, 26, 591 CrossRef CAS PubMed.
- S. K. Samantaray, T. Mishra and K. M. Parida, J. Mol. Catal. A: Chem., 2000, 156, 267 CrossRef CAS.
- S. K. Samantaray and K. M. Parida, J. Mol. Catal. A: Chem., 2001, 176, 151 CrossRef CAS.
- A. K. Cheetham, G. Ferey and T. Loiseau, Angew. Chem., Int. Ed. Engl., 1999, 38, 3268 CrossRef CAS.
- C. Berlini, M. Guidotti, G. Moretti, R. Psaro and N. Ravasio, Catal. Today, 2000, 60, 219 CrossRef CAS.
- K. Khosravi, M. E. Hoque, B. Dimock, H. Hintelmann and C. D. Metcalfe, Anal. Chim. Acta, 2012, 713, 86 CrossRef CAS PubMed.
- D. M. Antonelli and J. Y. Ying, Angew. Chem., Int. Ed. Engl., 1995, 34, 2014 CrossRef CAS.
- A. R. Khataee and M. B. Kasiri, J. Mol. Catal. A: Chem., 2010, 328, 8 CrossRef CAS.
- M. Nagao and Y. Suda, Langmuir, 1989, 5, 42 CrossRef CAS.
- L. Zhang, J. Xu, G. Hou, H. Tang and F. Deng, J. Colloid Interface Sci., 2007, 311, 38 CrossRef CAS PubMed.
- K. M. Parida, M. Acharya, S. K. Samantaray and T. Mishra, J. Colloid Interface Sci., 1999, 217, 388 CrossRef CAS PubMed.
- S. F. Lincoln and D. R. Stranks, Aust. J. Chem., 1968, 21, 37 CrossRef CAS.
- X. A. Zhao, C. W. Ong, Y. C. Tsang, Y. W. Wong, P. W. Chan and C. L. Choy, Appl. Phys. Lett., 1995, 66, 2652 CrossRef CAS.
- S. Sakka, F. Miyaji and K. Fukumi, J. Non-Cryst. Solids, 1989, 112, 64 CrossRef.
- N. G. Chernorukov, I. A. Korshunov and M. I. Zhuk, Russ. J. Inorg. Chem., 1982, 27, 1728 Search PubMed.
- A. Nilchi, M. G. Maragheh, A. Khanchi, M. A. Farajzadeh and A. A. Aghaei, J. Radioanal. Nucl. Chem., 2004, 261, 393 CrossRef CAS.
- B. B. Sahu and K. Parida, J. Colloid Interface Sci., 2002, 248, 221 CrossRef CAS PubMed.
- C. Schmutz, P. Barboux, F. Ribot, F. Taulelle, M. Verdaguer and C. Fernandez-Lorenzo, J. Non-Cryst. Solids, 1994, 170, 250 CrossRef CAS.
- X. Gao and I. E. Wachs, Catal. Today, 1999, 51, 233 CrossRef CAS.
- L. A. Farrow and E. M. Vogel, J. Non-Cryst. Solids, 1992, 143, 59 CrossRef CAS.
- H.-F. Yu and S.-T. Yang, J. Alloys Compd., 2010, 492, 695 CrossRef CAS.
- K. M. Parida and N. Sahu, J. Mol. Catal. A: Chem., 2008, 287, 151 CrossRef CAS.
- C. Di Valentin, E. Finazzi, G. Pacchioni, A. Selloni, S. Livraghi, M. C. Paganini and E. Giamello, Chem. Phys., 2007, 339, 44 CrossRef CAS.
- E. Jaimez, A. Bortun, G. B. Hix, J. R. Garcia, J. Rodrıguez and R. C. T. Slade, J. Chem. Soc., Dalton Trans., 1996, 2285 Search PubMed.
- A. Hayashi, H. Nakayama and M. Tsuhako, Solid State Sci., 2009, 11, 1007 CrossRef CAS.
- R. Raja, R. D. Adams, D. A. Blom, W. C. Pearl Jr, E. Gianotti and J. M. Thomas, Langmuir, 2009, 25, 7200 CrossRef CAS PubMed.
- A. Szegedi, G. P. Borbely, E. Meretei, T. Konya and I. Kiricsi, Stud. Surf. Sci. Catal., 2004, 154, 820 CrossRef.
| This journal is © The Royal Society of Chemistry 2015 |