DOI:
10.1039/C5RA05772H
(Paper)
RSC Adv., 2015,
5, 48619-48625
Mechanism of enhancing the formaldehyde sensing properties of Co3O4 via Ag modification
Received
1st April 2015
, Accepted 15th May 2015
First published on 15th May 2015
Abstract
Hollow Co3O4 hierarchical microspheres assembled from many compact nanowires have been successfully synthesized via a facile hydrothermal method from the precursor Co(CO3)0.5(OH)·0.11H2O followed by annealing treatment. The product has a well-defined morphology, is porous, and has a larger surface area as seen through various analytical characterizations; thus, it can act as a good basis for further modification to improve its gas-sensing properties. The sensing tests indicate that the Ag@Co3O4 composite formed via Ag modification can not only improve the sensing response to formaldehyde by several times that of pure Co3O4, but also reduce the optimum operating temperature of the sensor. Furthermore, the gas-sensing mechanism is also discussed in detail, including the effect of Ag addition on the electronic transfer of the Ag@Co3O4 composite. There are still many challenges in making a formaldehyde sensor with high sensitivity using the cheaper noble metal Ag as modified reagent via a facile synthesis and doping method.
Introduction
Formaldehyde, an important industrial chemical, is a volatile and deleterious compound that can threaten individuals' health by causing central nervous system damage, blood and immune system disorders, as well as bronchospasm, pneumonia and respiratory disease.1 Furthermore, it is widely utilized in many fields, including construction materials, consumer products, pharmacology and medicine, and so on.2 Therefore, many researchers are sparing no effort to study and develop novel sensing materials for the effective monitoring of formaldehyde.3–7 Cobalt oxide (Co3O4) is a compound of CoO and Co2O3 with rich oxygen content and thus exhibits p-type semiconducting properties.8 Up to now, some methods have been utilized to prepare nanocrystalline Co3O4 with different morphologies and nanostructures, and as a functional material, it has been used in many technological areas, such as in heterogeneous catalysis,9 as anode material in lithium rechargeable batteries,10 as solar energy absorber,11 and in magnetism.12 However, the research on its gas-sensing applications to date is relatively limited and still in the early stage of development.13–16 Furthermore, the sensitivity of pure Co3O4 is lower compared with the n-type semiconductors such as SnO2, ZnO, WO3, In2O3, Fe2O3, and TiO2,17–22 and sensing is usually operated at elevated temperatures above 200 °C.23,24 Zhen et al. successfully fabricated a rhombic Co3O4 nanorod array-based gas sensor via a facile fluorine-mediated hydrothermal route, and the Co3O4 nanorods showed high performance in ethanol detection.25 Jinso et al. prepared Co3O4 hollow nanospheres with a diameter of 200–300 nm and a wall thickness of ∼40 nm by a surfactant-assisted solvothermal method, and it was used to monitor flammable and toxic organic gases.26 Sun et al. synthesized nearly monodisperse Co3O4 nanocubes with an average particle size of ∼20 nm by a microwave-assisted solvothermal method, and the product exhibited good gas-sensing performance for xylene and ethanol.27 Therefore, enhancing sensitivity and reducing sensor operating temperature are desirable for practical environmental monitoring. The main aim of this work is to synthesize hollow urchin-like microspheres of Co3O4 using neither catalyst nor template, so that we can take charge of it as a good basis for further modification as a candidate sensing material.23 To the best of our knowledge, modification with noble metal nanoparticles (NPs) is the most efficient and widely applied method.28–31 Some modified methods have been reported, such as Cr-doped Co3O4, Sm-doped Co3O4 nanokernels, Cu2O–Co3O4 core–shell composites and Co3O4-intercalated reduced graphene oxide.32–35 Herein, we selected a facile method to load the inexpensive noble metal Ag NPs on the surface of the Co3O4 microsphere to make an excellent formaldehyde sensor; there are still many challenges to its application.
Experimental
Synthesis of hollow urchin-like Co3O4 hierarchical microspheres and Ag NPs-modified composites
0.58 g Co(NO3)2·6H2O, 0.22 g NH4F, and 0.6 g CO(NH2)2 were dissolved in 70 mL of deionized water. After 30 min of stirring, the resultant homogeneous solution was then transferred to a Teflon-lined autoclave with 100 mL capacity. The autoclave was sealed and heated to 120 °C for 5 h. After it was naturally cooled to ambient temperature, the resulting pink product was collected by centrifugation and washed several times with distilled water. Finally, the as-prepared precursor was dried at 60 °C overnight and then annealed at 400 °C for 2 h in air with a heating rate of 5 °C min−1.
0.026 g Co3O4 was dispersed in 20 mL of deionized water, and then AgNO3 (0.0025 g) and sodium borohydride (NaBH4) solution (0.3 mL, 112 mM) were added in turn and thoroughly mixed for 1 h. Finally, the product was collected by centrifugation and then dried at 60 °C in air. The above experimental process was used to prepare sample 1. Samples 2–5 were prepared in a similar way, but were added different amounts of AgNO3 and NaBH4. AgNO3 (0.003 g) and NaBH4 solution (0.4 mL) were used to prepare sample 2; AgNO3 (0.005 g) and NaBH4 solution (0.6 mL) were used for sample 3; AgNO3 (0.0065 g) and NaBH4 solution (0.8 mL) were used for sample 4; and AgNO3 (0.008 g) and NaBH4 solution (1 mL) were used for sample 5.
Characterization of Co3O4 hierarchical microspheres
X-ray diffraction (XRD) measurements were carried out to investigate the crystallographic properties of the products on a Rigaku D/MAX-2500 X-ray diffractometer with copper Kα radiation (λ = 1.54178 Å). Diffraction patterns were recorded in the angular range of 10–70°. Field emission scanning electron microscopy (FESEM) images were obtained with a Zeiss Supra 55 instrument operated at 20 kV. Elemental compositions of the products were analyzed using an energy dispersive spectrometer (EDS) attached to the FESEM. Adsorption/desorption N2 isotherms were measured on solid samples at 77 K on a Quadra Sorb Station 4 apparatus, from which the Brunauer–Emmett–Teller (BET) surface area was calculated using the multipoint BET method. Thermogravimetric (TG) analysis was carried out in dynamic air atmosphere with a heating rate of 10 °C min−1 using the NETZSCH STA 449 F3 thermal analyzer. X-ray photoelectron spectroscopy (XPS) surface characterizations were performed on a VG ESCALAB-MK electron spectrometer with Al Kα source.
Sensor fabrication and response measurement
The products were mixed with ethanol to form the suspension solution and then pasted twice onto a ceramic tube between two Au electrodes to form a uniform thin film. A resistance heater in the ceramic tube was used to control the temperature by changing the heating voltage. For the Ag@Co3O4 microsphere, the sensor response for formaldehyde is defined as the ratio of the resistance in formaldehyde (Rformaldehyde) to that in air (Rair).
Results and discussion
Structure and morphology
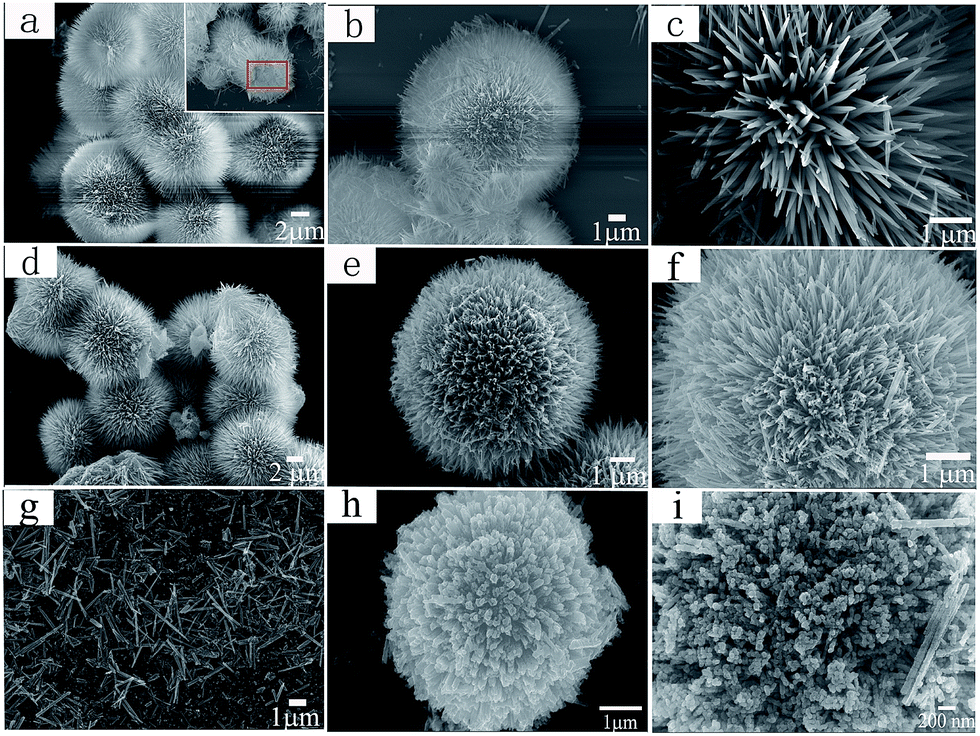
The morphology and structure of the as-prepared precursor and Co3O4 samples were characterized by FESEM with low- and high-magnification. Fig. 1a–c are the FESEM images for the precursor Co(CO3)0.5(OH)·0.11H2O, showing a perfect hierarchical spherical shape with diameter of ∼10 μm, which is assembled by many compacted nanowires with width of ∼200 nm and length of 3–5 μm, and the core of the hierarchical microsphere is hollow. Subsequent thermal treatment was implemented at 400 °C for 2 h at a heating rate of 5 °C min−1 to prevent collapse of spheres during the formation of Co3O4. From Fig. 1d–f, it is clearly seen that the hierarchical spherical shape stays intact after calcination. However, if the precursor was annealed at 500 °C with the same constant time and heating rate, the sphere configuration collapsed completely into nanorods, as shown in Fig. 1g. Fig. 1h and i show SEM images of the Ag@Co3O4 composite with 4.4 wt% Ag content; it can be observed that the Ag@Co3O4 composite is the same as pure Co3O4 in morphology, except that the tips of nanowires assembling into spheres are not as sharp as those of pure Co3O4. From the TEM image of the Co3O4 microsphere (Fig. 2a), we can see that the core of the Co3O4 microsphere is hollow, just as in the SEM image. In Fig. 2b, it is obvious that the microsphere morphology is maintained, but we cannot identify Ag from the Ag@Co3O4 composite. Therefore, the nanowires of the cracked Ag@Co3O4 microsphere were investigated (Fig. 2c); we deduced the darker area represents the existence of Ag. In addition, it is also indicated that the nanowires are composed by countless Co3O4 nanoparticles. Furthermore, a plausible mechanism for the formation of Co3O4 microspheres is proposed as illustrated in Fig. 3. In the continuously proceeding reaction, the initially formed Co(CO3)0.5(OH)·0.11H2O crystallite nucleus coalesces other neighboring crystals to aggregate into a large microsphere, leading to reduction of the system surface energy. Thereafter, the nanorods on the surface begin to grow following a one-dimensional direction, and meanwhile, the inner core is dissolved to assist the growth of the nanorod outer surface through Ostwald ripening.
 |
| | Fig. 1 (a–c) SEM images of the Co3O4 precursor at different magnifications; (d–f) Co3O4 from precursor annealed at 400 °C for 2 h; (g) Co3O4 from precursor annealed at 500 °C for 2 h; and (h–i) SEM images of 4.4% Ag@Co3O4 composite. | |
 |
| | Fig. 2 (a) TEM image of the Co3O4 microsphere, (b) TEM image of the Ag@Co3O4 microsphere, and (c) a detailed TEM image of the Ag@Co3O4 microsphere. | |
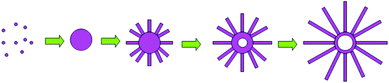 |
| | Fig. 3 Plausible formation mechanism of Co(CO3)0.5(OH)·0.11H2O sphere precursors. | |
The crystal structures of products were investigated by XRD analysis. Fig. 4a indicates that the precursor is cobalt carbonate hydroxide hydrates (Co(CO3)0.5(OH)·0.11H2O), and all the main diffraction peaks correspond well to the standard pattern (JCPDS #48-0083). During annealing, the precursor underwent heat decomposition and oxidation processes, and then transformed into Co3O4 absolutely. The presence of the main peaks at 2θ of 19.000°, 31.271°, 36.852°, 44.808°, 59.357°, and 65.236° is indicative of the (111), (220), (311), (400), (511) and (440) crystal planes of cubic phase Co3O4 with a space group of Fd3m. In addition, no other characteristic peaks can be found in Fig. 4b, which testifies to the thorough thermal conversion from Co(CO3)0.5(OH)·0.11H2O to Co3O4 microspheres. For the Ag@Co3O4 samples, the (111), (200) and (220) facets of Ag crystalline phases (JCPDS #65-2871), corresponding to 38.1°, 44.3°, and 64.4° (2θ), were observed. Furthermore, with the increasing content of Ag, the peak intensity of Ag increases; on the contrary, that of Co3O4 decreases. Take sample 3 as example: the EDS spectrum shown in Fig. 4c distinctly indicates that the main peaks of Ag@Co3O4 can be assigned to O, Co, and Ag, and it suggests that the weight ratio of Ag to Co3O4 is an estimated 4.4 wt%. The other samples with different amounts of AgNO3 addition were also calculated from EDS as shown in Table 1, which are apparently lower than the theoretical values.
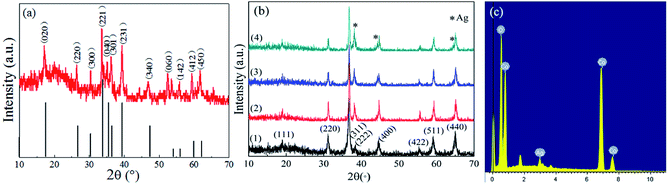 |
| | Fig. 4 (a) XRD patterns of Co(CO3)0.5(OH)·0.11H2O. (b) XRD patterns of (1) Co3O4 microspheres; (2) sample 1; (3) sample 3; and (4) sample 5. (c) The EDS spectrum of sample 3. | |
Table 1 Weight percent ratios of samples measured from the EDS spectrum
| Sample |
1 |
2 |
3 |
4 |
5 |
| Theoretical (wt%) |
6 |
8 |
12 |
16 |
20 |
| EDS (wt%) |
1.3 |
2.7 |
4.4 |
8.8 |
12.3 |
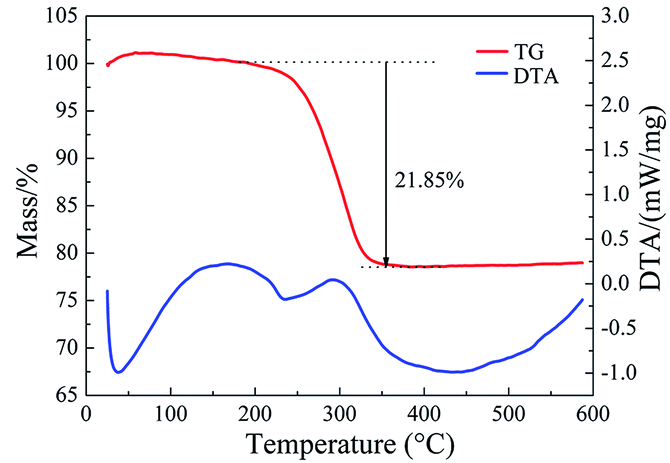
The TG/DTA analysis of the precursor was carried out to determine the annealing temperature as shown in Fig. 5. No obvious peak of the eliminating crystal water can be seen in the TG curve because there is a little crystal water in the molecular formula of the precursor. In addition, the mass loss (21.85%) results from the decomposition and oxidation of Co(CO3)0.5(OH) at temperatures ranging from 200 °C to 350 °C, corresponding to an exothermal peak located at 299 °C in the DTA curve. On the basis of TG data, the precursor can be converted completely into Co3O4 at 350 °C, and the final product is formed as shown in the following eqn (1) and (2):
| | |
Co(CO3)0.5(OH)·0.11H2O → Co(CO3)0.5(OH) + 0.11H2O
| (1) |
| | |
6Co(CO3)0.5(OH) + 4O2 → 2Co3O4 + 6CO2 + 3H2O
| (2) |
 |
| | Fig. 5 TG/DTA curve of Co3O4 precursors. | |
In general, the specific surface area is one of the most important parameters closely related to the gas sensing properties. N2 adsorption/desorption analysis, shown in Fig. 6a, was carried out to measure the specific surface area of Co3O4 microspheres, and the BET surface area is determined to be 34.190 m2 g−1. According to Brunauer–Deming–Deming–Teller (BDDT) classification, the isotherm curve of Co3O4 spheres is classified as Type III with an H1 hysteresis loop, confirming that the pore size is mainly distributed in the mesoporous range (diameters between 2 and 50 nm). The formation of the pores may be ascribed to gas evolution during the thermal decomposition reaction. However, the BET surface area of Ag@Co3O4 is 31.3 m2 g−1 (Fig. 6b), smaller than that of pure Co3O4 microsphere. This can be ascribed to the loading of Ag occupying the gaps between nanowires and the pores forming from annealing. So we can say that Ag modification decreases the specific surface area.
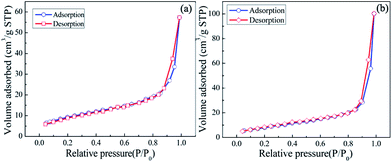 |
| | Fig. 6 N2 adsorption/desorption isotherms of (a) Co3O4 microsphere; (b) Ag@Co3O4 microsphere. | |
To further verify the composition and chemical state of the sample, XPS measurement of the Ag@Co3O4 composite with 4.4 wt% Ag was carried out as shown in Fig. 7. From the survey XPS spectrum in Fig. 7a, C 1s peak is located at 285.0 eV, and the distinctive Co, O and Ag peaks are also found, which confirm the existence of Co, O, Ag in the Ag@Co3O4 composite. The high resolution was focused on the region where Co 2p, O 1s, Ag 3d signals were expected to appear. In Fig. 7b, there are two main peaks centered at 780.8 eV and 796.0 eV, corresponding to Co 2p3/2 and Co 2p1/2 peaks, respectively.36 The spin–orbit splitting of Co 2p peaks (ΔE) is 15.2 eV, which is consistent with ΔE for the mixed-valence Co3O4.37 Besides, Co 2p has two components at 780.8 and 782.2 eV, which indicate Co3+ and Co2+ cation species, respectively.38 The two weak satellite peaks further confirm the information of Co3O4.39 Fig. 7c shows that the O 1s spectrum can be fitted by three Gaussian peaks; the Olat peak centered at 530.2 eV is ascribed to surface lattice oxygen in the Co3O4 phase; the Oads peak at 531.4 eV can be assigned to surface adsorption oxygen (O−, O2− or O2−) species; and the peak at 533.0 eV is generally attributed to adsorbed H2O or surface carbonate.38 Fig. 7d shows two peaks of Ag 3d, and the peak at 368.2 eV is characteristic of the existence of Ag0 in the Ag@Co3O4 composite.40
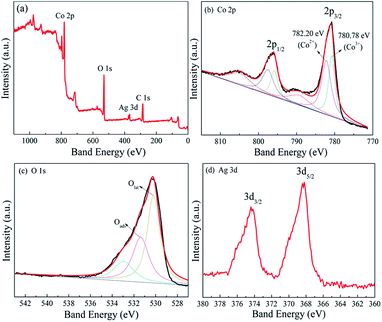 |
| | Fig. 7 X-ray photoelectron spectra of sample 3: (a) survey spectrum; (b) Co 2p; (c) O 1s; (d) Ag 3d. | |
Gas-sensing properties of Co3O4 and Ag-modified Co3O4 composites
Fig. 8 shows that the responses to 20 ppm formaldehyde of Co3O4-based sensors with different Ag contents change with operating temperature ranging from 70 to 130 °C. The result suggests that the sensor response is closely dependent on the operating temperature, and the curves in Fig. 8a exhibit a trend of “increase-maximum-decay” behavior with the increment of operating temperature. Taking the 4.4 wt% Ag@Co3O4 microsphere as example, the sensor response increases with the increasing operating temperature at the initial stage from 70 to 90 °C because sufficient thermal energy is essential to overcome the activation energy barrier of chemisorption and surface reaction. The response reaches a maximum value of 17.25 at a temperature of 90 °C. The temperature at which the response exhibits a maximum value is called the optimum operation temperature. However, from 90 °C on, the trend changes dramatically. Here, the response to formaldehyde decreases when the operating temperature ranges from 90 to 130 °C. This phenomenon can be ascribed to the process in which some adsorbed gas molecules escape from the material surface because of their enhanced activation. When the desorption rate of the gas becomes equal to that of adsorption, the maximum loading of chemisorbed ions is reached at the optimum temperature, accelerating the oxidation of formaldehyde molecules and resulting in the highest response.
 |
| | Fig. 8 Responses of pure Co3O4 spheres and Ag@Co3O4 samples annealed at 400 °C for 2 h. | |
Annealing temperature is one of the important factors for response, and thus is essential to investigate. However, for Co3O4 microspheres, when annealing temperature is lower than 400 °C, the precursor cannot be completely converted into Co3O4 (judging from thermogravimetric analysis), and sufficient crystallinity for sensor application also cannot be reached. However, when annealing temperature reaches or even exceeds 500 °C, the effective surface area decreases, resulting from the collapse of the urchin-like Co3O4 spheres as shown in SEM; correspondingly the sensor response declines. As a consequence, the annealing temperature of 400 °C is the appropriate temperature for Co3O4 spheres to achieve the highest response to 20 ppm formaldehyde, which not only complete the phase conversion but also have sufficient crystallinity for sensor application. Fig. 8 shows the influence of different amounts of Ag addition on the gas-sensing response for x wt% Ag@Co3O4 samples to 20 ppm formaldehyde. It is apparently observed that the Ag@Co3O4 samples possess better gas sensing performance, especially sample 3. Besides, the optimum operating temperature of the Ag@Co3O4 samples also varies with increased Ag concentration. For example, the bare Co3O4 microspheres show a sensing response of 1.34 at its optimum operating temperature of 115 °C. However, sample 1 reaches its best response value of 5.38 at the temperature of 100 °C. With incremental of Ag addition (2.7 wt%, 4.4 wt%), the response value increases from 9.41 to the highest value of 17.25 at the lowest operating temperature of 90 °C. The temperature is also the turning point where the sample response decreases and the operating temperatures begin to increase with the Ag content above 4.4 wt%, such as 8.8 wt% and 12.3 wt%.
Fig. 9 shows the transient curve of 4.4 wt% Ag@Co3O4 response to different concentrations of formaldehyde at the operating temperature of 90 °C. It can be seen that the resistance of 4.4 wt% Ag@Co3O4 increased abruptly when the targeted gas was injected into the gas chamber, and then decreased rapidly when the tested gas was turned off and the sensor was flushed with air. Furthermore, it is clear that the response values were enhanced dramatically with increasing concentration of formaldehyde. A practically applicable material should not only have high response but also good selectivity to the target gas, giving the sensor the ability to withstand interference. The selectivity of pure Co3O4 and the 4.4 wt% Ag@Co3O4 composite, at their optimum operating temperatures, to the same concentrations of formaldehyde, acetone, methylbenzene and ethanol was investigated as shown in Fig. 10. The high selectivity makes it possible for the sensor to detect formaldehyde from a mixture of VOCs.
 |
| | Fig. 9 Formaldehyde responses of sample 3 at 90 °C to different gas concentrations in the range of 10 to 100 ppm. | |
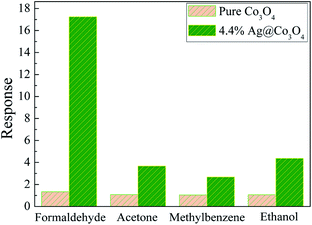 |
| | Fig. 10 Response of sensors based on pure Co3O4 and sample 3 to 20 ppm of various gases at optimum sensor operating temperatures. | |
Gas-sensing mechanism
A possible gas-sensing mechanism is proposed here to further study the sensing response. It is well known that the sensing response has a close relationship with gas diffusion, adsorption and the chemical interaction of gas molecules with the material. Co3O4, as a p-type semiconductor, is different from n-type semiconductors in conduction behaviour. For p-type oxide semiconductors, the resistive particle cores and semiconducting near-surface regions, as two parallel paths, determine the sensor resistance; thus it is usually depicted as an equivalent parallel circuit model as shown in Fig. 11b. Despite the different gas-sensing mechanisms for n-type and p-type oxide semiconductors, the sensing responses are subject to parameters such as surface area, porosity, and the contact configuration between nanostructures.41 For Co3O4, the majority carriers are holes, and the adsorption of oxygen with negative charges can generate holes, resulting in the formation of a hole-accumulation-layer (HAL). The reaction kinetics can be illuminated as follows (eqn (3)–(6)):| | |
O2 (adv) + e− → O2− (adv)
| (4) |
| | |
O2− (adv) + e− → 2O− (adv)
| (5) |
| | |
O− (adv) + e− → O2− (adv)
| (6) |
 |
| | Fig. 11 Difference of gas-sensing mechanism between (a) n-type semiconductor and (b) p-type semiconductor. | |
When Co3O4 spheres are exposed to reductive gases like formaldehyde, the oxidation reaction between formaldehyde and adsorbed oxygen occurs and accompanies the process that releases free electrons and neutralizes the holes (eqn (7) and (8)), which in turn increases the resistance of Co3O4 spheres. Based on the analyzed result, we can conclude that the trend of changing resistance of p-type semiconductor gas sensors to reductive/oxidation gases is completely opposite to that of the n-type sensor:
| | |
Formaldehyde (gas) → formaldehyde (adv)
| (7) |
| | |
Formaldehyde (adv) + O− → CO2 + H2O + e−
| (8) |
Furthermore, for the Ag@Co3O4 microspheres, the electronic transfer between Ag nanoparticles and Co3O4 microsphere should additionally be taken into account as shown in Fig. 12. As the work function of Ag (4.26 eV) is lower than that of Co3O4 (6.03 eV), electrons would transfer from Ag to Co3O4 until the system obtains thermodynamic equilibrium, which results in the formation of a Schottky barrier at the metal–semiconductor interface.42 However, electrons can transfer to the conduction band (CB) under an applied bias, with simultaneous generation of holes in the valence band (VB). Then, the higher CB potential (−4.23 eV) of Co3O4 compared to Ag can transfer the electrons from Co3O4 to the Ag nanoparticle. Because of the formation of holes accumulating at Co3O4, the resistance of Ag@Co3O4 will decrease.43,44 Furthermore, due to its catalytic property, Ag nanoparticles can act as active sites to accelerate the adsorption and dissociation of gas molecules to enhance the gas-sensing performance.
 |
| | Fig. 12 Schematic model of Ag@Co3O4 hetero-architectures to illustrate the influence of Ag addition on gas response. (a) electrons transition before the system obtains thermodynamic equilibrium; (b) electrons transition after the system obtains thermodynamic equilibrium. | |
Conclusions
In summary, Co3O4 microspheres assembled from one-dimensional nanowires have been obtained by a simple hydrothermal process with neither catalysis nor template. To improve its gas-sensing performance, Ag was utilized as a modifier on the surface of Co3O4. The 4.4 wt% Ag@Co3O4 composite exhibits the best gas-sensing property at the relatively low temperature of 90 °C. The satisfactory result is ascribed to the formation of a Schottky barrier at the metal–semiconductor interface and to the catalytic effect of Ag nanoparticles. Thus, electronically or chemically sensitizing p-type oxide semiconductors via various methods is important for developing practical p-type oxide semiconductor gas sensors to achieve high gas response.
Acknowledgements
This work was supported by the National Natural Science Foundation of China (Grant nos 21177007 and 51372013), Beijing Engineering Centre for Hierarchical Catalysts, the Fundamental Research Funds for the Central Universities (YS1406), and Beijing Key Laboratory of Environmentally Harmful Chemicals Analysis.
Notes and references
- Y. Zheng, J. Wang and P. Yao, Sens. Actuators, B, 2011, 156, 723–730 CrossRef CAS PubMed.
- Y. M. Zhang, Y. T. Lin, J. L. Chen, J. Zhang, Z. Q. Zhu and Q. J. Liu, Sens. Actuators, B, 2014, 190, 171–176 CrossRef CAS PubMed.
- C. M. Ghimbeu, M. Lumbreras, M. Siadat, R. C. van Landschoot and J. Schoonman, Sens. Actuators, B, 2008, 133, 694–698 CrossRef CAS PubMed.
- N. Singh, C. Yan and P. S. Lee, Sens. Actuators, B, 2010, 150, 19–24 CrossRef CAS PubMed.
- P. Rai, Y. S. Kim, H.-M. Song, M.-K. Song and Y.-T. Yu, Sens. Actuators, B, 2012, 165, 133–142 CrossRef CAS PubMed.
- E. D. Gaspera, A. Mura, E. Menin, M. Guglielmi and A. Martucci, Sens. Actuators, B, 2013, 187, 363–370 CrossRef PubMed.
- Y. J. Chiang and F. M. Pan, J. Phys. Chem. C, 2013, 117, 15593–15601 CAS.
- H. Nguyen and S. A. El-Safty, J. Phys. Chem. C, 2011, 115, 8466–8474 CAS.
- H. F. Wang, R. Kavanagh, Y. L. Guo, Y. Guo, G. Lu and P. Hu, J. Catal., 2012, 296, 110–119 CrossRef CAS PubMed.
- B. Guo, C. Li and Z. Yuan, J. Phys. Chem. C, 2010, 114, 12805–12817 CAS.
- H. S. Soo, A. Agiral, A. Bachmeier and H. Frei, J. Am. Chem. Soc., 2012, 134, 17104–17116 CrossRef CAS PubMed.
- P. Sahoo, H. Djieutedjeu and P. F. P. Poudeu, J. Mater. Chem. A, 2013, 1, 15022 CAS.
- A. Das, B. Venkataramana, D. Partheephan, A. K. Prasad, S. Dhara and A. K. Tyagi, Phys. E, 2013, 54, 40–44 CrossRef CAS PubMed.
- L. Man, B. Niu, H. Xu, B. Cao and J. Wang, Mater. Res. Bull., 2011, 46, 1097–1101 CrossRef CAS PubMed.
- J. Xiao, B. Chen, X. Liang, R. Zhang and Y. Li, Catal. Sci. Technol., 2011, 1, 999 CAS.
- V. Balouria, A. Kumar, A. Singh, S. Samanta, A. K. Debnath, A. Mahajan, R. K. Bedi, D. K. Aswal, S. K. Gupta and J. V. Yakhmi, Sens. Actuators, B, 2011, 157, 466–472 CrossRef CAS PubMed.
- S. Park, S. An, H. Ko, C. Jin and C. Lee, ACS Appl. Mater. Interfaces, 2012, 4, 3650–3656 CAS.
- X. Chu, Y. Han, S. Zhou and H. Shui, Ceram. Int., 2010, 36, 2175–2180 CrossRef CAS PubMed.
- D. K. Bandgar, S. T. Navale, G. D. Khuspe, S. A. Pawar, R. N. Mulik and V. B. Patil, Mater. Sci. Semicond. Process., 2014, 17, 67–73 CrossRef CAS PubMed.
- L. Guo, X. Shen, G. Zhu and K. Chen, Sens. Actuators, B, 2011, 155, 752–758 CrossRef CAS PubMed.
- J. Nisar, Z. Topalian, A. De Sarkar, L. Osterlund and R. Ahuja, ACS Appl. Mater. Interfaces, 2013, 5, 8516–8522 CAS.
- P. Hu, G. Du, W. Zhou, J. Cui, J. Lin, H. Liu, D. Liu, J. Wang and S. Chen, ACS Appl. Mater. Interfaces, 2010, 2, 3263–3269 CAS.
- D. Patil, P. Patil, V. Subramanian, P. A. Joy and H. S. Potdar, Talanta, 2010, 81, 37–43 CrossRef CAS PubMed.
- K. I. Choi, H. R. Kim, K. M. Kim, D. Liu, G. Cao and J. H. Lee, Sens. Actuators, B, 2010, 146, 183–189 CrossRef CAS PubMed.
- Z. Wen, L. Zhu, W. Mei, L. Hu, Y. Li, L. Sun, H. Cai and Z. Ye, Sens. Actuators, B, 2013, 186, 172–179 CrossRef CAS PubMed.
- J. Park, X. Shen and G. Wang, Sens. Actuators, B, 2009, 136, 494–498 CrossRef CAS PubMed.
- C. Sun, X. Su, F. Xiao, C. Niu and J. Wang, Sens. Actuators, B, 2011, 157, 681–685 CrossRef CAS PubMed.
- M. Choudhary, N. K. Singh, V. N. Mishra and R. Dwivedi, Mater. Chem. Phys., 2013, 142, 370–380 CrossRef CAS PubMed.
- A. P. Rambu, L. Ursu, N. Iftimie, V. Nica, M. Dobromir and F. Iacomi, Appl. Surf. Sci., 2013, 280, 598–604 CrossRef CAS PubMed.
- C. Luan, K. Wang, Q. Yu, G. Lian, L. Zhang, Q. Wang and D. Cui, Sens. Actuators, B, 2013, 176, 475–481 CrossRef CAS PubMed.
- M. Tong, G. Dai and D. Gao, Appl. Surf. Sci., 2001, 171, 226–230 CrossRef.
- H. M. Jeong, H. J. Kim, P. Rai, J. W. Yoon and J. H. Lee, Sens. Actuators, B, 2014, 201, 482–489 CrossRef CAS PubMed.
- M. M. Rahman, A. Jamal, S. B. Khan and M. Faisal, J. Phys. Chem. C, 2011, 115, 9503–9510 CAS.
- F. Qu, Y. Wang, Y. Wang, J. Zhou and S. Ruan, RSC Adv., 2014, 4, 24211–24216 RSC.
- N. Chen, X. Li, X. Wang, J. Yu, J. Wang, Z. Tang and S. A. Akbar, Sens. Actuators, B, 2013, 188, 902–908 CrossRef CAS PubMed.
- D. Patil, P. Patil, V. Subramanian, P. A. Joy and H. S. Potdar, Talanta, 2010, 81, 37–43 CrossRef CAS PubMed.
- Y. Lou, L. Wang, Y. Zhang, Z. Zhao, Z. Zhang, G. Lu and Y. Guo, Catal. Today, 2011, 175, 610–614 CrossRef CAS PubMed.
- J. Li, G. Lu, G. Wu, D. Mao, Y. Guo, Y. Wang and Y. Guo, Catal. Sci. Technol., 2014, 4, 1268–1275 CAS.
- Y. Lv, W. Zhan, Y. He, Y. Wang, X. Kong, Q. Kuang, Z. Xie and L. Zheng, ACS Appl. Mater. Interfaces, 2014, 6, 4186–4195 Search PubMed.
- D. Chen, L. Yin, L. Ge, B. Fan, R. Zhang, J. Sun and G. Shao, Sens. Actuators, B, 2013, 185, 445–455 CrossRef CAS PubMed.
- H. J. Kim and J. H. Lee, Sens. Actuators, B, 2014, 192, 607–627 CrossRef CAS PubMed.
- H. Zhang, S. Pokhrel, Z. Ji, H. Meng, X. Wang, S. Lin, C. H. Chang, L. Li, R. Li, B. Sun, M. Wang, Y. Liao, R. Liu, T. Xia, L. Mädler and A. E. Nel, J. Am. Chem. Soc., 2014, 136, 6406–6420 CrossRef CAS PubMed.
- Y. K. Lin, Y. J. Chiang and Y. J. Hsu, Sens. Actuators, B, 2014, 204, 190–196 CrossRef CAS PubMed.
- Z. Wang, S. Zhao, S. Zhu, Y. Sun and M. Fang, CrystEngComm, 2011, 13, 2262–2267 RSC.
|
| This journal is © The Royal Society of Chemistry 2015 |
Click here to see how this site uses Cookies. View our privacy policy here.