
Dependence of magnetism on the doping level of Zn1−xMnxTe nanoparticles synthesized by a hydrothermal method†
F. L. Tanga,
H. L. Su*a,
P. Y. Chuangb,
Y. C. Wu*a,
J. C. A. Huang*bc,
X. L. Huangd and
Y. Jind
aSchool of Materials Science and Engineering and Anhui Provincial Key Laboratory of Advanced Functional Materials and Devices, Hefei University of Technology, Hefei 230009, People's Republic of China. E-mail: hailinsu@hfut.edu.cn; ycwu@hfut.ed.cn
bDepartment of Physics, National Cheng Kung University, Tainan 701, Taiwan. E-mail: jcahuang@mail.ncku.edu.tw
cAdvanced Optoelectronic Technology Center and Center for Micro/Nano Science and Technology, National Cheng Kung University, Tainan 701, Taiwan
dSamsung Advanced Institute of Technology, Beijing 100128, People's Republic of China
First published on 29th September 2014
Abstract
Mn-doped ZnTe nanoparticles with various degrees of Mn-doping from 3 at.% to 18 at.% were synthesized by a hydrothermal method. A single-phase zinc-blende-structured sample was obtained only at the Mn-doping level of 3 at.%, while the impurity phase of MnO was present in the samples with higher degrees of Mn-doping. In all of the samples, the Mn valence states were lower than 2+. All samples exhibited both ferromagnetism and paramagnetism. The ferromagnetism is mainly attributable to the overlapping of the bound magnetic polarons and the paramagnetism is mainly caused by the isolated polarons and Mn ions. Samples that were doped with 3 at.% and 6 at.% Mn also exhibited superparamagnetism and antiferromagnetism. The superparamagnetism may have arisen from the presence of some tiny ferromagnetic nanoparticles. The antiferromagnetism is believed to have arisen mainly from the carrier-mediated interaction among Mn ions.
Introduction
Spintronic devices have many favorable properties, including nonvolatility, high data processing speed and low electric power consumption; they have attracted much attention in recent years.1,2 A good candidate for next-generation spintronic material is magnetic semiconductor.1–3 Previous studies indicate that ZnTe-based semiconductors possess the interesting physical properties, especially the complicated magnetism.4–9 Hereinto, the first-principle calculations predicted the half-metallic ferromagnetism and the peculiar spin-gapless band structure within the Cr-doped ZnTe and the Mn-doped ZnTe, respectively.4–6 And the Mn-doped ZnTe was found to have the antiferromagnetism and the ferromagnetism experimentally.7 However, the detailed experimental investigation on the magnetism of Mn-doped ZnTe is still lacking. Several techniques, including high-temperature solid state reaction, molecular beam epitaxy and vapor phase growth, have been utilized to prepare Mn-doped ZnTe.7–9 Compared with these methods, the hydrothermal method is a more promising strategy that does not require a high temperature or a high vacuum. The reaction temperature and the filling ratio of the autoclave can be conveniently controlled to produce a high-pressure environment.10 Under such meta-stable conditions, various multifunctional materials with interesting morphologies can be obtained. However, the hydrothermal method is seldom used to fabricate multi-component materials such as Mn-doped ZnTe owing to the difficulty of accurately controlling the composition of the sample. This work presents a hydrothermal method for preparing Mn-doped ZnTe (Zn1−xMnxTe) nanoparticles with various degrees of doping and studies the effect of Mn-doping level on the magnetism of the sample. To determine the origin of magnetism, the valence state and the local coordination structure of the Mn ions in the ZnTe lattice are also investigated in detail.Results and discussion
As determined from the EDS atomic ratio results, the Mn-doping levels x in the four samples that are discussed herein are 3 at.%, 6 at.%, 13 at.% and 18 at.% and the corresponding atomic ratios of Te![[thin space (1/6-em)]](https://www.rsc.org/images/entities/char_2009.gif) :(Zn + Mn) are 0.85, 0.80, 0.86 and 0.84, respectively, indicating that all the samples included structural defects like Te vacancies. Fig. 1 presents typical field-emission scanning electron microscopy (FESEM) and transmission electron microscopy (TEM) images and the selected area electron diffraction (SAED) patterns of four Mn-doped ZnTe samples. Four samples with various Mn-doping levels have similar nanoparticle morphologies. For the sample with the Mn-doping level of 3 at.%, only the diffraction spots of ZnTe with a zinc-blende (ZB) structure can be found in the SAED pattern of the selected particle. This indicates the single crystalline nature of the nanoparticle. It should be noted that many particles were found to exhibit different single-crystalline SAED patterns of ZB-structured ZnTe (not shown here) due to the difference in the zone axis of the incident electron beam. For the samples with the Mn-doping levels of 6 at.%, 13 at.% and 18 at.%, the diffraction spots/rings of MnO, except for those of ZB-structured ZnTe, can be found in their SAED patterns. This reflects the presence of an impurity phase of MnO.
:(Zn + Mn) are 0.85, 0.80, 0.86 and 0.84, respectively, indicating that all the samples included structural defects like Te vacancies. Fig. 1 presents typical field-emission scanning electron microscopy (FESEM) and transmission electron microscopy (TEM) images and the selected area electron diffraction (SAED) patterns of four Mn-doped ZnTe samples. Four samples with various Mn-doping levels have similar nanoparticle morphologies. For the sample with the Mn-doping level of 3 at.%, only the diffraction spots of ZnTe with a zinc-blende (ZB) structure can be found in the SAED pattern of the selected particle. This indicates the single crystalline nature of the nanoparticle. It should be noted that many particles were found to exhibit different single-crystalline SAED patterns of ZB-structured ZnTe (not shown here) due to the difference in the zone axis of the incident electron beam. For the samples with the Mn-doping levels of 6 at.%, 13 at.% and 18 at.%, the diffraction spots/rings of MnO, except for those of ZB-structured ZnTe, can be found in their SAED patterns. This reflects the presence of an impurity phase of MnO.
 | ||
| Fig. 1 Typical FESEM and TEM (inset, upper right) images and SAED patterns (inset, lower right) of the powders of ZnTe doped with (a) 3 at.%, (b) 6 at.%, (c) 13 at.% and (d) 18 at.% Mn. | ||
Fig. 2 shows the XRD patterns of four Mn-doped ZnTe powders. The pattern of the Si substrate on which the powders were placed for the ease of XRD measurement is provided as a reference. The sample with the Mn-doping level of 3 at.% has a single phase and a ZB structure (JCPDS PDF#80-0022). The patterns of the samples with Mn-doping levels of over 6 at.% include a diffraction peak, indicated by a dark solid circle, that reflects the presence of an impurity phase of MnO (JCPDS PDF#75-0625). This is consistent with the analysis on the SAED patterns.
 | ||
| Fig. 2 XRD spectra of (a) Si substrate and the powders of ZnTe doped with (b) 3 at.%, (c) 6 at.%, (d) 13 at.% and (e) 18 at.% Mn. | ||
Fig. 3 plots the ZFC-FC M–T curves and the temperature-dependence of the difference ΔM between the FC and ZFC magnetizations of the four Mn-doped ZnTe powders. Clearly, the ΔMs of the four samples decrease as the temperature increases, almost reaching zero at room temperature. Therefore, all of the samples exhibited ferromagnetism (FM) that remained near room temperature. Comparing ΔM of the four samples at 4 K reveals that ΔM increases from 0.00143 emu g−1 to 0.00871 emu g−1 as the Mn-doping level increases from 3 at.% to 6 at.% and then decreases to 0.00076 emu g−1 as the Mn-doping level increases further to 18 at.%. Evidently, the FM of the Mn-doped ZnTe powder becomes stronger and then gradually weaker as the Mn-doping level increases. Consistent with this trend, the divergence between the ZFC and FC curves becomes greater and then smaller as the Mn-doping level increases. The ZFC and FC curves of the sample doped with 18 at.% Mn almost overlap each other. The low-temperature region of the ZFC and FC curves reveals that the magnetization of all the samples increased rapidly as the temperature decreased, indicating the existence of paramagnetism (PM).11 The ZFC curves of samples that were doped with 3 at.% and 6 at.% Mn included low broad peaks with a blocking temperature (TB) of about 270 K, implying the existence of superparamagnetism (SPM), which may have arisen from some tiny ferromagnetic nanoparticles.11,12 Careful observation of the ZFC and FC curves in Fig. 3(a) and (b) reveals small but remarkable steps, marked with the dotted lines, at about 100 K and 70 K, respectively, in both the ZFC and the FC curves of the samples that were doped with 3 at.% and 6 at.% Mn. This finding shows that these two samples exhibited weak antiferromagnetism (AFM)13 and that the AFM coupling became weaker as the Mn-doping level increased from 3 at.% to 6 at.%. The curve of the powders with higher Mn-doping levels exhibited no such steps.
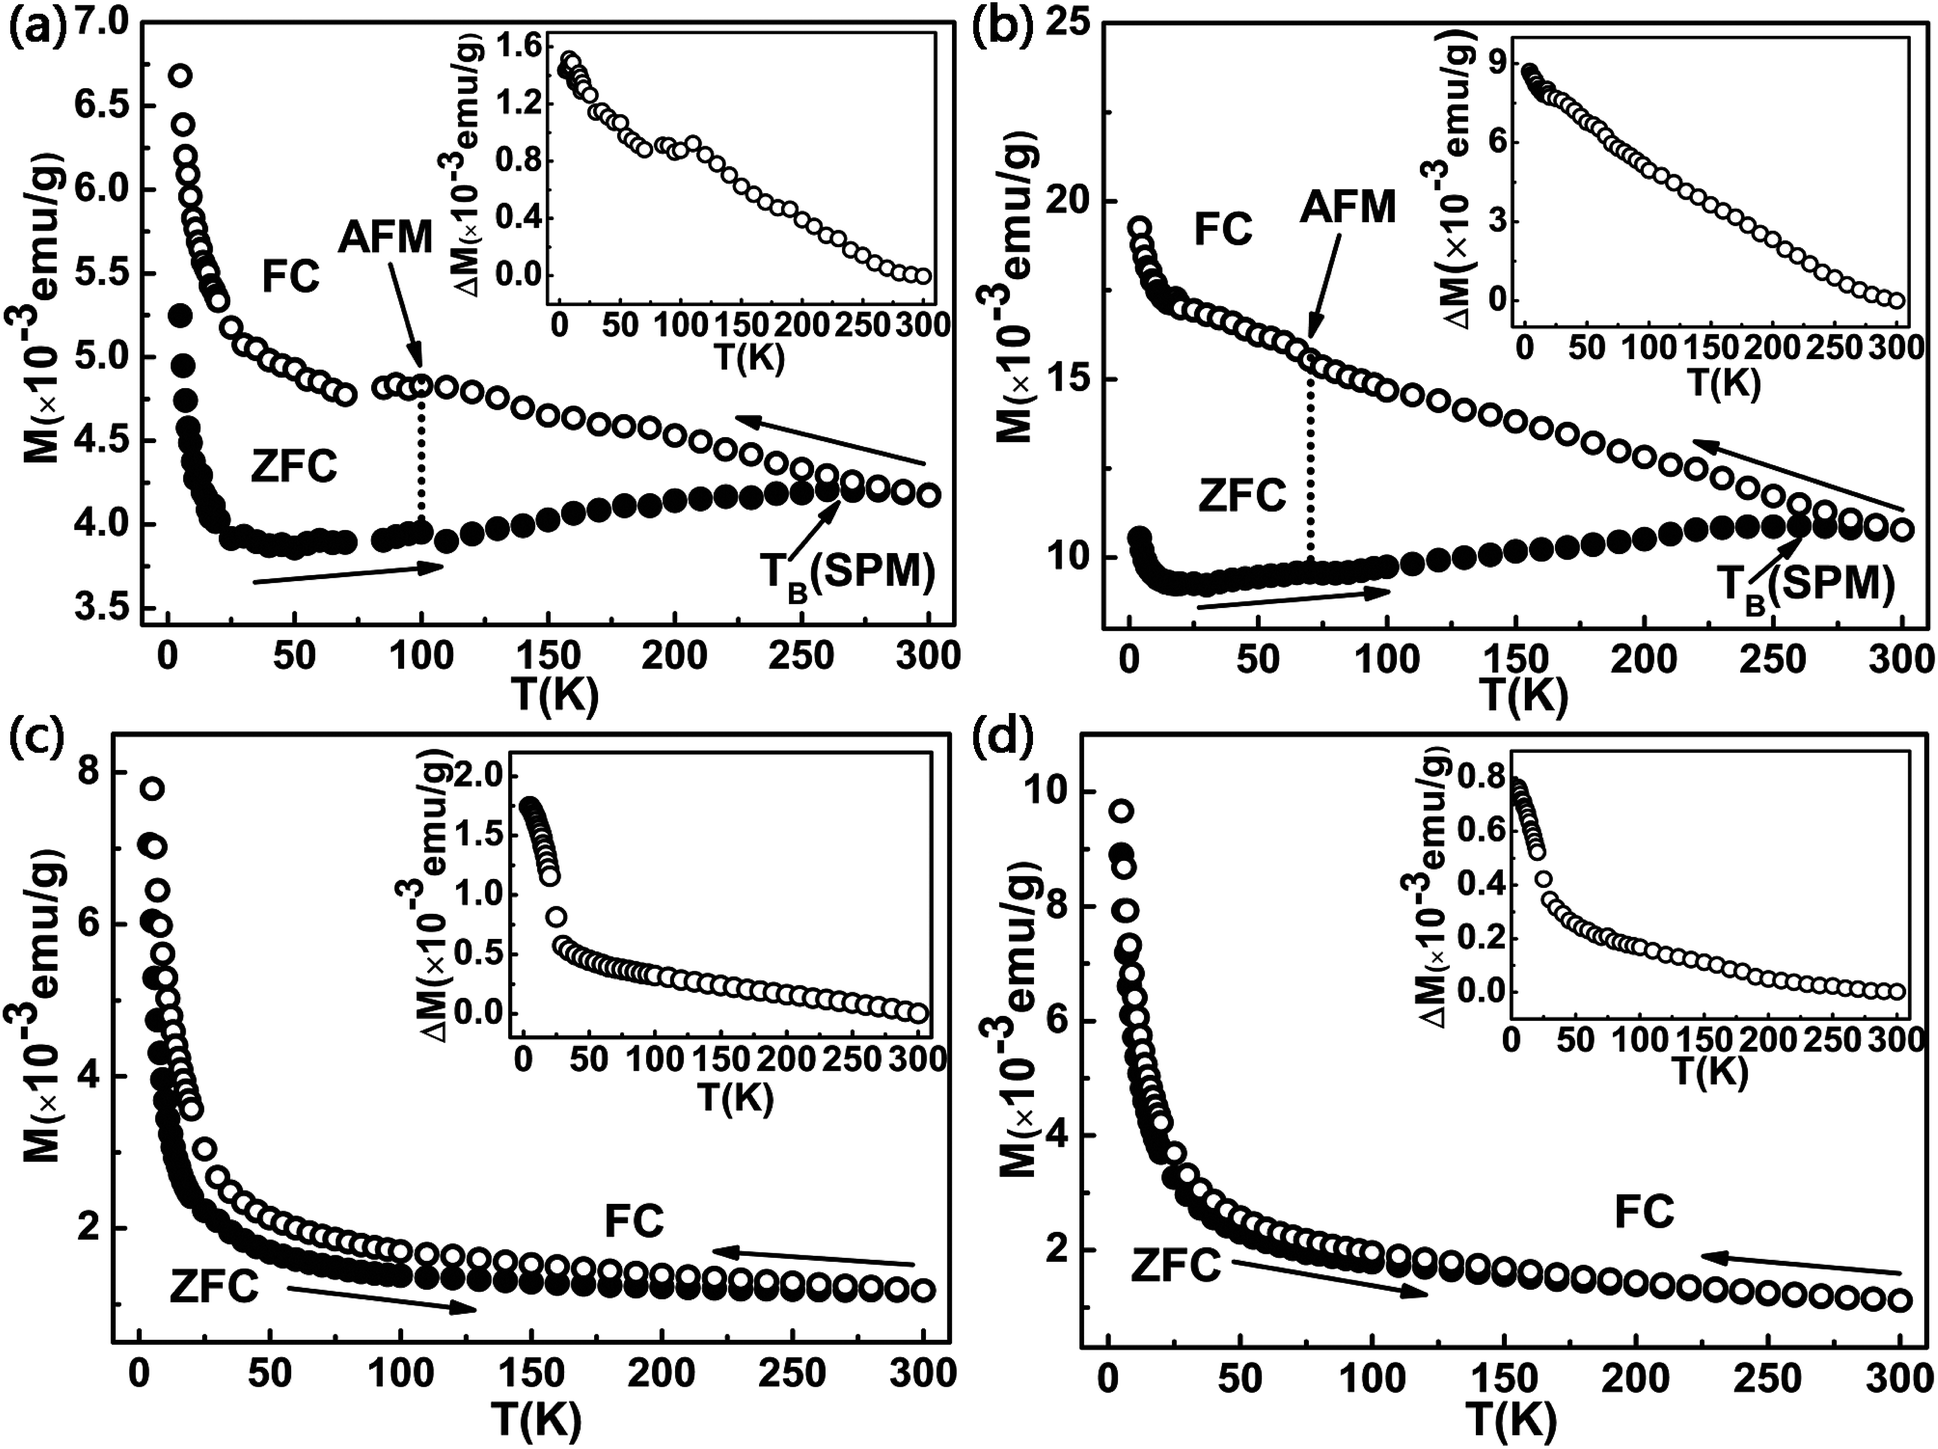 | ||
| Fig. 3 ZFC–FC M–T curves of Mn-doped ZnTe powders. The Mn-doping levels are (a) 3 at.%, (b) 6 at.%, (c) 13 at.% and (d) 18 at.%, respectively. The inset of each graph shows the temperature dependence of ΔM. | ||
Fig. 4 plots the magnetic hysteresis loops, without and with subtraction of the PM signal, of the four Mn-doped ZnTe powders. Clearly, FM and PM were present in all of the samples. A comparison of the saturation magnetizations of the four samples that were measured at 4 K (Ms-4K) and 300 K (Ms-RT), shown in Fig. 4(e)–(h), reveals that as the Mn-doping level increased, Ms-4K increased monotonously from 0.61634 emu g−1 to 2.74235 emu g−1, whereas Ms-RT firstly increased from 0.03735 emu g−1 to 0.16926 emu g−1 and then decreased gradually to 0.01760 emu g−1. This phenomenon suggests that, although increasing the Mn-doping level introduced more magnetic moments into the samples, some magnetic moments were coupled weakly in the samples with a high Mn-doping level and the number of such magnetic moments increased with the Mn-doping level above 6 at.%. At 4 K, these weakly coupled moments interacted with each other ferromagnetically, causing the increase in Ms-4K with the Mn-doping level. As the temperature increased, however, these magnetic moments gradually decoupled owing to thermal disturbance, so the samples with a higher Mn-doping level had a lower Ms-RT. Although the Mn-doped ZnTe was predicted as a possible SGS material, the reported peculiar phenomenon of SGS that Ms increases with the temperature is not found in our experiment according to Fig. 4(e)–(h).5,6,12
 | ||
| Fig. 4 M–H loops without and with subtraction of the PM signal measured at 4 K, 30 K, 100 K, 200 K and 300 K for the samples with Mn-doping level of (a) and (e) 3 at.%, (b) and (f) 6 at.%, (c) and (g) 13 at.% and (d) and (h) 18 at.%. | ||
To elucidate the origin of the magnetism of Mn-doped ZnTe powders, the valence state and the local structure of the Mn ions must firstly be determined. Fig. 5 present the XANES spectra of four Mn-doped ZnTe powders. The spectra of standard Mn metal and Mn oxides are provided for comparison. Apparently, the spectra of the four Mn-doped ZnTe samples differ from those of Mn metal, Mn2O3 and MnO2, but are quite similar to that of MnO. This result excludes the presence of Mn clusters and reveals that the valence state of Mn ions that are doped into ZnTe is close to 2+.14 To elucidate the influence of Mn-doping level on the valence of Mn, Fig. 6 plots the first derivative, dμ(E)/dE, of the XANES spectra of MnO and four Mn-doped ZnTe powders. The Mn–K absorption edges are at energies of 6549.8 eV, 6550.0 eV and 6549.9 eV for the samples with Mn-doping levels of 3 at.%, 6 at.% and 13 at.%, respectively. These values are all slightly lower than that of MnO (6550.1 eV). The Mn-K absorption edge of the sample that was doped with 18 at.% Mn was shifted to an energy of 6545.0 eV which is far less than that of MnO. The shifting of the absorption edge to a lower energy indicates that the valence state of Mn for the four samples is somewhat less than 2+. This result is attributable to the annealing treatment in an H2 atmosphere and the presence of structural defects such as Te vacancies, although the ZnTe antisites and Zni interstitials cannot be excluded. The valence state of the Mn in the sample that was doped with 18 at.% Mn was remarkably lower than 2+, implying that the greater number of Mn ions in this sample had lower valence states than those in the other three samples. This may be due to more Mn ions which were reduced to some extent during the annealing process.
 | ||
| Fig. 5 Normalized XANES spectra (black solid square) at Mn K-edge of Mn-doped ZnTe powders. The Mn-doping levels are (a) 3 at.%, (b) 6 at.%, (c) 13 at.% and (d) 18 at.%, respectively. The spectra of Mn metal (pink open left-triangle), MnO (red open circle), Mn2O3 (blue open right-triangle) and MnO2 (dark cyan open star) are also provided for references. | ||
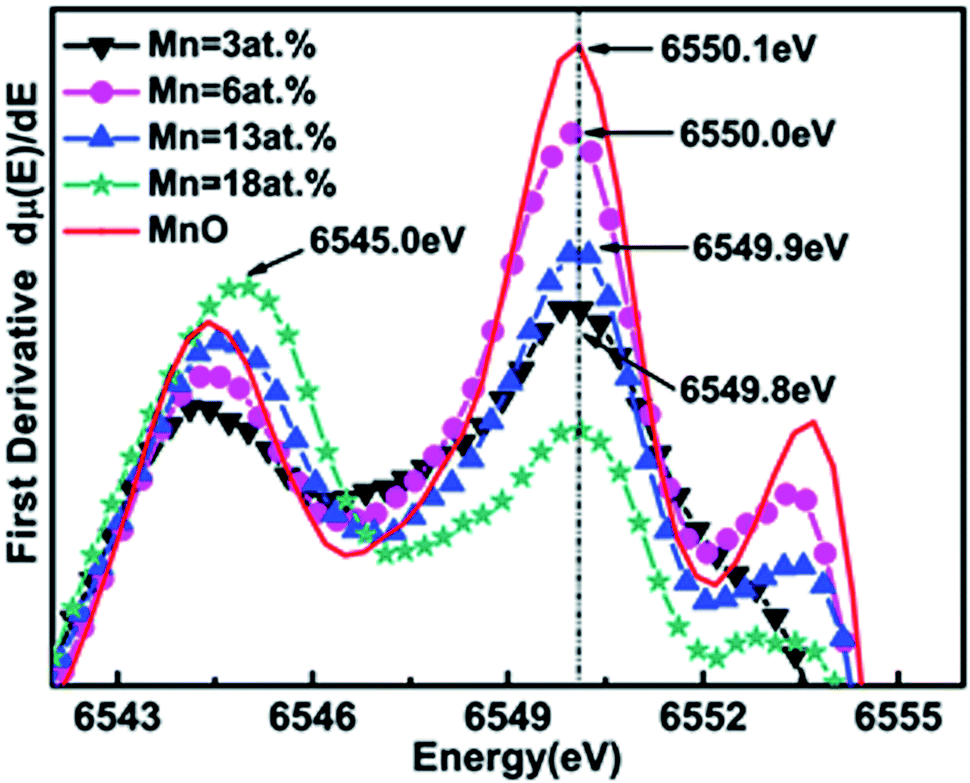 | ||
| Fig. 6 First derivative dμ(E)/dE of XANES spectra for MnO (red line) and Mn-doped ZnTe powders. The Mn-doping levels are 3 at.% (black solid down-triangle), 6 at.% (pink solid circle), 13 at.% (blue solid up-triangle) and 18 at.% (dark cyan solid star), respectively. | ||
Fig. 7 plots the radial distribution function (RDF), the Fourier-transformed (FT) amplitude of EXAFS, at the Mn and Zn K-edges of the four Mn-doped ZnTe powders. The RDF of standard MnO is provided for comparison. The Zn RDFs of the four samples have a peak at around 2.5 Å, which is clearly associated with Zn–Te bonding.15 The Mn RDFs have a similar main peak, associated with Mn–Te bonding, at around 2.7 Å, indicating that Mn actually occupies Zn sites in the ZnTe lattice. The slight shift in the peak is attributable to the fact that the Mn ion is larger than the Zn ion. The RDFs of the samples with Mn-doping level higher than 6 at.% include a peak at around 1.7 Å, which is similar to the first peak of the Mn RDF of MnO and associated with Mn–O bonding, and this peak becomes stronger as the Mn-doping level increases. Clearly, the samples with Mn-doping level higher than 6 at.% contained an MnO impurity phase whose amount increased with the Mn-doping level.16 This result is consistent with the XRD analysis.
 | ||
| Fig. 7 The RDFs of Mn and Zn for MnO and Mn-doped ZnTe powders. The Mn-doping levels are 3 at.%, 6 at.%, 13 at.% and 18 at.%. | ||
As to the magnetic origin of the Mn-doped ZnTe, carrier-mediated mechanism bridged to bound magnetic polaron (BMP) model, as shown in Fig. 8, can be used to explain the underlying mechanism.17–20 In Fig. 8, cation sites of Zn are represented by open circles, while those of Te are not shown. The defects, such as Te vacancies, marked as Defect, are represented by open squares. Mn ions substituting for Zn and carrier mediating the interaction between Mn ions are marked by dark solid circles with red arrows and red solid circle, respectively. It is noted that the single-phase ZnTe has a p-type conductivity with a hole concentration of about 1018 cm−3.21 For Mn-doped ZnTe, the hole concentration decreases with the Mn-doping level.22 Therefore, we infers that the conductivity of ZnTe doped with 3 at.% Mn locates at the boundary between the intermediate regime and the insulating regime. The weak AFM is likely caused by carrier-mediated interaction and the FM is determined by BMP mechanism in such intermediate regime. With the increase of Mn-doping level, the hole concentration falls and the conductivity of Mn-doped ZnTe shifts from the intermediate regime to the insulating regime. Accordingly, carrier-mediated AFM coupling gradually weakens and BMP model becomes the dominant mechanism for Mn-doping level higher than 6 at.%. By the XRD, XAS and magnetic studies for the samples doped with more than 6 at.% Mn, it seems that MnO also contributes to AFM. But the Néel temperature of MnO is about 118 K, which is much higher than that of the sample herein.23 This indicates that AFM is not from the MnO phase. According to the previous studies about the magnetism of MnO nanoclusters,24,25 the MnO impurity phase in the samples with a Mn-doping level higher than 6 at.% may contribute to small portion of low-temperature FM, because AFM or SPM cannot be found from the ZFC–FC M–T curves of ZnTe doped with 13 at.% and 18 at.% Mn. Besides the increase of Mn-doping level, the slight decrease of Te content that may result in the decrease of the hole concentration also contributed to cause the disappearance of AFM for ZnTe doped with 3 at.% Mn (not shown here). This finding supports the assumption about the scale of the conductivity of ZnTe doped with 3 at.% Mn and its carrier-mediated AFM origin as discussed above.
 | ||
| Fig. 8 Schematic of magnetic mechanisms of Mn-doped ZnTe. | ||
Based on the BMP model, a polaron consists of a single carrier and magnetic ions within a radius R of the impurity site to which the carrier is bound.18 As shown by the above EDS results, many defects like Te vacancies are formed during annealing treatment, providing the defect sites that form the polarons. The overlap of two polarons will induce the indirect ferromagnetic carrier-ion-carrier interaction. Polarons with a large overlapping region can undergo a strong ferromagnetic interaction that persists to the high temperature. Polarons that overlap only slightly exhibit a weak ferromagnetic couple that exists only at low temperature and disappears gradually as the temperature rises. Based on this physical model, a higher Mn-doping level introduces more ferromagnetically coupled moments, leading to the increase of Ms-4K with the Mn-doping level. However, given the dependence of Ms-RT on temperature, the number of polarons that exhibit a weak ferromagnetic interaction increases with the Mn content in the samples with an Mn-doping level that exceeds 13 at.%. As the measuring temperature increases, thermal disturbance gradually destroys the weak ferromagnetic couplings, causing Ms-RT to decrease as the Mn-doping level increases between 13 at.% and 18 at.%. The isolated polarons and Mn ions do not couple to each other to generate PM, as is clearly the case for samples with Mn-doping levels of greater than 13 at.%.
Experimental
1 Hydrothermal synthesis of Mn-doped ZnTes
Mn-doped ZnTes with various Mn-doping levels were synthesized using a hydrothermal method. The reagents Na2TeO3 (0.0734 g), Zn(CH3COO)2·2H2O (0.0253–0.0272 g) and Mn(CH3COO)2·4H2O (0.0012–0.0063 g) were dissolved in deionized water and mixed uniformly. The solutions were then moved into 50 mL autoclaves. More deionized water was added to the autoclaves until the total solution volume was 40 mL. The filling ratio of the autoclave was limited to 80%. The filled autoclaves were then heated in an oven to 120 °C for 24 hours. When the hydrothermal reaction was complete, the autoclaves were naturally cooled to room temperature. Deionized water and absolute alcohol were used to wash the as-formed powders several times. Finally, the powders were dried at 50 °C and annealed at 750 °C for 30 min within the H2 atmosphere.2 Characterization
The morphology of the powder was examined using a field-emission scanning electron microscope (FESEM, Hitachi SU8020) and a transmission electron microscope (TEM, JEOL JEM-2100F). An Oxford Instrument INCA energy dispersive spectrometer (EDS) was utilized to determine the composition of each powder. Selected area electron diffraction (SAED) measurements of the nanoparticles were also made using the JEOL JEM-2100F. X-ray diffraction (XRD) measurements were made using a PANalytical X'Pert PRO diffractometer with Cu Kα radiation to characterize the phase structures of each powder. The magnetic properties of the samples were analyzed using a superconducting quantum interference device magnetometer (SQUID-VSM, Quantum Design). Zero-field-cooled (ZFC) and field-cooled (FC) M–T curves were obtained at temperatures from 4 K to 300 K in an applied field of 100 Oe. Magnetic hysteresis (M–H) loops were obtained at 4 K, 30 K, 100 K, 200 K and 300 K in magnetic fields from −70 to 70 kOe. The X-ray absorption spectroscopic (XAS) measurements, including the X-ray absorption near-edge structures (XANES) and extended X-ray absorption fine structures (EXAFS) at the Zn and Mn K-edges, were made at the BL 07A beamline of the Taiwan Light Source (TLS), Hsinchu.Conclusions
Mn-doped ZnTe nanoparticles with various doping levels were synthesized by the hydrothermal method. Single-phase Mn-doped ZnTe is obtained at an Mn-doping level of 3 at.%, while MnO was detected in the samples with Mn-doping levels of higher than 6 at.%. XAS analysis revealed that Mn ions that were doped into a ZnTe lattice occupied the sites of the Zn ions and exhibited a valence state of less than 2+. All samples exhibited both FM and PM. Samples that were doped with 3 at.% and 6 at.% Mn also exhibited SPM and AFM. The BMP mechanism is mainly responsible for the FM. Overlapping polarons cause the FM coupling, while the isolated polarons and Mn ions are responsible for PM. SPM and AFM are attributable to the small size of some of the FM nanoparticles and the carrier-mediated interaction among Mn ions, respectively.Acknowledgements
This work was supported by National Natural Science Foundation of China (no. 11274086), Anhui Provincial Natural Science Foundation of China (no. 1208085MA05), National Science Council of Taiwan (no. NSC 103-2923-M-006-001), GRO Project of Samsung Advanced Institute of Technology and Opening Project of National Laboratory of Solid State Microstructure of Nanjing University. The authors also acknowledge the staff of NSRRC for their technical support.Notes and references
- H. Ohno, Science, 1998, 281, 951–956 CrossRef CAS.
- S. A. Wolf, D. D. Awschalom, R. A. Buhrman, J. M. Daughton, S. Von Molnár, M. L. Roukes, A. Y. Chtchelkanova and D. M. Treger, Science, 2001, 294, 1488–1495 CrossRef CAS PubMed.
- R. A. Torquato, S. E. Shirsath, R. H. G. A. Kiminami and A. C. F. M. Costa, Ceram. Int., 2014, 40, 6553–6559 CrossRef CAS PubMed.
- Y. Liu and B. G. Liu, J. Phys. D: Appl. Phys., 2007, 40, 6791–6796 CrossRef CAS.
- L. M. Sandratskii and P. Bruno, J. Phys.: Condens. Matter, 2003, 15, L585–L590 CrossRef CAS.
- X. L. Wang, S. X. Dou and C. Zhang, NPG Asia Mater., 2010, 2, 31–38 CrossRef.
- S. Bhattacharyya, D. Zitoun, Y. Estrin, O. Moshe, D. H. Rich and A. Gedanken, Chem. Mater., 2009, 21, 326–335 CrossRef CAS.
- W. Szuszkiewicz, J. F. Morhange, E. Dynowska, E. Janik, W. Zaleszczyk, A. Presz, G. Karczewski and T. Wojtowicz, J. Phys.: Conf. Ser., 2007, 92, 012040 CrossRef.
- D. R. Reddy and B. K. Reddy, Appl. Phys. Lett., 2002, 81, 460–462 CrossRef CAS PubMed.
- W. T. Yao and S. H. Yu, Adv. Funct. Mater., 2008, 18, 3357–3366 CrossRef CAS.
- N. Akdoğan, H. Zabel, A. Nefedov, K. Westerholt, H. W. Becker, S. Gök, R. Khaibullin and L. Tagirov, J. Appl. Phys., 2009, 105, 043907 CrossRef PubMed.
- H. L. Su, S. Y. Huang, Y. F. Chiang, J. C. A. Huang, C. C. Kuo, Y. W. Du, Y. C. Wu and R. Z. Zuo, Appl. Phys. Lett., 2011, 99, 102508 CrossRef PubMed.
- L. Schneider, S. V. Zaitsev, W. Jin, A. Kompch, M. Winterer, M. Acet and G. Bacher, Nanotechnology, 2009, 20, 135604 CrossRef CAS PubMed.
- Z. L. Lu, H. S. Hsu, Y. H. Tzeng, F. M. Zhang, Y. W. Du and J. C. A. Huang, Appl. Phys. Lett., 2009, 95, 102501 CrossRef PubMed.
- T. Feng, G. Q. Zha, J. Yang, J. Li, Z. Jiang, L. Y. Xu, T. Wang and W. Q. Jie, J. Phys.: Conf. Ser., 2013, 430, 012087 CrossRef.
- J. Yano and V. K. Yachandra, Photosynth. Res., 2009, 102, 241–254 CrossRef CAS PubMed.
- J. M. D. Coey, M. Venkatesan and C. B. Fitzgerald, Nat. Mater., 2005, 4, 173–179 CrossRef CAS PubMed.
- A. C. Durst, R. N. Bhatt and P. A. Wolff, Phys. Rev. B: Condens. Matter Mater. Phys., 2002, 65, 235205 CrossRef.
- M. El-Hilo and A. A. Dakhel, J. Magn. Magn. Mater., 2011, 323, 2202–2205 CrossRef CAS PubMed.
- T. Dietl, Semicond. Sci. Technol., 2002, 17, 377–392 CrossRef CAS.
- S. Kuroda, N. Nishizawa, K. Takita, M. Mitome, Y. Bando, K. Osuh and T. Dietl, Nat. Mater., 2007, 6, 440–446 CrossRef CAS PubMed.
- D. Ferrand, J. Cibert, A. Wasiela, C. Bourgognon, S. Tatarenko and G. Fishman, Phys. Rev. B, 2001, 63, 085201 CrossRef.
- M. A. Morales, R. Skomski, S. Fritz, G. Shelburne, J. E. Shield, M. Yin, S. O'Brien and D. L. Leslie-Pelecky, Phys. Rev. B, 2007, 75, 134423 CrossRef.
- G. H. Lee, S. H. Huh, J. W. Jeong, B. J. Choi, S. H. Kim and H. C. Ri, J. Am. Chem. Soc., 2002, 124, 12094–12095 CrossRef CAS PubMed.
- M. Ghosh, K. Biswas, A. Sundaresan and C. N. R. Rao, J. Mater. Chem., 2006, 16, 106–111 RSC.
Footnote |
| † Electronic supplementary information (ESI) available. See DOI: 10.1039/c4ra08520e |
| This journal is © The Royal Society of Chemistry 2014 |