High pressure superconducting phase of BI3: an ab initio study
Defang Duan,
Xiaoli Huang,
Changbo Chen,
Fubo Tian,
Kuo Bao,
Da Li,
Yunxian Liu,
Hongyu Yu,
Bingbing Liu and
Tian Cui*
State Key Laboratory of Superhard Materials, College of Physics, Jilin University, Changchun 130012, People's Republic of China. E-mail: cuitian@jlu.edu.cn
First published on 23rd June 2014
Abstract
Using the ab initio evolutionary algorithm for crystal structure prediction, we successfully obtained the high pressure crystal structure of BI3 with P21/c space group, which was characterized as the B2I6 dimer analogous to the diborane molecule. This structure has been supported by excellent agreement between the theoretical and experimental equations of state, X-ray diffraction data, and the positive pressure dependence of Tc. Moreover, the P21/c structure is both dynamically and mechanically stable through phonon and elastic constants calculations. Further analysis reveals a superconducting mechanism in which the vibrations of iodine atoms dominate the superconductivity of BI3. In addition, the positive pressure dependence Tc is mainly attributed to the increase of the EPC parameter λ, the logarithmic average phonon frequency ωlog, and the electronic density of states at the Fermi level N(εf).
Introduction
Molecular crystals have drawn considerable attention for several years and have been studied extensively to understand the relationship between structure and properties.1,2 Weak intermolecular interactions, such as van der Waals forces, electrostatic forces and hydrogen bonding, play fundamental roles in defining the crystal and electronic structures of molecular crystals. High pressures can significantly reduce the distance between the molecules and change the strength of intermolecular interactions, resulting in a variety of novel phenomenon in molecular crystals such as structural transitions, metallizations, and superconductivity.Solid hydrogen (H2) is a typical example of a molecular crystal that was predicted to be a room-temperature superconductor under high pressure3,4 even though its metallization is still controversial in static pressure experiments.5,6 As an alternative, hydrogen-rich molecular crystals such as group IV hydrides (SiH4, GeH4, SnH4) are extensively explored because their metallization can occur at relatively low pressures, and they present a high superconducting critical temperature.7–11 Another example is iodine, in part as an analog to H2, which undergoes pressure-induced metallization and has a monatomic phase exhibiting superconductivity at a higher pressure range.12–14 Furthermore, some iodide crystals (such as molecular crystals BI3 and SnI4) are also reported to experience a structural phase transition, metallization, and superconductivity under pressure.15–19 Insight into superconductivity under pressure can be obtained either from the conventional Eliashberg theory20 or from the non-traditional approach of local electron–electron interactions that have been successfully applied to nanosystems and organic molecules.21 It is inspiring that the separate condensation of electron charge and spin degrees provides a new route for superconductivity.22
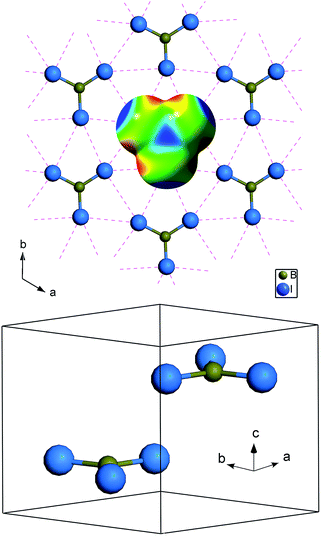
BI3 molecule is a planar equilateral triangle structure formed with the boron atom at the center and three iodine atoms at the corners. At ambient conditions, the molecule crystallizes into a hexagonal structure (P63/m symmetry),23 which is layered with molecules lying in the planes perpendicular to the c axis, as shown in Fig. 1. Molecules are weakly bonded to those in the adjacent layers by van der Waals forces. The interactions inside one molecular plane are more complicated and include intramolecular covalent and intermolecular halogen⋯halogen (I⋯I) interactions. Fig. 1 shows the molecular structure of BI3 and its electrostatic potential on the molecular surface (red indicates negative and blue indicates positive). The positive region around the iodine atom cap would approach the negative “bay” between two the iodine atoms in the neighboring molecules. Each iodine atom in a BI3 molecule contains a positive cap and negative rim, and thus halogen⋯halogen interactions are key interactions in the BI3 crystal.
High-pressure phase transitions and electronic properties of BI3 have been investigated experimentally. A Raman spectral study showed that there was no obvious phase transition up to 5 GPa.24 Later, X-ray diffraction experiments revealed a structural phase transition at 6.2 GPa to a new phase with a face-centered-cubic lattice of iodine atoms.15 Resistivity measurements showed that the new phase turned metallic at 23 GPa and exhibited superconductivity above 27 GPa.15–17 The pressure dependence of Tc was positive, changing from 0.5 to 1.9 K between 27 and 65 GPa. Because the atomic X-ray scattering power of boron is less than that of iodine, boron atoms were not detected. In a recent theoretical study, Yao et al. calculated the high pressure structure of BI3 with P![[1 with combining macron]](https://www.rsc.org/images/entities/char_0031_0304.gif) symmetry by performing a metadynamics algorithm and constructing fcc supercells in which I atoms occupy a fcc lattice and B atoms occupy interstitial sites.25
symmetry by performing a metadynamics algorithm and constructing fcc supercells in which I atoms occupy a fcc lattice and B atoms occupy interstitial sites.25
In the present work, we searched high-pressure structures of BI3 by the ab initio evolutionary algorithm USPEX (Universal structure predictor: Evolutionary Xtallography).26,27 The method employed here is designed to require only the chemical composition for a given compound to search for stable or metastable structures at given P/T conditions and has been correct in predicting high-pressure structures for various systems.28,29 It is found that the planar molecular BI3 crystal transforms to the dimer form with space group P21/c, and its superconductivity is mainly attributed to iodine vibrations. Our present study is an attempt to provide a better understanding of the nature of the structural and superconductivity properties of the BI3 crystal under high pressure.
Computational details
Evolutionary structure prediction was performed using the USPEX code in conjunction with the ab initio structure relaxations using the density functional theory (DFT), as implemented in the Vienna ab initio simulation package VASP code.30 The generalized gradient approximation (GGA) with the Perdew–Burke–Ernzerhof functional31 was employed because the GGA provides a much better treatment of planar molecular structure than the local density approximation.32 The projector augmented wave (PAW) method33 was adopted for B and I with electronic configurations of 2s22p1 and 5s25p5, respectively. The energy cutoff of 500 eV and appropriate Monkhorst-Pack k meshes were chosen to ensure that the total energy converged to better than 1 meV per atom. The lattice dynamics and electron-phonon coupling (EPC) calculations were carried out using the linear response theory through the Quantum ESPRESSO package.34 Convergence tests gave a kinetic energy cutoff of 50 Ry for the P21/c structure. The q-point mesh in the first BZ of 3 × 2 × 2 for P21/c was adopted in the interpolation of force constants for the phonon dispersion curve calculations. A denser 12 × 8 × 4 k-point mesh for the P21/c structure was used to ensure k-point sampling in convergence with Gaussians of width 0.04 Ry to approximate the zero-width limit in the calculations of the EPC parameter λ.Results and discussion
We performed variable-cell structure prediction simulations using the above mentioned methodology for BI3 with 2 f.u./cell at 1 GPa and 1–4 f.u./cell at pressures of 8 and 15 GPa, respectively. With the given information of chemical composition for crystal structure prediction, we were able to correctly reproduce the observed P63/m structure (Fig. 1) as the most stable structure at 1 GPa. Under high pressure, we got a series of promising candidate structures, as shown in Fig. 2: two monoclinic P21/c (4 f.u./cell) structures, an orthorhombic Imm2 (2 f.u./cell) structure, and a monoclinic C2/m (4 f.u./cell) structure. The lattice parameters and atomic positions of these structures at different pressures are listed in Table 1. The two P21/c structures have the same B2I6 dimer that is isostructural with the diborane molecule but differs in lattice parameters and in the B2I6 dimer packing patterns. In one structure denoted as P21/c (c/a > 1), the B2I6 dimer forms zigzag sheets with c/a > 1 (see in Fig. 2(a)), while in another structure denoted as P21/c (c/a < 1), the B2I6 dimer is characterized by a parallel molecule configuration with c/a < 1 (see in Fig. 2(b)). The Imm2 structure consists of infinite polymeric chains with alternating B and I atoms, as shown in Fig. 2(c), and the C2/m structure is characterized by B2I6 dimers that are isostructural with ethane molecules, as shown in Fig. 2(d).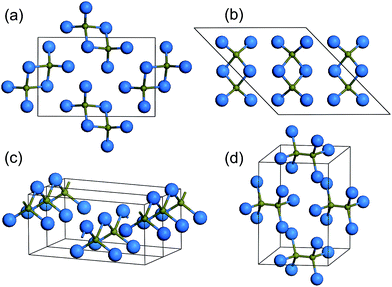 | ||
| Fig. 2 The crystal structure of (a) P21/c with c/a > 1, (b) P21/c with c/a < 1, (c)Imm2, and (d) C2/m. | ||
| Space group | Lattice parameters (Å, °) | Atom | Atomic coordinates (fractional) | ||
|---|---|---|---|---|---|
| x | y | z | |||
| P21/c | a = 5.15 | B(4e) | −0.0980 | 0.1431 | 0.4013 |
| c/a > 1 | b = 7.31 | I(4e) | −0.3476 | 0.3765 | 0.4074 |
| (10 GPa) | c = 12.06 | I(4e) | −0.0161 | 0.1298 | 0.2425 |
| β = 115.51 | I(4e) | 0.3106 | 0.1190 | 0.5769 | |
| P21/c | a = 14.84 | B(4e) | 0.3094 | −0.5010 | 0.7622 |
| c/a < 1 | b = 5.15 | I(4e) | 0.8330 | −0.7502 | 1.5438 |
| (10 GPa) | c = 10.09 | I(4e) | 0.5005 | 0.2301 | 0.3800 |
| β = 148.04 | I(4e) | 0.1689 | 0.2524 | 0.2163 | |
| Imm2 | a = 10.90 | B(2a) | 0.5 | 0.5 | 0.2666 |
| (10 GPa) | b = 3.56 | I(4c) | 0.3354 | 0.5 | 0.0442 |
| c = 5.20 | I(2b) | 0.5 | 0 | 0.5446 | |
| C2/m | a = 6.54 | B(4i) | 0.1316 | 0.5 | 0.5381 |
| (16 GPa) | b = 10.02 | I(8j) | 0.2393 | 0.1761 | 0.2510 |
| c = 5.81 | I(4i) | −0.2582 | 0.5 | 0.7714 | |
| β = 106.77 | |||||
To identify the reasonability of the candidate structures, we compared the X-ray diffraction (XRD) patterns of these structures with the experimental patterns, as shown in Fig. 3. The experimental pattern of BI3 (shown in Fig 3(a)) was obtained from Hamaya et al.'s work.15 Theoretical patterns were obtained by the Reflex module in Materials Studio (MS) with an experimental X-ray wavelength of 0.32940 Å. We note that the XRD pattern for the P21/c (c/a > 1) structure at 10 GPa is in excellent agreement with the experimental pattern, as shown in Fig. 3. The main peak in the XRD patterns for the P21/c (c/a < 1) and Imm2 structures at 2θ = 6.36° is consistent with the experimental data but many the other peaks have inconsistent splitting patterns. In the case of the C2/m structure, the XRD pattern deviates significantly from the experimental pattern.
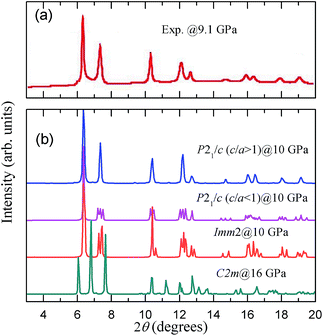 | ||
| Fig. 3 Comparison of the experimental X-ray powder diffraction pattern of high pressure phase at 9.1 GPa with that of our calculated structures at selected pressure. | ||
The enthalpies of our suggested candidate structures relative to the P63/m structure are plotted in Fig. 4. It is shown that the enthalpies of the P21/c (c/a < 1), P21/c (c/a > 1) and Imm2 structures are lower than that of the P63/m structure above pressures of 3.1, 4.4 and 6.2 GPa, respectively. It is illustrated that the P63/m structure becomes unstable between 3.1 to 6.2 GPa, which is consistent with the experimentally observed instability above 6.2 GPa. The P21/c (c/a < 1) structure has the lowest enthalpy up to a pressure of 11.7 GPa where the C2/m structure occurs. However, the XRD pattern for the C2/m structure is not consistent with the experimental data. Another P21/c structure with c/a > 1 has higher enthalpies than the P21/c (c/a < 1) structure but the XRD pattern for P21/c (c/a > 1) is closer to the experimental data than the XRD pattern for the P21/c (c/a > 1) structure. Moreover, it is noted that the enthalpy of P21/c (c/a > 1) is lower than that of the previously proposed P![[1 with combining macron]](https://www.rsc.org/images/entities/char_0031_0304.gif) structure.25 In addition, we compare the calculated equations of state for P63/m and P21/c along with the experimental data, as shown in Fig. 5. Excellent mutual agreement between the theory and experiment provides further support for the validity of the P21/c (c/a > 1) structure. The volume decreases by 4.9% as a result of the P63/m to P21/c (c/a > 1) transition, suggesting a first-order phase transition character. Therefore, on the basis of the comparison of the total energies, X-ray diffraction patterns, and equations of state, we conclude that the structure of the high pressure phase closely resembles the P21/c (c/a > 1) structure. For convenience, we denote the P21/c (c/a > 1) structure as P21/c in the following text.
structure.25 In addition, we compare the calculated equations of state for P63/m and P21/c along with the experimental data, as shown in Fig. 5. Excellent mutual agreement between the theory and experiment provides further support for the validity of the P21/c (c/a > 1) structure. The volume decreases by 4.9% as a result of the P63/m to P21/c (c/a > 1) transition, suggesting a first-order phase transition character. Therefore, on the basis of the comparison of the total energies, X-ray diffraction patterns, and equations of state, we conclude that the structure of the high pressure phase closely resembles the P21/c (c/a > 1) structure. For convenience, we denote the P21/c (c/a > 1) structure as P21/c in the following text.
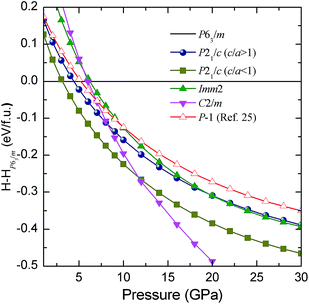 | ||
| Fig. 4 The enthalpies per BI3 unit of our calculated structures as functions of pressure with respect to the enthalpies of the P63/m structure. | ||
 | ||
| Fig. 5 Calculated equations of states (EOS) of BI3 are compared with experimental data. Our calculated results of P63/m and P21/c (c/a > 1) structures are denoted by solid olive triangles and pink squares, respectively. The experimental data are denoted by open circles (ref. 15). | ||
To investigate the dynamic stability of P21/c, its phonon spectrum at different pressures has been calculated. The phonon band dispersion of the P21/c structure can be seen in the left panel of Fig. 6, while the partial phonon density of states is shown in the right panel. The absence of imaginary frequency modes in the entire Brillouin zone of our study pressure range indicates that this structure is dynamically stable. Two separate regions of phonon bands are clearly recognized. As expected, the low frequencies are dominated by the vibrations of the iodine framework, whereas the high end of the spectrum is solely due to the light boron atoms.
 | ||
| Fig. 6 The calculated phonon band structures and projected PHDOS for the P21/c structure at different pressures. | ||
To further understand the mechanical stability of the P21/c structure, the elastic constants have been calculated. A mechanically stable crystal requires the strain energy to be positive, which implies that all the elastic constants Cij satisfy the Born stability criteria.35 For the monoclinic phase crystal, the independent elastic stiffness tensor consists of thirteen components C11, C22, C33, C44, C55, C66, C12, C13, C15, C23, C25, C35, and C46 in the Voigt notation. The Born stability criteria for monoclinic system36 are given by
The elastic constants for the P21/c structure calculated at different pressures are listed in Table 2. All the elastic constants satisfy the Born stability criteria, suggesting that this structure is mechanically stable in our studied pressure range.
| 6 GPa | 15 GPa | 30 GPa | 60 GPa | |
|---|---|---|---|---|
| C11 | 53.481 | 117.269 | 194.261 | 330.469 |
| C22 | 59.190 | 133.276 | 221.742 | 318.474 |
| C33 | 77.613 | 160.565 | 267.566 | 438.777 |
| C44 | 16.055 | 29.734 | 45.799 | 39.176 |
| C55 | 15.993 | 34.407 | 56.256 | 82.709 |
| C66 | 24.517 | 50.439 | 82.768 | 122.927 |
| C12 | 27.980 | 61.104 | 104.871 | 151.013 |
| C13 | 21.709 | 44.896 | 78.567 | 156.757 |
| C15 | 6.955 | 15.967 | 24.942 | 31.068 |
| C23 | 15.379 | 34.131 | 68.477 | 148.927 |
| C25 | −3.032 | −11.442 | −20.041 | −47.894 |
| C35 | −1.262 | −6.654 | −20.041 | −27.083 |
| C46 | −2.937 | −8.617 | −14.061 | −2.662 |
With the knowledge of this halogen⋯halogen interaction model, we propose the following mechanism for the pressure-induced phase transition. At ambient pressure, the main intermolecular interactions are halogen⋯halogen (I⋯I) interactions within layers and van der Waals forces between the adjacent layers. In the low-pressure range, the application of pressure results mainly in the reduction of interlayer distance and the increase in van der Waals interactions. The I⋯I interactions within each layer are also strengthened but the interlayer distance reduces more than the distance between the molecules in the layers. On further compression, the layered structure gradually becomes unstable. At sufficient pressure, the covalent bonds can no longer support the decreased volume and the increased energy of I⋯I network interactions. Thus, boron atoms are pushed out of the molecular plane and form a triangular pyramid. The electrostatic potentials on the triangular pyramid molecular surface are presented in Fig. 7(b). It is fascinating that the boron atom is displayed as positive, while one of the iodine atoms shows a stronger negative rim. Because of these electrostatic interactions in the energetically favored position, each atom favors one short contact involving its positive region and one contact involving its negative region. Therefore, the boron atom closely contacts the iodine atom of another BI3 molecule and forms a B2I6 dimer.
The calculated electronic band structure and the projected density of states (PDOS) for boron and iodine in the P63/m and P21/c structures at different pressures are shown in Fig. 8. At ambient pressure, the P63/m structure is an insulator with an indirect band gap of 2.88 eV. Energy band structures are flat indicating that the P63/m structure is a typical molecular crystal. With increasing pressure, the energy bands become more dispersive and hybridization increases. When the pressure is increased above 30 GPa, the bands of the P21/c structure start to overlap, as shown in Fig. 8(b), signaling the onset of metallization. The metallization was mainly caused by the I-derived valence and I, B-derived conducting bands which are the first to cross the Fermi level.
 | ||
| Fig. 8 The calculated electronic band structure and DOS projected on B and I atoms for the P63/m and P21/c structures at 0 and 30 GPa, respectively. | ||
The superconducting critical temperature can be estimated from the Allen-Dynes modified McMillan equation20  , where λ is the electron-phonon coupling parameter, ωlog is the logarithmic average frequency, and μ* is the Coulomb pseudopotential. This equation has been found to be highly accurate for materials with λ < 1.5. Because of the lack of knowledge of an appropriate value for the Coulomb potential μ*, the accurate prediction of Tc is difficult. For weak coupling materials, an empirical value of 0.1 for μ* is often adopted. However, the value of μ* in some materials is quite complex.37–39 In view of the difficulties in the determination of Coulomb pseudopotential, the Tc of the P21/c structure at several pressures has been calculated with four different values of μ* ranging from 0.04 to 0.10. These results are summarized in Table 3. At a μ* of 0.04, the superconducting critical temperature Tc is 0.24 K at 35 GPa, and increases to 1.9 K at 60 GPa, which agrees well with the experimental value of 1.9 K at 65 GPa.15 Irrespective of the value of μ*, the transition temperature of the P21/c structure has the tendency to increase monotonically with applied pressure, which coincides with the experimental results.15
| P (GPa) | ωlog (K) | N(εf) | λ | Tc (K) μ* = 0.04 | Tc (K) μ* = 0.06 | Tc (K) μ* = 0.08 | Tc (K) μ* = 0.10 |
|---|---|---|---|---|---|---|---|
| 35 | 166.234 | 15.249 | 0.250 | 0.236 | 0.105 | 0.036 | 0.009 |
| 50 | 187.123 | 19.660 | 0.314 | 0.925 | 0.558 | 0.302 | 0.140 |
| 60 | 190.012 | 21.908 | 0.372 | 1.908 | 1.325 | 0.862 | 0.515 |
To investigate the origin of superconducting properties in P21/c structure, we calculated the EPC parameter λ, the logarithmic average phonon frequency ωlog, the electronic density of states at the Fermi level N(εf), and the Eliashberg phonon spectral function α2F(ω). The resulting λ is 0.372 at 60 GPa, indicating that the EPC is fairly weak, and the phonon frequency logarithmic average ωlog calculated directly from the phonon spectrum is 190 K, as listed in Table 3. The theoretical spectral function α2F(ω) and the integrated λ as a function of frequency at 60 GPa are predicted in Fig. 9. In conjunction with partial phonon density of states (seen in Fig. 6), it is found that the contribution from the low frequency iodine translational vibrations constitutes 88.7% of the total λ. The high frequency derived from the boron vibrational mode makes up a section of 11.3%. This result highlights the significant role played by iodine atoms on superconductivity.
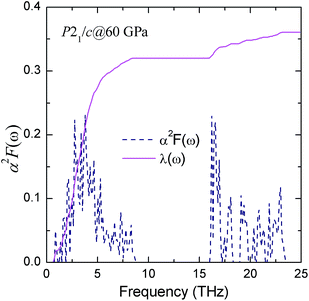 | ||
| Fig. 9 The calculate Eliashberg phonon spectral function α2F(ω) and the electron-phonon integral λ(ω) of P21/c at 60 GPa. | ||
To study the pressure dependence of the superconducting critical temperature, values of λ, ωlog, and N(εf) were computed at selected pressures as summarized in Table 3. Assuming μ* is a constant, two parameters, the EPC parameter λ and the logarithmic average frequency ωlog, determine Tc. From Table 3, we note that as the pressure increases, both λ and ωlog increase, which leads to the positive pressure dependence of Tc. Furthermore, the EPC parameter λ of the P21/c structure is strongly linked to its electronic structure. It is shown that the electronic density of states at the Fermi level N(εf) is enhanced with increasing pressure. Therefore, the increase of Tc with pressure is due to the increase of λ, ωlog, and N(εf), as listed in Table 3.
Conclusions
In summary, we explored the high pressure crystal structure and superconductivity properties of boron triiodide by ab initio calculations. We obtained the crystal structure of the high pressure phase, which is a dimer molecular crystal with space group P21/c. Using this structure, the XRD, EOS, and metallization pressure results, and the positive pressure dependence of Tc are consistent with experimental results. Moreover, we propose a pressure-induced phase transition mechanism with a halogen⋯halogen interaction model. Further electron-phonon coupling calculations show that iodine vibration plays a major role in the superconductivity of BI3, while the contribution from boron vibration is minor. In addition, the superconducting critical temperature Tc increases with increasing pressure, mainly because of the increase of λ, ωlog, and N(εf). This paper is helpful in achieving more insight into the structure and superconductivity of BX3 (X = Cl, Br) systems at high pressure.Acknowledgements
This work was supported by the National Basic Research Program of China (no. 2011CB808200), Program for Changjiang Scholars and Innovative Research Team in University (no. IRT1132), National Natural Science Foundation of China (nos 51032001, 11074090, 11204100, 10979001, 51025206, 11104102), National Fund for Fostering Talents of basic Science (no. J1103202), China Postdoctoral Science Foundation (2012M511326, 2013T60314), and Specialized Research Fund for the Doctoral Program of Higher Education (20120061120008, 20110061120007). Parts of calculations were performed in the High Performance Computing Center (HPCC) of Jilin University.References
- R. J. Hemley, Annu. Rev. Phys. Chem., 2000, 51, 763–800 CrossRef CAS PubMed.
- D. Li, K. Bao, F. Tian, X. Jin, D. Duan, Z. He, B. Liu and T. Cui, RSC Adv., 2014, 4, 203–207 RSC.
- E. Wigner and H. B. Huntington, J. Chem. Phys., 1935, 3, 764–770 CrossRef CAS PubMed.
- N. W. Ashcroft, Phys. Rev. Lett., 1968, 21, 1748 CrossRef CAS.
- M. I. Eremets and I. A. Troyan, Nat. Mater., 2011, 10, 927–931 CrossRef CAS PubMed.
- C.-S. Zha, Z. Liu and R. J. Hemley, Phys. Rev. Lett., 2012, 108, 146402 CrossRef.
- M. I. Eremets, I. A. Trojan, S. A. Medvedev, J. S. Tse and Y. Yao, Science, 2008, 319, 1506–1509 CrossRef CAS PubMed.
- M. Martinez-Canales, A. R. Oganov, Y. Ma, Y. Yan, A. O. Lyakhov and A. Bergara, Phys. Rev. Lett., 2009, 102, 087005 CrossRef.
- G. Gao, A. R. Oganov, A. Bergara, M. Martinez-Canales, T. Cui, T. Iitaka, Y. Ma and G. Zou, Phys. Rev. Lett., 2008, 101, 107002–107004 CrossRef.
- J. S. Tse, Y. Yao and K. Tanaka, Phys. Rev. Lett., 2007, 98, 117004 CrossRef CAS.
- G. Gao, A. R. Oganov, P. Li, Z. Li, H. Wang, T. Cui, Y. Ma, A. Bergara, A. O. Lyakhov, T. Iitaka and G. Zou, Proc. Natl. Acad. Sci. U. S. A., 2010, 107, 1317 CrossRef CAS PubMed.
- K. Takemura, S. Minomura, O. Shimomura and Y. Fujii, Phys. Rev. Lett., 1980, 45, 1881 CrossRef CAS.
- K. Shimizu, N. Tamitani, N. Takeshita, M. Ishizuka, K. Amaya and S. Endo, J. Phys. Soc. Jpn., 1992, 61, 3853–3855 CrossRef CAS.
- D. Duan, X. Jin, Y. Ma, T. Cui, B. Liu and G. Zou, Phys. Rev. B: Condens. Matter Mater. Phys., 2009, 79, 064518–064517 CrossRef.
- N. Hamaya, M. Ishizuka, S. Onoda, J. Guishan, A. Ohmura and K. Shimizu, Phys. Rev. B: Condens. Matter Mater. Phys., 2010, 82, 094506 CrossRef.
- S. Onoda and K. Shimizu, J. Phys.: Conf. Ser., 2008, 121, 032008 CrossRef.
- S. Onoda and K. Shimizu, J. Phys. Soc. Jpn., 2007, 76, 33 CrossRef.
- N. Hamaya, K. Sato, K. Usui-Watanabe, K. Fuchizaki, Y. Fujii and Y. Ohishi, Phys. Rev. Lett., 1997, 79, 4597 CrossRef CAS.
- A. Ohmura, K. Sato, N. Hamaya, M. Isshiki and Y. Ohishi, Phys. Rev. B: Condens. Matter Mater. Phys., 2009, 80, 054201–054207 Search PubMed.
- P. B. Allen and R. C. Dynes, Phys. Rev. B: Solid State, 1975, 12, 905 CrossRef CAS.
- G. W. Fernando, A. N. Kocharian, K. Palandage, T. Wang and J. W. Davenport, Phys. Rev. B: Condens. Matter Mater. Phys., 2007, 75, 085109 CrossRef.
- A. N. Kocharian, G. W. Fernando, K. Palandage and J. W. Davenport, Phys. Rev. B: Condens. Matter Mater. Phys., 2008, 78, 075431 CrossRef.
- B. Albert and K. Schmitt, Z. Anorg. Allg. Chem., 2001, 627, 809–810 CrossRef CAS.
- A. Anderson and L. Lettress, J. Raman Spectrosc., 2002, 33, 173–176 CrossRef CAS.
- Y. Yao, D. D. Klug, R. Martoňák and S. Patchkovskii, Phys. Rev. B: Condens. Matter Mater. Phys., 2011, 83, 214105 CrossRef.
- A. R. Oganov and C. W. Glass, J. Chem. Phys., 2006, 124, 244704–244715 CrossRef PubMed.
- A. R. Oganov, A. O. Lyakhov and M. Valle, Acc. Chem. Res., 2011, 44, 227–237 CrossRef CAS PubMed.
- A. R. Oganov, J. Chen, C. Gatti, Y. Ma, Y. Ma, C. W. Glass, Z. Liu, T. Yu, O. O. Kurakevych and V. L. Solozhenko, Nature, 2009, 457, 863–867 CrossRef CAS PubMed.
- Y. Ma, M. Eremets, A. R. Oganov, Y. Xie, I. Trojan, S. Medvedev, A. O. Lyakhov, M. Valle and V. Prakapenka, Nature, 2009, 458, 182–185 CrossRef CAS PubMed.
- G. Kresse and J. Furthmüller, Phys. Rev. B: Condens. Matter Mater. Phys., 1996, 54, 11169–11186 CrossRef CAS.
- K. B. John and P. Perdew, Int. J. Quantum Chem., 1996, 57, 309–319 CrossRef.
- D. Duan, Y. Liu, Y. Ma, Z. Liu, T. Cui, B. Liu and G. Zou, Phys. Rev. B: Condens. Matter Mater. Phys., 2007, 76, 104113–104118 CrossRef.
- G. Kresse and D. Joubert, Phys. Rev. B: Condens. Matter Mater. Phys., 1999, 59, 1758–1775 CrossRef CAS.
- P. Giannozzi, S. Baroni, N. Bonini, M. Calandra, R. Car, C. Cavazzoni, D. Ceresoli, G. L. Chiarotti, M. Cococcioni, I. Dabo, A. D. Corso, S. d. Gironcoli, S. Fabris, G. Fratesi, R. Gebauer, U. Gerstmann, C. Gougoussis, A. Kokalj, M. Lazzeri, L. Martin-Samos, N. Marzari, F. Mauri, R. Mazzarello, S. Paolini, A. Pasquarello, L. Paulatto, C. Sbraccia, S. Scandolo, G. Sclauzero, A. P. Seitsonen, A. Smogunov, P. Umari and R. M. Wentzcovitch, J. Phys.: Condens. Matter, 2009, 21, 395502 CrossRef PubMed.
- M. Born and K. Huang, Dynamical Theory of Crystal Lattice, Oxford University Press, Oxford, 1954 Search PubMed.
- Z. Wu, E. Zhao, H. Xiang, X. Hao, X. Liu and J. Meng, Phys. Rev. B: Condens. Matter Mater. Phys., 2007, 76, 054115 CrossRef.
- C. Richardson and N. Ashcroft, Phys. Rev. B: Condens. Matter Mater. Phys., 1997, 55, 15130 CrossRef CAS.
- Y. Ma, J. S. Tse, T. Cui, D. D. Klug, L. Zhang, Y. Xie, Y. Niu and G. Zou, Phys. Rev. B: Condens. Matter Mater. Phys., 2005, 72, 014306–014309 CrossRef.
- Y. Yao and J. Tse, Phys. Rev. B: Condens. Matter Mater. Phys., 2007, 75, 134104 CrossRef.
| This journal is © The Royal Society of Chemistry 2014 |

