Dysidaminones A–M, cytotoxic and NF-κB inhibitory sesquiterpene aminoquinones from the South China Sea sponge Dysidea fragilis†‡
Wei-Hua Jiao§
a,
Ting-Ting Xu§ab,
Hao-Bing Yuc,
Feng-Rong Muc,
Jia Lid,
Yu-Shan Lib,
Fan Yanga,
Bing-Nan Hana and
Hou-Wen Lin*ac
aKey Laboratory for Marine Drugs, Department of Pharmacy, Renji Hospital, Shanghai Jiao Tong University School of Medicine, Shanghai 200127, P. R. China. E-mail: franklin67@126.com; Fax: +86 21 58732594; Tel: +86 21 68383346
bDepartment of Pharmacognosy, Shenyang Pharmaceutical University, Shenyang, 110016, P. R. China
cLaboratory of Marine Drugs, Department of Pharmacy, Changzheng Hospital, Second Military Medical University, Shanghai 200003, P. R. China
dNational Center for Drug Screening, Shanghai Institute of Materia Medica, Chinese Academy of Science, Shanghai 201203, P. R. China
First published on 21st January 2014
Abstract
Dysidaminones A–M (1–13), thirteen new sesquiterpene aminoquinones, along with six known ones (14–19), were isolated from the South China Sea sponge Dysidea fragilis. The new structures were determined by extensive spectroscopic analyses, the absolute configurations of 1 and 2 were determined by single-crystal X-ray diffraction analysis, and the absolute configurations of 3–13 were assigned by comparing their CD spectra with those of 1 and 2. Dysidaminones C (3), E (5), H (8), and J (10), 18-methylaminoavarone (14), and 18-aminoavarone (16) showed cytotoxicity against mouse B16F10 melanoma and human NCI-H929 myeloma, HepG2 hepatoma, and SK-OV-3 ovarian cancer cell lines. In addition, these six cytotoxic compounds also exhibited NF-κB inhibitory activity with IC50 values of 0.05–0.27 μM. Preliminary structure–activity relationship analysis indicated that 18-aminosubstituted sesquiterpene quinones with exocyclic double bond (Δ4,11) are cytotoxic agents and NF-κB inhibitors.
Introduction
Nuclear factor κB (NF-κB) regulates the expression of genes involved in many processes that play a key role in the development and progression of cancer such as proliferation, migration and apoptosis.1 Therefore, NF-κB has become an important target for anticancer drug discovery.2 A large number of natural and synthetic compounds have been investigated for NF-κB inhibitory activity, and the majority of the known NF-κB inhibitors to date are plant-derived metabolites, such as isoprenoids and polyphenolics.3 Marine-derived aquamin has been reported to inhibit the NF-κB signaling pathway in vitro,4 however, there are few pure marine natural products were reported to exhibit NF-κB inhibitory activity.Sesquiterpene quinones represent a large group of biologically active marine natural products.5 Although over 200 in number, these mixed biogenesis metabolites were mainly isolated from marine sponges and belong to just a few chemical motifs that as exemplified by spongiaquinone,6 ilimaquinone,7 isospongiaquinone,6,8 frondosin A,9 bolinaquinone,10 dysidavarone A,11 and metachromin C.12 These compounds have sparked interests of researchers by their broad spectrum of bioactivities, including anti-HIV,13 antibacterial,14 antifungal,15 antioxidative,16 antitumor,17 anti-inflammatory,17,18 activating hypoxia-inducible factor 1 (HIF-1),19 and protein tyrosine phosphatase 1B (PTP1B) inhibitory activities.11
In our search for new marine anticancer agents and NF-κB inhibitors from the South China Sea sponges, we have found many chemical motifs from these sponges showed cytotoxic activities, such as isomalabaricane triterpenes,20 cyclopeptides,21 and polyketides,22 however, only the sesquiterpene quinone-containing extract of Dysidea fragilis showed NF-κB inhibitory activity. Therefore we selected the sponge D. fragilis for a detailed investigation. Bioassay-guided fractionation of the extract of D. fragilis yielded a series of sesquiterpene aminoquinones, including thirteen new compounds, dysidaminones A–M (1–13), and six known ones. Herein, we described the isolation, structural determination, and absolute configuration assignments, as well as cytotoxic and NF-κB inhibitory activities of these metabolites.
Results and discussion
The frozen specimen of D. fragilis was exhaustedly extracted with EtOH to give the crude EtOH extract, which was dissolved in water and successively partitioned by n-hexane, CH2Cl2, and n-BuOH to yield three fractions. TLC analysis of the cytotoxic and NF-κB inhibitory CH2Cl2-soluble fraction exhibited two red spots along with several UV-active spots (254 nm), which turned blue-purple by staining with anisaldehyde/sulfuric acid. Normal-phase silica gel flash separation of the CH2Cl2-soluble fraction followed by HPLC purification of selected fractions led to the isolation of thirteen new metabolites, dysidaminones A–M (1–13) as well as six known ones (14–19).Dysidaminone A (1) was isolated as purple-red needles, and its molecular formula was assigned as C25H37NO2 based on the HRESIMS positive ion at m/z 384.2900 [M + H]+ (calculated for C25H38NO2, 384.2903), implying eight degrees of unsaturation. The IR absorption at 1593 cm−1 and the UV characteristic absorptions at 227 and 292 nm indicated the presence of a benzoquinone group.23 Meanwhile the IR absorption at 3392 cm−1 also suggested the presence of an amino group. The 1H NMR spectrum of 1 showed one amino proton (δH 5.58), three olefinic protons (δH 6.35, 5.42, and 5.14), and six methyl signals (δH 1.53, 0.99, 0.93, 0.84, and 0.97 × 2). The 13C NMR spectrum of 1 displayed resonances for two conjugated carbonyl carbons (δC 185.2 and 183.6), three olefinic quaternary carbons (δC 151.2, 146.2, and 144.0), three olefinic methines (δC 131.7, 120.7, and 98.3), six methyls (δC 16.8, 17.8, 18.1, 20.0, and 20.3 × 2), six methylenes (δC 49.9, 36.1, 35.7, 27.53, 26.5, and 19.4), three aliphatic methines (δC 47.2, 37.0, and 27.50), and two aliphatic quaternary carbons (δC 38.5 and 43.1) (Table 1). The two carbonyl carbons and six olefinic carbons accounted for five out of the eight degrees of unsaturation, suggesting the presence of three rings in 1.

| Position | 1 | 2 | 3 | 4 | 5 | |||||
|---|---|---|---|---|---|---|---|---|---|---|
| δH (J in Hz) | δC | δH (J in Hz) | δC | δH (J in Hz) | δC | δH (J in Hz) | δC | δH (J in Hz) | δC | |
| a Assignments of the 13C and 1H signals were made on the basis of HSQC spectral data.b Overlapped signals. | ||||||||||
| 1α | 1.88 mb | 19.4 | 1.87 mb | 19.4 | 1.80 m | 19.0 | 1.91 d (10.0) | 19.4 | 1.04 m | 19.4 |
| 1β | 1.48 m | 1.48 m | 1.48 m | 1.49 m | 1.49 m | |||||
| 2α | 1.87 mb | 26.5 | 2.03 m | 26.5 | 1.88 m | 26.4 | 1.88 m | 26.6 | 1.83 m | 26.5 |
| 2β | 2.01 m | 1.90 mb | 2.03 m | 2.02 m | 2.02 m | |||||
| 3 | 5.14 brs | 120.7 | 5.15 brs | 120.7 | 5.12 brs | 120.4 | 5.16 brs | 120.8 | 5.12 brs | 120.6 |
| 4 | 144.0 | 144.0 | 144.0 | 144.1 | 144.0 | |||||
| 5 | 38.5 | 38.5 | 38.3 | 38.6 | 38.4 | |||||
| 6α | 1.04 m | 36.1 | 1.06 m | 36.1 | 1.03 m | 36.0 | 1.05 m | 36.2 | 1.06 m | 36.0 |
| 6β | 1.62 brd (13.2) | 1.64 dt (13.0, 3.0) | 1.64 dt (12.5, 3.0) | 1.64 dt (12.6, 3.0) | 1.63 m | |||||
| 7 | 1.38 2H m | 27.53 | 1.38 2H m | 27.5 | 1.38 2H m | 27.4 | 1.38 2H m | 27.6 | 1.38 2H m | 27.4 |
| 8 | 1.29 m | 37.0 | 1.29 m | 37.1 | 1.16 m | 37.1 | 1.30 m | 37.0 | 1.27 m | 36.6 |
| 9 | 43.1 | 43.1 | 42.0 | 42.8 | 42.1 | |||||
| 10 | 1.11 d (12.0) | 47.2 | 1.11 brd (11.5) | 47.2 | 1.06 d (12.0) | 46.8 | 1.11 brd (12.0) | 47.2 | 1.02 m | 46.8 |
| 11 | 1.53 3H brs | 18.1 | 1.54 3H brs | 18.1 | 1.52 3H brs | 18.0 | 1.54 3H brs | 18.1 | 1.53 3H brs | 18.0 |
| 12 | 0.99 3H s | 20.0 | 1.00 3H s | 20.0 | 0.98 3H s | 19.9 | 1.00 3H s | 20.0 | 1.00 3H s | 20.0 |
| 13 | 0.93 3H d (6.6) | 16.8 | 0.94 3H d (6.6) | 16.8 | 0.88 3H d (7.5) | 16.6 | 0.95 3H d (6.6) | 16.8 | 0.93 3H d (6.5) | 16.7 |
| 14 | 0.84 3H s | 17.8 | 0.84 3H s | 17.8 | 0.81 3H s | 17.6 | 0.84 3H s | 17.9 | 0.83 3H s | 17.7 |
| 15α | 2.64 d (13.2) | 35.7 | 2.65 d (13.5) | 35.7 | 2.62 d (13.5) | 35.4 | 2.61 d (13.2) | 35.1 | 2.62 d (13.8) | 35.0 |
| 15β | 2.46 d (13.2) | 2.47 d (13.5) | 2.45 d (13.5) | 2.44 d (13.2) | 2.37 d (13.8) | |||||
| 16 | 151.2 | 151.3 | 144.6 | 148.4 | 142.0 | |||||
| 17 | 185.2 | 185.2 | 185.7 | 185.1 | 184.0 | |||||
| 18 | 5.42 s | 98.3 | 5.42 s | 98.2 | 152.7 | 5.53 s | 104.5 | 146.9 | ||
| 19 | 146.2 | 146.2 | 5.49 d (2.5) | 103.6 | 150.0 | 5.41 d (2.4) | 97.7 | |||
| 20 | 183.6 | 183.6 | 185.1 | 185.2 | 185.5 | |||||
| 21 | 6.35 s | 131.7 | 6.36 s | 131.7 | 6.29 d (2.5) | 137.1 | 6.26 s | 134.0 | 6.37 d (2.4) | 139.8 |
| 22a | 2.88 2H t (6.6) | 49.9 | 3.00 m | 48.2 | 3.05 3H s | 42.0 | 3.12 3H s | 42.1 | 2.89 2H t (6.4) | 50.2 |
| 22b | 2.87 m | |||||||||
| 23 | 1.93 m | 27.50 | 1.72 m | 33.9 | 3.05 3H s | 42.0 | 3.12 3H s | 42.1 | 1.94 m | 27.5 |
| 24a | 0.97 3H d (6.6) | 20.3 | 1.46 m | 27.2 | 0.97 3H d (6.7) | 20.3 | ||||
| 24b | 1.22 m | |||||||||
| 25 | 0.97 3H d (6.6) | 20.3 | 0.93 3H t (6.6) | 11.2 | 0.97 3H d (6.7) | 20.3 | ||||
| 26 | 0.96 3H d (7.0) | 17.4 | ||||||||
| NH | 5.58 brs | 5.57 brs | 5.70 brs | |||||||
Interpretation of the 1H–1H COSY and HSQC spectra of 1 led to the assignment of three isolated spin systems: (a) C10–C1–C2–C3–C4–C11, (b) C6–C7–C8–C13, and (c) an isobutylamino group, as shown in Fig. 1. The connectivity of the three spin systems with the remaining atoms was deduced from the correlations observed in the HMBC spectrum. HMBC correlations from H3-12 to C-4, C-5, C-6, and C-10, from H3-13 to C-7, C-8, and C-9, and from H3-14 to C-8, C-9, C-10, and C-15 determined the decalin moiety with four methyl groups (H3-11, H3-12, H3-13, and H3-14) attached at C-4, C-5, C-8, and C-9, respectively (Fig. 1). Further HMBC correlations of H2-15 with C-8, C-9, C-10, C-16, C-17, and C-21, H-18 with C-16 and C-20, as well as H-21 with C-17 and C-19 suggested that the benzoquinone ring was attached at C-15. In addition, the HMBC cross-peaks between H2-22 and C-19 indicated the isobutyl amino group was tethered at C-19, confirmed by the NOESY correlations of H2-22/H-18 and NH/H-18. Thus, the planar structure of 1 was determined as 19-isobutylaminoavarone.
 | ||
| Fig. 1 Selected 1H–1H COSY and HMBC correlations of dysidaminone A (1) (left). Selected NOESY correlations and relative configuration for the sesquiterpenoid moiety in 1 (right). | ||
The relative configuration was established by the correlations observed in the NOESY spectrum of 1 (Fig. 1). The NOESY correlations of H3-12 with H3-14 and H-10 with H-8 indicated the trans fusion of the rings A and B. The NOESY correlations of H3-13/H3-14, H-15β/H3-13, H3-12/H-6β, and H-1β/H3-14 indicated these methyl groups and protons are β-oriented, while the correlations of H-10/H-8/H-6α and H-1α/H-10/H-15α revealed that these protons are α-oriented. The single crystal X-ray diffraction analysis with Cu Kα irradiation confirmed the proposed structure of 1 and also determined the absolute configuration as 5S,8S,9R,10S (Fig. 2). In addition, the CD spectrum of 1 showed a positive Cotton effect at 264 nm and a negative Cotton effect at 305 nm (Fig. 5).
 | ||
| Fig. 2 ORTEP drawing of dysidaminone A (1). | ||
Dysidaminone B (2) showed a pesudomolecular ion at m/z 398.3062 [M + H]+ (calculated for C26H40NO2, 398.3059) in its HRESIMS, appropriate for a molecular formula of C26H39NO2. The NMR data of 2 were nearly identical to those for 1 and supported an avarone core, except for the resonances of 2-methylbutyl amino group (δC/δH 48.2/3.00 and 2.87, 33.9/1.72, 27.2/1.46 and 1.22, 11.2/0.93, and 17.4/0.96). The presence of the amino group was confirmed by the 1H–1H COSY correlations of NH/H2-22, H2-22/H-23, H-23/H-24a, H-24b/H3-25, and H-23/H3-26. In the HMBC spectrum of 2, correlations from H2-22 to C-19 indicated that the amino group was attached at C-19. This assignment was supported by the NOESY correlations of H-18/H2-22 and H-18/NH. Detailed NOESY analysis suggested that compound 2 had the same relative configurations at C-5, C-8, C-9, and C-10 as those of 1 (Fig. S18 in ESI‡). Furthermore, the single crystal X-ray diffraction analysis revealed that 2 had the same absolute configurations at the four chiral centers as those of 1 (Fig. 3), confirmed by the similarity of the CD spectra of 1 and 2 (Fig. 5). Additionally, the X-ray diffraction analysis of 2 also determined the absolute configuration of C-23 in the 2-methylbutyl amino group as S, which was identical with those of nakijiquinones K and L.24
 | ||
| Fig. 3 ORTEP drawing of dysidaminone A (2). | ||
The positive HRESIMS of dysidaminone C (3) provided a pesudomolecular ion at m/z 356.2588 [M + H]+, consistent with the molecular formula of C23H33NO2. The similarity of the 1H and 13C NMR data between 1 and 3 indicated compound 3 possesses the same avarone carbon skeleton, with the exception of two overlapped downfield methyl resonances (δH/δC 3.05 × 2/40.2 × 2) assigned as a unique N,N-dimethyl amino group.25 In addition, the 1H NMR spectrum of 3 (Table 1) displayed two m-coupled protons at δH 5.49 (J = 2.5 Hz) and 6.29 (J = 2.5 Hz), which suggested the different substitution pattern of the amino group in the quinone unit from 1 and 2. The HMBC correlations from H3-22 and H3-23 to C-18 and from H-21 to C-17 and C-19 placed the N,N-dimethyl amino group at C-18, instead of at C-19 in 1 and 2. Detailed analysis of the NOESY data of 3 revealed the same relative configuration as those of 1 and 2. Furthermore, the characteristic positive Cotton effect at 258 nm and negative Cotton effect at 310 nm in the CD spectrum suggested 3 may process the same absolute configuration as those of 1 and 2 (Fig. 5). Dysidaminone C (3) represents the first example of a sesquiterpene quinone that harbors a N,N-dimethyl amino group.
 | ||
| Fig. 4 ORTEP drawing of 19-methyaminoavarone (15). | ||
 | ||
| Fig. 5 Experimental CD spectra of dysidaminones A–D (1–4), G (7), H (8), and 19-methyaminoavarone (15). | ||
Dysidaminone D (4) exhibited the same molecular formula of C23H33NO2 ([M + H]+ m/z 356.2586) as that of 3. A detailed analysis of the 1D and 2D NMR spectroscopic data revealed that 4 bears the same avarone skeleton and N,N-dimethyl amino group as well, suggesting an isomer of compound 3. However, two singlets for the quinone protons at δH 5.53 (H-18) and 6.26 (H-21) in the 1H NMR spectrum of 4 indicated the N,N-dimethyl amino group was located at C-19, instead of C-18 in 3, which was confirmed by the HMBC correlations of both H3-22 and H3-23 with C-19. The NOESY correlations (Fig. S40 in ESI‡) and the similarity of their CD spectra between 3 and 4 suggested compound 4 shares the same absolute configurations with those of 1–3 (Fig. 5).
Dysidaminone E (5), an isomer of 1, gave the same molecular formula of C25H37NO2, as assigned by the HRESIMS ion at m/z 384.2903 [M + H]+. The NMR data (Table 1) indicated that compound 5 possesses the same avarone skeleton and an isobutyl amino group as in 1, and the major difference was the location of the isobutyl amino group. Again, the two doublet quinone protons at δH 5.41 (H-19) and 6.37 (H-21) with the same meta coupling constant of 2.4 Hz, combined with the HMBC correlation from H2-22 with C-18, and NOESY correlations of NH/H-19 and H-19/H2-22 suggested that the isobutyl amino group was positioned at C-18. The relative and absolute configurations of dysidaminone E (5) were consistent with 1, verified by the similar NOESY correlations and similar CD Cotton effects of 1 and 5, as shown in Fig. 5 and 6.
 | ||
| Fig. 6 Experimental CD spectra of dysidaminones E (5), F (6), and J–M (10–13). | ||
Dysidaminone F (6) gave the same molecular formula C26H39NO2 as that of 2 by the HRESIMS ion at m/z 420.2876 [M + Na]+. The 1H and 13C NMR spectroscopic data of 6 closely resembled those of 2, indicative of the same avarone core and 2-methylbutyl amino group in 6. Distinct from the two singlet quinone proton signals of 2, two doublet quinone protons at δH 5.42 and 6.37 with the meta coupling constant of 2.5 Hz were observed for 6, implying the amino group was placed at C-18 in 6 (Table 1) instead of C-19 in 2, which was supported by the HMBC correlation of H2-22/C-18 as well as the NOESY correlations from H2-22 and NH to H-19. The similar Cotton effects in the CD spectra of 2 and 6 suggested the same stereochemistry at C-5, C-8, C-9, and C-10 of 6 as those of 1–5 (Fig. 6). In view of the biosynthetic relationship, it is most likely that compound 6 possesses the same absolute configuration at C-23 as that of dysidaminone B (2).
The HRESIMS data of dysidaminone G (7) suggested a molecular of C29H37NO2, an isomer to 18-phenethylaminoavarone (18).26 Detailed analysis of the 1D and 2D NMR spectroscopic data of 7 indicated that compound 7 has the same avarone skeleton and phenethyl amino group as those of 18, expect for two singlet quinone protons at δH 5.47 and 6.35 in the 1H NMR spectrum of 7. This difference was verified by the HMBC correlation of H2-22/C-19 and the NOESY correlations of H-18/H2-22 and H-18/NH, supporting the assignment of the phenethyl amino group at C-19. The relative and absolute configurations of dysidaminone G (7) were determined the same as those of 1–6 by the identical NOSEY correlations and the similar CD Cotton effects to those of 1–6 as shown in Fig. 5.
Dysidaminone H (8) was isolated as purple-red powders. The HRESIMS showed a quasimolecular ion at m/z 364.2252 [M + Na]+, consistent with a molecular formula of C22H31NO2. The 1H and 13C NMR data and the information from the 2D NMR studies indicated that compound 8 was a sesquiterpene aminoquinone with a methyl amino group in the quinone unit. However, the olefinic methyl (CH3-11) and the olefinic methine (CH-3) observed for compounds 1–7 was missing in 8, and instead, an exomethylene group and a methylene group were detected at δC 103.1/δH 4.46, 4.45 (CH2-11) and δC 32.9/δH 2.31, 2.08 (CH2-3). In the HMBC spectrum of 8, correlations from the two exomethylene protons H2-11 to C-3, C-4, and C-5 suggested the presence of a exocyclic double bond at Δ4,11 in 8 instead of the cyclohexenyl double bond Δ3,4 in 1–7, which was further supported by the 1H–1H COSY correlations of H-1α/H-2β, H-1α/H-2α, H-2β/H-3α, and H-2α/H-3β as well as HMBC correlations from H3-12 to C-4, C-5, C-6, and C-10 (Fig. 7). The regioisomerization of the carbon–carbon double bond at C-4 showed that 8 possesses a neoavarone skeleton instead of the avarone skeleton in 1–7.27 In addition, placement of the N-methyl at C-18 was supported by the HMBC correlation of N-methyl at δH 2.83 with C-18 at δH 147.8. The stereocenters of 8 were indirectly established on the basis of coupling constants, NOESY correlations (Fig. 7), and close NMR similarity of 8 to 1–7. The large coupling constant of H-10 (J = 12 Hz) coupled with the NOESY correlations of H3-13/H3-14, H3-12/H3-14, and H-10/H-8 revealed 8 had the same relative configurations with those of 1–7, as depicted in Fig. 7. In the CD spectrum of 8, the positive Cotton effect at 264 nm and negative Cotton effect at 315 nm as shown in Fig. 5 was also identical to 1–7, therein supporting the same absolute configuration 5S,8S,9R,10S for 8.
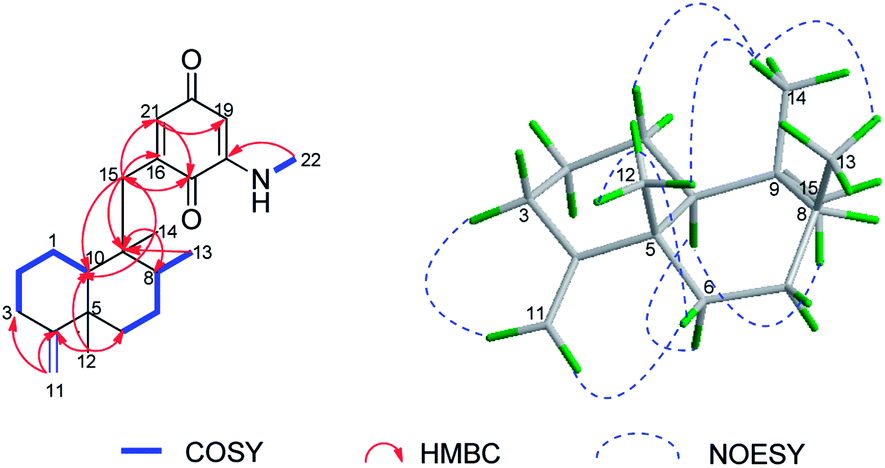 | ||
| Fig. 7 Selected 1H–1H COSY and HMBC correlations of dysidaminone H (8) (left). Selected NOESY correlations and relative configuration for the sesquiterpenoid moiety in 8 (right). | ||
Dysidaminone I (9) bears the same molecular formula and the same neoavarone skeleton as compound 8 evidenced by its HRESIMS, 1D, and 2D NMR spectra, while the singlet quinone proton H-21 in the 1H NMR spectrum of 9 different with the doublet corresponding proton (J = 2.5 Hz) of 8 (Table 2), suggested the methyl amino group was attached at C-19 in 9, instead of C-18 in 8. The similar NOESY correlations as well as the positive Cotton effect at 281 nm and negative Cotton effect at 304 nm in the CD spectrum of 9 established the same stereochemistry with that of 8 (Fig. 6).
| Position | 6 | 7 | 8 | 9 | 10 | |||||
|---|---|---|---|---|---|---|---|---|---|---|
| δH (J in Hz) | δC | δH (J in Hz) | δC | δH (J in Hz) | δC | δH (J in Hz) | δC | δH (J in Hz) | δC | |
| a Assignments of the 13C and 1H signals were made on the basis of HSQC spectral data.b Overlapped signals. | ||||||||||
| 1α | 1.86 mb | 19.4 | 1.90 mb | 19.4 | 1.92 m | 22.7 | 2.01 m | 22.7 | 1.82 mb | 22.4 |
| 1β | 1.51 m | 1.49 m | 1.49 m | 1.49 m | 1.54 m | |||||
| 2α | 2.02 m | 26.5 | 1.87 mb | 26.5 | 1.18 m | 28.1 | 1.31 m | 28.1 | 1.86 mb | 28.2 |
| 2β | 1.81 mb | 2.03 m | 1.85 m | 1.88 m | 1.27 m | |||||
| 3α | 5.13 brs | 120.6 | 5.15 brs | 120.7 | 2.08 m | 32.9 | 2.09 m | 32.9 | 2.29 m | 32.8 |
| 3β | 2.31 td (13.5, 5.0) | 2.32 td (13.5, 5.0) | 2.07 m | |||||||
| 4 | 144.0 | 144.0 | 159.6 | 160.0 | 159.6 | |||||
| 5 | 38.5 | 38.6 | 40.2 | 40.4 | 40.2 | |||||
| 6α | 1.06 m | 36.0 | 1.05 m | 36.1 | 1.39 m | 36.7 | 1.37 m | 36.8 | 1.12 m | 36.8 |
| 6β | 1.64 dt (13.0, 3.0) | 1.64 dt (12.6, 3.0) | 1.54 m | 1.54 m | 1.49 dd (13.2, 3.0) | |||||
| 7 | 1.36 2H m | 27.4 | 1.38 2H m | 27.6 | 1.43 2H m | 27.4 | 1.42 m | 27.6 | 1.42 2H,m | 27.5 |
| 8 | 1.27 m | 36.6 | 1.29 m | 37.1 | 1.26 m | 36.9 | 1.26 m | 37.4 | 1.39 m | 37.4 |
| 9 | 42.1 | 43.1 | 42.5 | 43.5 | 42.5 | |||||
| 10 | 1.04 d (11.5) | 46.8 | 1.10 m | 47.3 | 0.77 dd (12.0, 2.0) | 49.0 | 0.88 m | 49.4 | 0.79 dd (12.6, 2.4) | 49.3 |
| 11a | 1.53 3H brs | 18.0 | 1.54 3H d (1.2) | 18.0 | 4.45 s | 103.1 | 4.46 s | 102.9 | 4.46 s | 103.1 |
| 11b | 4.44 s | 4.45 s | 4.45 s | |||||||
| 12 | 1.00 3H s | 20.0 | 1.00 3H s | 20.0 | 1.04 3H s | 20.6 | 1.05 3H s | 20.6 | 1.04 3H s | 20.6 |
| 13 | 0.93 3H d (6.6) | 16.7 | 0.94 3H d (6.6) | 16.8 | 0.92 3H d (7.5) | 16.8 | 0.94 3H d (7.5) | 17.0 | 0.89 3H d (6.6) | 16.7 |
| 14 | 0.83 3H s | 17.7 | 0.84 3H s | 17.8 | 0.84 3H s | 17.6 | 0.85 3H s | 17.7 | 0.83 3H s | 17.5 |
| 15α | 2.63 d (13.5) | 35.0 | 2.64 d (13.2) | 35.8 | 2.54 d (13.5) | 34.9 | 2.58 d (13.0) | 35.7 | 2.58 d (13.8) | 35.4 |
| 15β | 2.38 d (13.5) | 2.47 d (13.2) | 2.34 d (13.5) | 2.44 d (13.0) | 2.39 d (13.8) | |||||
| 16 | 142.0 | 151.2 | 142.0 | 151.2 | 144.6 | |||||
| 17 | 184.0 | 185.3 | 183.8 | 185.1 | 185.0 | |||||
| 18 | 147.0 | 5.47 s | 98.6 | 147.8 | 5.42 s | 98.2 | 152.8 | |||
| 19 | 5.42 d (2.5) | 97.6 | 145.9 | 5.40, d (2.5) | 97.6 | 147.1 | 5.49 d (2.5) | 103.7 | ||
| 20 | 185.5 | 183.4 | 185.4 | 183.5 | 185.7 | |||||
| 21 | 6.37 d (2.5) | 139.8 | 6.35 s | 131.8 | 6.32 d (2.5) | 139.8 | 6.30 s | 131.7 | 6.25 d (2.4) | 137.0 |
| 22a | 3.00 m | 48.5 | 3.35 2H q (7.2) | 43.5 | 2.83 3H d (5.5) | 29.1 | 2.84 3H d (5.5) | 28.9 | 3.05 3H s | 41.9 |
| 22b | 2.87 m | |||||||||
| 23 | 1.73 m | 33.8 | 2.93 2H t (7.2) | 34.4 | 3.05 3H s | 41.9 | ||||
| 24a | 1.43 m | 27.2 | 137.9 | |||||||
| 24b | 1.22 m | |||||||||
| 25 | 0.92 3H t (6.6) | 11.1 | 7.20 d (7.8) | 128.6 | ||||||
| 26 | 0.95 3H d (7.0) | 17.4 | 7.33 t (7.8) | 128.8 | ||||||
| 27 | 7.25 t (7.8) | 126.9 | ||||||||
| 28 | 7.33 t (7.8) | 128.8 | ||||||||
| 29 | 7.20 d (7.8) | 128.6 | ||||||||
| NH | 5.69 brs | 5.55 brs | 5.67 brs | 5.58 brs | ||||||
Dysidaminone J (10) showed a molecular formula of C23H33NO2 as determined by the HRESIMS ion at m/z 356.2588 [M + H]+, different with that of 8 by addition of CH2. Analysis of its 1H and 13C NMR data (Table 2) implied that compound 10 is a congenor of 8, which possesses a neoavarone skeleton with a N,N-dimethyl amino group. The HMBC correlations from H3-22 and H3-23 to C-18 determined the placement of N,N-dimethyl amino group at C-18. The identical NOESY correlations and the similar CD absorptions (positive at 271 nm and negative at 312 nm) of 10 assigned the same relative and absolute configurations as those of 1–9 (Fig. 6).
Dysidaminones K (11) and L (12) showed molecular formulas of C25H37NO2 and C26H39NO2, as determined by the HRESIMS ions at m/z 384.2096 [M + H]+ and m/z 420.2880 [M + Na]+, respectively, which suggested that they are respective isomers of dysidaminones A (1) and B (2). The 1H and 13C NMR spectra of 11 and 12 (Table 3) were also similar to those of 1 and 2, including the same isobutyl amino and 2-methylbutyl amino groups and their substitution patterns. The major differences were the positions of the C-4 double bonds, the olefinic methyls (CH3-11) and the olefinic methines (CH-3) groups in 1 and 2 were replaced by exomethylene and methylene groups in 11 and 12 (Table 3), which was deduced on the basis of the corresponding HSQC, HMBC, and NOESY experiments of 11 and 12. Therefore the structures of 11 and 12 were established as 19-isobutylaminoneoavarone and 19-2-methylbutylaminoneoavarone, respectively. Both of compounds 11 and 12 had the same stereochemistry at C-5, C-8, C-9, and C-10 as those of 1 and 2, which were suggested by their similar CD absorptions with those as shown in Fig. 6. The absolute configuration of C-23 in 12 might also be assigned as S on account of the biosynthetic relationship between compounds 2, 6, and 12.
| Position | 11 | 12 | 13 | |||
|---|---|---|---|---|---|---|
| δH (J in Hz) | δC | δH (J in Hz) | δC | δH (J in Hz) | δC | |
| a Assignments of the 13C and 1H signals were made on the basis of HSQC spectral data.b Overlapped signals. | ||||||
| 1α | 1.92 mb | 22.7 | 1.92 mb | 22.7 | 1.91 mb | 22.7 |
| 1β | 1.48 m | 1.49 m | 1.49 dd (12.6, 3.0) | |||
| 2α | 1.16 m | 28.1 | 1.18 m | 28.1 | 1.16 m | 28.1 |
| 2β | 1.86 mb | 1.87 mb | 1.88 mb | |||
| 3α | 2.09 m | 32.9 | 2.09 m | 32.9 | 2.08 m | 32.9 |
| 3β | 2.30 td (13.8, 3.6) | 2.31 td (13.8, 3.6) | 2.30 m | |||
| 4 | 160.0 | 160.0 | 160.0 | |||
| 5 | 40.4 | 40.4 | 40.4 | |||
| 6α | 1.40 m | 36.8 | 1.39 m | 36.8 | 1.39 m | 36.8 |
| 6β | 1.54 m | 1.53 m | 1.55 m | |||
| 7 | 1.42 2H m | 27.62 | 1.41 2H m | 27.6 | 1.43 2H m | 27.6 |
| 8 | 1.26 m | 37.4 | 1.26 m | 37.4 | 1.26 m | 37.4 |
| 9 | 43.5 | 43.5 | 43.51 | |||
| 10 | 0.88 m | 49.4 | 0.88 m | 49.4 | 0.86 m | 49.4 |
| 11a | 4.46 m | 102.9 | 4.61 s | 102.9 | 4.46 s | 102.9 |
| 11b | 4.45 m | 4.45 s | 4.45 s | |||
| 12 | 1.04 3H s | 20.7 | 1.05 3H s | 20.7 | 1.05 3H s | 20.7 |
| 13 | 0.94 3H d (7.2) | 17.0 | 0.94 3H d (7.0) | 17.0 | 0.94 3H d (6.6) | 17.0 |
| 14 | 0.85 3H s | 17.7 | 0.85 3H s | 17.7 | 0.85 3H s | 17.7 |
| 15α | 2.57 d (13.2) | 35.7 | 2.57 d (13.2) | 35.7 | 2.57 d (13.2) | 35.7 |
| 15β | 2.43 dd (13.2, 1.2) | 2.43 d (13.2) | 2.43 d (13.2) | |||
| 16 | 151.2 | 151.2 | 151.1 | |||
| 17 | 185.1 | 185.1 | 185.2 | |||
| 18 | 5.41 s | 98.3 | 5.42 s | 98.3 | 5.46 s | 98.6 |
| 19 | 146.2 | 146.2 | 145.8 | |||
| 20 | 183.6 | 183.6 | 183.4 | |||
| 21 | 6.30 s | 131.7 | 6.30 s | 131.6 | 6.29 s | 131.7 |
| 22a | 2.89 2H t (6.0) | 50.0 | 3.00 m | 48.2 | 3.55 2H q (6.6) | 43.46 |
| 22b | 2.87 m | |||||
| 23 | 1.94 m | 27.56 | 1.72 m | 33.9 | 2.93 2H t (7.2) | 34.4 |
| 24a | 0.98 3H d (6.6) | 20.3 | 1.46 m | 27.2 | 137.9 | |
| 24b | 1.24 m | |||||
| 25 | 0.98 3H d (6.6) | 20.3 | 0.93 3H t (6.6) | 11.2 | 7.20 days (7.2) | 128.6 |
| 26 | 0.96 3H d (7.0) | 17.4 | 7.33 t (7.2) | 128.9 | ||
| 27 | 7.25 t (7.2) | 126.9 | ||||
| 28 | 7.33 t (7.2) | 128.9 | ||||
| 29 | 7.20 d (7.2) | 128.6 | ||||
| NH | 5.58 brs | 5.69 brs | 5.55 brs | |||
Dysidaminone M (13) gave a molecular formula of C29H37NO2 established by the HRESIMS ion at m/z 432.2906 [M + H]+. Comparison of 1H, 13C and HSQC NMR spectra indicated compound 13 possesses a neoavarone skeleton and a phenethyl amino group (Table 3). The singlet peaks of proton H-21 (δH 6.29, s) and H-18 (δH 5.46, s) combined with the HMBC correlation from H2-22 (δH 3.55) to C-19 (δC 145.8) assigned the placement of the phenethyl amino group at C-19. The NOESY correlations and CD spectrum analysis revealed that 13 possesses the same relative and absolute configurations as those of 1–12 (Fig. 6).
The two red spots exhibited on the TLC of CH2Cl2-soluble fraction were purified and finally determined as two major metabolites, 18-methylaminoavarone (14)28 and 19-methylaminoavarone (15, Fig. 4).29 Additional to the two known compounds, four other known ones, 18-aminoavarone (16), 19-aminoavarone (17),26 18-phenethylaminoavarone (18),26 and popolohuanone D (19),30 were also obtained, and their structures were determined by comparison of their MS and NMR spectroscopic data with the reported values in literature.
All compounds obtained in this study from D. fragilis were tested in terms of their cytotoxicity against mouse B16F10 melanoma cells and human NCI–H929 myeloma, HepG2 hepatoma, and SK-OV-3 ovarian cancer cell lines, using 5-fluorouracil as positive control. Compounds 3, 5, 8, 10, 14, and 16 showed cytotoxicity toward these four cell lines (Table 4). Previous structure–activity relationship (SAR) analysis have shown that sesquiterpne quinones with exo-olefin (Δ4,11) exhibited more potent cytotoxicity than the endo-olefin (Δ3,4) ones,31 which was confirmed by the cytotoxicity of Δ3,4 endo-olefin compounds 1 and 2 to their corresponding Δ4,11 exo-olefin ones 11 and 12. It is also interesting to note that the 18-amino group in quinone substructure is a key structural requirement for sesquiterpne aminoquinones to show cytotoxicity, such as compounds 3, 5, 6, 14, and 16 showed much more potent activity than the 19-aminosubstituted one, 4, 1, 2, 15, and 17. In addition, we also observed that the activity decreases as the length of amino chain increases, such as 3, 5, 6, and 14.
| No. | IC50 (μM) | ||||
|---|---|---|---|---|---|
| NCI-H929 | HepG2 | B16F10 | SK-OV-3 | NF-κB | |
| a 5-Fluorouracil and rocaglamide were used as positive controls. | |||||
| 1 | 15.6 | 21.8 | 65.7 | 73.4 | >10 |
| 2 | 36.4 | 68.9 | 52.9 | 31.8 | >10 |
| 3 | 0.57 | 0.45 | 8.71 | 5.25 | 0.22 |
| 4 | 5.78 | 15.4 | 32.7 | 18.5 | >10 |
| 5 | 1.13 | 0.94 | 9.52 | 4.54 | 0.27 |
| 6 | 7.19 | 8.95 | 5.39 | 5.40 | 1.92 |
| 7 | 16.3 | 18.4 | 35.6 | 27.8 | >10 |
| 8 | 0.71 | 0.62 | 2.45 | 9.65 | 0.23 |
| 9 | 1.39 | 0.88 | 6.28 | 6.22 | 3.14 |
| 10 | 0.87 | 0.45 | 1.43 | 2.89 | 0.11 |
| 11 | 4.58 | 7.86 | 8.14 | 9.41 | 8.62 |
| 12 | 5.18 | 5.81 | 7.56 | 8.41 | >10 |
| 13 | 9.21 | 9.68 | 4.92 | 5.83 | >10 |
| 14 | 0.63 | 1.42 | 4.51 | 6.42 | 0.06 |
| 15 | 2.70 | 7.65 | 3.26 | 9.38 | >10 |
| 16 | 0.88 | 0.68 | 3.64 | 8.15 | 0.05 |
| 17 | 5.86 | 3.67 | 6.31 | 4.81 | 2.63 |
| 18 | 1.76 | 7.13 | 4.73 | 5.88 | 1.52 |
| 19 | 9.24 | 35.4 | >100 | >100 | >10 |
| 5-Fluorouracila | 0.39 | 7.64 | 1.23 | 1.72 | — |
| Rocaglamide | — | — | — | — | 0.12 |
To further investigate the bioactivity of these compounds, all the nineteen chemicals were tested in NF-κB inhibition assay, using rocaglamide as positive control. It is intriguing to find that the six most cytotoxic compounds 3, 5, 8, 10, 14, and 16 showed inhibitory activity with IC50 values of 0.05–0.27 μM (Table 4).
Conclusions
In summary, nineteen sesquiterpene aminoquinones, including thirteen new ones, dysidaminones A–M (1–13), and six known ones (14–19) were isolated from the South China Sea sponge D. fragilis. The new structures were determined by extensive spectroscopic analyses, and their absolute configurations were assigned by single-crystal X-ray diffraction and CD spectra. Cytotoxicity of all these compounds were evaluated, and dysidaminones C (3), F (5), J (8), L (10), 18-methylaminoavarone (14), and 18-aminoavarone (16) showed cytotoxicity against four cancer cell lines. In addition, these six compounds also showed NF-κB inhibitory activity. Preliminary SAR analysis showed that sesquiterpne aminoquinones containing 18-amino group and Δ4,11 double bond in the decalin ring exhibited much more potent cytoxicity and NF-κB inhibitory activity than others. Therefore, dysidaminones appeared to offer a new type NF-κB inhibitors, and further sesquiterpene aminoquinone NF-κB inhibitors should contain both the exocyclic Δ4,11 double bond and the 18-amino group.Experimental
General procedures
Optical rotation measurements were conducted on an Autopol I polarimeter (no. 30575, manufactured by Rudolph Research Analytical, Hackettstown, NJ, USA) with a 10 cm length cell operating at λ = 589 nm, corresponding to the sodium D line at room temperature, however, the dark purple-red solution of the test compounds made it difficult to obtain the accurate optical values, therefore the optical values of new compounds were not provided in this section. UV and IR (KBr) spectra were recorded on a Hitachi U-3010 spectrophotometer and Jasco FTIR-400 spectrometer, respectively. CD spectra were obtained on a Jasco J-715 spectropolarimeter. 1H, 13C, DEPT135, 1H–1H COSY, HSQC, HMBC, and NOESY NMR spectra were recorded at room temperature on a Bruker Avance DRX-600 MHz NMR spectrometer with CDCl3 as the solvent and internal standard. Spectra were referenced to residual solvent signals with resonances at δH/δC 7.26/77.0 for CDCl3. ESIMS were obtained using a Finnigan MAT 95 spectrometer, and HRESIMS were measured on an Agilent 6210 LC/MSD TOF mass spectrometer. Column chromatography was conducted using silica gel (65 × 250 or 230 × 400 mesh). Analytical thin-layer chromatography (TLC) systems were performed on percolated silica gel 60 F254 plates. Sephadex LH-20 was purchased from Amersham Pharmacia Biotech AB, Uppsala, Sweden. Purification of the compounds was performed using a Waters Alliance 2695 separation module equipped with a Waters 2998 Photodiode Array (PDA) detector. All chemicals were of analytical grade, solvents for open column chromatography and MPLC were also analytical grade, whereas solvents for HPLC were chromatographic grade. MPLC and HPLC were performed with columns of 50 μm and 5 μm ODS, respectively.Collection and identification of the animal material
Samples of Dysidea fragilis were collected along the coast of Yongxing Island in South China Sea on April 11th, 2011. The voucher number for this collection is XD10403, and a voucher sample is maintained at the Key Laboratory for Marine Drugs, Department of Pharmacy, Renji Hospital, Shanghai Jiao Tong University School of Medicine.Extraction and isolation
The animals (1.2 kg, dry weight) were soaked in 95% EtOH repeatedly to give 92.9 g extract. The extract was dissolved in 1 L water, and partitioned with the same volume of CH2Cl2 four times to yield 32 g CH2Cl2-solvent extract, which was partitioned between 90% aqueous MeOH and n-hexane to give 12 g n-hexane fraction and 20 g aqueous MeOH fraction. After the aqueous MeOH fraction was dissolved in 1 L 60% aqueous MeOH and then partitioned by the same volume of CH2Cl2 five times to afford 10.1 g CH2Cl2-solvent fraction. The 10.1 g CH2Cl2-solvent fraction was subjected to a silica gel chromatography column elucidated with gradient n-hexane and EtOAc, yielding 12 subfractions (DA-DL). The sixth fraction DF (1.58 g) was subjected to size-exclusion chromatography Sephadex LH-20 eluted with CH2Cl2–MeOH (1![[thin space (1/6-em)]](https://www.rsc.org/images/entities/char_2009.gif) :1) to give five fractions DF1–DF5, and the fraction DF2 was further purified by reversed-phase HPLC (YMC, 10 × 250 mm, 2 mL min−1, 290 nm) with a elution of 95% MeOH, to give dysidaminones A (1, 7.5 mg), B (2) (3.3 mg), K (11, 5.0 mg), and L (12) and M (13) (2.1 mg). Fractions DF3 and DF4 were combined together to give DF34 on account of their consistent results in TLC analysis. DF34 was also separated by reversed-phase HPLC eluted by 90% MeOH to afford 18-methylaminoavarone (14, 56.1 mg), 19-methylaminoavarone (15, 48.2 mg), 18-aminoavarone (16, 7.9 mg), and 19-aminoavarone (17, 19.8 mg). The seventh fraction DG (2.81 g) was passed through ODS chromatography column eluted with gradient aqueous MeOH (from 30% to 100%) to give eight subfractions DG1–DG8. Following separation by ODS chromatography eluted with 90% MeOH, the fraction DG8 was passed through size-exclusion chromatography Sephadex LH-20 eluted with CH2Cl2–MeOH (1:1) to give four fractions DG8A–DG8D, and then the fraction DG8B was purified by reversed-phase HPLC with an elution of 92% MeOH at 280 nm, to give metabolites dysidaminones E (5, 7.5 mg), F (6) (4.1 mg), and M (13, 1.6 mg), while the reversed-phase HPLC purification of DG8C by 90% CH3CN at the wavelength of 290 nm resulted in the isolation of dysidaminones G (7, 5.7 mg), I (9, 1.7 mg), and J (10, 2.8 mg). The fraction DK (1.2 g) was firstly separated by Sephadex LH-20 to give three fractions DK1–DF3, popolohuanone D (19, 21.3 mg) was crystallized from the first fraction DK1, and the other two fractions DK2 and DK3 were both isolated by reversed-phase HPLC eluted with 95% MeOH at 290 nm to afford dysidaminones C (3, 3.1 mg), D (4, 2.8 mg), H (8, 4.3 mg), and 18-phenethylaminoavarone (18, 15.2 mg).
ε) 212 (3.95), 227 (3.75), 292 (3.55) nm; CD (MeOH) λ (Δε) 232 (−0.71), 264 (1.68), 305 (−3.91) nm; IR (KBr) νmax 3392, 3357, 2959, 2926, 2855, 1667, 1630, 1593, 1514, 1467, 1221, 840 cm−1; 1H and 13C NMR data, see Table 1 and ESI;‡ ESIMS m/z 406.3 [M + Na]+; HRESIMS m/z 384.2900 [M + H]+ (calculated for C25H38NO2, 384.2903).ε) 212 (4.13), 227 (4.08), 292 (3.87) nm; CD (MeOH) λ (Δε) 233 (−4.66), 273 (2.69), 305 (−7.77) nm; IR (KBr) νmax 3357, 2960, 2927, 1730, 1667, 1631, 1593, 1514, 1463, 1220, 891 cm−1; 1H and 13C NMR data, see Table 1 and ESI;‡ ESIMS m/z 398.3 [M + H]+; HRESIMS m/z 398.3062 [M + H]+ (calculated for C26H40NO2, 398.3059).ε) 209 (3.92), 230 (3.79), 295 (3.43) nm; CD (MeOH) λ (Δε) 221 (−5.13), 232 (−9.13), 258 (0.45), 310 (−0.54) nm; IR (KBr) νmax 3324, 2927, 2856, 1731, 1672, 1636, 1568, 1512, 1454, 1383, 1288, 800 cm−1; 1H and 13C NMR data, see Table 1 and ESI;‡ ESIMS m/z 356.3 [M + H]+; HRESIMS m/z 356.2588 [M + H]+ (calculated for C23H34NO2, 356.2590).ε) 210 (3.97), 227 (3.75), 292 (3.54) nm; CD (MeOH) λ (Δε) 235 (1.61), 241 (−2.22), 268 (1.03), 303 (4.11) nm; IR (KBr) νmax 3356, 2926, 2855, 1731, 1667, 1628, 1593, 1515, 1451, 1224 cm−1; 1H and 13C NMR data, see Table 1 and ESI;‡ ESIMS m/z 356. 3 [M + H]+; HRESIMS m/z 356. 2586 [M + H]+ (calculated for C23H34NO2, 356.2590).ε) 212 (4.02), 226 (3.87), 294 (3.53) nm; CD (MeOH) λ (Δε) 221 (4.89), 228 (−0.14), 275 (4.51) nm; IR (KBr) νmax 3395, 2959, 2926, 2855, 1732, 1669, 1634, 1589, 1511, 1463, 1247, 979, 802 cm−1; 1H and 13C NMR data, see Table 1 and ESI;‡ ESIMS m/z 384.2 [M + H]+; HRESIMS m/z 384.2905 [M + H]+ (calculated for C25H38NO2, 384.2903).ε) 212 (4.12), 227 (4.07), 293 (3.72) nm; CD (MeOH) λ (Δε) 235 (7.61), 251 (1.93), 272 (11.79), 327 (−0.49) nm; IR (KBr) νmax 3392, 2960, 2928, 2873, 1738, 1671, 1634, 1589, 1510, 1463, 1249, 803 cm−1; 1H and 13C NMR data, see Table 2 and ESI;‡ ESIMS m/z 398.4 [M + H]+; HRESIMS m/z 420.2876 [M + Na]+ (calculated for C26H39NO2Na, 420.2878).ε) 212 (4.17), 228 (4.11), 290 (3.85) nm; CD (MeOH) λ (Δε) 233 (−4.35), 268 (4.40), 306 (−6.94) nm; IR (KBr) νmax 3357, 2960, 2926, 2856, 1730, 1666, 1630, 1593, 1513, 1464, 1222, 700 cm−1; 1H and 13C NMR data, see Table 2 and ESI;‡ ESIMS m/z 432.2 [M + H]+; HRESIMS m/z 432.2901 [M + H]+ (calculated for C29H38NO2, 432.2903).ε) 212 (4.04), 227 (3.94), 287 (3.62) nm; CD (MeOH) λ (Δε) 264 (3.34), 315 (−1.09) nm; IR (KBr) νmax 3404, 3323, 2926, 2856, 1732, 1672, 1634, 1588, 1510, 1450, 1420, 1346, 1253, 1083, 892 cm−1; 1H and 13C NMR data, see Table 2 and ESI;‡ ESIMS m/z 364.2 [M + Na]+; HRESIMS m/z 364.2253 [M + Na]+ (calculated for C22H31NO2Na, 364.2252).ε) 211 (3.99), 227 (3.95), 289 (3.62) nm; CD (MeOH) λ (Δε)232 (13.3), 246 (−2.02); 281 (4.01), 304 (−1.02), 315 (1.03) nm; IR (KBr) νmax 3323, 2926, 2855, 1731, 1669, 1629, 1591, 1510, 1451, 1420, 1223, 1035, 798 cm−1; 1H and 13C NMR data, see Table 2 and ESI;‡ ESIMS m/z 364.2 [M + Na]+; HRESIMS m/z 364.2250 [M + Na]+ (calculated for C22H31NO2Na, 364.2252).ε) 213 (4.11), 228 (4.08), 294 (3.78) nm; CD (MeOH) λ (Δε) 210 (17.10), 222 (6.52), 226 (−3.08), 271 (2.07) nm; IR (KBr) νmax 3312, 3083, 2926, 2856, 1738, 1673, 1634, 1578, 1512, 1450, 1258, 892 cm−1; 1H and 13C NMR data, see Table 2 and ESI;‡ ESIMS m/z 356. 2 [M + H]+; HRESIMS m/z 356. 2588 [M + H]+ (calculated for C23H34NO2, 356.2590).ε) 212 (4.06), 227 (3.91), 290 (3.70) nm; CD (MeOH) λ (Δε) 214 (15.55), 248 (−0.34), 275 (1.22) nm; IR (KBr) νmax 3308, 3089, 2956, 2926, 2855, 1665, 1622, 1591, 1580, 1504, 1449, 1320, 1223, 894 cm−1; 1H and 13C NMR data, see Table 3 and ESI;‡ ESIMS m/z 384.3 [M + H]+; HRESIMS m/z 384.2905 [M + H]+ (calculated for C25H38NO2, 384.2903).ε) 212 (4.07), 227 (4.05), 291 (3.81) nm; CD (MeOH) λ (Δε) 211 (19.48), 251 (−0.33), 277 (1.85) nm; IR (KBr) νmax 3357, 2956, 2927, 2855, 1731, 1667, 1631, 1590, 1514, 1463, 1220, 893 cm−1; 1H and 13C NMR data, see Table 3 and ESI;‡ ESIMS m/z 398.4 [M + H]+; HRESIMS m/z 420.2880 [M + Na]+ (calculated for C26H39NO2Na, 420.2878).ε) 211 (4.16), 228 (4.09), 290 (3.91) nm; CD (MeOH) λ (Δε)234 (−1.33), 269 (5.15), 326 (−0.59) nm; IR (KBr) νmax 3311, 2958, 2926, 2855, 1729, 1665, 1626, 1593, 1508, 1454, 1322 cm−1; 1H and 13C NMR data, see Table 3 and ESI;‡ ESIMS m/z 432.2 [M + H]+; HRESIMS m/z 432.2906 [M + H]+ (calculated for C29H38NO2, 432.2903).
:1) to give five fractions DF1–DF5, and the fraction DF2 was further purified by reversed-phase HPLC (YMC, 10 × 250 mm, 2 mL min−1, 290 nm) with a elution of 95% MeOH, to give dysidaminones A (1, 7.5 mg), B (2) (3.3 mg), K (11, 5.0 mg), and L (12) and M (13) (2.1 mg). Fractions DF3 and DF4 were combined together to give DF34 on account of their consistent results in TLC analysis. DF34 was also separated by reversed-phase HPLC eluted by 90% MeOH to afford 18-methylaminoavarone (14, 56.1 mg), 19-methylaminoavarone (15, 48.2 mg), 18-aminoavarone (16, 7.9 mg), and 19-aminoavarone (17, 19.8 mg). The seventh fraction DG (2.81 g) was passed through ODS chromatography column eluted with gradient aqueous MeOH (from 30% to 100%) to give eight subfractions DG1–DG8. Following separation by ODS chromatography eluted with 90% MeOH, the fraction DG8 was passed through size-exclusion chromatography Sephadex LH-20 eluted with CH2Cl2–MeOH (1:1) to give four fractions DG8A–DG8D, and then the fraction DG8B was purified by reversed-phase HPLC with an elution of 92% MeOH at 280 nm, to give metabolites dysidaminones E (5, 7.5 mg), F (6) (4.1 mg), and M (13, 1.6 mg), while the reversed-phase HPLC purification of DG8C by 90% CH3CN at the wavelength of 290 nm resulted in the isolation of dysidaminones G (7, 5.7 mg), I (9, 1.7 mg), and J (10, 2.8 mg). The fraction DK (1.2 g) was firstly separated by Sephadex LH-20 to give three fractions DK1–DF3, popolohuanone D (19, 21.3 mg) was crystallized from the first fraction DK1, and the other two fractions DK2 and DK3 were both isolated by reversed-phase HPLC eluted with 95% MeOH at 290 nm to afford dysidaminones C (3, 3.1 mg), D (4, 2.8 mg), H (8, 4.3 mg), and 18-phenethylaminoavarone (18, 15.2 mg).
ε) 212 (3.95), 227 (3.75), 292 (3.55) nm; CD (MeOH) λ (Δε) 232 (−0.71), 264 (1.68), 305 (−3.91) nm; IR (KBr) νmax 3392, 3357, 2959, 2926, 2855, 1667, 1630, 1593, 1514, 1467, 1221, 840 cm−1; 1H and 13C NMR data, see Table 1 and ESI;‡ ESIMS m/z 406.3 [M + Na]+; HRESIMS m/z 384.2900 [M + H]+ (calculated for C25H38NO2, 384.2903).ε) 212 (4.13), 227 (4.08), 292 (3.87) nm; CD (MeOH) λ (Δε) 233 (−4.66), 273 (2.69), 305 (−7.77) nm; IR (KBr) νmax 3357, 2960, 2927, 1730, 1667, 1631, 1593, 1514, 1463, 1220, 891 cm−1; 1H and 13C NMR data, see Table 1 and ESI;‡ ESIMS m/z 398.3 [M + H]+; HRESIMS m/z 398.3062 [M + H]+ (calculated for C26H40NO2, 398.3059).ε) 209 (3.92), 230 (3.79), 295 (3.43) nm; CD (MeOH) λ (Δε) 221 (−5.13), 232 (−9.13), 258 (0.45), 310 (−0.54) nm; IR (KBr) νmax 3324, 2927, 2856, 1731, 1672, 1636, 1568, 1512, 1454, 1383, 1288, 800 cm−1; 1H and 13C NMR data, see Table 1 and ESI;‡ ESIMS m/z 356.3 [M + H]+; HRESIMS m/z 356.2588 [M + H]+ (calculated for C23H34NO2, 356.2590).ε) 210 (3.97), 227 (3.75), 292 (3.54) nm; CD (MeOH) λ (Δε) 235 (1.61), 241 (−2.22), 268 (1.03), 303 (4.11) nm; IR (KBr) νmax 3356, 2926, 2855, 1731, 1667, 1628, 1593, 1515, 1451, 1224 cm−1; 1H and 13C NMR data, see Table 1 and ESI;‡ ESIMS m/z 356. 3 [M + H]+; HRESIMS m/z 356. 2586 [M + H]+ (calculated for C23H34NO2, 356.2590).ε) 212 (4.02), 226 (3.87), 294 (3.53) nm; CD (MeOH) λ (Δε) 221 (4.89), 228 (−0.14), 275 (4.51) nm; IR (KBr) νmax 3395, 2959, 2926, 2855, 1732, 1669, 1634, 1589, 1511, 1463, 1247, 979, 802 cm−1; 1H and 13C NMR data, see Table 1 and ESI;‡ ESIMS m/z 384.2 [M + H]+; HRESIMS m/z 384.2905 [M + H]+ (calculated for C25H38NO2, 384.2903).ε) 212 (4.12), 227 (4.07), 293 (3.72) nm; CD (MeOH) λ (Δε) 235 (7.61), 251 (1.93), 272 (11.79), 327 (−0.49) nm; IR (KBr) νmax 3392, 2960, 2928, 2873, 1738, 1671, 1634, 1589, 1510, 1463, 1249, 803 cm−1; 1H and 13C NMR data, see Table 2 and ESI;‡ ESIMS m/z 398.4 [M + H]+; HRESIMS m/z 420.2876 [M + Na]+ (calculated for C26H39NO2Na, 420.2878).ε) 212 (4.17), 228 (4.11), 290 (3.85) nm; CD (MeOH) λ (Δε) 233 (−4.35), 268 (4.40), 306 (−6.94) nm; IR (KBr) νmax 3357, 2960, 2926, 2856, 1730, 1666, 1630, 1593, 1513, 1464, 1222, 700 cm−1; 1H and 13C NMR data, see Table 2 and ESI;‡ ESIMS m/z 432.2 [M + H]+; HRESIMS m/z 432.2901 [M + H]+ (calculated for C29H38NO2, 432.2903).ε) 212 (4.04), 227 (3.94), 287 (3.62) nm; CD (MeOH) λ (Δε) 264 (3.34), 315 (−1.09) nm; IR (KBr) νmax 3404, 3323, 2926, 2856, 1732, 1672, 1634, 1588, 1510, 1450, 1420, 1346, 1253, 1083, 892 cm−1; 1H and 13C NMR data, see Table 2 and ESI;‡ ESIMS m/z 364.2 [M + Na]+; HRESIMS m/z 364.2253 [M + Na]+ (calculated for C22H31NO2Na, 364.2252).ε) 211 (3.99), 227 (3.95), 289 (3.62) nm; CD (MeOH) λ (Δε)232 (13.3), 246 (−2.02); 281 (4.01), 304 (−1.02), 315 (1.03) nm; IR (KBr) νmax 3323, 2926, 2855, 1731, 1669, 1629, 1591, 1510, 1451, 1420, 1223, 1035, 798 cm−1; 1H and 13C NMR data, see Table 2 and ESI;‡ ESIMS m/z 364.2 [M + Na]+; HRESIMS m/z 364.2250 [M + Na]+ (calculated for C22H31NO2Na, 364.2252).ε) 213 (4.11), 228 (4.08), 294 (3.78) nm; CD (MeOH) λ (Δε) 210 (17.10), 222 (6.52), 226 (−3.08), 271 (2.07) nm; IR (KBr) νmax 3312, 3083, 2926, 2856, 1738, 1673, 1634, 1578, 1512, 1450, 1258, 892 cm−1; 1H and 13C NMR data, see Table 2 and ESI;‡ ESIMS m/z 356. 2 [M + H]+; HRESIMS m/z 356. 2588 [M + H]+ (calculated for C23H34NO2, 356.2590).ε) 212 (4.06), 227 (3.91), 290 (3.70) nm; CD (MeOH) λ (Δε) 214 (15.55), 248 (−0.34), 275 (1.22) nm; IR (KBr) νmax 3308, 3089, 2956, 2926, 2855, 1665, 1622, 1591, 1580, 1504, 1449, 1320, 1223, 894 cm−1; 1H and 13C NMR data, see Table 3 and ESI;‡ ESIMS m/z 384.3 [M + H]+; HRESIMS m/z 384.2905 [M + H]+ (calculated for C25H38NO2, 384.2903).ε) 212 (4.07), 227 (4.05), 291 (3.81) nm; CD (MeOH) λ (Δε) 211 (19.48), 251 (−0.33), 277 (1.85) nm; IR (KBr) νmax 3357, 2956, 2927, 2855, 1731, 1667, 1631, 1590, 1514, 1463, 1220, 893 cm−1; 1H and 13C NMR data, see Table 3 and ESI;‡ ESIMS m/z 398.4 [M + H]+; HRESIMS m/z 420.2880 [M + Na]+ (calculated for C26H39NO2Na, 420.2878).ε) 211 (4.16), 228 (4.09), 290 (3.91) nm; CD (MeOH) λ (Δε)234 (−1.33), 269 (5.15), 326 (−0.59) nm; IR (KBr) νmax 3311, 2958, 2926, 2855, 1729, 1665, 1626, 1593, 1508, 1454, 1322 cm−1; 1H and 13C NMR data, see Table 3 and ESI;‡ ESIMS m/z 432.2 [M + H]+; HRESIMS m/z 432.2906 [M + H]+ (calculated for C29H38NO2, 432.2903).Cytotoxicity bioassays
The MTT method was used for in vitro evaluation of the cytotoxic potential of the isolated compounds against mouse B16F10 melanoma and human NCI–H929 myeloma, HepG2 hepatoma, and SK-OV-3 ovarian cancer cell lines were used. All the cells were cultured in RPMI-1640 or DMEM medium (Hyclone, USA), supplemented with 10% fetal bovine serum (Hyclone, USA) in 5% CO2 at 37 °C. The cytotoxicity assay was performed in 96-well microplates.32 Briefly, adherent cells (100 μL) were seeded into each well of 96-well cell culture plates and allowed to adhere for 12 h before drug addition, while suspended cells were seeded just before drug addition with an initial density of 1 × 10⁵ cells per mL. Each cancer cell line was exposed to the tested compound at concentrations of 1, 10, 50, and 100 μM in triplicate for 48 h with doxorubicin (for NCI–H929), 5-florouracil (for HepG2), and adriamycin (for B16F10 and SK-OV-3) (Sigma, USA) as the positive controls. The cells in each well were then solubilized with DMSO (100 μL for each well) and the optical density (OD) was recorded at 595 nm. IC50 values were derived from the mean OD values of the triplicate tests versus drug concentration curves.NF-κB luciferase assay
The NF-κB inhibitory activity assay was carried out according to the established protocol.33,34 NF-κB cells, which are HEK293 cells stably transfected with an NF-κB-responsive luciferase reporter plasmid, were generated. Other cells were purchased from Cell Bank (Chinese Academy of Sciences, Shanghai, China). A luciferase reporter plasmid containing an NF-κB binding site and pcDNA3.1 was co-transfected into HEK293 cells using Lipofectamine 2000 at a concentration of 10:1 (Invitrogen, Carlsbad, CA, USA). Stable recombinant cells were selected for resistance to 1 mg mL−1 G418 and for a strong luciferase signal. Stable HEK293/NF-κB cells were plated into 384-well plates at a concentration of approximately 3000 cells per well. After culture overnight, compounds were added to the medium at a final concentration of 2 μg mL−1. After 6 h, the luciferase substrate was added to each well, and the released luciferin signal was detected using an EnVision microplate reader. HEK293/NF-κB cells were seeded into 96-well cell culture plates (Corning, NY, USA) and allowed to grow for 24 h.35 The cells were then treated with compounds, followed by stimulation with TNF-α. Luciferase activity was determined using luciferase assay kits (Promega, Madison, WI, USA) according to the manufacturer's instructions.
Acknowledgements
We thank Prof. Jin-He Li (Institute of Oceanology, Chinese Academy of Sciences) for identifying the sponge. This research was supported by the National Natural Science Fund for Distinguished Young Scholars of China (81225023), the National Natural Science Fund of China (no. 41106127, 81072573, 81172978, 81373321 and 81302691), and Shanghai Subject Chief Scientist (12XD1400200). We are also grateful for the financial support of the National High Technology Research and Development Program of China (863 Projects, no. 2011AA09070107 and 2013AA092902).Notes and references
- X. Dolcet, D. Llobet, J. Pallares and X. Matias-Guiu, Virchows Arch., 2005, 446, 475–482 CrossRef CAS PubMed.
- M. A. Calzado, S. Bacher and M. L. Schmitz, Curr. Med. Chem., 2007, 14, 367–376 CrossRef CAS.
- F. Folmer, W. T. Harrison, J. N. Tabudravu, M. Jaspars, W. Aalbersberg, K. Feussner, A. D. Wright, M. Dicato and M. Diederich, J. Nat. Prod., 2008, 71, 106–111 CrossRef CAS PubMed.
- D. M. O'Gorman, C. O'Carroll and R. J. Carmody, Phytother. Res., 2012, 26, 630–632 CrossRef CAS PubMed.
- I. S. Marcos, A. Conde, R. F. Moro, P. Basabe, D. Diez and J. G. Urones, Mini-Rev. Org. Chem., 2010, 7, 230–254 CrossRef CAS.
- R. Kazlauskas, P. Murphy, R. Warren, R. Wells and J. Blount, Aust. J. Chem., 1978, 31, 2685–2697 CrossRef CAS.
- R. T. Luibrand, T. R. Erdman, J. J. Vollmer, P. J. Scheuer, J. Finer and J. Clardy, Tetrahedron, 1979, 35, 609–612 CrossRef CAS.
- R. J. Capon, J. Nat. Prod., 1990, 53, 753–756 CrossRef CAS.
- A. D. Patil, A. J. Freyer, L. Killmer, P. Offen, B. Carte, A. J. Jurewicz and R. K. Johnson, Tetrahedron, 1997, 53, 5047–5060 CrossRef CAS.
- F. S. de Guzman, B. R. Copp, C. L. Mayne, G. P. Concepcion, G. C. Mangalindan, L. R. Barrows and C. M. Ireland, J. Org. Chem., 1998, 63, 8042–8044 CrossRef CAS.
- W. H. Jiao, X. J. Huang, J. S. Yang, F. Yang, S. J. Piao, H. Gao, J. Li, W. C. Ye, X. S. Yao, W. S. Chen and H. W. Lin, Org. Lett., 2012, 14, 202–205 CrossRef CAS PubMed.
- J. Kobayashi, T. Murayama, Y. Ohizumi, T. Ohta, S. Nozoe and T. Sasaki, J. Nat. Prod., 1989, 52, 1173–1176 CrossRef CAS.
- S. Hirsch, A. Rudi, Y. Kashman and Y. Loya, J. Nat. Prod., 1991, 54, 92–97 CrossRef CAS.
- S. Urban and R. J. Capon, J. Nat. Prod., 1992, 55, 1638–1642 CrossRef CAS.
- M. L. Ciavatta, M. P. Lopez Gresa, M. Gavagnin, V. Romero, D. Melck, E. Manzo, Y. W. Guo, R. van Soest and G. Cimino, Tetrahedron, 2007, 63, 1380–1384 CrossRef CAS PubMed.
- N. K. Utkina, V. A. Denisenko and V. B. Krasokhin, J. Nat. Prod., 2010, 73, 788–791 CrossRef CAS PubMed.
- E. Pérez-García, E. Zubía, M. J. Ortega and J. L. Carballo, J. Nat. Prod., 2005, 68, 653–658 CrossRef PubMed.
- C. E. McNamara, L. Larsen, N. B. Perry, J. L. Harper, M. V. Berridge, E. W. Chia, M. Kelly and V. L. Webb, J. Nat. Prod., 2005, 68, 1431–1433 CrossRef CAS PubMed.
- L. Du, Y. D. Zhou and D. G. Nagle, J. Nat. Prod., 2013, 76, 1175–1181 CrossRef CAS PubMed.
- H. W. Lin, Z. L. Wang, J. H. Wu, N. Shi, H. J. Zhang, W. S. Chen, S. L. Morris-Natschke and A. S. Lin, J. Nat. Prod., 2007, 70, 1114–1117 CrossRef CAS PubMed.
- H. J. Zhang, Y. H. Yi, G. J. Yang, M. Y. Hu, G. D. Cao, F. Yang and H. W. Lin, J. Nat. Prod., 2010, 73, 650–655 CrossRef CAS PubMed.
- X. F. Liu, Y. L. Song, H. J. Zhang, F. Yang, H. B. Yu, W. H. Jiao, S. J. Piao, W. S. Chen and H. W. Lin, Org. Lett., 2011, 13, 3154–3157 CrossRef CAS PubMed.
- H. Suna, M. Arai, Y. Tsubotani, A. Hayashi, A. Setiawan and M. Kobayashi, Bioorg. Med. Chem., 2009, 17, 3968–3972 CrossRef CAS PubMed.
- Y. Takahashi, M. Ushio, T. Kubota, S. Yamamoto, J. Fromont and J. Kobayashi, J. Nat. Prod., 2010, 73, 467–471 CrossRef CAS PubMed.
- T. Hosoya, T. Hirokawa, M. Takagi and K. Shin-ya, J. Nat. Prod., 2012, 75, 285–289 CrossRef CAS PubMed.
- A. R. Diaz-Marrero, P. Austin, R. Van Soest, T. Matainaho, C. D. Roskelley, M. Roberge and R. J. Andersen, Org. Lett., 2006, 8, 3749–3752 CrossRef CAS PubMed.
- S. P. B. Ovenden, J. L. Nielson, C. H. Liptrot, R. H. Willis, D. M. Tapiolas, A. D. Wright and C. A. Motti, J. Nat. Prod., 2010, 74, 65–68 CrossRef PubMed.
- G. Cimino, S. Rosa, S. Stefano, L. Cariello and L. Zanetti, Experientia, 1982, 38, 896 CrossRef CAS.
- A. N. Hamed, W. Wätjen, R. Schmitz, Y. Chovolou, R. Edrada-Ebel, D. T. Youssef, M. S. Kamel and P. Proksch, Nat. Prod. Commun., 2013, 8, 289–292 Search PubMed.
- K. A. Alvi, M. C. Diaz, P. Crews, D. L. Slate, R. H. Lee and R. Moretti, J. Org. Chem., 1992, 57, 6604–6607 CrossRef CAS.
- J. Sakurai, T. Oguchi, K. Watanabe, H. Abe, S. I. Kanno, M. Ishikawa and T. Katoh, Chem. – Eur. J., 2008, 14, 829–837 CrossRef CAS PubMed.
- T. Mosmann, J. Immunol. Methods, 1983, 65, 55–63 CrossRef CAS.
- S. F. Chang, L. M. Yang, C. H. Lo, J. H. Liaw, L. H. Wang and S. J. Lin, J. Nat. Prod., 2008, 71, 87–92 CrossRef CAS PubMed.
- Y. M. Peng, J. B. Zheng, Y. B. Zhou and J. Li, Acta Pharmacol. Sin., 2013, 34, 939–950 CrossRef CAS PubMed.
- F. Folmer, W. T. A. Harrison, J. N. Tabudravu, M. Jaspars, W. Aalbersberg, K. Feussner, A. D. Wright, M. Dicato and M. Diederich, J. Nat. Prod., 2007, 71, 106–111 CrossRef PubMed.
Footnotes |
| † Dedicated to Academician Xin-Sheng Yao on his 80th birthday. |
| ‡ Electronic supplementary information (ESI) available: The 1H NMR, 13C NMR, DEPT135, 1H–1H COSY, HSQC, HMBC and NOESY spectra of compounds 1–13, the HRESIMS, UV, IR and CD spectra of 1–13, as well as cif data for compounds 1, 2, and 15. CCDC 974398–974400. For ESI and crystallographic data in CIF or other electronic format see DOI: 10.1039/c3ra47265e |
| § These authors contributed equally to this work. |
| This journal is © The Royal Society of Chemistry 2014 |