 Open Access Article
 This Open Access Article is licensed under a Creative Commons Attribution-Non Commercial 3.0 Unported Licence
Effects of amorphous and crystalline MoO3 coatings on the Li-ion insertion behavior of a TiO2 nanotube anode for lithium ion batteries†
Dongsheng Guan,
Jianyang Li,
Xianfeng Gao and
Chris Yuan*
Department of Mechanical Engineering, University of Wisconsin Milwaukee, Milwaukee, 53211, USA. E-mail: cyuan@uwm.edu; Fax: +1 414 229 5639; Tel: +1 414 229 6958
First published on 31st October 2013
Abstract
Amorphous and crystalline MoO3 coatings are synthesized on anodic TiO2 nanotube arrays by electrodeposition, as a self-standing, binder-free anode material in Li-ion batteries for enhancing the Li-ion insertion performance. The amorphous MoO3 layer is uniform and conformal with a thickness of 10 nm, and is converted into crystalline nanoparticles via thermal treatment. Our results show that both the coated TiO2 nanotubes deliver much higher areal capacities than bare nanotubes or a dense crystalline α-MoO3 film, while the crystalline α-MoO3 coating greatly increases the areal capacity of TiO2 nanotubes compared to the amorphous. The results are obtained at 1340 μA h cm−2 initial capacity for nanotubes with a crystalline coating, 977 μA h cm−2 for those with an amorphous coating and 342 μA h cm−2 for the bare ones. The significant enhancement is due to a combination of MoO3 with high specific capacity and TiO2 nanotube arrays with large surface area allowing uniform MoO3 deposition and rapid ionic transfer. Crystalline α-MoO3 is better than amorphous MoO3 and the coating medium is discussed in terms of chemical state, crystal defects, capacitive contributions and the charge–discharge kinetics in coated TiO2 nanotube electrodes.
Introduction
Rechargeable lithium-ion batteries (LIBs) have drawn tremendous interest in the past decades due to their high energy density, light weight, low self-discharge and long lifespan.1,2 At present, graphite is the most commonly-used anode material in commercial LIBs, but its drawback of easy formation of lithium dendrites, hinders the development of compact LIBs with higher operation voltage, larger power density and better cell safety.3 TiO2 is a promising alternative to graphite because of its high safety and good cyclability, low self-discharge rates and small volume change (<3%).4 It is also attractive owing to its abundant resource, low cost, chemical stability and harmless properties. Self-organized TiO2 nanotube arrays formed by anodic oxidation could serve as an excellent host for electrons and Li+ ions, and their tight contact with the metallic substrate allows electrons to be collected directly and efficiently.5 However, the Li-ion insertion performance of anatase TiO2 nanotubes (∼168 mA h g−1) is poor and needs to be improved. Several methods have been proposed for this using surface modifications with metal,6,7 or other anode materials such as SnO2,8 Cu6Sn5,9 NiO,10 Co3O4,11 Fe2O3,12 etc.Besides TiO2, orthorhombic α-MoO3 is also an excellent anode material for LIBs, with a high theoretical capacity of 1111 mA h g−1, almost three times that of the graphite.13 Recently we reported α-MoO3 deposited TiO2 nanotube composites showing good Li-ion storage capacities and stable cycling performances.14 α-MoO3 can be obtained by crystallization of amorphous MoO3 that is well-known for its excellent electrochromic behavior during the insertion/desertion process of ions including Li+ and H+.15–17 Although electroinsertion behaviors of amorphous and crystalline MoO3 are reported,15,18 impacts of metal oxidation states and morphological evolution of MoO3 coatings on Li-ion insertion of MoO3-deposited TiO2 nanotubes have not been investigated yet. It remains unclear if ordered TiO2 nanotubes are qualified to act as a robust substrate to MoO3 for its better performance in thin-film electrochromic devices and electrochemical batteries. Hence, we propose synthesis of amorphous MoO3 coatings onto highly-oriented TiO2 nanotubes by employing a controllable and facile electrodeposition method. Evolution of the surface coating is studied in detail in terms of morphological features, chemical state and electrochemical kinetics.
In this work, ordered anatase TiO2 nanotubes were synthesized by potentiostatic anodization and subsequent thermal treatment. Electrodeposition of MoO3 was performed on these nanotube arrays and bare Ti foils to obtain amorphous coatings that are transformed into the crystalline phase upon annealing. We compared the effects of amorphous and crystalline MoO3 coatings on the Li-ion intercalation capacity of TiO2 nanotubes. Our results demonstrate that these TiO2 nanotubes could be an excellent substrate in thin film MoO3 electrodes for high performance LIBs.‡
Results and discussion
Fig. 1 presents SEM images of bare and MoO3-coated TiO2 nanotubes. The top-view (Fig. 1a) and cross-sectional images (Fig. S1†) show well-ordered TiO2 nanotubes (B-TN) with the top end open at an average inner diameter of ∼110 nm and a length up to 9 μm. It can be seen from the inset of this figure that the hollow tubes are directionally arrayed with individual and smooth walls. Apparently, their inner and outer walls provide large surface area which offers numerous sites for MoO3 deposition in order to form an effective hybrid structure. Fig. 1b gives SEM images of TiO2 nanotubes coated with 8 deposition cycles of MoO3 (AMO-TN). Compared to B-TN, their walls are thickened as evidenced by open entrances showing a reduced inner diameter of ∼90 nm. In addition, their tube walls remain smooth with a uniform coating layer in a thickness of ∼10 nm, and the precipitates there are believed to contain various molybdenum oxides,15,19 On the other hand, the coating layer is roughened after heat treatment, thanks to spontaneous origination of particles anchored on the tube walls (CMO-TN, Fig. 1c). The tubular structure survives, leaving a narrower entrance and lower porosity, because the walls of TiO2 nanotubes are further thickened and the pore size is mostly 50 nm. Fig. 1d presents an oxide film (400MO) formed by electrodeposition of molybdenum oxides directly on Ti. Edged particles with a size up to hundreds of nanometers are aggregated to yield a dense film only with a few cracks. They are poly-crystalline with an orthorhombic crystal structure (α phase).15 As a result, it is understood that the hollow nanotubes not only work as a support for MoO3 deposition, but offer numerous channels to let electrolytes readily infiltrate and Li+ ions rapidly transfer in a fast charge–discharge process, which is likely to achieve better Li-ion insertion behaviour of TiO2 anodes in LIBs. | ||
| Fig. 1 SEM images of (a) B-TN, (b) AMO-TN, (c) CMO-TN and (d) 400MO. | ||
MoO3-deposited TiO2 nanotubes are examined by TEM as well. Fig. 2a shows nanotubes from AMO-TN with a conformal coating layer of ∼9.4 nm thickness on their outer wall. It is assumed that such a coating also exists on inner walls since the pores are quite wider than the tube gaps as shown in Fig. 1a, and thus electrolytes can easily access the inner walls for deposition. It is proved by reducing the inner diameter of TiO2 nanotubes from 110 nm to 90 nm and to 30 nm, as the deposition cycles of amorphous MoO3 increase from zero to 8 and to 16 (Fig. 1a and b and S2a†). Direct deposition of MoO3 inside the nanotube is also reported in previous work.17,20 Upon heating many α-MoO3 nanoparticles are further viewed on both the inner and outer walls due to the crystallization process (Fig. S2b†). The particles could be seen in Fig. 2b as well. When compared, there are fewer particles in Fig. 2a, suggesting the growth of α-MoO3 particles on CMO-TN rather than AMO-TN and B-TN. In addition, co-existence of polycrystalline α-MoO3 and anatase TiO2 is also confirmed by indexing these spots in a selected area electron diffraction ring pattern of CMO-TN, as seen in Fig. 2b. Three rings consisting of the spots are exampled. With their diameters, we obtain an interplanar spacing of ∼0.355 nm for the anatase TiO2 (101) plane, 0.271 nm for the α-MoO3 (101) plane and ∼0.185 nm for the α-MoO3 (002) plane, but a great amount of interplanar spacings of anatase TiO2 and α-MoO3 are too close to index other spots readily in the pattern. An EDX analysis is also made from TEM observation to claim the presence of Mo, Ti and O elements. An EDX quantitative analysis of Ti (59.14 at%) and Mo (12.67 at%) in the nanotubes provides an elemental ratio of 27.8 wt% for α-MoO3 in CMO-TN, which is quite close to 26.7 wt% of the mass ratio obtained by weighing samples.
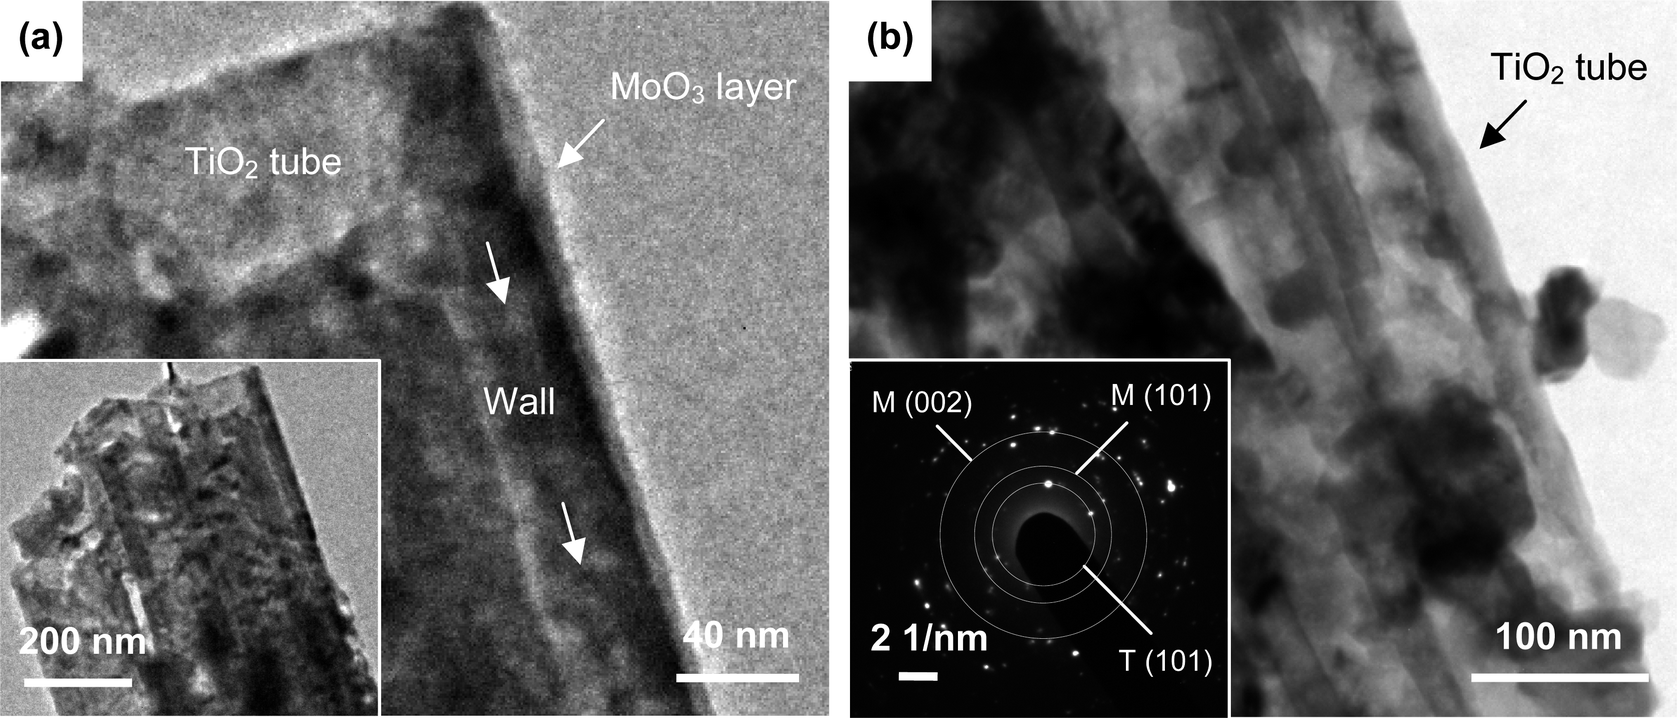 | ||
| Fig. 2 (a) TEM images of AMO-TN, (b) TEM image of CMO-TN and an electron diffraction pattern taken from these nanotubes with distinguishable Miller indices of anatase TiO2 (T(101)) and α-MoO3 (M(101), M(002)). | ||
Both EDX and XPS techniques are employed to analyze the elemental distribution and chemical states of the deposited TiO2 nanotubes. Fig. 3a shows the EDX mapping of AMO-TN in which elements including Mo, Ti and O are detected and well distributed in the TiO2 nanotube film, suggesting formation of a uniform molybdenum oxide coating on TiO2 nanotube arrays. A detailed XPS analysis reveals that the as-formed coating contains MoV oxides and MoVI oxides, since the Mo3d5/2 peak at 232.0 eV and the Mo3d3/2 peak at 235.2 eV correspond to MoV, and the Mo3d5/2 peak at 233.1 eV and the Mo3d3/2 peak at 236.2 eV (ΔE = 3.1 eV) correspond to MoVI (Fig. 3b). The fraction of MoVIO3 is as high as 50% in the amorphous coating, based on the area ratio of 1![[thin space (1/6-em)]](https://www.rsc.org/images/entities/char_2009.gif) :1 between MoVI peaks and MoV peaks. Upon annealing, the XPS peak shape shifting to high energies is in line with α-MoO3 (Fig. 3c). The area ratio between the two peaks (3d5/2:3d3/2) was almost 3:2, as expected for the coatings on CMO-TN which are dominantly composed of MoVI. A tiny peak at 234 eV tells us that a trace amount of molybdenum species (MoOx) in lower oxidation states may reside. As for the O1s peak, a slight shift (0.5 eV) to a lower energy is observed (Fig. 3d), which is in agreement with previous studies.12,20 The peak shift is attributed to elimination of OH− groups and oxidation of MoV ions in the coating on annealing.19 Our results indicate a uniform coating composed of MoV and MoVI oxides on TiO2 nanotubes after electrodeposition, which turns to be an α-MoO3-predominant film right after annealing at 450 °C. In summary, these results demonstrate that the MoO3-coated TiO2 nanotube arrays have been successfully achieved by a facile electrodeposition in molybdenum salt solutions.
:1 between MoVI peaks and MoV peaks. Upon annealing, the XPS peak shape shifting to high energies is in line with α-MoO3 (Fig. 3c). The area ratio between the two peaks (3d5/2:3d3/2) was almost 3:2, as expected for the coatings on CMO-TN which are dominantly composed of MoVI. A tiny peak at 234 eV tells us that a trace amount of molybdenum species (MoOx) in lower oxidation states may reside. As for the O1s peak, a slight shift (0.5 eV) to a lower energy is observed (Fig. 3d), which is in agreement with previous studies.12,20 The peak shift is attributed to elimination of OH− groups and oxidation of MoV ions in the coating on annealing.19 Our results indicate a uniform coating composed of MoV and MoVI oxides on TiO2 nanotubes after electrodeposition, which turns to be an α-MoO3-predominant film right after annealing at 450 °C. In summary, these results demonstrate that the MoO3-coated TiO2 nanotube arrays have been successfully achieved by a facile electrodeposition in molybdenum salt solutions.
 | ||
| Fig. 3 (a) EDX mapping image of AMO-TN, high-resolution Mo3d XPS spectra taken from (b) AMO-TN, (c) CMO-TN, and (d) O1s XPS spectra taken from both samples. | ||
Anodic TiO2 nanotubes are found to be in anatase phase after annealing at 450 °C by XRD and Raman.14,21 Fig. 4 describes XRD patterns of MoO3-coated TiO2 nanotubes. Typical diffraction peaks for anatase TiO2 are observed, including the (101) peak at 2θ = 25.3° and the (200) peak at 2θ = 47.9°. Diffraction peaks of Ti are also found in both patterns, as evidenced by the (101) peak at 2θ = 40.0°.
 | ||
| Fig. 4 X-ray diffraction patterns of (a) AMO-TN and (b) CMO-TN. | ||
There are no XRD peaks found for molybdenum metal or oxides in the pattern of AMO-TN, suggesting deposition of amorphous MoO3 layers onto anatase TiO2 nanotubes. After heat treatment, the amorphous coating is gradually transformed to nanoparticles in the crystalline (α) phase, as evidenced by peaks (020), (040) and (021) of α-MoO3 at 2θ = 12.6°, 25.4° and 27.4°, respectively.
Based on above analyses, it is confirmed that electrodeposition and crystallization of α-MoO3 on anodic TiO2 nanotube arrays results in a hybrid nanostructure. Fig. 5 vividly illustrates the morphological evolution of TiO2 nanotubes with MoO3 coatings. Initially, the formed nanotubes are well-arrayed on the Ti substrate by anodization and are then converted into anatase by annealing (Fig. 5a). Owing to electrodeposition of MoO3, both the inner and outer walls of nanotubes are wrapped with a layer of amorphous MoO3 to achieve a core–shell structure (Fig. 5b). Heat treatment induces crystallization within the amorphous layer, producing an amount of α-MoO3 nanoparticles (Fig. 5c) and yielding a TiO2 nanotube supported α-MoO3 nanoparticle electrode.
 | ||
| Fig. 5 Schematic showing (a) B-TN, (b) AMO-TN and (c) CMO-TN. | ||
Fig. 6 displays cycling performances of MoO3 film, bare and deposited TiO2 nanotubes over 10 electrochemical cycles at a large current density of 800 μA cm−2 (compared to the commonly-used current density of 50–200 μA cm−2)8–12,14 in a potential range of 0.05–3.0 V versus Li/Li+. Clearly, a capacity drop occurs after the initial cycle for all anodes, probably due to some fractions of Li+ ions becoming trapped inside the oxide from irreversible formation of a molybdenum bronze such as Lix+2Mo1−xVIMox−zVMozIVO3−y−z, or due to decomposition of organic solvent to form a SEI layer on the surface of the electrodes.15 Later, the charge–discharge capacities tend to stabilize. Apparently, all TiO2 nanotube films deliver significantly higher areal capacities (330–1300 μA h cm−2) than the dense pure MoO3 film (∼100 μA h cm−2), indicating a porous structure truly superior to a dense one for electrode materials. In addition, areal capacities of both MoO3-coated TiO2 nanotubes are larger than that of the bare one. For example, CMO-TN exhibits an initial charge capacity of 1340 μA h cm−2 and a final charge capacity of 1136 μA h cm−2 over 10 cycles, more than three times that of B-TN (342 μA h cm−2 and 319 μA h cm−2). Additionally, AMO-TN shows an initial charge capacity of 977 μA h cm−2 and a final charge capacity of 905 μA h cm−2, greater than B-TN but lower than CMO-TN. Specific capacities of these α-MoO3 and TiO2 anodes are obtained as well, among which CMO-TN delivers the highest and B-TN gives the lowest due to an intrinsically low capacity of anatase TiO2 (∼168 mA h g−1).22 Typical specific charge capacities are 430 mA h g−1 for CMO-TN, 340 mA h g−1 for 400MO, 290 mA h g−1 for AMO-TN and 150 mA h g−1 for B-TN (Fig. S3†). Obviously, the porous MoO3/TiO2 nanotube hybrid structure is surely able to provide better Li-ion insertion properties than a dense α-MoO3 film electrode (400MO) and even a conventional α-MoO3 powder electrode (with binder and conductive carbon black) showing capacities of ∼125 mA h g−1 with similar current and potential parameters for battery testing, mostly due to full utilization of nanosized α-MoO3 and rapid Li-ion transfer inside a porous electrode.13,18 Moreover, CMO-TN with both more areal and specific capacity than 400MO highlights nanoparticles superiority to submicron particles deposited onto TiO2 nanotube arrays for the first time. That is, it has been reported that NiO or Co3O4 particles in submicron size deposited to anodic TiO2 nanotubes could improve their areal capacity rather than specific capacity compared to pure NiO or Co3O4 films made by same electrodeposition, since they are too large to spread effectively on the inner and outer walls of the nanotubes.11 It is also worth pointing out that CMO-TN and AMO-TN anodes deliver higher areal capacities than B-TN and better rate stability than 400MO within a wide current range from 200 to 1000 μA cm−2 (Fig. S4†). In brief, the remarkable improvement in Li-ion intercalation capacities of TiO2 nanotube arrays is attributed to the addition of MoO3 with high specific capacity onto host TiO2 material.14 It is also found that crystalline α-MoO3 nanoparticles are capable of accommodating more Li+ ions than amorphous MoO3 layers based on a comparison between AMO-TN and CMO-TN. The discrepancy is related to the crystal structure and chemical states of molybdenum oxides, capacitive factors and electrochemical kinetics.15,18 Additionally, the TiO2 tubular structure plays an important role in this capacity boost as well. It allows uniform MoO3 deposition onto nanotubes and rapid mass transport within the electrode, favourable for α-MoO3 coatings to exert its Li-ion insertion/desertion nature at high rates.
 | ||
| Fig. 6 Areal discharge (square symbol) and charge (round symbol) capacities of B-TN, 400MO, AMO-TN and CMO-TN over 10 cycles measured at a current of 800 μA cm−2. | ||
Fig. 7a shows galvanostatic discharge–charge plots of B-TN, AMO-TN and CMO-TN on the first two cycles at a current of 800 μA cm−2. It is observed that the charge–discharge capacity of the two deposited samples is fairly higher than that of bare one. Two voltage plateaus appear near 1.7 V and 2.1 V in the curves of the three anodes. The one at 1.7 V in the negative scan corresponds to Li-ion insertion into TiO2, while the other in the positive scan accords with Li-ion desertion from TiO2. The total reaction for Li-ion insertion to/extraction from TiO2 is described by:22
| TiO2 + xLi+ + xe− ↔ LixTiO2 | (1) |
 | ||
| Fig. 7 (a) Charge–discharge profiles at the 1st and 2nd cycle of B-TN (B1, B2), AMO-TN (A1, A2) and CMO-TN (C1, C2), and their according differential capacity curves of (b) B-TN, (c) AMO-TN and (d) CMO-TN measured at a current of 800 μA cm−2. Insets: enlarged differential charge capacity curves within a potential range of 1.0 to 2.0 V. | ||
For anatase TiO2, x could be up to 0.5 (Li0.5TiO2), corresponding to a capacity of 168 mA h g−1.
As the cell is discharged below 1.0 V, the capacity of B-TN continues to arise slightly, as shown by a decline slope of its plot in Fig. 7a. Besides a little extra Li-ion insertion to TiO2, an important reason for the increment could be the decomposition of electrolyte components at the TiO2 electrodes in which Li+ ions may participate to cause a few irreversible capacities.23,24 In addition, more prolonged, slowly declining slopes below 0.7 V in the discharge plots are observed for both AMO-TN and CMO-TN, suggesting a large quantity of Li+ ions intercalated into the MoO3-coated TiO2 nanotubes rather than the bare ones at low potentials. Such a difference is again confirmed by their differential capacity plots derived from this figure. Fig. 7b shows a pair of oxidation (at 2.08 V) and reduction peaks (at 1.7 V) in the charge–discharge process of TiO2, suggesting a one-stage lithiation mechanism in anatase TiO2 according to eqn (1). It is also seen that in the second cycle the reduction and oxidation peaks for B-TN are weakened, due to Li-ion loss in the previous cycle. However, the peak positions almost remain unchanged, showing good reversibility of the Li-ion insertion/desertion reaction on TiO2 nanotubes. On the contrary, the lithiation process in MoO3-deposited samples appears greatly different. Fig. 7c displays the differential capacity curves of AMO-TN. In this figure, the peaks at 1.5 V and 2.11 V in the first cycle mainly corresponds to Li-ion insertion/desertion on TiO2. As the potential goes down to 0.05 V, the plot inclines distinctly and even produces a small peak at ∼0.28 V, claiming more Li+ ions insert into AMO-TN than into B-TN. It indeed happens that Li+ ions are inserted into the amorphous MoO3 layer in the negative scan, because of much larger |dQ/dV| values for AMO-TN than for B-TN. The reduction peak shifts to 1.68 V in the second cycle, thanks to foregoing the activation process and reduced electrode polarization. Differential plots of CMO-TN are present in Fig. 7d where a pair of high reduction and oxidation peaks are seen at 1.59 V and 2.07 V in the first cycle, plus a sharp peak at 0.24 V. Li-ion insertion to α-MoO3 is believed to be involved in this event, since long discharge plateaus and corresponding reduction peaks appear at 0.42 V and 0.32 V for 400MO (Fig. S5†). Undoubtedly, |dQ/dV| values continue to rise for CMO-TN, a sign of increased storage of Li+ ions. As the battery testing proceeds, its reduction peak moves to 1.7 V but its oxidation peak remains unchanged, so AMO-TN displays a wider separation of reduction and oxidation peaks of TiO2 (0.43 V) than B-TN (0.38 V) and CMO-TN (0.37 V), probably due to larger electrode polarization from slower Li+ diffusion in the amorphous MoO3 coating.18 Additionally, it is worth pointing out that a broad plateau appears between 1 V and 2 V in the positive scan of AMO-TN and CMO-TN, suggesting a great number of Li+ ions extracted out of the MoO3 within the potential window, which is in accord with linearly increasing slopes of their charge plots in Fig. 7a. The plateau or slope is a typical electrochemical characteristic of MoO3 according to Fig. S5.† The differential capacity curves of the three samples within this potential window are enlarged and put as insets in Fig. 7b–d. The curve starts from 20 μA h cm−2 V−1 at 1 V and gradually goes up to 240 μA h cm−2 V−1 at 2 V for B-TN, but from 170 to 510 μA h cm−2 V−1 for AMO-TN, and from 260 to 740 μA h cm−2 V−1 for CMO-TN. Since TiO2 nanotubes serve as the substrate for both amorphous and crystalline MoO3 coatings, it confirms that α-MoO3 is able to accommodate more Li+ ions than amorphous MoO3, which is in good agreement with previous literature.15,18
A two-stage lithiation process has been proposed for MoO3.25 As the potential is above 1.25 V, the reaction of Li-ion insertion into MoO3 on the TiO2 anode can be represented by:25
| MoO3 + xLi+ + xe− ↔ LixMoO3 | (2) |
For α-MoO3, x could be between 1 and 1.5 in the first stage, and MoVI is reduced to MoV and further to MoIV. α-MoO3 has an orthorhombic structure containing a group of regularly distorted MoO6 octahedra. They share edges to form chains that are cross-linked through oxygen atoms to yield layers. Li+ ions are inserted into the interlayer spacing between these octahedral layers and intralayers.26,27 The second stage occurs at potentials below 0.7 V here, and the according reaction can be expressed by:25
| LixMoO3 + yLi+ + ye− ↔ Mo + 3Li2O | (3) |
It can be seen from eqn (3) that in lower voltage regions Li+ ions react with the solid solution (LixMoO3) to form Mo metal and Li2O oxides. Li2O is believed to be naturally irreversible, but the presence of nanosized Mo particles induces a reversible reaction of Li2O during charging,13,25 and thus a huge loss of active material is prohibited.
It is understood from Fig. 7c and d that the two stages could occur in both amorphous and crystalline MoO3 layers on TiO2 nanotubes, despite different capacities of AMO-TN and CMO-TN. Several reasons are proposed to explain such discrepancies: first of all, the presence of molybdenum species in lower oxidation states in AMO-TN decreases chemical reactions of metal ion and Li+ ions according to eqn (2) and (3). Secondly, absorbed moisture and oxygen deficiencies in amorphous MoO3 cause a huge Li-ion loss when AMO-TN is subject to deep discharge conditions.15 Thirdly, distinct capacitive capabilities of MoO3 are involved in the Li-ion storage behaviors of AMO-TN and CMO-TN electrodes. Both crystalline and amorphous MoO3 deliver redox pseudocapacitance but the former has a unique layered crystal structure in which extra Li+ ions can enter van der Waals gaps to create intercalation pseudo-capacitance.28,29 Hence, more capacitive contributions from α-MoO3 help CMO-TN to deliver larger Li-ion storage capacities than AMO-TN at high rates. More importantly, the kinetics of Li+ ions at these oxide electrodes also play an important role in their electrochemical performance, which is studied by the electrochemical impedance spectroscopy (EIS) technique.
Fig. 8 gives Nyquist plots and their equivalent circuit for B-TN, 400MO, AMO-TN and CMO-TN after cells are discharged and charged for ten battery cycles. In this circuit, Rs is the ohmic resistance from the electrolyte, polymer separator and electrodes, corresponding to the intercept of the depressed semicircle in the high-to-medium frequency region with the Z-real axis. The semicircle is related to the Li-ion transfer process from the electrolyte into the TiO2 anode. Rct is the charge transfer resistance at the electrode/electrolyte interface, which could be inferred from the semicircle arc. The sloping line at the low frequency range represents Li-ion diffusion in the bulk electrode, known as the Warburg impedance (W). From these plots, it is found that the semicircle diameter for 400MO is much longer than that for others, implying larger charge transfer resistance (Rct) in the dense oxide film. B-TN gives the smallest Rct, and Rct is clearly higher for CMO-TN than for AMO-TN with amorphous coatings. EIS analyses reveal that Li-ion transfer at the TiO2 anode is hindered by MoO3 oxide coatings partly because of reduced surface area of deposited nanotubes. Fortunately, MoO3 with the nature of good specific capacity accepts more Li+ ions to obtain a capacity increment in AMO-TN and CMO-TN compared to B-TN. Similarly, it is discovered that ionic transfer resistance is greater in CMO-TN than in AMO-TN, which is supposed to be related to decreased surface area or porosity of α-MoO3 particle coated TiO2 nanotubes after crystallization of as-deposited MoO3 layers, as shown in Fig. 1b and c. However, α-MoO3 with higher capacities than amorphous MoO3 still succeeds in enhancing the Li-ion insertion properties of the TiO2 nanotube anode.
 | ||
| Fig. 8 Nyquist plots and the equivalent circuit of half cells containing B-TN, 400MO, AMO-TN and CMO-TN anodes measured at a potential of 1.7 V after ten electrochemical cycles. | ||
Conclusions
In summary, anatase TiO2 nanotube arrays have been synthesized by anodic oxidation of Ti in fluoride-containing EG electrolyte and annealing at 450 °C in air, for effective surface coating with MoO3 via electrochemical deposition, in order to greatly enhance the Li-ion intercalation properties of TiO2 anodes. The uniform layer of amorphous MoO3 on nanotubes is demonstrated by XRD, SEM and TEM. The as-deposited MoO3 coating is converted to the crystalline (α) phase upon thermal treatment. All TiO2 nanotubes deliver larger areal capacities than pure MoO3 film, partly due to high surface area and fast Li-ion kinetics in porous electrodes. In addition, Li-ion storage capacities of TiO2 nanotubes are increased by the as-formed amorphous MoO3 coatings, and further enlarged with a crystalline coating. The improved electrochemical property is due to the combination of MoO3 with high specific capacity and ordered TiO2 nanotubes with large surface area for efficient deposition and fast Li-ion kinetics. Despite larger Li-ion transfer resistance, α-MoO3 coated TiO2 nanotubes possess the advantages of crystalline α-MoO3 including more capacitive contributions and tighter chemical bonds with the TiO2 substrate to achieve the best Li-ion storage performance. Our results demonstrate that crystalline TiO2 nanotube arrays composited with transition oxides having more Li-ion storage capabilities could be a promising electrode material for high-performance LIBs.Acknowledgements
Financial support from the University of Wisconsin System Applied Research program and the University of Wisconsin – Milwaukee Bradley and Hertz Catalyst Grant Programs are gratefully acknowledged.Notes and references
- J. M. Tarascon and M. Armand, Nature, 2001, 414, 359 CrossRef CAS PubMed
.
- A. S. Arico, P. Bruce, B. Scrosati, J. M. Tarascon and W. Van Schalkwijk, Nat. Mater., 2005, 4, 366 CrossRef CAS PubMed
- A. R. Armstrong, G. Armstrong, J. Canales and P. G. Bruce, J. Power Sources, 2005, 146, 501 CrossRef CAS
- H. T. Fang, M. Liu, D. W. Wang, T. Sun, D. S. Guan, F. Li, J. G. Zhou, T. K. Sham and H. M. Cheng, Nanotechnology, 2009, 20, 225701 CrossRef PubMed
- X. N. Luan, D. S. Guan and Y. Wang, J. Phys. Chem. C, 2012, 116, 14257 CAS
- H. S. Kim, S. H. Kang, Y. H. Chung and Y. E. Sung, Electrochem. Solid-State Lett., 2010, 13, A15 CrossRef CAS
- D. S. Guan and Y. Wang, Ionics, 2013, 19, 879 CrossRef CAS
- X. Q. Meng, J. Y. Yao, F. L. Liu, H. C. He, M. Zhou, P. Xiao and Y. H. Zhang, J. Alloys Compd., 2013, 552, 392 CrossRef CAS
- L. G. Xue, Z. Wei, R. S. Li, J. L. Liu, T. Huang and A. S. Yu, J. Mater. Chem., 2011, 21, 3216 RSC
- L. L. Wang, S. C. Zhang and X. M. Wu, Chem. Lett., 2011, 40, 1428 CrossRef CAS
- N. A. Kyeremateng, C. Lebouin, P. Knauth and T. Djeniziana, Electrochim. Acta, 2013, 88, 814 CrossRef CAS
- L. Yu, Z. Y. Wang, L. Zhang, H. B. Wu and X. W. Lou, J. Mater. Chem. A, 2013, 1, 122 CAS
- G. Y. Zhao, N. Q. Zhang and K. N. Sun, J. Mater. Chem. A, 2013, 1, 221 CAS
- D. S. Guan, J. Y. Li, X. F. Gao and C. Yuan, J. Power Sources, 2014, 246, 305 CrossRef CAS
- T. M. McEvoy and K. J. Stevenson, Langmuir, 2003, 19, 4316 CrossRef CAS
- N. K. Shrestha, Y. C. Nah, H. Tsuchiya and P. Schmuki, Chem. Commun., 2009, 2008 RSC
- D. D. Yao, M. R. Field, A. P. O'Mullane, K. Kalantar-zadeh and J. Z. Ou, Nanoscale, 2013, 5, 10353 RSC
- C. V. Ramana, V. V. Atuchin, H. Groult and C. M. Julien, J. Vac. Sci. Technol., A, 2012, 30, 04D105 Search PubMed
- M. L. Petrova, M. S. Bojinov and I. H. Gadjov, Bulg. Chem. Commun., 2011, 43, 60 CAS
- K. Lorenz, S. Bauer, K. Gutbrod, J. P. Guggenbichler, P. Schmuki and C. Zollfrank, Biointerphases, 2011, 6, 16 CrossRef PubMed
- D. S. Guan and Y. Wang, Nanoscale, 2012, 4, 2968 RSC
- D. S. Guan, C. Cai and Y. Wang, J. Nanosci. Nanotechnol., 2011, 11, 3641 CrossRef CAS PubMed
- S. K. Jeong, M. Inaba, T. Abe and Z. Ogumi, J. Electrochem. Soc., 2001, 148, A989 CrossRef CAS
- K. Tasaki, A. Goldberg, J. J. Lian, M. Walker, A. Timmons and S. J. Harrisc, J. Electrochem. Soc., 2009, 156, A1019 CrossRef CAS
- P. Meduri, E. Clark, J. H. Kim, E. Dayalan, G. U. Sumanasekera and M. K. Sunkara, Nano Lett., 2012, 12, 1784 CrossRef CAS PubMed
- B. C. Windom, W. G. Sawyer and D. W. Hahn, Tribol. Lett., 2011, 42, 301 CrossRef CAS
- M. C. Rao, K. Ravindranadh, A. Kasturi and M. S. Shekhawat, Res. J. Recent Sci., 2013, 2, 67 Search PubMed
- G. Y. Zhao, L. Zhang and K. N. Sun, J. Electroanal. Chem., 2013, 694, 61 CrossRef CAS
- T. Brezesinski, J. Wang, S. H. Tolbert and B. Dunn, Nat. Mater., 2010, 9, 146 CrossRef CAS PubMed
Footnotes |
| † Electronic supplementary information (ESI) available: SEM images, capacity plots, charge–discharge plots. See DOI: 10.1039/c3ra44849e |
| ‡ Experimental details: titanium foils (99.5 wt%, 250 μm thick) were purchased from Alfa Aesar, USA. Prior to electrochemical treatment, the Ti foils were degreased and rinsed by sonicating in ethanol and deionized water, and then covered by Scotch tape at their back. A two-electrode cell composed of a Ti foil as working electrode and a Pt foil as the counter electrode was assembled for anodization. TiO2 nanotubes (designated as B-TN) were synthesized in ethylene glycol (EG, Alfa Aesar) electrolytes containing 0.3 wt% NH4F (MP Biomedicals, USA) and 5 vol% H2O at 70 V for 40 min. After oxidation was completed, samples were immediately rinsed with deionized water, dried and annealed at 450 °C for 1 h in air, to obtain crystalline TiO2 nanotubes. Later, electrochemical deposition of MoO3 onto these oxide nanotubes was carried out using a VersaSTAT 3F potentiostat/galvanostat with FRA (Princeton Applied Research, USA) with a three-electrode setup composed of anodized Ti as the working electrode, a Pt foil as the counter electrode and an Ag/AgCl reference electrode. The deposition was performed in 0.05 M (NH4)6Mo7O24 (Alfa Aesar) aqueous solution by cycling from 0 to −0.7 V with a step rate of 20 mV s−1 for 8 or 16 cycles. The as-deposited TiO2 nanotubes are designated as AMO-TN, which were then annealed in air at 450 °C for 1 h to obtain crystalline MoO3-coated nanotubes (CMO-TN). For comparison, a MoO3 film (400MO) was grown by electrodeposition of MoO3 on Ti via 400 cycles and post thermal treatment at 450 °C for 1 h. The way to measure masses of TiO2 or MoO3 was described in our previous work.14 Areal masses of B-TN, AMO-TN, 400MO and weight ratios of MoO3 are approximately 2.2 mg, 3.0 mg (26.7 wt%) and 0.27 mg. CMO-TN is considered to have the same composition and mass with AMO-TN. A Hitachi S-4800 scanning electron microscope (SEM) and a Hitachi H9000NAR transmission electron microscope (TEM) were employed to observe the oxide films. Their crystallographic structure was determined by X-ray diffraction (XRD) using a Scintag XDS 2000 X-ray diffractometer with Cu Kα radiation at a scan rate of 2° min−1. Chemical composition of deposited TiO2 nanotubes was characterized by an energy dispersive X-ray spectroscope (EDX) with an XFlash detector (Bruker AXS) on SEM, and an X-ray photoelectron spectroscope (XPS) on a Hewlett-Packard 5950A spectrometer using a monochromatized Al Kα X-ray radiation source. All XPS spectra were calibrated according to the binding energy of the C1s peak at 284.8 eV. CR2032 coin cells were assembled with bare and MoO3-deposited TiO2 nanotubes acting as the working electrode. A lithium disc served as the counter and reference electrode, which was separated from these oxide nanotubes by a Celgard 20 μm-thick monolayer polyethylene membrane. Electrolytes were 1 M lithium hexafluorophosphate (LiPF6) dissolved in a mixed solvent of ethylene carbonate and diethylene carbonate in 1 |
| This journal is © The Royal Society of Chemistry 2014 |