 Open Access Article
Creative Commons Attribution 3.0 Unported Licence
Rapid detection of mozzarella and feta cheese adulteration with cow milk through a silicon photonic immunosensor†
Michailia
Angelopoulou
a,
Panagiota S.
Petrou
a,
Ioannis
Raptis
b,
Konstantinos
Misiakos
b,
Evangelia
Livaniou
c,
Eleni
Makarona
*b and
Sotirios
Kakabakos
 *a
*a
aImmunoassays–Immunosensors Lab, Institute of Nuclear &Radiological Sciences & Technology, Energy & Safety, NCSR “Demokritos”, Aghia Paraskevi 15341, Greece. E-mail: skakab@rrp.demokritos.gr
bInstitute of Nanoscience & Nanotechnology, NCSR “Demokritos”, Aghia Paraskevi 15341, Greece. E-mail: e.makarona@inn.demokritos.gr
cImmunopeptide Chemistry Lab, Institute of Nuclear & Radiological Sciences & Technology, Energy & Safety, NCSR “Demokritos”, Aghia Paraskevi 15341, Greece
First published on 20th October 2020
Abstract
Mozzarella di Bufala Campana and Feta are two cheeses with Protected Designation of Origin the fraudulent adulteration of which with bovine milk must be routinely checked to ensure that consumers actually buy these high-end products and avoid health issues related to bovine milk allergy. Here, we employed, for the first time, a silicon-based photonic immunosensor for the detection of mozzarella and feta adulteration with bovine milk. The photonic immunosensor used relies on Mach–Zehnder interferometers monolithically integrated along with their respective light sources on a silicon chip. A rabbit polyclonal antiserum raised against bovine κ-casein was used for the development of a competitive immunoassay realized in three steps, including a reaction with the antiserum, a biotinylated anti-rabbit IgG antibody, and streptavidin. The implementation of this assay configuration significantly reduced the non-specific signal due to the cheese matrix, and allowed completion of the assay in ∼9 min. After optimization of all assay conditions, bovine cheese could be quantified in mozzarella or feta at concentrations as low as 0.5 and 0.25% (w/w), respectively; both quantification limits were below the maximum allowable content of bovine milk in mozzarella and feta (1% w/w) according to the EU regulations. Equally important, the assays were reproducible with intra- and inter-assay coefficients of variation <10%, and exhibited a wide linear dynamic range that extended up to 50 and 25% (w/w) for mozzarella and feta, respectively. Taking into account its performance, the proposed immunosensor may be transformed to a new tool against fraudulent activities in the dairy industry.
1. Introduction
Dairy products such as milk and cheese are widely consumed products of high nutritional value and economic importance in several countries worldwide. Milk for direct consumption or cheese manufacturing could come from different animal species such as cow, goat, sheep, buffalo, etc. Cow milk is the most prevalent for cheese manufacturing; however, worldwide traditional cheeses from milk of other species, such as goat, sheep and buffalo, are quite popular and widely consumed as part of everyday diet or are considered high-end products to be exported. The origin and composition of milk affects the organoleptic properties of the cheese,1 while the higher price and seasonal availability of milk obtained from species other than cattle are the reasons of incidents of fraudulent addition of cow milk during cheese manufacturing to reduce production cost.2–4 Identification of cheese authenticity is mandatory for the protection of consumers who avoid the consumption of cow milk due to allergy or religious/cultural reasons.5,6 In parallel, high-quality cheeses produced exclusively from milk of other species than cattle have been registered according to the law as Protected Designation of Origin (PDO) products. For this reason, the EU and US legislations require the food industry to declare the species origin of milk used for cheese preparation.7,8 In particular, the maximum acceptable content of cow milk in cheese from other species set by the European commission (EC) is 1% (w/w).9According to the EC, the reference method for goat, sheep and buffalo dairy product adulteration with cow milk is performed through isoelectric focusing of γ-caseins.10 To protect consumers from misleading inscription of ingredients labelled on the product package, several methods such as electrophoresis, chromatography, mass spectrometry, liquid chromatography-mass spectrometry and matrix-assisted laser desorption/ionization time-of-flight mass spectrometry (MALDI-ToFMS) have been developed for the detection of milk or cheese fraud.11–18 In recent years, single or multiplex PCR techniques have also been reported for authenticity confirmation of cheeses made from the milk of goat, sheep, buffalo, or a mixture of them.4,19–21 Nevertheless, all of the above methods are time consuming and labor intensive and require expensive instrumentation. On the other hand, enzyme-linked immunosorbent assays (ELISA) employing either monoclonal or polyclonal antibodies against bovine caseins, whey proteins, bovine immunoglobulins and caseinomacropeptides are used for the detection of dairy product adulteration providing the potential for multiple samples’ analysis in a single run.22–24 In addition, immunochromatographic methods, such as lateral flow devices and dipstick tests, have been developed and commercialized as tools for on-site analysis providing, however, semi-quantitative results.24–26
Immunosensors have emerged as alternative methods for adulteration detection in order to combine the quantitative determination offered by ELISA with the on-site detection capability of immunochromatographic methods. Depending on the transducer used, biosensors are distinguished as electrochemical, piezoelectric and optical ones.27–31 The latter offer several competitive advantages, such as signals that are less vulnerable to interference, since the detector is isolated from the sample, the potential of miniaturization and as a corollary the system compactness and portability as well as multi-analyte detection schemes. Even more specifically, label-free immunosensors are suitable for real-time and on-site analysis, since they provide direct signal transduction and high-throughput screening.32 Interferometric sensors in their various formats, e.g., Mach–Zehnder, Young or Bimodal interferometers, single beam and other grating coupled interferometers, are amongst the most sensitive sensing approaches reported in the literature.33–35 Immunosensors based on surface plasmon resonance (SPR) and Mach–Zehnder Interferometry (MZI) have already been used for detection of goat/sheep milk adulteration with bovine milk.36,37 Nonetheless, to the best of our knowledge, there are no reports in the literature regarding the detection of cheese adulteration with cow milk by employing immunosensors.
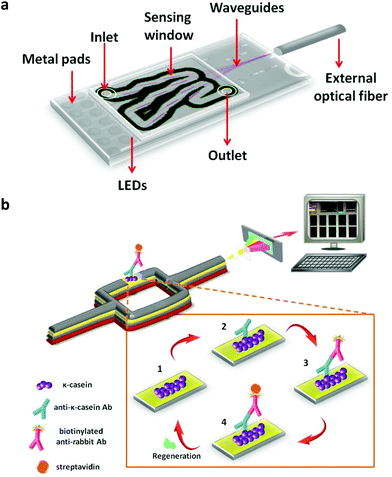
In this work, we present for the first time a label-free optical immunosensor for the rapid and accurate determination of adulteration of two PDO cheeses with bovine milk, namely Mozzarella di Bufala Campana and Greek feta, exploiting Broad-Band MZIs (BB-MZIs) monolithically integrated onto silicon chips. Each chip accommodates 10 planar silicon nitride ridge waveguides along with their respective broad-band (BB) silicon avalanche diodes (LEDs). The BB-MZIs are covered by a silicon oxide cladding layer that has been removed from a 600 μm-long area over the sensing arm to allow for interaction of the waveguided modes with the sample. The 10 BB-MZIs of the chip converge to a single point where an external optical fiber is positioned to collect the transmitted interference spectrum and guide it to a spectrometer (Fig. 1a). The transmission spectra of the 10 BB-MZIs are serially recorded within 10 s, a function that is controlled by an electrical multiplexer. Biomolecular reactions taking place on the sensing arm change the effective refractive index on the waveguide surface resulting in a blue shift of the interference spectrum, thus, providing a way to monitor the biomolecular adlayer growth on the sensing arm. BB-MZIs have been exploited for several applications including goat milk adulteration with bovine milk,37 determination of C-reactive protein in human serum,38 mycotoxins in beer,39 and allergens in food industry rinsing water.40 To achieve the goal of the present work, a polyclonal antibody against bovine κ-casein was raised in rabbits and employed for the development of immunoassay. Due to the polyclonal nature of the developed antibody it was possible to detect the casein fragments, i.e., the caseinomacropeptide which is a whey-peptide produced during cheese making.41 The antiserum produced was characterized in terms of titer and specificity against all milk proteins. On-chip detection of cheese adulteration was achieved by biofunctionalizing the sensing arm of MZI with bovine κ-casein and following a competitive immunoassay format (Fig. 1b). All assay parameters were optimized, while special emphasis was given to the assay configuration so as to alleviate the matrix effects without compromising the assay duration and analytical performance. The assay was quite fast and completed within 9 min with a dynamic range that enabled quantitative detection of bovine milk in mozzarella and feta cheeses at concentrations lower than the maximum allowable level (1% w/w) set by the EC regulations for PDO cheeses.
2. Materials and methods
2.1. Reagents
Commercial feta cheese (DELTA S.A.), buffalo mozzarella (Mozzarella di Bufala Campana, Fattorie Garofalo) and the respective cheeses made of cow milk (white cheese Polykastrou, KOLIOS S.A.; mozzarella Dirollo, OPTIMA S.A.) were purchased from the local market. Bovine κ-, β-, and α-casein, α-lactalbumin, β-lactoglobulin from bovine milk, bovine serum albumin (BSA), bovine immunoglobulins, goat anti-rabbit IgG antibody, streptavidin, and 3-aminopropyl-triethoxysilane (APTES) were purchased from Sigma-Aldrich (Darmstadt, Germany). All other reagents were of analytical grade and were purchased from Sigma-Aldrich. The Bio-Shield Cow Cheese ELISA kit from ProGnosis Biotech S.A. (Larissa, Greece) was used as a comparison method for the detection of adulteration of commercially available buffalo mozzarella and feta cheeses with bovine milk. The water used for the study was doubly-distilled. Biotinylation of goat anti-rabbit IgG antibody was performed following a previously published protocol.422.2. Anti-bovine κ-casein rabbit antiserum production and characterization
The antiserum was developed in-house following a previously described immunization procedure, properly modified.43 Briefly, two New Zealand white rabbits were immunized with bovine-κ-casein (100 μg per animal) emulsified with Freund's adjuvant and administered through multiple intradermal injections. The first immunization was followed by four booster ones, performed four, seven, ten and thirteen weeks after initial exposure. Blood was collected from the central ear vein 10–14 days after each booster immunization. Antiserum was obtained by centrifugation of whole blood. The immunization protocol was approved by the Greek Authorities and the local committee of the Animal House (Institute of Biosciences & Applications, NCSR “Demokritos”), where the experimental procedure was performed. Animal experimentation was performed in accordance with the Presidential Decree 56/2013 for the Protection of Animals used for Scientific Purposes (Directive 2010/63/EU) and approved by the local committee of the Animal House (Institute of Biosciences & Applications, NCSR “Demokritos”) which is a certified installation (EL 25 BIOexp 039, Prefecture of Attica) and the Prefecture of Attica, Division of Agriculture and Veterinary Medicine (license No 1717/24-03-2017).2.3. Preparation of cheese calibrators
Buffalo mozzarella and feta cheese were tested for adulteration with bovine milk using a commercially available ELISA kit with a LOD of 0.04%. It was found that the PDO products used did not contain bovine milk at detectable concentrations, and thus they were used as matrices for the preparation of calibrators. Calibrators for mozzarella were prepared by mixing certain amounts of cow mozzarella to buffalo mozzarella so as to achieve concentrations ranging from 0.5 to 50% (w/w); feta calibrators were prepared by mixing white cheese (prepared from cow milk in a manner similar to feta) with feta to obtain concentrations of 0.25 to 25% (w/w). The mixtures were homogenized using a pestle and mortar, and 1 g from the homogenate was mixed with 1 mL of 10 mM PBS, pH 7.4. After centrifugation at 2000g for 10 min, the supernatant was collected and diluted 50 times with 10 mM PBS, pH 7.4, containing 0.5% (w/v) BSA and 0.9% (w/v) NaCl (assay buffer).2.4. Biofunctionalization of the chips
Silicon chips (8.0 × 4.2 mm2) containing arrays of 10 BB-MZIs along with the respective light sources have been manufactured as described in previous publications.37–40 The protocol for chip biofunctionalization has been described previously.37 Briefly, the cleaning and hydrophylization of silicon chips was performed by O2 plasma treatment (10 mTorr) for 30 s followed by aminosilanization through immersion for 2 min in a 0.5% (v/v) APTES solution. Then, the chips were washed with water, dried under a nitrogen stream, and heated at 120 °C for 20 min. The biological modification of the chip was performed using the BioOdyssey Calligrapher Mini Arrayer (Bio-Rad Laboratories, Inc.). Seven MZIs on each chip were spotted with 100 μg mL−1 κ-casein solution in coating buffer, whereas the rest three with 100 μg mL−1 BSA solution in the same buffer to allow determination of the non-specific binding signal. After the completion of spotting, the chips were left in a controlled humidity chamber (75% humidity) overnight at 4 °C. Then, the chips were washed with 10 mM phosphate buffer, pH 7.4 (washing buffer), blocked with 10 g L−1 BSA in 0.1 M NaHCO3, pH 8.5, for 1 hour, washed again, and dried under a nitrogen stream and were ready for use.2.5. Assay for the detection of bovine cheese in feta and buffalo mozzarella with the MZI immunosensor
The delivery of the reagents over the modified chip surface was performed by attaching on the chip microfluidic modules that have been selected according to a suitable fluidic chamber geometry (Fig. S1a†).40 The microfluidic-covered chip was then placed in the docking station of the measuring apparatus (Fig. S1b†). An injector (Rheodyne 7725i) equipped with a 100 μL loop was used for the introduction of reagents in flow. For the assay, the 50-times diluted cheese calibrators were mixed with a 1![[thin space (1/6-em)]](https://www.rsc.org/images/entities/char_2009.gif) :
:![[thin space (1/6-em)]](https://www.rsc.org/images/entities/char_2009.gif) 150 dilution of rabbit anti-κ-casein antiserum at 1
150 dilution of rabbit anti-κ-casein antiserum at 1![[thin space (1/6-em)]](https://www.rsc.org/images/entities/char_2009.gif) :
:![[thin space (1/6-em)]](https://www.rsc.org/images/entities/char_2009.gif) 1 volume ratio and incubated for 30 min. Then, 100 μL of each calibrator/antiserum mixture were passed over the chip, followed by 100 μL of a 10 μg mL−1 biotinylated anti-rabbit IgG antibody solution and 100 μL of 10 μg mL−1 streptavidin solution in assay buffer using a peristaltic pump. The flow rate was 33 μL min−1 resulting in a total assay time of approximately 9 min. After the completion of the assay a regeneration step was performed by passing sequentially over the chip 100 μL of 40 mM NaOH and 100 μL of 50 mM HCl solution. Then, assay buffer was pumped over the chip for equilibration and the chip was ready for the next run. The transmission spectra of all ten BB-MZIs were recorded sequentially with 1 s to be the integration time per BB-MZI. The BB-MZI responses were presented as phase shifts in TE polarization after Discrete Fourier Transform of the recorded output spectra.44 For the preparation of the calibration curves, the percent ratios of the net calibrator phase shift (Sx) to the net zero calibrator phase shift (S0) were plotted against the content of white cheese and cow mozzarella to feta cheese and buffalo mozzarella, respectively.
1 volume ratio and incubated for 30 min. Then, 100 μL of each calibrator/antiserum mixture were passed over the chip, followed by 100 μL of a 10 μg mL−1 biotinylated anti-rabbit IgG antibody solution and 100 μL of 10 μg mL−1 streptavidin solution in assay buffer using a peristaltic pump. The flow rate was 33 μL min−1 resulting in a total assay time of approximately 9 min. After the completion of the assay a regeneration step was performed by passing sequentially over the chip 100 μL of 40 mM NaOH and 100 μL of 50 mM HCl solution. Then, assay buffer was pumped over the chip for equilibration and the chip was ready for the next run. The transmission spectra of all ten BB-MZIs were recorded sequentially with 1 s to be the integration time per BB-MZI. The BB-MZI responses were presented as phase shifts in TE polarization after Discrete Fourier Transform of the recorded output spectra.44 For the preparation of the calibration curves, the percent ratios of the net calibrator phase shift (Sx) to the net zero calibrator phase shift (S0) were plotted against the content of white cheese and cow mozzarella to feta cheese and buffalo mozzarella, respectively.
3. Results and discussion
The sensor and the associated immunoassay protocol that were developed for the detection of cheese adulteration with cow milk was employed for testing two types of PDO cheeses, namely mozzarella and feta cheese. Mozzarella is traditionally made of buffalo milk, whereas feta cheese from a mixture of sheep/goat milk (usually 70/30% w/w). There are several differences in the milk of species from which the two types of cheeses are made as well as the way they are prepared and preserved. Buffalo milk contains more fat than both sheep and goat milk, whereas sheep milk has higher lactose content than buffalo and goat milk. Moreover, feta is preserved in brine with high salt content, while mozzarella is preserved in whey or brine with low salt content. From these differences the two cheeses are expected to constitute two significantly different matrices with different behaviors and effects on the immunoassay and the sensor response. Therefore, the optimization of the assay parameters was performed for each cheese separately.Prior to the assay optimization, the anti-κ-casein rabbit antisera were characterized using an assay for bovine κ-casein determination previously developed.40 At first, the antisera received by the four bleedings were compared in terms of titer by passing over MZIs coated with bovine κ-casein dilutions of each antiserum ranging from 1![[thin space (1/6-em)]](https://www.rsc.org/images/entities/char_2009.gif) :
:![[thin space (1/6-em)]](https://www.rsc.org/images/entities/char_2009.gif) 20 to 1
20 to 1![[thin space (1/6-em)]](https://www.rsc.org/images/entities/char_2009.gif) :
:![[thin space (1/6-em)]](https://www.rsc.org/images/entities/char_2009.gif) 1000. The antisera titers were determined as the dilutions that provided a phase shift signal of 1 rad. It was found that the antiserum received from the 1st and 2nd bleeding did not provide a noticeable signal when used at dilutions as low as 1
1000. The antisera titers were determined as the dilutions that provided a phase shift signal of 1 rad. It was found that the antiserum received from the 1st and 2nd bleeding did not provide a noticeable signal when used at dilutions as low as 1![[thin space (1/6-em)]](https://www.rsc.org/images/entities/char_2009.gif) :
:![[thin space (1/6-em)]](https://www.rsc.org/images/entities/char_2009.gif) 50, whereas the antisera received by the 3rd and 4th had a titer of 1
50, whereas the antisera received by the 3rd and 4th had a titer of 1![[thin space (1/6-em)]](https://www.rsc.org/images/entities/char_2009.gif) :
:![[thin space (1/6-em)]](https://www.rsc.org/images/entities/char_2009.gif) 350 and 1
350 and 1![[thin space (1/6-em)]](https://www.rsc.org/images/entities/char_2009.gif) :
:![[thin space (1/6-em)]](https://www.rsc.org/images/entities/char_2009.gif) 300, respectively. Thus, the antiserum received from the 3rd bleeding was employed for the development of assays for bovine cheese detection in feta and buffalo mozzarella.
300, respectively. Thus, the antiserum received from the 3rd bleeding was employed for the development of assays for bovine cheese detection in feta and buffalo mozzarella.
The specificity of the anti-bovine κ-casein antiserum with respect to total bovine casein, β-casein, α-casein, α-lactalbumin, β-lactoglobulin, serum albumin and bovine immunoglobulins was also determined. For this purpose, MZIs were coated with bovine κ-casein and reacted with a 1![[thin space (1/6-em)]](https://www.rsc.org/images/entities/char_2009.gif) :
:![[thin space (1/6-em)]](https://www.rsc.org/images/entities/char_2009.gif) 350 antiserum dilution in the presence of different concentrations of κ-casein, whole casein, β- and α-casein, α-lactalbumin, β-lactoglobulin, serum albumin and bovine immunoglobulins in assay buffer following a previously published assay protocol.40 From the inhibition curves obtained (Fig. S2†), percent cross-reactivity values of 13.8 and 6.7% for whole casein and β-casein, respectively, were calculated. It should be noted that the cross-reactivity observed for whole casein is expected, since κ-casein represents 12–15% of the whole casein.45 Regarding α-casein, α-lactalbumin, β-lactoglobulin, serum albumin and bovine immunoglobulins, using solutions with a concentration as high as 100 μg mL−1, there was not any noticeable signal drop, indicating the absence of antibody cross-reactivity against those substances. Thus, the developed antibody is highly specific for bovine κ-casein.
350 antiserum dilution in the presence of different concentrations of κ-casein, whole casein, β- and α-casein, α-lactalbumin, β-lactoglobulin, serum albumin and bovine immunoglobulins in assay buffer following a previously published assay protocol.40 From the inhibition curves obtained (Fig. S2†), percent cross-reactivity values of 13.8 and 6.7% for whole casein and β-casein, respectively, were calculated. It should be noted that the cross-reactivity observed for whole casein is expected, since κ-casein represents 12–15% of the whole casein.45 Regarding α-casein, α-lactalbumin, β-lactoglobulin, serum albumin and bovine immunoglobulins, using solutions with a concentration as high as 100 μg mL−1, there was not any noticeable signal drop, indicating the absence of antibody cross-reactivity against those substances. Thus, the developed antibody is highly specific for bovine κ-casein.
3.1. Optimization of the assay for detection of mozzarella cheese adulteration
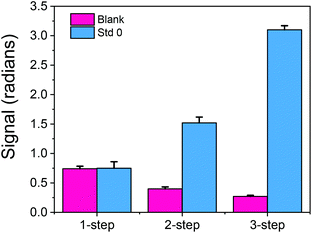
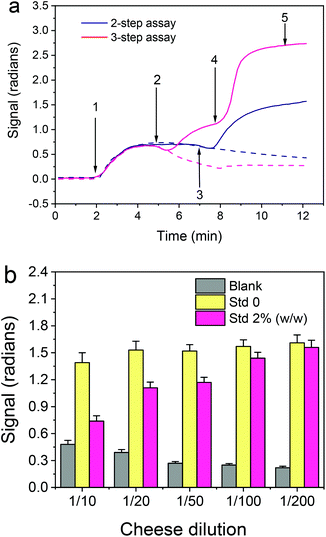
In the first experiments, the duration of each step, i.e. of the primary immunoreaction, the reaction with the secondary antibody (biotinylated or not) and streptavidin, was 5 min. In an attempt to keep the assay duration under 10 min without compromising the absolute signal received with the 3-step assay and due to the fact that the solution was introduced into the sensor using an injector with a 100 μL sample loop, the signals received following the 2-step assay for a flow rate of 22 μL min−1 (so as each assay step to last <5 min) were compared to those received with the 3-step assay for a flow rate of 33 μL min−1 (so as each assay step would last ∼3 min). As shown in Fig. 3a, even with reduction of both the primary and secondary immunoreaction duration from 5 to 3 min, the signal received with the three step assay was 75% higher than the signal received following the two step assay format.
Once the assay format was selected, the dilution of cheese extract to be used in the assay was determined. As shown in Fig. 3b, the zero calibrator signal was stable for cheese extract dilution equal to or higher than 20-times, while the blank BB-MZI signal was reduced as the cheese extract dilution increased and acquired minimum values for dilutions equal to or higher than 1/50. These results in combination with the fact that the % signal drop obtained for a calibrator containing 2% (w/w) bovine mozzarella did not considerably differ for cheese extract dilutions of 1/20 and 1/50, therefore in order to expand the assay dynamic range, 1/50 dilution was selected for the final assay protocol.
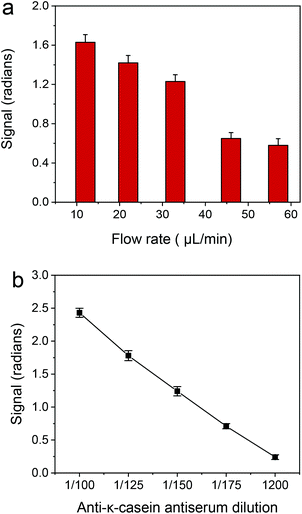
In a second step, the optimum antiserum dilution to be used was determined. As shown in Fig. 4b, the zero calibrator signal dropped as the antiserum dilution used in the assay increased from 1![[thin space (1/6-em)]](https://www.rsc.org/images/entities/char_2009.gif) :
:![[thin space (1/6-em)]](https://www.rsc.org/images/entities/char_2009.gif) 100 to 1
100 to 1![[thin space (1/6-em)]](https://www.rsc.org/images/entities/char_2009.gif) :
:![[thin space (1/6-em)]](https://www.rsc.org/images/entities/char_2009.gif) 200 (corresponding to dilution of 1
200 (corresponding to dilution of 1![[thin space (1/6-em)]](https://www.rsc.org/images/entities/char_2009.gif) :
:![[thin space (1/6-em)]](https://www.rsc.org/images/entities/char_2009.gif) 200–1
200–1![[thin space (1/6-em)]](https://www.rsc.org/images/entities/char_2009.gif) :
:![[thin space (1/6-em)]](https://www.rsc.org/images/entities/char_2009.gif) 400 in the reaction mixture, respectively). At the same time the assay sensitivity, i.e., the percent signal drop obtained for calibrators containing cow cheese increased, as the antiserum dilution was increased from 1
400 in the reaction mixture, respectively). At the same time the assay sensitivity, i.e., the percent signal drop obtained for calibrators containing cow cheese increased, as the antiserum dilution was increased from 1![[thin space (1/6-em)]](https://www.rsc.org/images/entities/char_2009.gif) :
:![[thin space (1/6-em)]](https://www.rsc.org/images/entities/char_2009.gif) 100 to 1
100 to 1![[thin space (1/6-em)]](https://www.rsc.org/images/entities/char_2009.gif) :
:![[thin space (1/6-em)]](https://www.rsc.org/images/entities/char_2009.gif) 200. Therefore, as a trade-off between the absolute signal and the assay sensitivity a 1
200. Therefore, as a trade-off between the absolute signal and the assay sensitivity a 1![[thin space (1/6-em)]](https://www.rsc.org/images/entities/char_2009.gif) :
:![[thin space (1/6-em)]](https://www.rsc.org/images/entities/char_2009.gif) 150 antiserum dilution was selected for the final protocol.
150 antiserum dilution was selected for the final protocol.
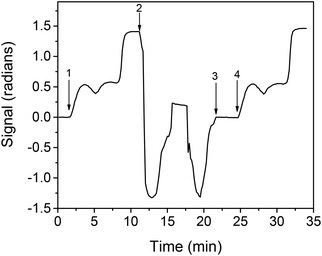
Finally, another aspect investigated was the potential of chip regeneration after the assay completion, i.e., the removal of the bound to immobilized κ-casein molecules (primary antibody, secondary antibody, and streptavidin), so as to render the chip ready for a new assay cycle, an attribute that can considerably reduce the cost of the chip as a consumable. Based on the previous experience with regard to regenerating and re-using the BB-MZI chips,34–37 a 50 mM HCl and a 40 mM NaOH solution were tested. It was found that neither of them resulted in adequate removal of the bound biomolecules. However, as shown in the real-time response graph presented in Fig. S4,† complete removal of the bound biomolecules was achieved by passing at first a 40 mM NaOH solution (which removed almost 80% of the bound molecules) followed by a 50 mM HCl solution. Therefore, for the detection of adulteration of buffalo mozzarella with cow milk, regeneration can be achieved by running sequentially over the chip 40 mM NaOH and 50 mM HCl for 3 min each. Applying the selected regeneration procedure, repetitive assay/regeneration cycles have been performed in the κ-casein coated chips. In Fig. 5, the real-time response during two assay cycles, one prior to and one after regeneration, is presented. As shown, the response obtained prior to regeneration is the same as that obtained after regeneration. Moreover, as shown in Fig. S5,† where the net zero calibrator values obtained from a single chip for 11 repetitive assay/regeneration cycles are provided, the values for the first 9 assay cycles were within the mean value ±2SD limits, indicating that each chip could be used up to 9 times.
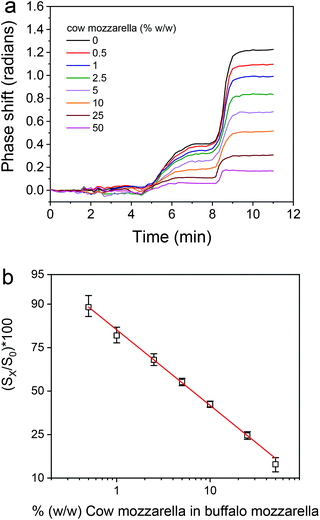
Once the assay parameters were set, calibrators containing 0.5 to 50% cow cheese in buffalo mozzarella were prepared and run over the chip. The real-time responses provided by the bovine κ-casein coated MZIs are depicted in Fig. S6† along with the response obtained from a blank sensor, whereas in Fig. 6a the net responses obtained after subtraction of the blank sensor response are presented. As shown, although the differences in the signal obtained for the different calibrators were not easily discernible during the primary immunoreaction they were easily distinguished both during the subsequent reaction with the biotinylated secondary antibody and even more during the reaction with streptavidin. The calibration curve of the assay is depicted in Fig. 6b.
3.2. Optimization of feta cheese adulteration detection
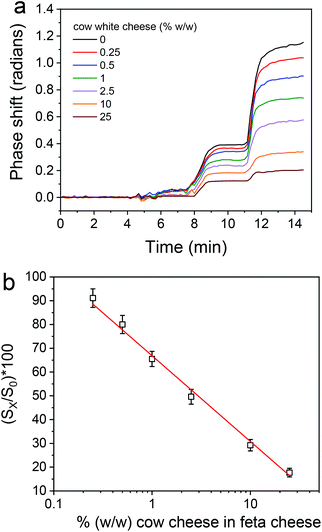
The optimization of the assay for detection of feta cheese adulteration with cow milk included the optimization of the same parameters as for buffalo mozzarella adulteration detection. It was found that the optimum conditions with respect to rabbit anti-bovine κ-casein dilution, the flow rate of the reagents, the cheese extract dilution, and the assay format and duration were the same as those determined for mozzarella. Nonetheless, there was a clear difference in the matrix effect between feta and mozzarella, since as shown in Fig. S7,† where the real-time responses from bovine κ-casein coated BB-MZIs corresponding to different calibrators are provided along with the response of a blank sensor, the blank sensor response returned to values close to zero after the primary immunoreaction, i.e., during the reaction with the biotinylated secondary antibody and streptavidin. Regardless of that, as in the case of mozzarella, it was not possible to distinguish the signal corresponding to different calibrators by monitoring the primary immunoreactions, even after subtraction of the blank sensor response (Fig. 7a), whereas it was easy to distinguish between the different calibrators during the reaction with the biotinylated secondary antibody and the streptavidin. A typical linearized calibration curve is provided in Fig. 7b, from which it is deduced that the linear response range of the assay extents from 0.25 to 25% cow milk in feta cheese.From the linearized calibration curve presented in Fig. 7b, the assay detection and quantification limits were determined as the cow cheese percentage corresponding to the signal equal to 100-3SD and 100-6SD of the mean zero calibrator signal obtained from the measurements of 21 MZIs and were 0.125 and 0.25% (w/w), respectively.
The intra- and inter-assay coefficients of variation (CV) have been determined by preparing three samples containing 0.7, 7.0 and 20% (w/w) cow cheese. In particular, the intra-assay CV was determined by running each sample 3 times in a single day (21 sensors in total), while the inter-assay CV was calculated by running twice each sample in five different days, and they were found to be less than 6.8 and 9.2%, respectively.
4. Conclusions
A rapid and sensitive silicon photonic immunosensor for the detection of buffalo mozzarella and feta cheese adulteration with bovine milk has been developed using an in-house anti-bovine κ-casein rabbit antiserum. The quantification limits determined for bovine cheese detection in mozzarella and feta were 0.5 and 0.25% (w/w), respectively, allowing adulteration detection at levels below the allowable 1% (w/w) limit for bovine milk presence in cheeses prepared from the milk of species other than cows as set by the EU regulations. In addition to the increased sensitivity, the sensor has a broad linear dynamic range, up to 50% (w/w) for mozzarella and 25% (w/w) for feta, allowing detection along this range with a fixed dilution of cheese extract. The sensor is, to the best of our knowledge, the first sensor reported so far in the literature that addresses this subject of significant economic and health implications, and it is also the first that combines short testing times with a low detection limit. The fact that the silicon photonic sensor can be applied to detect adulteration with bovine milk in two cheeses that are very different regarding their composition as well as the method of their preparation and preservation is indicative of its potential for adulteration detection in other kinds of cheese and widespread application in dairy product quality controls.Conflicts of interest
There are no conflicts to declare.Acknowledgements
M. Angelopoulou was supported by the program of Industrial Scholarships of Stavros Niarchos Foundation. The authors wish to thank the personnel of the Animal House of NCSR “Demokritos” for excellent technical assistance and the technical staff of the Nanotechnology and Microsystems Laboratory of INN, part of the “National Infrastructure in Nanotechnology, Advanced Materials and Micro-/Nanoelectronics” INNOVATION-EL (MIS 5002772) which is implemented under the Action “Reinforcement of the Research and Innovation Infrastructure”, funded by the Operational Programme “Competitiveness, Entrepreneurship and Innovation” (NSRF 2014-2020) and co-financed by Greece and the European Union (European Regional Development Fund). This work was also supported in part by the EU-funded Project “FOODSNIFFER” (FP7-ICT-318319).References
- K. Raynal-Ljutovac, G. Lagriffoul, P. Paccard, I. Guillet and Y. Chilliard, Small Rumin. Res., 2008, 79, 57–72 CrossRef.
- H. K. Mayer, Int. Dairy J., 2005, 15, 595–604 CrossRef CAS.
- M. Borkova and J. Snaselova, Czech J. Food Sci., 2005, 23, 41–50 CrossRef CAS.
- A. K. Seçkin, B. Yilmaz and H. Tosun, LWT–Food Sci. Technol., 2017, 77, 332–336 CrossRef.
- R. E. Goodman, S. L. Taylor, J. Yamamura, T. Kobayashi, H. Kawakami, C. L. Kruger and G. P. Thompson, Food Chem. Toxicol., 2007, 45, 1787–1794 CrossRef CAS.
- B. Shatenstein and P. Ghadirian, Nutrition, 1998, 14, 223–230 CrossRef CAS.
- European Parliament and Council, Off. J. Eur. Commun., 2000, L109, 29–42 Search PubMed.
- European Parliament and Council, Off. J. Eur. Commun., 2003, L308, 15–18 Search PubMed.
- Food Allergen Labeling and Consumer Protection Act of 2004, Public Law 108-282, August 2, 2004.
- Commission Regulation EC No 273/2008 of 5 March 2008, Off. J. Eur. Commun., 2008, L88, 53–61 Search PubMed.
- N. A. Chávez, E. Salinas, J. Jauregui, L. A. Palomares and K. Macías, Food Agric. Immunol., 2008, 19, 265–272 CrossRef.
- B. H. R. F. Gonçalves, G. de J. Silva, S. F. O. Pontes, R. da C. I. Fontan, A. S. Egito and S. P. B. Ferrão, Int. J. Food Sci. Technol., 2016, 51, 1586–1593 CrossRef.
- G. Enne, D. Elez, F. Fondrini, I. Bonizzi, M. Feligini and R. Aleandri, J. Chromatogr. A, 2005, 1094, 169–174 CrossRef CAS.
- S. Camerini, E. Montepeloso, M. Casella, M. Crescenzi, R. M. Marianella and F. Fuselli, Food Chem., 2016, 197, 1240–1248 CrossRef CAS.
- C. Dal Bosco, S. Panero, M. A. Navarra, P. Tomai, R. Curini and A. Gentili, J. Agric. Food Chem., 2018, 66, 5410–5417 CrossRef CAS.
- T. M. C. Motta, R. B. Hoff, F. Barreto, R. B. S. Andrade, D. M. Lorenzini, L. Z. Meneghini and T. M. Pizzolato, Talanta, 2014, 120, 498–505 CrossRef CAS.
- R. Cozzolino, S. Passalacqua, S. Salemi and D. Garozzo, J. Mass Spectrom., 2002, 37, 985–991 CrossRef CAS.
- C. D. Calvano, C. De Ceglie, A. Monopoli and C. G. Zambonin, J. Mass Spectrom., 2012, 47, 1141–1149 CrossRef CAS.
- C. Agrimonti, A. Pirondini, M. Marmiroli and N. Marmiroli, Food Chem., 2015, 187, 58–64 CrossRef CAS.
- M. Feligini, I. Bonizzi, V. C. Curik, P. Parma, G. F. Greppi and G. Enne, Food Technol. Biotechnol., 2005, 43, 91–95 CAS.
- I. Ganopoulos, I. Sakaridis, A. Argiriou, P. Madesis and A. Tsaftaris, Food Chem., 2013, 141, 835–840 CrossRef CAS.
- I. P. Hurley, R. C. Coleman, H. E. Ireland and J. H. H. Williams, Int. Dairy J., 2006, 16, 805–812 CrossRef CAS.
- I. M. López-Calleja, I. González, V. Fajardo, P. E. Hernández, T. García and R. Martín, Int. Dairy J., 2007, 17, 87–93 CrossRef.
- N. Stănciuc and G. Râpeanu, Food Agric. Immunol., 2010, 21, 157–164 CrossRef.
- H. Colak, A. Aydin, B. Nazli and O. Ergun, Food Control, 2006, 17, 905–908 CrossRef CAS.
- P. Galan-Malo, I. Mendiara, P. Razquinand and L. Mata, Food Addit. Contam., Part A, 2018, 35, 599–604 CrossRef CAS.
- C. Crosson and C. Rossi, Biosens. Bioelectron., 2013, 42, 453–459 CrossRef CAS.
- S. Eissa, C. Tlili, L. L'Hocine and M. Zourob, Biosens. Bioelectron., 2012, 38, 308–313 CrossRef CAS.
- Q. Cao, H. Zhao, Y. Yang, Y. He, N. Ding, J. Wang, Z. Wu, K. Xiang and G. Wang, Biosens. Bioelectron., 2011, 26, 3469–3474 CrossRef CAS.
- S. Muller-Renaud, D. Dupont and P. Dulieu, Food Agric. Immunol., 2003, 15, 265–277 CrossRef CAS.
- W. Haasnoot, G. R. Marchesini and K. Koopal, J. AOAC Int., 2006, 89, 849–855 CrossRef CAS.
- R. Pilolli, L. Monaci and A. Visconti, Trends Anal. Chem., 2013, 47, 12–26 CrossRef CAS.
- P. Kozma, A. Hamori, S. Kurunczi, K. Cottier and R. Horvath, Sens. Actuators, B, 2011, 155, 446–450 CrossRef CAS.
- D. Patko, K. Cottier, A. Hamori and R. Horvath, Opt. Express, 2012, 20, 23162 CrossRef.
- A. B. Gonzalez-Guerrero, J. Maldonado, S. Herranz and L. M. Lechuga, Anal. Methods, 2016, 8, 8380–8394 RSC.
- W. Haasnoot, N. G. E. Smits, A. E. M. Kemmers-Voncken and M. G. E. G. Bremer, J. Dairy Res., 2004, 71, 322–329 CrossRef CAS.
- M. Angelopoulou, A. Botsialas, A. Salapatas, P. S. Petrou, W. Haasnoot, E. Makarona, J. Gerhard, D. Goustouridis, A. Siafaka-Kapadai, I. Raptis, K. Misiakos and S. E. Kakabakos, Anal. Bioanal. Chem., 2015, 407, 3995–4004 CrossRef CAS.
- A. Psarouli, A. Botsialas, A. Salapatas, G. Stefanitsis, D. Nikita, G. Jobst, N. Chaniotakis, D. Goustouridis, E. Makarona, P. S. Petrou, I. Raptis, K. Misiakos and S. E. Kakabakos, Talanta, 2017, 165, 458–465 CrossRef CAS.
- V. Pagkali, P. S. Petrou, E. Makarona, J. Peters, W. Haasnoot, G. Jobst, I. Moser, K. Gajos, A. Budkowski, A. Economou, K. Misiakos, I. Raptis and S. E. Kakabakos, J. Hazard. Mater., 2018, 359, 445–453 CrossRef CAS.
- M. Angelopoulou, P. S. Petrou, E. Makarona, W. Haasnoot, I. Moser, G. Jobst, D. Goustouridis, M. Lees, K. Kalatzi, I. Raptis, K. Misiakos and S. E. Kakabakos, Anal. Chem., 2018, 90, 9559–9567 CrossRef CAS.
- N. A. Chávez, J. Jauregui, L. A. Palomares, K. E. Macías, M. Jiménez and E. Salinas, Dairy Sci. Technol., 2012, 92, 121–132 CrossRef.
- D. Tsounidi, G. Koukouvinos, P. Petrou, K. Misiakos, G. Zisis, D. Goustouridis, I. Raptis and S. E. Kakabakos, Sens. Actuators, B, 2019, 282, 104–111 CrossRef CAS.
- E. Livaniou, G. P. Evangelatos and D. S. Ithakissios, Clin. Chem., 1987, 33, 1983–1988 CrossRef CAS.
- K. Misiakos, I. Raptis, A. Salapatas, E. Makarona, A. Botsialas, M. Hoekman, R. Stoffer and G. Jobst, Opt. Express, 2014, 22, 8856–8870 CrossRef CAS.
- D. T. Davies and J. R. Law, J. Dairy Res., 1977, 44, 447–454 CrossRef CAS.
Footnote |
| † Electronic supplementary information (ESI) available. See DOI: 10.1039/d0an01706j |
| This journal is © The Royal Society of Chemistry 2021 |

