
 Open Access Article
 This Open Access Article is licensed under a Creative Commons Attribution-Non Commercial 3.0 Unported Licence
The origin of chemical inhomogeneity in garnet electrolytes and its impact on the electrochemical performance†
Rowena H.
Brugge
 a,
Federico M.
Pesci
a,
Andrea
Cavallaro
a,
Christopher
Sole
bc,
Mark A.
Isaacs
d,
Gwilherm
Kerherve
a,
Robert S.
Weatherup
ce and
Ainara
Aguadero
*a
a,
Federico M.
Pesci
a,
Andrea
Cavallaro
a,
Christopher
Sole
bc,
Mark A.
Isaacs
d,
Gwilherm
Kerherve
a,
Robert S.
Weatherup
ce and
Ainara
Aguadero
*a
aImperial College London, Department of Materials, Exhibition Road, London, SW7 2AZ, UK. E-mail: a.aguadero@imperial.ac.uk
bDepartment of Chemistry, University of Manchester, Oxford Road, Manchester, M13 9PL, UK
cThe Faraday Institution, Quad One, Harwell Science and Innovation Campus, Didcot, OX11 0RA, UK
dHarwellXPS, Research Complex at Harwell, Harwell Science and Innovation Campus, Didcot, Oxfordshire OX11 0FA, UK
eUniversity of Oxford, Department of Materials, Parks Road, Oxford, OX1 3PH, UK
First published on 3rd July 2020
Abstract
The interface between solid electrolytes and lithium metal electrodes determines the performance of an all-solid-state battery in terms of the ability to demand high power densities and prevent the formation of lithium dendrites. This interface depends strongly on the nature of the solid electrolyte surface in contact with the metallic anode. In the garnet electrolyte/Li system, most papers have focused on the role of current inhomogeneities induced by void formation in the Li metal electrode and the presence of insulating reaction layers following air exposure. However, extended defects in the solid electrolyte induced by chemical and/or structural inhomogeneities can also lead to uneven current distribution, impacting the performance of these systems. In this work, we use complementary surface analysis techniques with varying analysis depths to probe chemical distribution within grains and grain boundaries at the surface and in the bulk of garnet-type electrolytes to explain their electrochemical performance. We show that morphology, post-treatments and storage conditions can greatly affect the surface chemical distribution of grains and grain boundaries. These properties are important to understand since they will dictate the ionic and electronic transport near the interfacial zone between metal and electrolyte which is key to determining chemo-mechanical stability.
1. Introduction
The use of a metallic lithium electrode in place of the current state-of-the-art graphitic anode in Li-ion batteries is expected to enable cells with higher energy densities as a result of the large theoretical capacity of lithium metal (3860 mA h g−1). Unsolved problems with safety due to side reactions and dendritic lithium formation in flammable liquid-electrolyte-based cells have led to the search for a solid-electrolyte-based alternative in the form of an ‘all-solid-state’ battery. However, several problems remain for the interface between the solid electrolyte and Li metal anode.The wide electrochemical stability window of fast-ionic conducting Li7La3Zr2O12 (LLZO) garnets1 means that they are in principle compatible with Li metal as an electrode.2 This, in combination with the mechanical hardness of the ceramic (hardness/yield strength of 6.3 GPa for LLZO compared to 0.655 GPa for metallic lithium),3 was expected to suppress the Li dendrite formation4 that commonly occurs with liquid or polymer electrolytes. However, poor electrode–electrolyte contact and resulting limited exchange current densities before dendrite formation have so far prevented the implementation of the garnets as viable solid electrolytes in Li metal battery applications.
To date, two areas of research have been explored in order to explain the performance of the Li|LLZO interface: (1) the role of the metallic Li in terms of its mechanical properties (creep and void formation during plating/stripping cycles) and (2) the surface chemistry of LLZO (especially in terms of reaction products forming at the surface).
Krauskopf et al. investigated the pressure-dependent electrode kinetics of the Li|LLZO interface,5 in which they show that both contact geometry and ionic transport in the garnet electrolyte dominate the interfacial contribution for a clean interface under equilibrium. They found that by exerting pressures exceeding 100 MPa they could almost entirely remove the interfacial resistance. This was ascribed to plastic deformation of the lithium metal under the high pressures used which prevented void formation and the associated constriction resistances which contribute to high interfacial resistance. Further studies built on the idea of tailoring a metal electrode through alloying with e.g. Mg to address the vacancy diffusion limitation without the need for high stack pressures.6
Looking to the LLZO component of the interface, it has been acknowledged for some time now that the facile reaction of LLZO with moisture and air leads to surface lithium hydroxide and carbonate formation, which hinder the lithium ion transfer across the interface.7,8 The effect of these surface corrosion layers on the interfacial impedance and their existence as studied by X-ray Photoelectron Spectroscopy (XPS) was reported by Zhu et al.9 Following sintering (and storage in a glove box for several days), both Li2CO3 and LiOH were seen on the surface of the pellets. After polishing in the glove box (using 1200-grit SiC emery paper, and immediate vacuum transfer to XPS), most (but not all) Li2CO3 is removed, and significant LiOH remains. Subsequent ultra-high vacuum annealing at 80 °C (10−9 mbar, in the XPS chamber), led to the removal of LiOH, with further removal of all Li2CO3 after annealing to 500 °C. On moving back into the glove box, surface contaminants reform after 5 minutes, returning to a state like the polished surface after 3 hours.
Sharafi et al.10 investigated the relationships between corrosion layers, lithium wettability, and facile charge transport. Wet polishing using glycol paste and ethanol down to a roughness of 0.5 μm produced a surface which consisted of predominantly hydroxide species, while a greater concentration of carbonate species existed on the dry polished sample (polished using 1200-grit SiC in air). This suggested that the use of polishing fluid protects the LLZO surface from the reformation of carbonate species. Heating the samples in an argon filled glove box up to 500 °C was found to remove LiOH but was less effective at removing Li2CO3. The successive combination of wet polishing and high temperature treatments was shown to be the most effective at removing both carbonate and hydroxide surface contamination layers. More recently Sharafi et al. and Krauskopf et al. showed that removing this carbonate layer to reveal a thoroughly clean surface leads to the Li|LLZO interface having a negligible interfacial resistance.5,10
However, the presence of non-uniformities or “lattice distortions”,5 due to the inherent polycrystalline nature of solid electrolytes, as well as pre-existing defects on the LLZO electrolyte surface (for example, proton-rich LLZO),11 may significantly affect the behavior of the Li|LLZO interface, even after surface treatments to remove corrosion layers and ensuring good electrode/electrolyte contact (e.g. applied pressure). As such, the characterization of these features is important for an increased understanding of possible interactions occurring during cell operation.
This study utilizes multiple surface analysis tools to probe the nature of the surface of cubic Ga-doped LLZO polycrystalline pellets (Ga-LLZO) following different surface treatments: polishing and thermal etching. Time of Flight-Secondary Ion Mass Spectrometry (ToF-SIMS) is used to follow the changing surface, highlighting the surface activation effect of thermal etching which can result in lower resistance interfaces with lithium metal electrodes but also faster reactivity with carbon dioxide and water. XPS is used to follow the formation and changes to the corrosion products during heat treatments under vacuum (using a variable temperature in situ XPS setup). SIMS depth profiles and mapping highlight the chemical non-uniformities on the surfaces of Ga-LLZO, in terms of the grain boundary chemistry and the segregation of Ga and Al species in grain boundaries, pores and the distribution across different grains in the same material. As such, this study provides new insights into the surface chemistry of garnet LLZO electrolytes that strongly determines their functionality and durability for energy storage applications.
2. Experimental section
2.1. Preparation of Ga-LLZO electrolyte
Li6.55Ga0.15La3Zr2O12 was prepared by a modified sol–gel route as described previously.11,12 Ga2O3 (99.98%), LiNO3 (99%), La2(NO3)3·6H2O (99.9%) and Zr(IV) 2,4-pentanedionate, C20H28O8 (99.99%) (all Alfa Aesar) were used as reagents and dissolved in citric acid (10 wt%, equivalent to 0.542 M, approx. 200 ml, Sigma Aldrich) and a small amount of nitric acid to aid dissolution (68 wt%, approx. 5–10 ml, VWR Chemicals), with 10 wt% LiNO3 excess added to allow for Li2O losses during sintering. The resulting solution was heated whilst stirring on a hotplate to form a gel, followed by heating in a combustion furnace (fitted with an exhaust chimney) at 600 °C for 12 hours and cooled to 100 °C before removal to the glove box to prevent condensation of moisture. The combusted powder was milled into a fine powder in an agate mortar and heated to 800 °C for 12 hours in an alumina crucible in a tube furnace under dry flowing oxygen (N6; 99.9999%) with a heat and cool rate of 5 °C min−1. The as-produced powder was cold-pressed into pellets and sintered in an alumina crucible under argon, heating for 6 hours at 1150 °C at a rate of 5 °C min−1. The green pellets were surrounded by a bed of the mother powder to reduce Li2O loss. All processing steps (milling, pellet forming) were carried out in an argon-filled glove box (<0.3 ppm H2O, <10 ppm O2) to prevent degradation processes associated with proton–lithium exchange in humid atmosphere. Pellets described as polished were subject to a polishing regime consisting of consecutive polishing steps with 320, 800, 1200, 2400 and 4000-grit SiC polishing papers, the first four steps being carried out outside the glove box with ethanol, and the final dry polish inside the glove box with 4000-grit paper. Prior to this final step, the pellets were dried under dynamic vacuum in the transfer to the glove box. The etched pellets were thermally treated under argon atmosphere at 4 mbar to 900 °C for 30 minutes in a platinum-foil lined crucible, with 5 °C min−1 heating and cooling rates.2.2. Material characterization
The microstructure of the Ga-LLZO pellets was investigated using a Phenom ProX desktop SEM microscope (Thermo Fisher Scientific), using an accelerating voltage of 10 kV.In situ, variable temperature XPS was carried out from RT to 800 °C and back to RT at 200 °C intervals using a Kratos Analytical AXIS Supra+ spectrometer with a chamber pressure below 10−8 mbar at the EPSRC National Facility for X-Ray Photoelectron Spectroscopy at the Harwell Campus, UK. This system has a monochromated Al Kα X-ray source (incident photon energy, hν = 1486.6 eV), a spherical sector analyser, and 3 multichannel resistive plate, 128 channel delay line detectors. All spectra were recorded at 150 W and a spot size of 700 by 300 μm. Survey scans were recorded at a pass energy of 160 eV, and high-resolution scans recorded at a pass energy of 20 eV. Electronic charge neutralization was achieved using an electron flood gun. Filament current = 0.27 A, charge balance = 3.3 V, filament bias = 3.8 V. Samples underwent a final fine polish with 4000-grit SiC paper in an Ar glovebox before being transferred to the spectrometer. Energy calibration of the acquired spectra was performed by alignment of the O 1s peaks for lattice oxygen using a binding energy of 530.1 eV (similar to that reported for ZrO2 and the chemically similar Li5La3Ta2O12).13,14
Room temperature XPS spectra of etched and polished samples left in the glove box for several hours were recorded on a Thermo Scientific K-Alpha+ spectrometer with a chamber pressure of 2 × 10⁻⁹ mbar and an Al Kα X-ray source (incident photon energy, hν = 1486.6 eV), with a double focussing 180° hemispherical analyser and 2D detector. Samples were transferred under argon and measurements were taken using an X-ray spot size of 565 by 400 μm and a flood gun for charge compensation. Data were collected at pass energies of 200 eV for survey, and 20 eV for high resolution spectra. The binding energy of the obtained XPS spectra was calibrated with respect to the C 1s peak of adventitious carbon at 284.8 eV, as the lattice O 1s peak used for the calibration of the in situ XPS spectra is hidden under the thick corrosion layers in both samples here. XPS fitting is performed using the Avantage ToPlot program15 by deconvoluting Voigt-type line-shapes, preceded by subtracting a Shirley-type background (for Zr 3d spectra) and linear background (for Li 1s spectra).
The chemical homogeneity and phase composition at the surface of the polycrystalline pellets was studied using ToF-SIMS (ToF-SIMS V system, ION-TOF GmbH, Munster, Germany), using a 25 keV Bi+ primary beam for analysis and a variety of sputter beams (1 keV O2+ and 10 keV Arn+, selected to alter the analysis depth of the measurement) rastered over an area of 500 by 500 μm, operating under non-interlaced burst alignment mode (using a 1s:1s:1s sputter:wait:analyze cycle). The analyzed area was 200 by 200 μm, with either positive or negative secondary ions detected. Data analysis was carried out with SurfaceLab 6.7 (ION-TOF GmbH) software. Where applicable, transfer of the pre-mounted samples was done by sealing the samples in a vacuum suitcase in the glove box before opening under high vacuum (>10−7 mbar) once inside the SIMS load lock pre-chamber. Charge compensation during ion bombardment of the samples was achieved by flooding the sample surface with ∼20 eV electrons.
A Qtac100 LEIS instrument from ION-TOF GmbH was employed for the LEIS measurements, operated using a He ion 3 keV source as the noble gas analysis primary beam, scanning over an area 750 by 750 μm in each analysis. In this instrument the ion beam is normal to the sample surface. Primary ions that are scattered through an angle of 145° (±1°) are detected by a double toroidal analyzer (DTA). To perform the LEIS depth profiling analysis, the primary He+ beam was cycled with a 0.5 keV Ar+ sputtering beam with a pause of one second between cycles. The sputter beam is rastered on the sample surface over an area of 1500 by 1500 μm. The He+ 3 keV ion dose for the LEIS analysis was approximately 7 × 10¹⁴ ions per cm2 with a beam current of 5000 pA. Each Ar+ 0.5 keV sputter cycle dose was larger at ∼3.4 × 10¹⁵ ions per cm2 at a current of 100 nA.
2.3. Electrochemical characterization
Electrochemical impedance spectroscopy (EIS) measurements were performed using a Solartron 1260 impedance analyzer in the frequency range 13 MHz to 1 Hz at 25 °C with a signal amplitude of 10 mV. To prepare symmetric cells, lithium metal was scraped with a plastic spatula to remove any oxidized surface, cut into discs of 6 mm diameter, and manually pressed onto each side of the LLZO pellet. This assembled stack was placed in a coin cell setup, using stainless steel spacers, and left to stabilize at 25 °C for 24 h to equilibrate the metal–electrolyte interface. The temperature of the cell was controlled by a Linkam Scientific THMS600 temperature-controlled stage. The EIS data were analyzed using Z-View software. The impedance spectra were fitted with an equivalent circuit consisting of a resistor in series (Rint), inductor (L) and three parallel combinations of a resistor and a constant-phase element arranged in series (R1//CPE1, R2//CPE2, and R3//CPE3). For all Nyquist plots, a constant-phase element (CPE) was used to model the nonideal capacitive behavior represented by depressed semicircles. This deviation from an ideal R//C circuit was considered in the calculations of the capacitance values. The true (effective) capacitance (C) was extracted using the resistance (R) and the CPE parameters (α and Q) from eqn (1).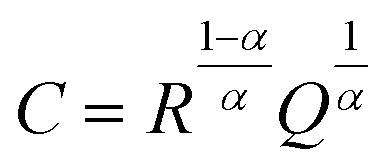 | (1) |
Symmetric Li/LLZO/Li cells were electrochemically cycled at room temperature using a commercial battery tester (580 Battery Test System (Alvatek) and BCycle software) at various current densities for 30 minutes for each charging or discharging cycle, with a 5 minutes rest period between charging/discharging cycles, until the cell showed short-circuit.
3. Results and discussion
Ga-LLZO sintered in alumina crucibles was chosen for study as a model material due to its technological importance, owing to its high lithium ionic conductivity and electrochemical stability against lithium metal,16–18 whilst alumina is the crucible material of choice for many groups synthesizing garnets. A pure cubic Ga-LLZO pellet was obtained as described previously11 (the XRD pattern is shown in Fig. S1†) with closely packed, large grains 100s of μm in diameter, which are visible after thermal etching as seen in the SEM micrographs (Fig. S2†), and in agreement with the estimated geometrical density of ∼94%. The electrochemical and surface chemical properties of the Ga-LLZO were studied following two different mechanical polishing and thermal treatments of the sample.3.1. Electrochemistry
Impedance spectra of the pellets (Fig. 1) show large differences in the interfacial resistance, depending on the surface treatment used, but little change in the bulk and grain boundary properties. Of note is the large decrease in the interfacial impedance following thermal etching of the sample to 900 °C (2 orders of magnitude lower area-normalized resistance compared to the polished sample). To quantify the spectra, three resistors in parallel with a constant phase element are used, with a high frequency inductance L (on the order 10−6 H) and an internal resistance Rint fixed at 3 Ω (measured with a blank, or ‘shorted’ cell) in series. The resulting values are given in Table 1. The capacitance is calculated from the constant phase element using the Brug formula.19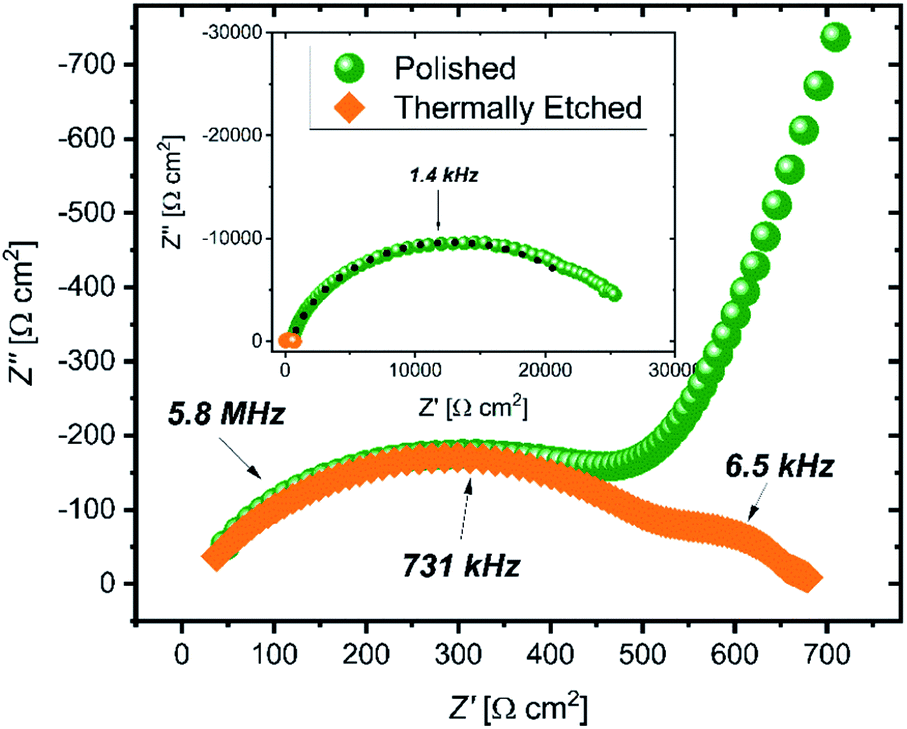 | ||
| Fig. 1 Electrochemical impedance Nyquist plots of etched (orange squares) and polished (green circles) Ga-LLZO electrolyte in a symmetric Li|LLZO|Li coin cell, measured at 298 K across the frequency range 13 MHz to 1 Hz. The inset shows the low frequency data points. | ||
| Polished | Etched | |
|---|---|---|
| R bulk [Ω cm2] | 155.1 | 123.8 |
| C bulk [F cm] | 7.8 × 10⁻¹² | 8.3 × 10⁻¹² |
| R gb [Ω cm2] | 354.7 | 396.9 |
| C gb [F cm] | 1.2 × 10⁻¹¹ | 2.3 × 10⁻¹¹ |
| R int [Ω cm2] | 12![[thin space (1/6-em)]](https://www.rsc.org/images/entities/char_2009.gif) 372.2 372.2 |
148.9 |
| C int [F cm] | 1.1 × 10⁻⁸ | 1.2 × 10⁻⁸ |
Galvanostatic cycling of the cells (Fig. S3†) showed a substantial increase in the critical current density when comparing polished and thermally etched samples (0.03 mA cm−2 and 0.23 mA cm−2, respectively).
3.2. Temperature-dependent XPS
XPS was used to observe the evolution of surface species such as corrosion layers on the LLZO surface following different surface treatments (polishing and thermally etching). In situ variable temperature XPS was carried out from room temperature (RT, grey line in Fig. 2) to 800 °C and back to RT (blue line) with 200 °C steps using a sample polished to 4000-grit with ethanol and with a final dry polish in the glove box that was then transferred under argon to the high vacuum XPS chamber. Energy calibration was carried out by using the O 1s peak for lattice oxygen as an internal standard and aligning this to a binding energy (BE) of 530.1 eV.14 This is preferred over the use of the C 1s peak from adventitious carbon,20 which cannot be relied upon for BE referencing given that the peak position can vary with sample work function21 and the adventitious carbon is likely to undergo chemical changes during in situ heating.22 The Zr 3d peaks are also found to all align with this approach, indicating their chemical stability and that they could also be used for energy calibration. All spectra are normalised to the Zr 3d peak intensity. Full peak fitting is performed for RT spectra recorded before and after thermal etching and the assigned species can be seen in Fig. S4.†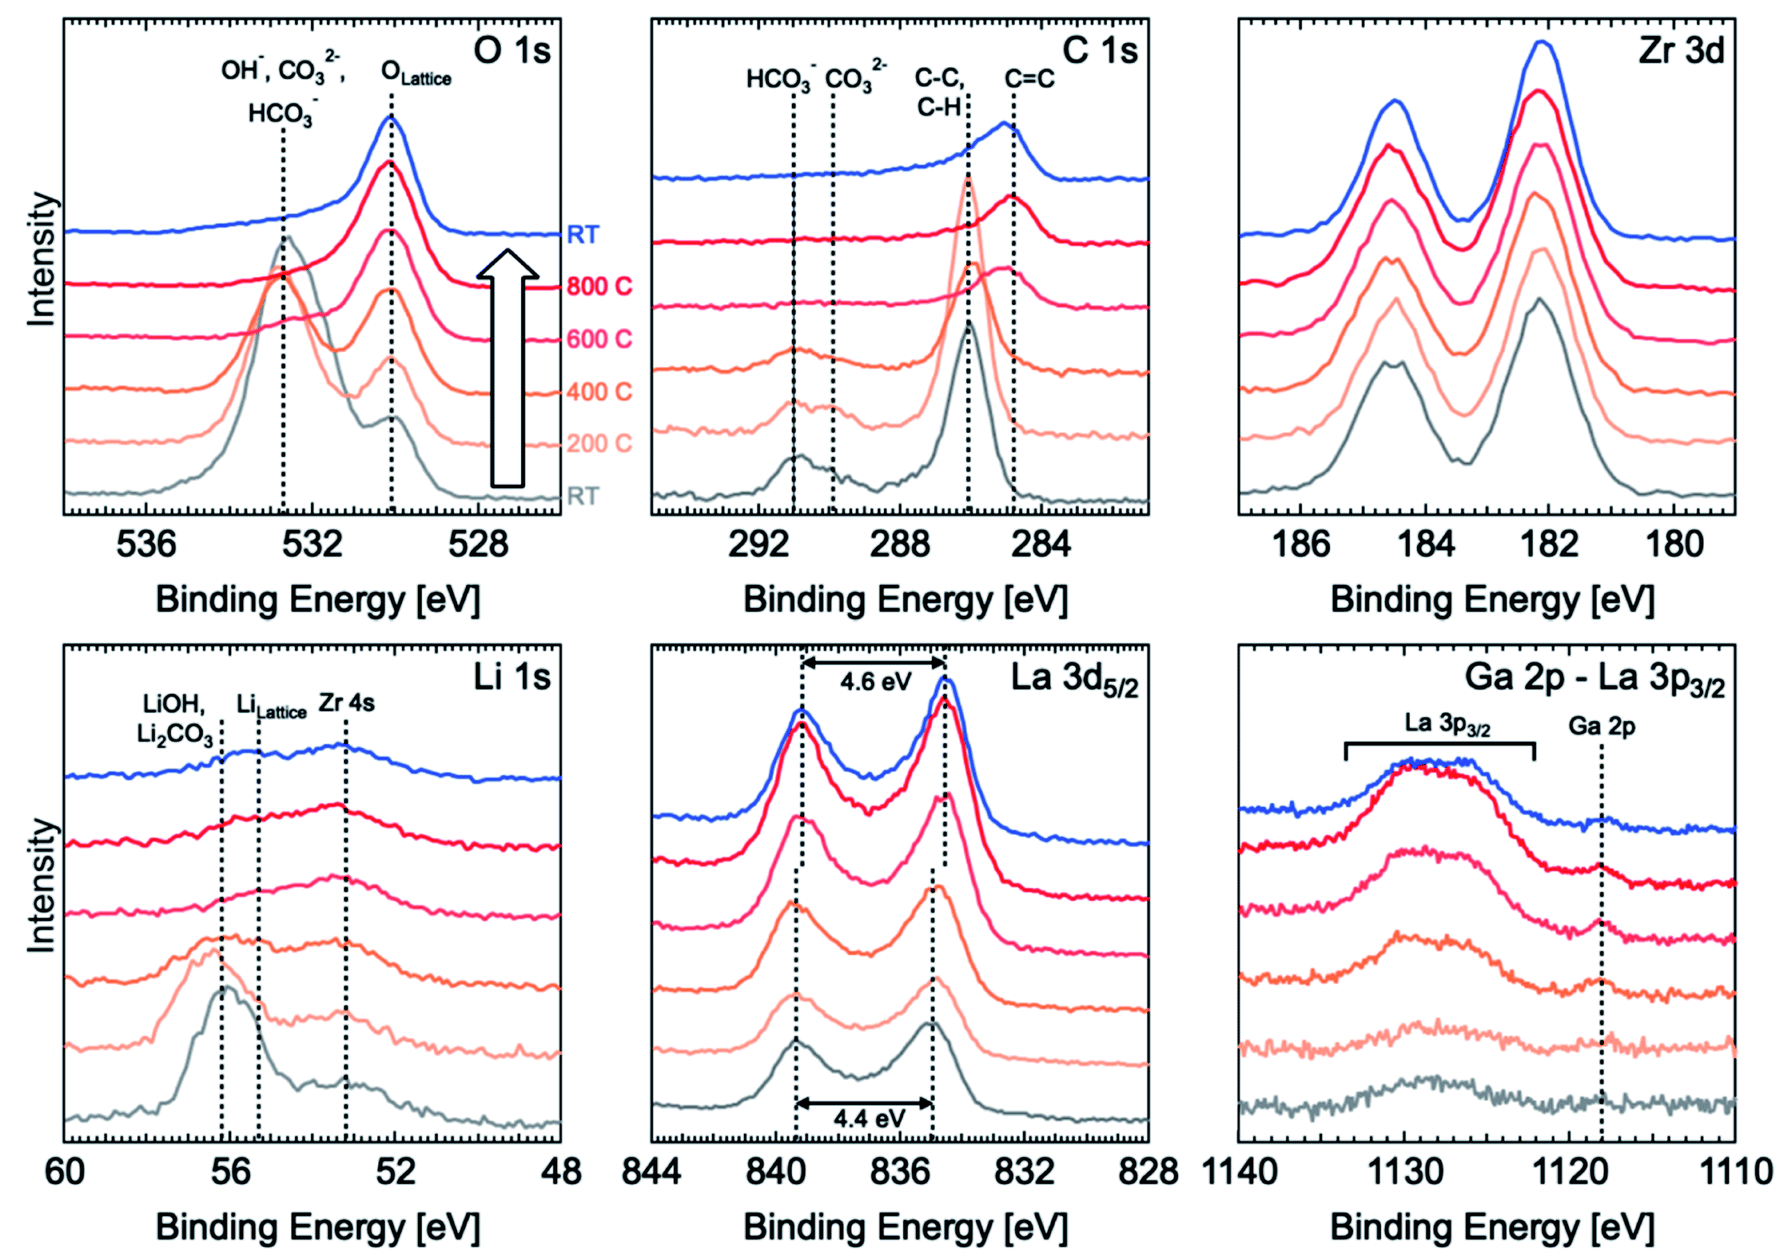 | ||
| Fig. 2 In situ variable temperature photoelectron spectra during the etching process starting from a freshly polished Ga-LLZO pellet (grey), heated to 800 °C under vacuum (orange-red), and cooled back down to room temperature (blue). | ||
Before thermal etching, the C 1s spectrum shows the presence of carbonate species at the surface with peaks located at ∼289.9 eV and ∼291 eV corresponding to CO32− and HCO3−, respectively, and adventitious carbon primarily associated with C–C and C–H species at ∼286 eV. The corresponding O 1s spectrum is dominated by a peak related to carbonate and hydroxide species at ∼532.7 eV, but lattice oxygen is still detectable through this corrosion layer. The Li 1s spectrum at room temperature is similarly dominated by a peak at ∼56.2 eV related to the presence of lithium carbonate and hydroxide.14 By considering the relative intensity of the carbonate/hydroxide and lattice oxygen components and assuming the corrosion layer to be of uniform thickness, the corrosion layer thickness is estimated to be ∼2.7 nm based on the Strohmeier equation23 and values of inelastic mean free path obtained using the Tanuma, Powell and Penn (TPP-2M) equation.24 We note however that our current data are unable to determine whether the corrosion layer is uniform so this value should be treated with some caution.
During thermal etching, the C 1s, O 1s and Li 1s reveal the removal of the hydroxide/carbonate species and an increase in the lattice oxygen and lithium peaks found at binding energies of 529.8 eV and 55.2 eV, respectively. The carbonate peak is found to be completely removed for a thermal etching between 400 °C and 600 °C. This is in agreement with previous work by Zhu et al. which shows the loss of Li2CO3 species for a temperature as low as 500 °C.2 Furthermore, the fitted lattice Li component (with a peak at a binding energy of ∼55.2 eV) seems to weaken relative to the Zr 4s peak at ∼53.1 eV, indicating the possible loss of surface Li. Alongside the carbonate removal, the C 1s spectrum shows a significant shift in the position of the peak attributed to C–C, and C–H (i.e. adventitious carbon) to lower binding energies, consistent with graphitization and which remains after cooling back to RT. The formation and persistence of this graphitized carbon could be important in determining the behaviour of the etched sample as a result of its increased electronic conductivity which might contribute to the observed low interfacial resistance with lithium metal. However, the uniformity of the coverage with carbonaceous species is unconfirmed in this case and so its effectiveness in promoting a homogeneous distribution of current is as yet unknown.
Alongside the removal of the carbonate species, the La 3d5/2 core level also undergoes changes with the multiplet splitting increasing slightly from 4.4 eV to 4.6 eV, reaching a value more typical of La2O3 (indicative of La in the LLZO lattice).14,21,25 The lower initial value of 4.4 eV may correspond to the presence of some lanthanum oxycarbonate species,25 which is removed by the etching process.
We finally note that the La 3p3/2 and Ga 2p core level regions, which have the highest binding energies and thus lowest kinetic energies of the core levels measured, show a growth of the La and Ga signals at the surface as the carbonate/hydroxide layer is removed. This may seem surprising given the signals are normalised to the Zr 3d and thus might be expected to remain constant. However the low kinetic energies (∼350 eV compared to ∼1300 eV for Zr 3d) result in much shorter inelastic mean free paths for these photoelectrons and so the signal is much more surface sensitive and its intensity therefore varies with the thickness of carbonate/hydroxide layer.
3.3. ToF-SIMS depth profiling
As the XPS measurements have an information depth of up to 10 nm and average over a 300 × 700 μm spot size, we looked to the use of ToF-SIMS for depth profiling the samples to probe changes in cation species over a greater range of depths (several nanometers to several hundreds of nanometers).SIMS analyses were performed using an Arn+ (n ≈ 500) cluster sputter beam for gentle depth profiling of the samples, over an area spanning 200 × 200 μm. With this sputter beam, interaction of the ion beam with the sample is minimized, serving to preserve the nature of the surface under analysis better than other higher energy sputter beam species. For these set of experiments, vacuum transfer of the samples to the SIMS instrument was performed immediately following the surface treatment of each pellet, preventing the atmosphere of the glove box from interacting significantly with the surface. The ion counts are normalized to the sum of the total of all species under analysis here and plotted as a function of sputter ion fluence (proportional to sputter time and therefore depth). The 6Li+ minor isotope secondary ion species is chosen instead of 7Li+, as the high yield of the latter leads to saturation of the SIMS detector which prevents all the 7Li+ secondary ion species being counted.
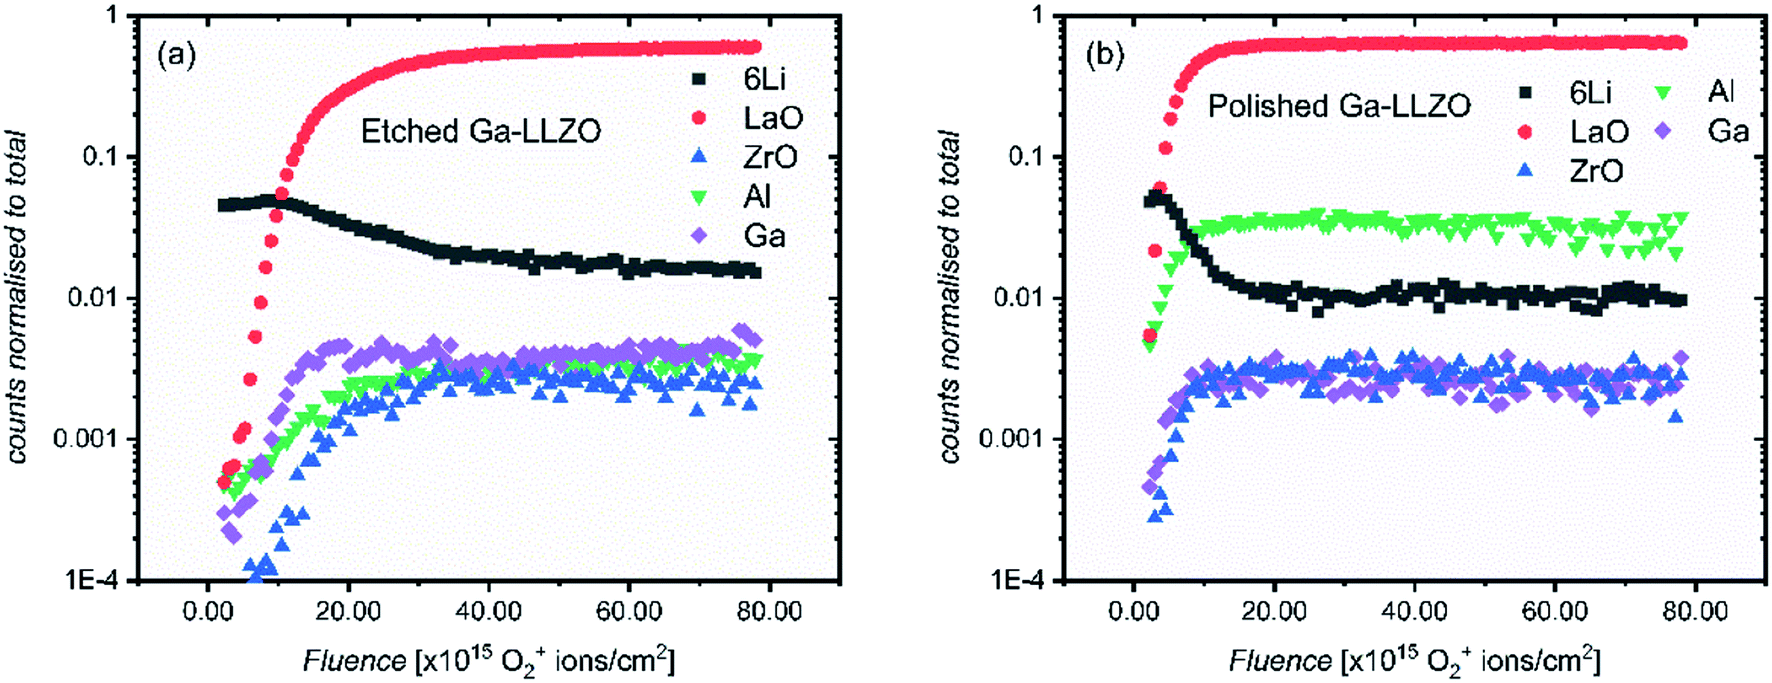
Fig. 3 shows the positive secondary ion profiles for two samples (etched and polished) using these conditions. The analysis area spans several grains, as seen in the ion maps in Fig. S5.† In the etched case, the shape of the profiles for each species is relatively flat, indicating an unchanging surface chemistry with depth for the extent of the analysis, in addition to the avoidance of migration of species due to field-induced gradient effects caused by the sputter beam. This is in accordance with the notion that thermal etching cleans the surface of corrosion product impurities, as seen in the XPS results and in agreement with the literature.5,9,10 On the other hand, the polished sample shows a region of changing ion counts at the near-surface, a region initially high in 6Li+ counts and poor in LaO+, Ga+, Al+ and ZrO+, indicative of a Li-rich corrosion layer.
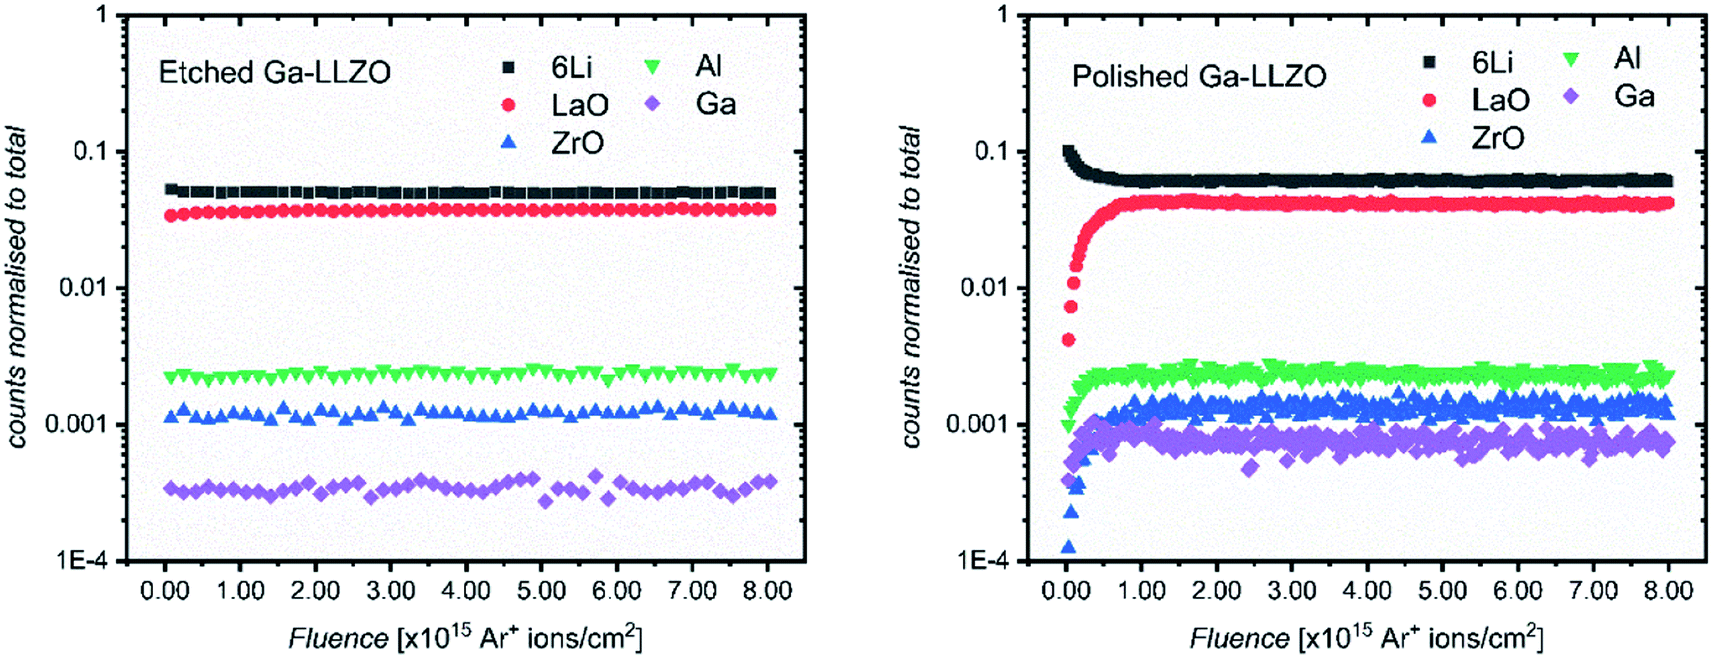 | ||
| Fig. 3 ToF-SIMS depth profiles for etched and polished Ga-LLZO pellets, showing positive secondary ion species, operating under Bi+ primary beam (25 keV) and Arn+ (13.5 nA) sputter beam conditions. | ||
The etched samples show a slightly lower intensity of 6Li+ and higher intensity of LaO+ compared to the polished sample here. This is in accord with the in situ XPS data in which heating results in surface Li loss and changes to the nature of the surface La species.
The etched sample also has overall lower normalized counts for Ga+. It is possible that the mobile gallium ions are thermally activated during the high temperature etching process, resulting either in gallium loss from the sample, or migration to different lattice sites, leading to a change in the sample matrix and resulting change in yield of the Ga+ secondary ions during the SIMS process. We in fact observe a decrease in the concentration of Ga on the top side of the sintered pellets using Low Energy Ion Scattering (LEIS) depth profile analysis of the faces of Ga-LLZO (Fig. S6a†), proposed to be due to sublimation of Ga from the top surface during heating. Note that during etching, no mother powder is used to cover the pellets, which could promote more pronounced Ga (and Al) loss, despite the process occurring at a lower temperature and for a shorter time than the sintering process. It has also been described previously by Rettenwander26 and Robben27 that a symmetry reduction from the space group Ia![[3 with combining macron]](https://www.rsc.org/images/entities/char_0033_0304.gif) d to I
d to I![[4 with combining macron]](https://www.rsc.org/images/entities/char_0034_0304.gif) 3d can occur as a result of gallium substitution, which might be responsible for a variation in the Ga yield as seen in the SIMS analysis.
3d can occur as a result of gallium substitution, which might be responsible for a variation in the Ga yield as seen in the SIMS analysis.
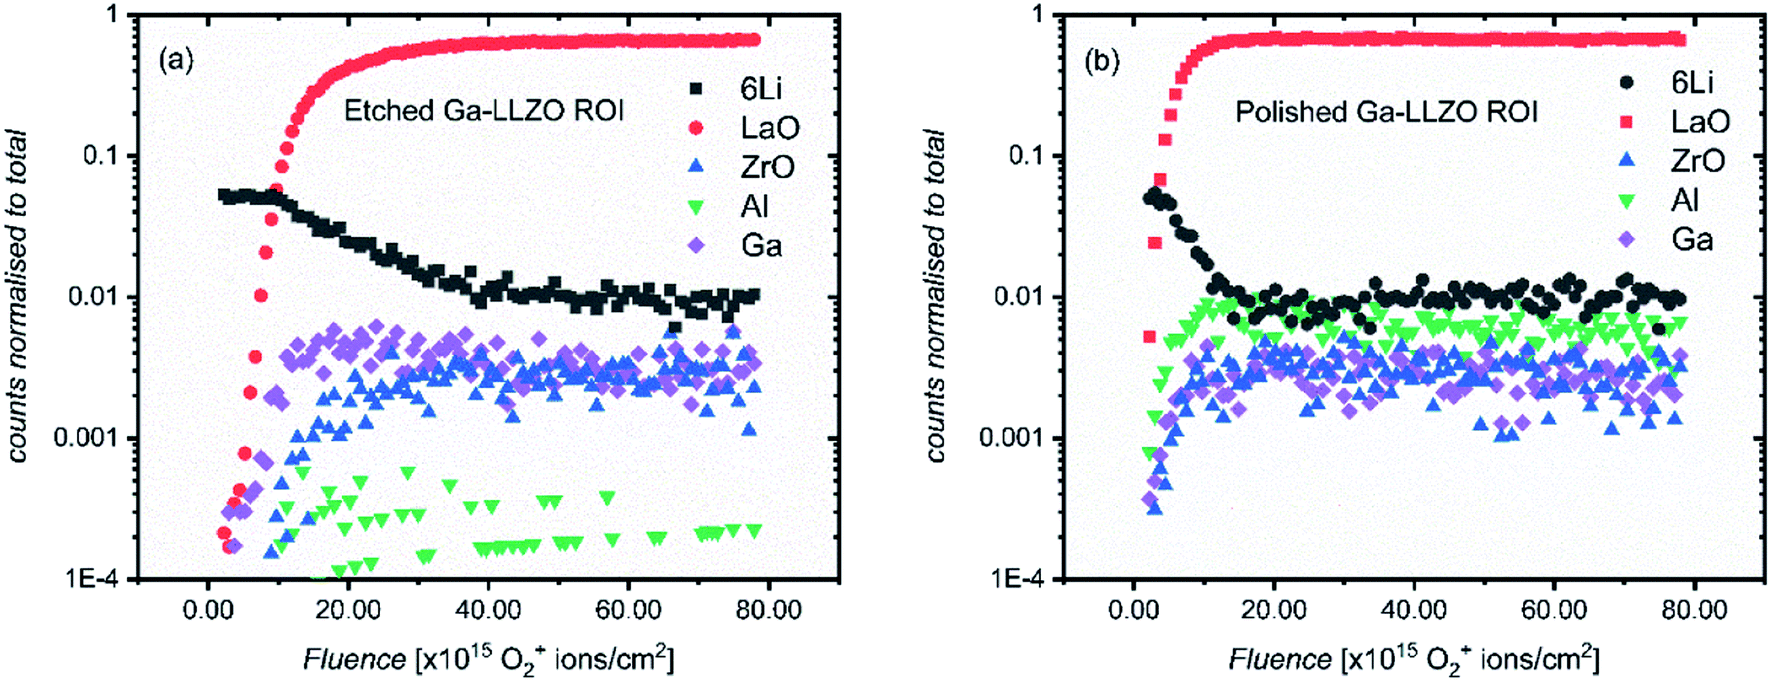
Next, in order to evaluate the activation of the surfaces after thermal etching, another set of SIMS measurements were made on similarly treated samples (polished and etched), but which were left in the glove box for several days prior to analysis. The same face of a single pellet was analyzed in each measurement (the pellet was fractured and each resulting piece subject to a different surface treatment). As we expected to have a thick corrosion layer, an O2+ sputter beam (1 kV, 300 nA) was selected. Traditionally, the O2+ ion beam is thought to enhance the ionization probability for positive secondary ions by a surface chemical effect and provide stable ion yields. The higher current of the O2+ beam meant that the sputtering of the materials proceeds more quickly than the argon cluster, meaning greater depths could be reached in shorter times.
Fig. 4 shows the depth profiles over an analysis area of 200 by 200 μm, spanning several grains and grain boundaries (see Fig. 9 and S7† for ion images of the areas under analysis). This time, both etched and polished samples show an initial region of changing counts in their depth profiles – again with a surface region rich in Li+ and poor in LaO+, Ga+, Al+ and ZrO+ secondary ion yield, which here is more extended in the etched sample. We suggest that this region exists now even on the etched sample due to the presence of a corrosion layer following surface reaction inside the glove box by direct reaction with residual CO2 (also seen by Zhu et al.2). As the region is more extended in the etched sample, this could suggest that the etched sample surface is in some way more activated than the polished sample, making it more reactive and susceptible to facile physisorption of contaminants present in the glove box such as CO2. Changes to the surface morphology (as seen in the SEM images of polished and etched samples in Fig. S2†), as well as chemical modification effects at the surface, might be responsible for this behavior.
 | ||
| Fig. 4 ToF-SIMS depth profiles of etched (a) and polished (b) Ga-LLZO pellets, showing positive secondary ion species. The analysis was performed using 25 keV Bi+ primary ions as the analytical beam and the sputtering was performed by 1 keV 300 nA O2+ beam (burst mode). | ||
To verify the presence of a corrosion layer, and to rule out beam–sample interaction effects which might lead to preferential and delayed sputtering of species, carbon and hydrogen-containing species were also followed in the depth profiles. Fig. S8† shows depth profiles containing multiple secondary ion species which could originate from a corrosion layer, such as LiH+, CH3O+, CH2OLi+, CHOLi+, H+ and CH2+. The profiles of these species correlate well with the profiles of 6Li+ in both etched and polished samples (and showing an anticorrelation with ZrO+, LaO+), agreeing with this hypothesis. In addition, ex situ room temperature XPS was performed on the samples. In agreement with the SIMS depth profiles, a thicker corrosion layer was found to have formed on the etched sample, with a higher at% of carbon-based species found on the etched sample (Table S1†). In order to assess the effect of this rapidly-formed corrosion layer on pellets left in the glove box after thermal etching, EIS was carried out on a cell assembled ∼16 h after thermal etching (Fig. S9†), showing an increase in the interfacial resistance when compared with the impedance measured for a cell assembled immediately after thermal etching.
It can also be seen in Fig. 4 that the 6Li+ counts are eventually lower than the LaO+ counts at the end of each profile. This is in contrast with the depth profiles in Fig. 3, in which the LaO+ counts are always higher after the initial corrosion layer. We attribute this to two things. Firstly, to the more extensive formation of corrosion products during sample storage, which consumes more lithium from the bulk of the LLZO. Secondly, to the use of a different sputter gun which results in a change in the yield of secondary ion species. Given the high mobility of lithium in LLZO structure, these samples show a corresponding depletion of Li in the bulk of the samples probed by SIMS, indicating a slightly lithium-poor defective garnet.
It is also notable that in the polished sample, as well as having a thinner corrosion region, the relative intensities of the secondary ion species differ from those of the etched sample – Al+ has a higher number of counts than the etched sample. By ensuring the same side of the same mother pellet was measured, changes in cation concentrations due to differences in the chemistry of different pellet faces can be ruled out here. To elaborate: during sintering the formation of an Al2O3–Li2O eutectic leads to an Al concentration gradient through the sample, coupled with Al loss from the top surface, with the concentration highest on the side of the pellet previously in contact with the alumina crucible during sintering. This is seen by LEIS depth profiles of both sides of a sintered Ga-LLZO pellet, in which the normalised Al content is higher on the bottom face of the pellet, as shown in Fig. S6b.†
The SIMS depth profiles were taken over an area consisting of multiple grains and grain boundaries, so a selected area analysis of the etched sample was performed in which the data was post-processed to include ion counts originating from the grains only (a region of interest, “ROI”, in which grain boundary regions are excluded), to separate contributions from these two types of features. Fig. 5a shows the resulting depth profile, the main difference being the significant drop in Al+ counts (implying that the grain boundaries are Al-rich).
 | ||
| Fig. 5 ToF-SIMS depth profiles of etched (a) and polished (b) LLZO pellets, showing positive secondary ion species. Regions of interest (ROI) were selected based on areas without grain boundaries and pores in the etched and polished samples, respectively. The analysis was performed using 25 keV Bi+ primary ions as the analytical beam and the sputtering was performed by 1 keV 300 nA O2+ beam (burst mode). | ||
If a selected area analysis of the polished sample is performed, in which pores are eliminated from the analysis (Fig. 5b), the counts for Al+ also drop significantly. This could be due to segregation of Al species in the pores of the sample, perhaps forming as a result of the liquid-phase sintering process. (Fig. S10† shows a three-dimensional reconstructed image of the sample in Fig. 5b showing Al in the pores). Interestingly, the paper by Tian et al.28 describes the electron-trapping properties of surfaces in LLZO materials, including pores in the structure, and how these might be important for dictating the nucleation of lithium dendrites through facile electron transfer. The different properties of pores (as well as grain boundaries) from the bulk LLZO material is thus likely to be important in understanding the performance of these solid electrolytes.
In addition to changes in ion species resulting from features such as pores and grain boundaries, the relative intensities of all the species inside the bulk garnet, in particular Al+, vary from sample to sample, even following the same surface treatment. The changes in the Al+ counts is not intuitive – instead we suggest that the concentration of Al+ is highly anisotropic and as such, from measurement to measurement on the same sample (or across the same batch of samples), the measured relative intensities of Al+ with other species varies widely, even when the same pellet face is being measured, and grain boundaries and pores are eliminated from the analysis, as is the case here. This was also reported by Wachter-Welzl et al.,29 who saw inhomogeneous distribution of Al in 44 samples of Al-LLZO using a laser-ablation ICP-MS technique. Chemical mapping was thus performed here to further investigate the non-uniform distribution of species in different regions of the samples, as well as the role of grain boundaries and their chemical changes following different treatments.
3.4. ToF-SIMS mapping
Ion maps of the samples measured with an O2+ sputter beam are shown in Fig. 6. A grain boundary feature can be seen in the images of the etched sample, which seems to consist predominantly of the fast-diffusing ion species Li and Ga. SIMS matrix effects prevent the quantification of concentrations of these species in the grains and grain boundaries; however, their presence in the grain boundaries is marked. Since Ga3+ acts as a donor dopant in the Li position of Ga-LLZO, its accumulation in the grain boundaries should be associated with a higher concentration of cation vacancies or electrons in the LLZO grains if the crystal structure is maintained, or a possible exchange of the lithium-substitution species (Al3+ and Ga3+). It is also possible that segregation leads to a secondary phase at grain boundaries. This may be important in terms of the ionic and electronic conductivity as well as the chemical reactivity/stability of the grains and grain boundaries in these materials, with the possibility of tailoring the grain boundary composition to achieve a desired chemical stability and ionic transport behaviour.30 In the etched sample, the counts for Al+ are too low (low yield of Al+ secondary ion species) to be able to compare its appearance within the grains and at grain boundaries in the image, so instead the negative ion species were followed (Fig. 7).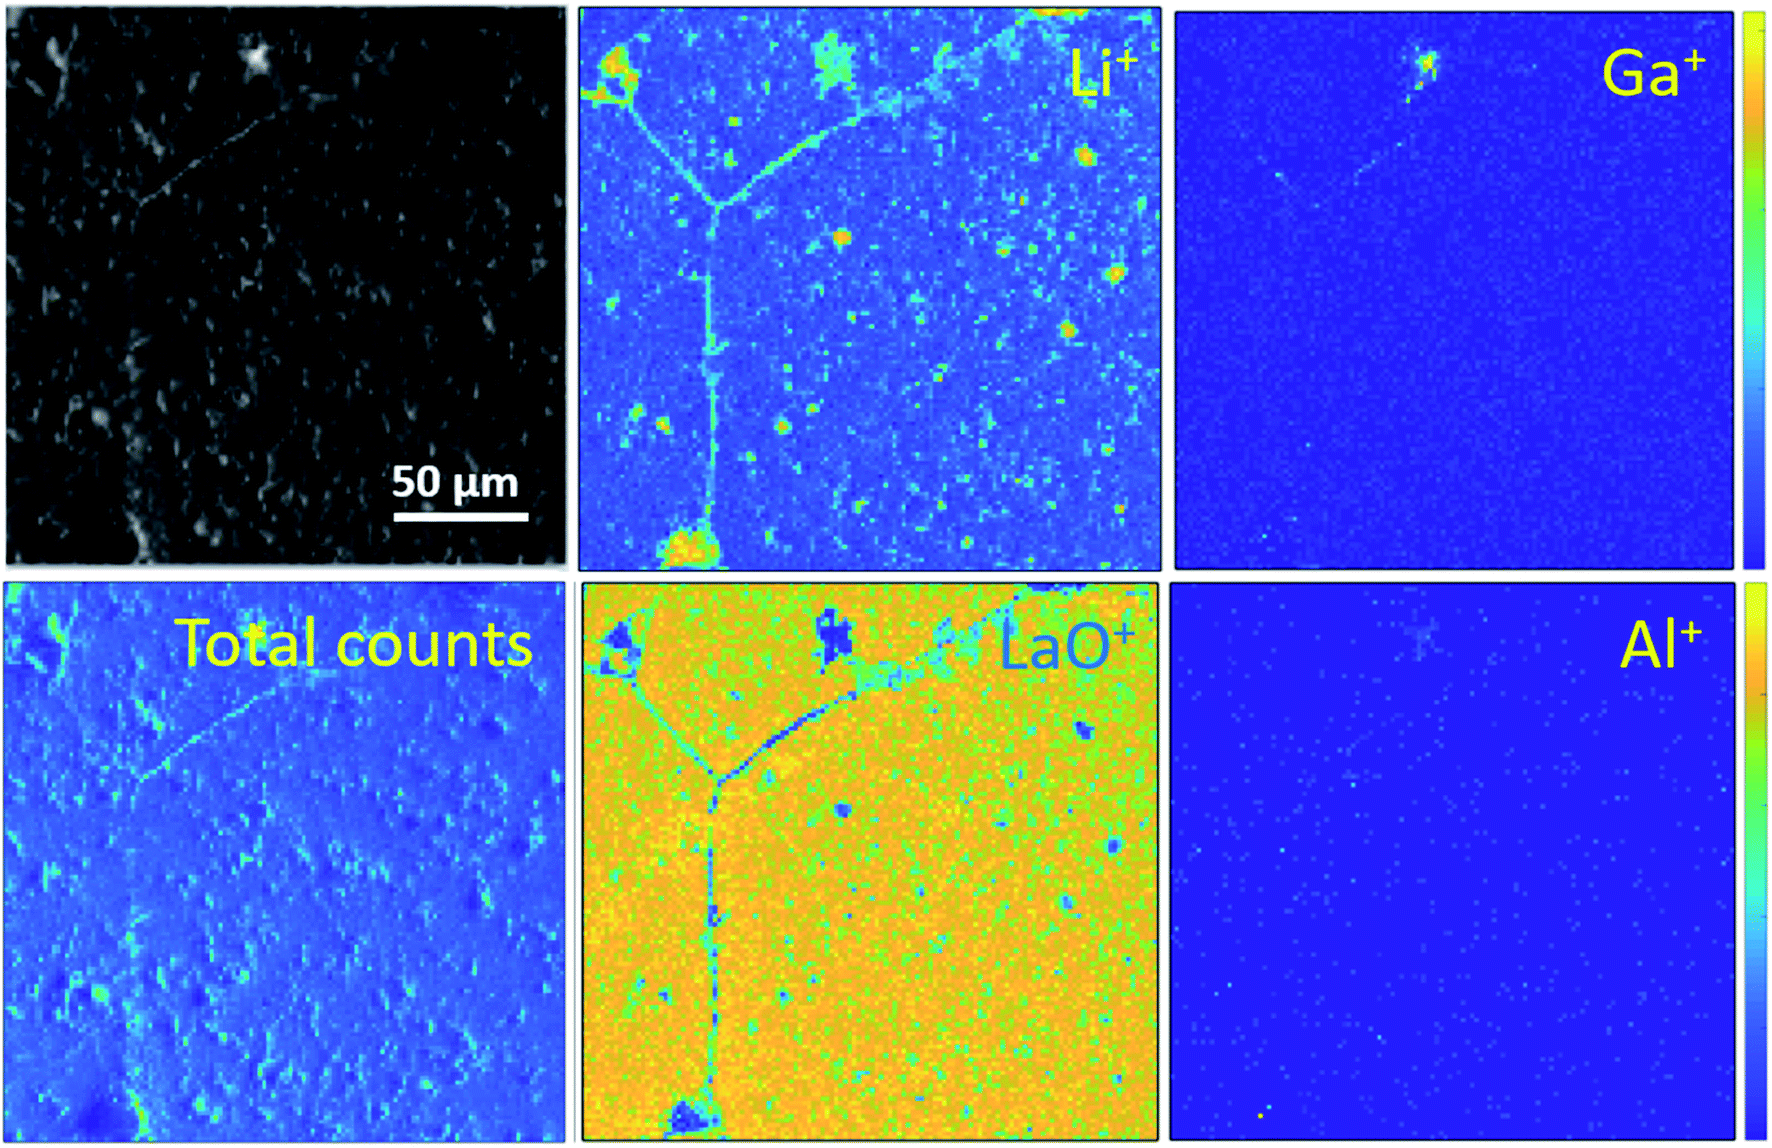 | ||
| Fig. 6 ToF-SIMS positive secondary ion maps and optical image (greyscale) of etched sample, corresponding to the depth profiles of the etched samples in Fig. 4a and 5a. The analysis was performed using 25 keV Bi+ primary ions as the analytical beam and the sputtering was performed by 1 keV O2+ beam (burst mode). | ||
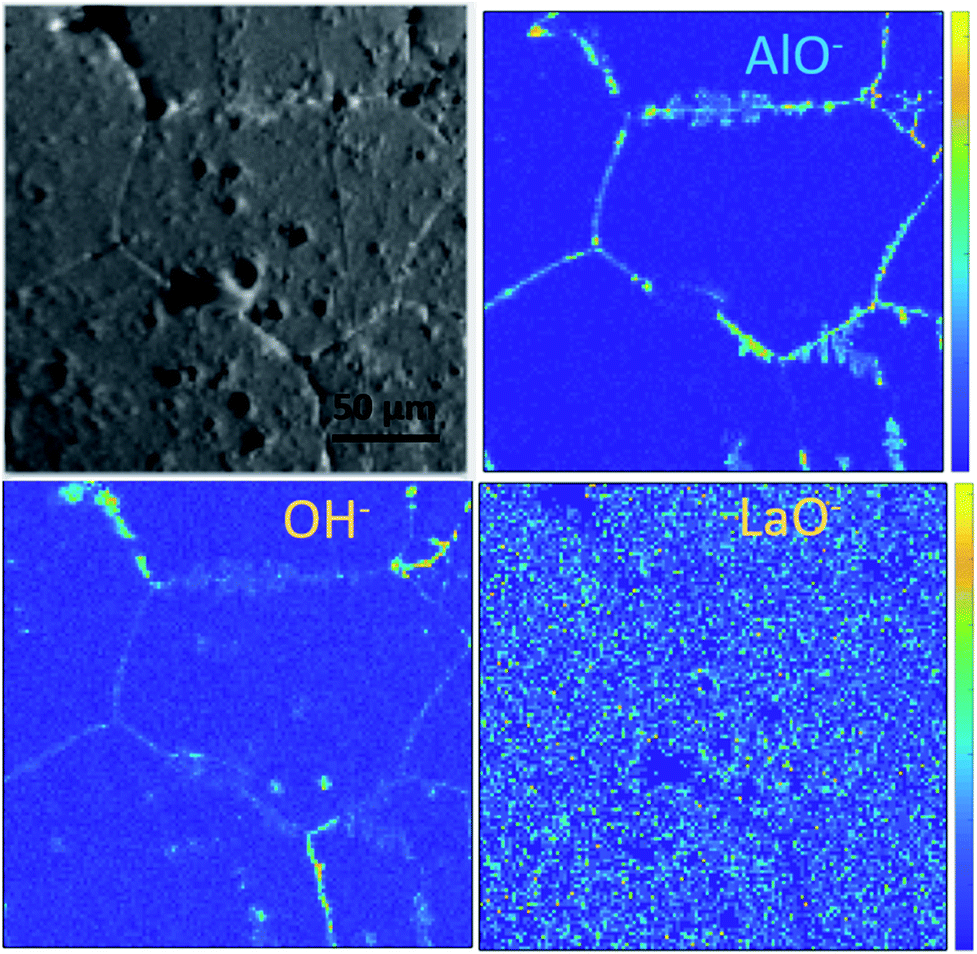 | ||
| Fig. 7 ToF-SIMS negative secondary ion maps and optical image (greyscale) of an etched LLZO sample. The analysis was performed using 25 keV Bi+ primary ions as the analytical beam and the sputtering was performed by 1 keV O2+ beam (burst mode). | ||
The polished sample, however, has a clear segregation of Al+ at pores (see Fig. S7†), which agrees with the depth profile results in which we saw a significant lowering of the Al+ counts when the pore regions were excluded from the analysis (Fig. 5). These Al-rich ‘pockets’ have been described by Doeff and co-workers,20 and here may be more prominent in the SIMS maps as the Al might originate from a different Al-rich phase than that found in the grain boundaries or grains of the etched sample (resulting in different secondary ion yields).
Looking at the negative secondary ion maps of an etched sample (Fig. 7), the presence of Al in the grain boundaries (indicated by AlO− secondary ions) is much clearer. It is likely that differences in intensities of detected Al secondary ions in the etched and polished samples originate from difference in the matrix from which they are created (the Al-containing species in the pores versus the grain boundaries likely differ in identity). The grain boundaries also appear rich in OH−, suggesting a reaction to form corrosion products. In fact, three-dimensional reconstructed images show an accumulation of OH− along the grain boundaries close to the surface only (Fig. 8). The significant reactivity of grain boundaries during proton–lithium exchange was previously reported, in which a significant increase in grain boundary resistance accompanying the exchange process in LLZO pellets was observed.11 A schematic of the various proposed processes occurring following thermal and atmospheric treatment of the Ga-LLZO pellets as described in this work is given in Fig. 9.
 | ||
| Fig. 8 Three-dimensional reconstruction with negative secondary ions of the etched Ga-LLZO sample. LaO− represents the bulk LLZO grains in dark green and OH− at the grain boundary surface in brown (a and b). The grain boundaries also contain AlO− in green (c). | ||
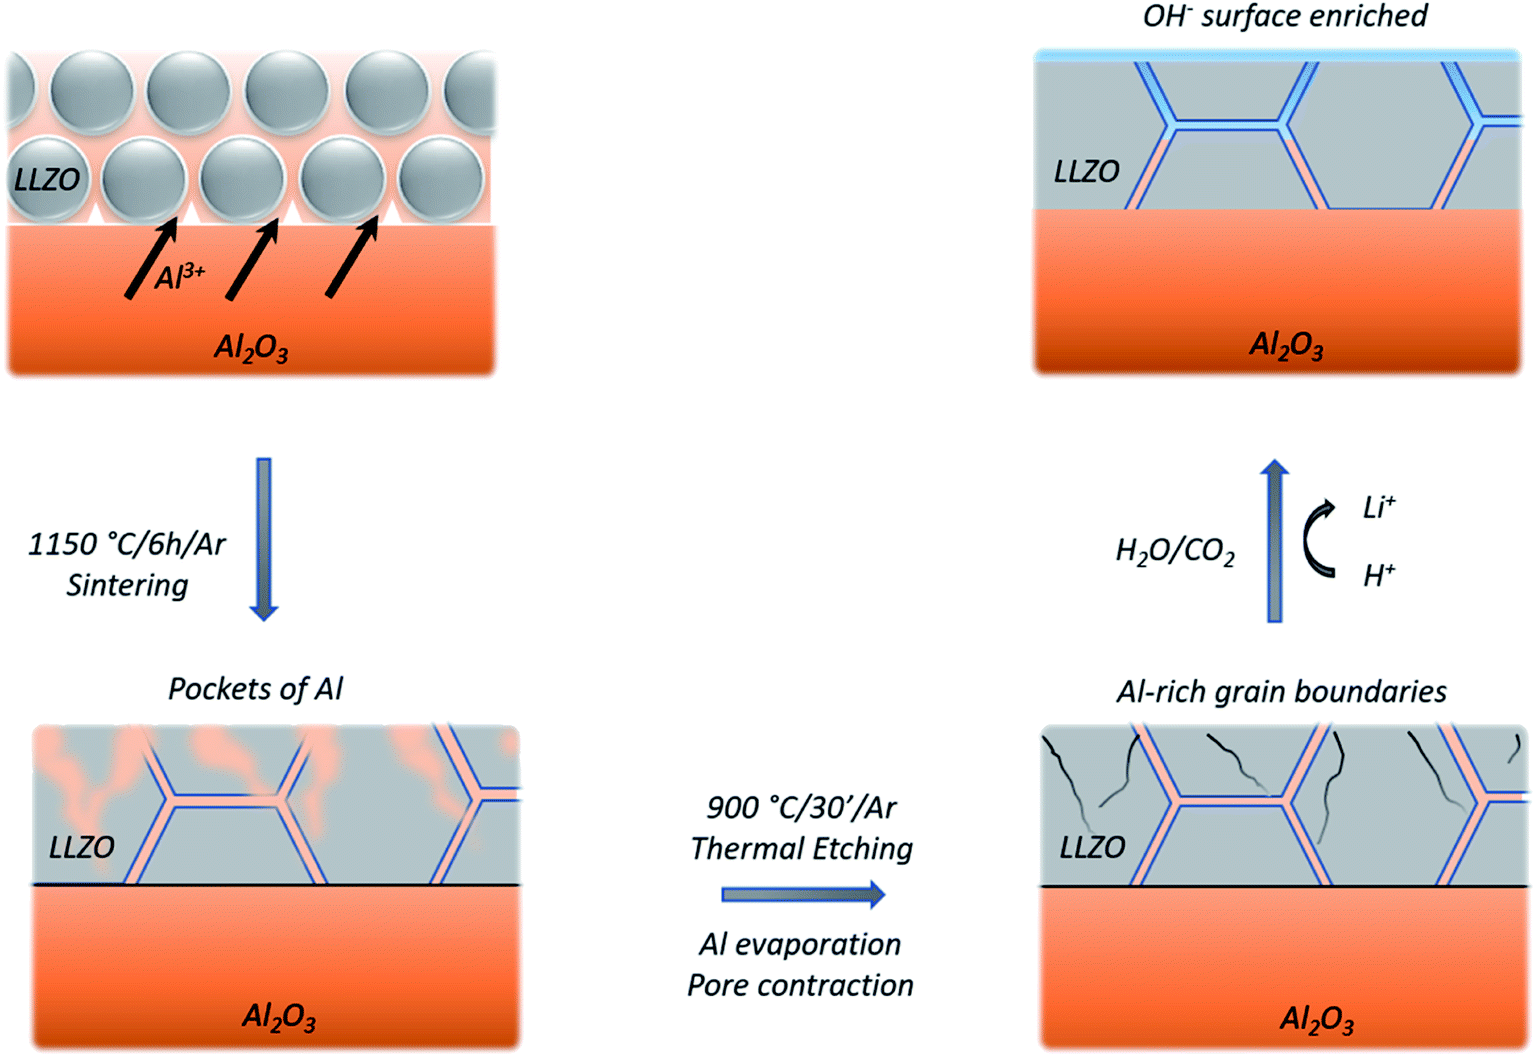 | ||
| Fig. 9 Schematic of proposed processes occurring on a LLZO pellet during various thermal and atmospheric treatments, including: the formation of an Al–Li–O eutectic during sintering leading to Al diffusion in the grains and pore formation, Al evaporation and pore contraction during thermal etching and OH-enrichment of surfaces and grain boundaries upon reaction with CO2 and H2O, which is more acute on the activated, etched LLZO surface. | ||
It was previously noted that the relative intensities of some secondary ion species (especially Ga+ and Al+) collected in the SIMS depth profiles varied from measurement to measurement, even on different areas of the same sample. To investigate this, post-processing of depth profiles collected on a region of etched sample consisting of multiple grains was performed, and the resultant reconstructed depth profiles were compared. Two such regions are highlighted in Fig. 10 (for a complete comparison of all grains in the field of view, see Fig. S11†). Interestingly, a significant difference in the Al+ intensity can be seen across the two ROIs, with the relative intensity being much higher for Al+ in the smaller, central grain (ROI 1). This would indicate that the pellet microstructure influences the chemistry of grains and grain boundaries which could be the reason for the impact of grain size on electrochemical performance previously reported.20,31
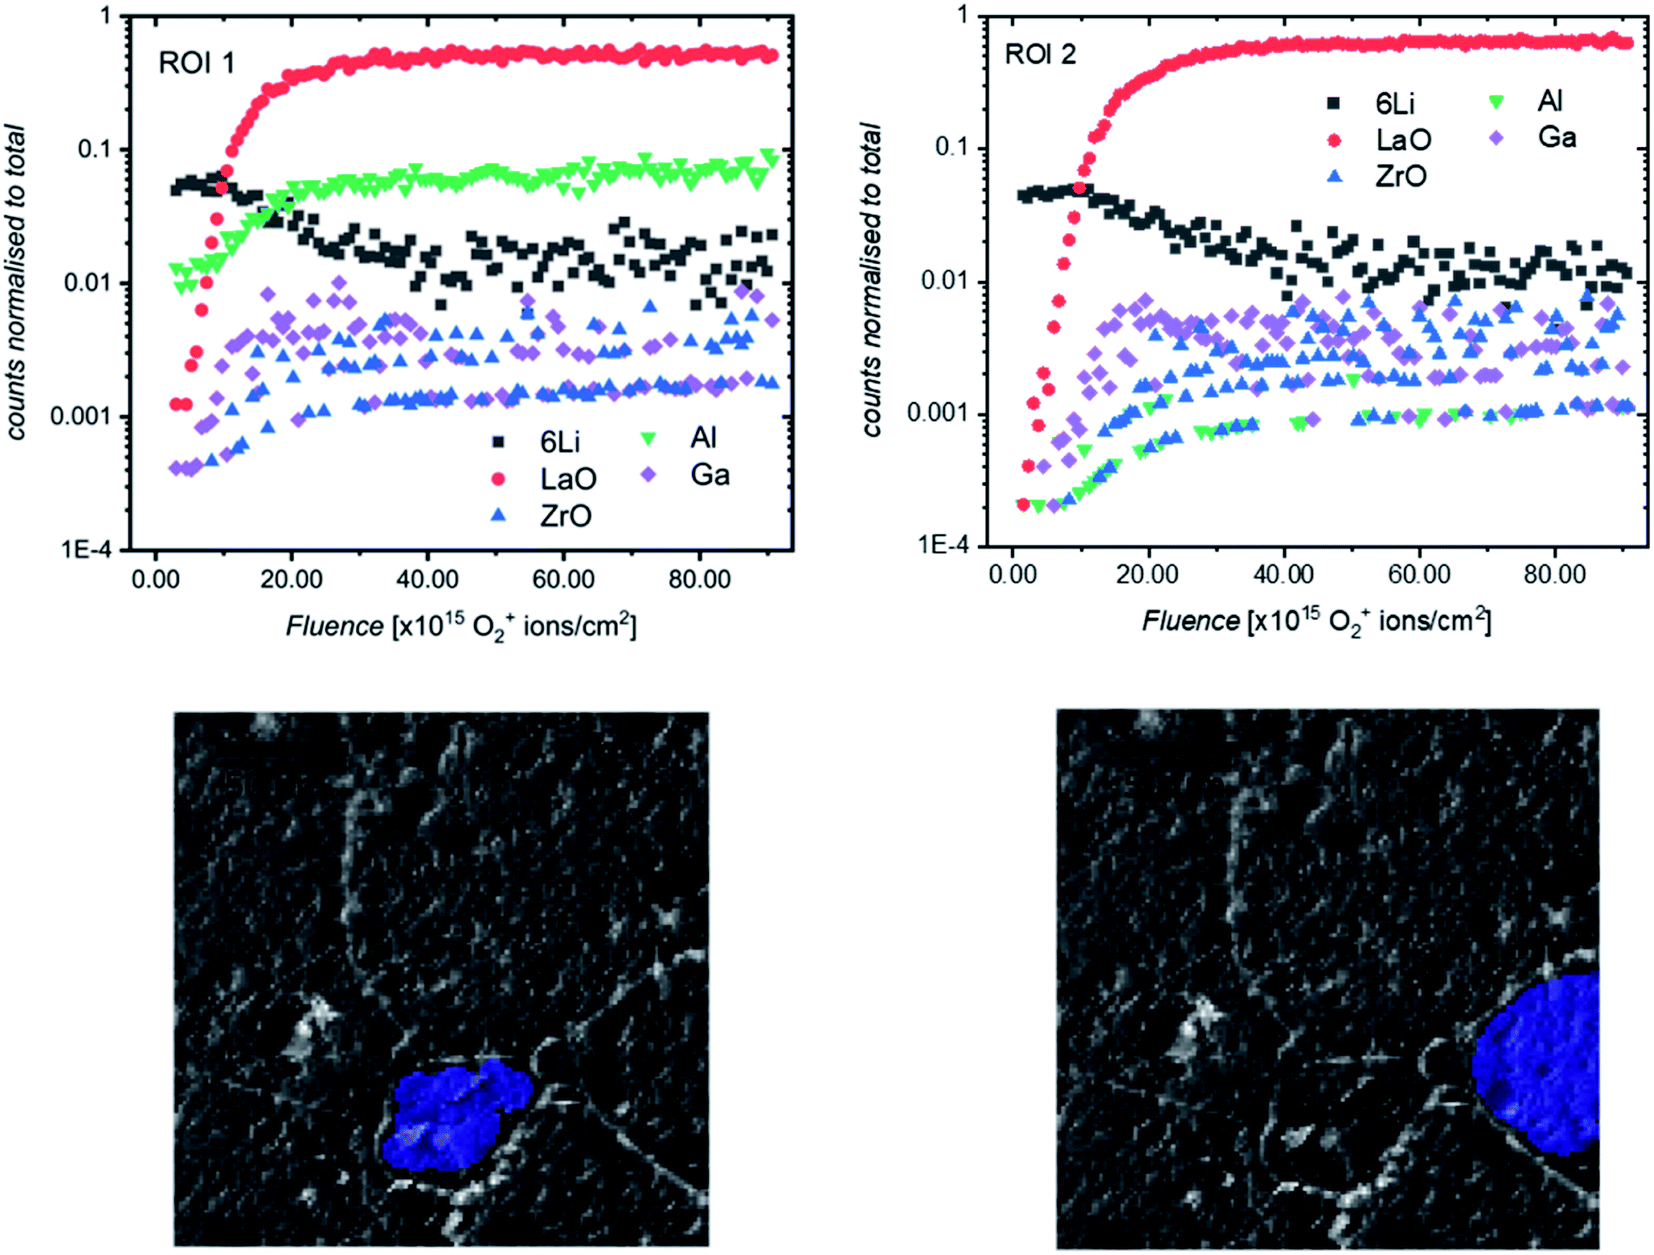 | ||
| Fig. 10 ToF-SIMS positive secondary ion depth profiles and corresponding region of interest (ROI) highlighted on optical images (greyscale) of an etched LLZO sample. The analysis was performed using 25 keV Bi+ primary ions as the analytical beam and the sputtering was performed by 1 keV O2+ beam (burst mode). | ||
We propose that during sintering, the formation of an Al2O3–Li2O eutectic along the grain boundaries due to Al contamination from the crucible leads to a concentration gradient of Al through the grain, caused by the diffusion of Al3+ ions. The formation of this eutectic has been previously reported32 and during the sintering process would lead to a larger concentration of Al in smaller grains after a fixed sintering time (which is above the eutectic formation temperature of 1055 °C33). The effect of the grain size on Al content has been shown by Cheng et al.20 who used XPS to show marked differences in surface Al and Li content in samples of Al-LLZO depending on the grain size (small grain samples with grains around 20 micrometers had larger Al content and smaller Li content).
Because the reactivity of LLZO will depend on its composition (especially the Li content), grains with differing Ga-, Al- and thus Li-contents may well interact differently when exposed to air, H2O or CO2, leading to a knock-on effect on interfacial resistance with a Li metal electrode. In fact, it has been suggested, based on density functional theory calculations, that Li-poor LLZO proceeds via a direct reaction with CO2 to form Li2CO3, rather than the faster two-step reaction involving a LiOH intermediate.20
4. Conclusions
Prior studies have reviewed the relationship between thermal treatment and surface chemistry in terms of accumulation and removal of corrosion layer species LiOH and Li2CO3 present in large quantities on the surface of LLZO, and the subsequent change in interfacial resistance with a lithium metal electrode. It has also been acknowledged that the surfaces and defect properties of LLZO pellets are highly dependent on processing regimes which vary significantly across different research groups. However, no such detailed study exists on the characterization of these surfaces (including regions of non-uniformity). This work serves to provide a detailed picture of the nature of the often highly defective surfaces of LLZO solid electrolytes which may have a significant effect on the interface with Li metal which has not been previously considered.Comparing two sample types of Ga-LLZO – polished and thermally etched, we see differences in interfacial impedance with a Li metal electrode and chemical characteristics of the surfaces following these treatments. Electrochemical impedance spectroscopy shows a reduction in interfacial resistance following etching of the polished sample at 900 °C in argon. In addition to cleaning of the LLZO surface that is observed in XPS (removal of Li2CO3- and LiOH-type species) which has been previously proposed in the literature, we use ToF-SIMS under two different operating conditions (using Arn+ and O2+ sputter beams) to show that an additional process is occurring during the etching process, which results in an activation of the etched pellet surface. We notice that during heating, surface adventitious carbon is graphitized (as seen by the formation of lower BE C 1s peaks in XPS spectra). Additionally, loss of Ga and Li from the grains and accumulation of Al, Ga and Li at the grain boundaries indicate a chemical change in the surface of LLZO during etching. This activation process leads to lower interfacial resistances with Li metal but also to rapid and extended formation of a corrosion layer if left in a glove box for some time, due to the direct reaction with residual CO2. A combination of changes in surface morphology and chemical reactivity of the etched surface may be responsible for this activation process. Ion mapping of the etched and polished samples show segregation of Ga and Al species at the grain boundaries in the etched pellets, whilst the polished samples show enrichment of Al in pores. In addition, the non-uniform nature of these materials is highlighted, showing a dependency of the concentration and distribution of metal cations on the grain size as a result of the liquid phase sintering process involving a Li–Al eutectic.
The non-uniform nature of the LLZO electrolyte surfaces and segregation of cationic species in features such as grain boundaries could strongly affect the performance of the electrolyte. For example, segregation of donor dopant species in the grain boundaries could result in the build-up of electrons or cation vacancies in the grains, leading to electronic conductivity and uneven current distribution, as well as differences in their chemical stability which may be microstructure dependent. Accumulation of secondary phases or mobile cation species in the grain boundaries could also lead to changes in mechanical properties and stability of grain boundaries against e.g. Li metal. All these factors will in turn influence the viability of combining LLZO electrolytes with a Li metal electrode in an all-solid-state battery.
Conflicts of interest
The authors declare no conflicts of interest.Acknowledgements
The authors wish to acknowledge the EPSRC for funding from grant numbers EP/R024006/1 and EP/P003532/1 and the European Commission grant FETPROACT-2018-2020 “HARVESTORE” 824072. CGS and RSW acknowledge the Faraday Institution (faraday.ac.uk; grant numbers FIRG001 and FIRG011). RHB and FMP wish to thank Dr Sarah Fearn at Imperial College London for her advice regarding the SIMS measurements, in particular her assistance with the operation of the argon cluster beam.References
- R. Murugan, V. Thangadurai and W. Weppner, Angew. Chem., Int. Ed., 2007, 46, 7778 CrossRef CAS PubMed.
- Y. Zhu, J. G. Connell, S. Tepavcevic, P. Zapol, R. Garcia-Mendez, N. J. Taylor, J. Sakamoto, B. J. Ingram, L. A. Curtiss, J. W. Freeland, D. D. Fong and N. M. Markovic, Adv. Energy Mater., 2019, 9, 1803440 CrossRef.
- J. E. Ni, E. D. Case, J. S. Sakamoto, E. Rangasamy and J. B. Wolfenstine, J. Mater. Sci., 2012, 47, 7978 CrossRef CAS.
- C. Monroe and J. Newman, J. Electrochem. Soc., 2003, 150, A1377 CrossRef CAS.
- T. Krauskopf, H. Hartmann, W. G. Zeier and J. Janek, ACS Appl. Mater. Interfaces, 2019, 11, 15 CrossRef PubMed.
- T. Krauskopf, B. Mogwitz, C. Rosenbach, W. G. Zeier and J. Janek, Adv. Energy Mater., 2019, 9, 44 Search PubMed.
- L. Cheng, E. J. Crumlin, W. Chen, R. Qiao, H. Hou, S. Franz Lux, V. Zorba, R. Russo, R. Kostecki, Z. Liu, K. Persson, W. Yang, J. Cabana, T. Richardson, G. Chen and M. Doeff, Phys. Chem. Chem. Phys., 2014, 16, 18294 RSC.
- A. Sharafi, S. Yu, M. Naguib, M. Lee, C. Ma, H. M. Meyer, J. Nanda, M. Chi, D. J. Siegel and J. Sakamoto, J. Mater. Chem. A, 2017, 5, 13475 RSC.
- Y. Zhu, J. G. Connell, S. Tepavcevic, P. Zapol, R. Garcia-Mendez, N. J. Taylor, J. Sakamoto, B. J. Ingram, L. A. Curtiss, J. W. Freeland, D. D. Fong and N. M. Markovic, Adv. Energy Mater., 2019, 9, 1803440 CrossRef.
- A. Sharafi, E. Kazyak, A. L. Davis, S. Yu, T. Thompson, D. J. Siegel, N. P. Dasgupta and J. Sakamoto, Chem. Mater., 2017, 29, 7961 CrossRef CAS.
- R. H. Brugge, A. K. O. Hekselman, A. Cavallaro, F. M. Pesci, R. J. Chater, J. A. Kilner and A. Aguadero, Chem. Mater., 2018, 30, 3704 CrossRef CAS.
- F. M. Pesci, R. Brugge, A. K. O. Hekselman, A. Cavallaro, R. J. Chater and A. Aguadero, J. Mater. Chem. A, 2018, 6, 19817 RSC.
- J. C. Dupin, D. Gonbeau, P. Vinatier and A. Levasseur, Phys. Chem. Chem. Phys., 2000, 2, 1319 RSC.
- M. Fingerle, C. Loho, T. Ferber, H. Hahn and R. Hausbrand, J. Power Sources, 2017, 366, 72 CrossRef CAS.
- G. Kerherve, AvantageToPlot, https://github.com/gkerherve/AvantageToPlot, accessed, November, 2019 Search PubMed.
- Y. Zhu, X. He and Y. Mo, ACS Appl. Mater. Interfaces, 2015, 7, 23685 CrossRef CAS PubMed.
- C. Bernuy-Lopez, W. Manalastas, J. Miguel, A. Aguadero, F. Aguesse and J. Kilner, Chem. Mater., 2014, 26, 3610 CrossRef CAS.
- J.-F. Wu, E.-Y. Chen, Y. Yu, L. Liu, Y. Wu, W. K. Pang, V. K. Peterson and X. Guo, ACS Appl. Mater. Interfaces, 2017, 9, 1542 CrossRef CAS PubMed.
- G. J. Brug, A. L. G. van den Eeden, M. Sluyters-Rehbach and J. H. Sluyters, J. Electroanal. Chem., 1984, 176, 275 CrossRef CAS.
- L. Cheng, C. H. Wu, A. Jarry, W. Chen, Y. Ye, J. Zhu, R. Kostecki, K. Persson, J. Guo, M. Salmeron, G. Chen and M. Doeff, ACS Appl. Mater. Interfaces, 2015, 7, 17649 CrossRef CAS PubMed.
- G. Greczynski and L. Hultman, ChemPhysChem, 2017, 18, 1507 CrossRef CAS PubMed.
- M. F. Sunding, K. Hadidi, S. Diplas, O. M. Løvvik, T. E. Norby and A. E. Gunnæs, J. Electron Spectrosc. Relat. Phenom., 2011, 184, 399 CrossRef CAS.
- B. R. Strohmeier, Surf. Interface Anal., 1990, 15, 51 CrossRef CAS.
- S. Tanuma, C. J. Powell and D. R. Penn, Surf. Interface Anal., 1994, 21, 165 CrossRef.
- J. P. H. Li, X. Zhou, Y. Pang, L. Zhu, E. I. Vovk, L. Cong, A. P. Van Bavel, S. Li and Y. Yang, Phys. Chem. Chem. Phys., 2019, 21, 22351 RSC.
- D. Rettenwander, G. Redhammer, F. Preishuber-Pflügl, L. Cheng, L. J. Miara, R. Wagner, A. Welzl, E. Suard, M. Doeff, M. Wilkening, J. Fleig and G. Amthauer, Chem. Mater., 2016, 28, 2384 CrossRef CAS PubMed.
- L. Robben, E. Merzlyakova, P. Heitjans and T. M. Gesing, Acta Crystallogr., Sect. E: Crystallogr. Commun., 2016, 72, 287 CrossRef CAS PubMed.
- H.-K. Tian, Z. Liu, Y. Ji, L.-Q. Chen and Y. Qi, Chem. Mater., 2019, 31, 18 Search PubMed.
- A. Wachter-Welzl, J. Kirowitz, R. Wagner, S. Smetaczek, G. C. Brunauer, M. Bonta, D. Rettenwander, S. Taibl, A. Limbeck, G. Amthauer and J. Fleig, Solid State Ionics, 2018, 319, 203 CrossRef CAS.
- F. M. Pesci, A. Bertei, R. H. Brugge, S. Emge, A. K. O. Hekselman, L. E. Marbella, C. P. Grey and A. Aguadero, ACS Appl. Mater. Interfaces, 2020 DOI:10.1021/acsami.0c08605.
- L. Cheng, W. Chen, M. Kunz, K. Persson, N. Tamura, G. Chen and M. Doeff, ACS Appl. Mater. Interfaces, 2015, 7, 2073 CrossRef CAS PubMed.
- Y. Jin and P. J. McGinn, J. Power Sources, 2011, 196, 8683 CrossRef CAS.
- L. P. Cook and E. R. Plante, Ceram. Trans., 1992, 27, 193 CAS.
Footnote |
| † Electronic supplementary information (ESI) available. See DOI: 10.1039/d0ta04974c |
| This journal is © The Royal Society of Chemistry 2020 |