3D-Printed electrodes for membraneless water electrolysis†
Justin C.
Bui
 ,
Jonathan T.
Davis
 and
Daniel V.
Esposito
 *
*
Columbia University in the City of New York, Department of Chemical Engineering, Columbia Electrochemical Energy Center, Lenfest Center for Sustainable Energy, 500 W. 120th St., New York, NY 10027, USA. E-mail: de2300@columbia.edu; Tel: +1-212-854-2648
First published on 29th October 2019
Abstract
Additive manufacturing encompasses an emerging class of techniques that are increasingly finding applications in the field of electrochemistry. While most of these demonstrations have involved the use of 3D-printing to fabricate structural components of electrochemical devices, this manuscript describes the design, manufacture and performance of 3D-printed porous flow-through electrodes employed in an electrolyzer that is itself made almost entirely by 3D-printing. These electrodes were 3D-printed using fused deposition modeling (FDM) from a composite of conductive carbon and polylactic acid (PLA), followed by electrodeposition of nickel (Ni) electrocatalyst. The stability and performance of these Ni-PLA electrodes were evaluated for water electrolysis in 1.0 M sodium hydroxide (NaOH). After characterizing the performance of a single electrode pair for the hydrogen evolution reaction (HER) and oxygen evolution reaction (OER), three pairs of electrodes were incorporated into a simple and scalable 3D-printed membraneless electrolyzer by “clicking” them into a monolithic lid containing manifolding for collection of the O2 and H2 product gases. The device utilizes a membraneless architecture capable of operating in a stagnant electrolyte through buoyancy-driven separation of product gases, and allowing for easy regeneration of electrodes by electrodeposition. Device operation was evaluated through a combination of electroanalytical measurements, in situ high-speed video imaging, and finite element modeling. Although the efficiency and cross-over rates of these membraneless electrolyzers fall below what is required for commercial applications, additive manufacturing of electrodes offers an exciting new design space to improve performance and enable robust operation for applications where membrane-based electrolyzers are inherently unstable.
1. Introduction
The field of additive manufacturing, popularly known as 3D-printing, has grown significantly in the past decade1 while leading to the development of new techniques,2 materials,3,4 and applications.5 In the energy sector, one emerging application of 3D-printing is the fabrication of electrolysis cells used to produce chemicals and fuels such as hydrogen (H2).6 Hydrogen made by water electrolysis is especially attractive as a carbon-free fuel due to its versatility as an energy carrier across a wide range of energy sectors.6 The commercial water electrolyzer market is currently dominated by two technologies: polymer electrolyte membrane (PEM) electrolyzers6 and alkaline electrolyzers.7 Unfortunately, the relatively high capital costs of these electrolyzers make it challenging for the production of H2 by water electrolysis to be competitive with H2 made by CO2-emitting steam methane reforming in many scenarios. Driving down electrolyzer capital costs is especially important in a renewable energy future where electricity from solar and wind will be inexpensive (low operating costs), but available for only a fraction of the day.8,9Additive manufacturing offers possibilities to reduce electrolyzer capital costs by enabling new designs that decrease the number of components and/or allow for a more streamlined assembly process. Recent studies have demonstrated the use of additive manufacturing to fabricate various individual components in electrochemical systems, such as chassis,10–12 membranes,13,14 electrodes15–17 and flow plates.18–20 Researchers have also demonstrated that Ni electrocatalysts can be deposited onto conductive 3D-printed substrates by electrodeposition,19 another type of additive manufacturing. However, none of the aforementioned studies have demonstrated a device with all of the key components made solely from 3D-printing.
The use of 3D-printing in electrolyzers is commonly limited to the device chassis, which can be printed from standard polymeric materials using a commercial fused deposition modeling (FDM) 3D-printer.11,21,22 During FDM printing, a polymeric thermoplastic filament is extruded through a heated nozzle while a system of gantries precisely controls the position of the nozzle based on a user-specified design file. After the nozzle is moved to the next location, the extruded material quickly solidifies in place. This process sequentially deposits two-dimensional layers that collectively form three-dimensional objects.1,23 While standard filaments such as polylactic acid (PLA) or acrylonitrile butadiene styrene (ABS) are sufficient to manufacture insulating components such as device chassis, electrically-conductive materials are required to 3D-print the electrodes. This requirement may be met by some recently developed FDM materials commonly referred to as particle-filled filaments.24,25 These advanced materials are typically a composite of a PLA polymer impregnated with particulates of another, non-polymeric substance possessing one or more properties not present in the neat polymer. Composite filaments allow for FDM printing with materials that possess too high of a glass transition temperature to be extruded in commercial systems (e.g. metals) or lack a glass transition phase to begin with (e.g. wood).25,26 For instance, many studies have shown that a polymer filled with conductive graphene particulates becomes electronically conductive.27–30 This property has enabled the fabrication of 3D-printed electronics for low current applications such as sensors. Given the growing relevance of 3D-printing to electrochemistry, conductive particle-filled filaments are also of interest for 3D-printing electrochemically active components like electrodes or sensors.31
The current study was motivated by the ultimate goal of designing and demonstrating an electrolyzer for which all of the key functional components are fabricated by 3D-printing. This is a daunting task when one considers the relatively complex structures and wide range of materials that go into modern commercial electrolyzers. Especially problematic is the task of printing the membrane or diaphragm divider that separates the anode from the cathode. While alkaline electrolyzers typically rely on ceramic diaphragm separators, commercially-available PEM electrolyzers employ polymeric, proton-conducting membranes such as Nafion©. These dividers serve the crucial role of separating hydrogen (H2) and oxygen (O2) while enabling ion transport between the electrodes. Despite their key role in conventional electrolyzers, many dividers are not easy to manufacture by 3D-printing. While progress is being made in attempts to print proton conducting membranes,13,14 their performance is far below what is needed for commercial electrolysis devices. Aside from the difficulties of 3D-printing a free-standing ion-exchange membrane, the membrane electrode assembly (MEA) within a PEM electrolyzer possesses a complex architecture and its manufacturing process involves a hot pressing step that occurs at elevated temperature and pressure.32 The processing conditions involved with hot pressing exceed what can be reasonably withstood by an FDM 3D-printing process, which inherently requires filament feedstocks with lower glass transition temperatures that are suitable for extrusion at ambient pressure.
One solution to all of the above cited issues is to eliminate the membrane altogether and switch to a membraneless electrolyzer architecture. A membraneless electrolyzer can be operated with fewer components and avoids difficulties associated with the manufacturing and replacement of MEAs. Most membraneless electrolyzer designs demonstrated to date have utilized flow-induced separation of products, whereby forced advection of the liquid electrolyte is used to sweep H2 and O2 product gases into separate effluent channels before they can cross over between electrodes.21,22,33–36 More recently, our group has demonstrated a passive membraneless device that does not require forced advection to separate H2 and O2, instead relying on the natural buoyancy of the product gases evolved from angled mesh electrodes to carry them into separate collection chambers.11 That study relied on a single pair of “asymmetric electrodes” for which active platinum (Pt) electrocatalyst was deposited by electron-beam evaporation onto only the outer surfaces of titanium (Ti) mesh electrodes, thereby minimizing the formation of gas bubbles on the inner surfaces.
The present study expands on the concept of a passive membraneless electrolyzer by developing “clickable” asymmetric electrodes made by additive manufacturing methods that can be easily clicked into and out of a 3D-printed electrolyzer chassis for simplified assembly and/or repair. A rendering of the electrolyzer is provided in Fig. 1 for a design that employs three pairs of clickable 3D-printed electrodes. This membraneless electrolyzer is made entirely by 3D-printing, with a key exception being the glass windows that are epoxied onto the sides of the device to allow for in situ videography of bubble dynamics during device operation. However, these windows would not be necessary in a commercial device. After describing the general design and fabrication of 3D-printed electrodes and the electrolyzer chassis, three electrode measurements are used to characterize the performance of individual electrodes for the hydrogen evolution reaction (HER) and the oxygen evolution reaction (OER). Next, the performance of single and multiple pairs of electrodes are evaluated in the electrolyzer using chronoamperometry and in situ high speed video (HSV). Finally, the product purity of the evolved product gas is analyzed by gas chromatography (GC), and approaches to improving the performance of 3D-printed electrolyzers are discussed.
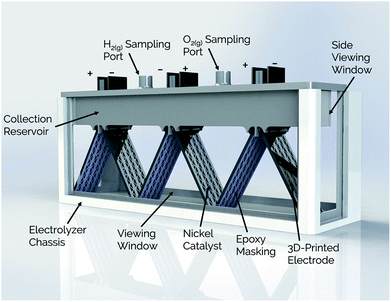 | ||
| Fig. 1 Schematic view of membraneless electrolyzer with 3D-printed chassis, gas collection manifolds, and porous electrodes. | ||
2. Experimental
2.1 Chemicals
All solutions were prepared using 18.2 MΩ cm deionized water. The Watt's nickel-plating solution was prepared using concentrated sulfuric acid (Certified ACS plus, Fischer Scientific), nickel(II) chloride hexahydrate (ACS Reagent grade, Sigma Aldrich), nickel(II) sulfate hexahydrate (ACS Reagent grade, Sigma Aldrich), and boric acid (Certified ACS Crystalline, Fisher Scientific).19 Electrolyte solutions were prepared using sodium hydroxide (Certified ACS Pellets, Fisher Scientific). Prior to each experiment, the solutions were purged with nitrogen gas (Ultra-Pure, Tech Air) to de-aerate the electrolyte.2.2 Electrode fabrication
Electrodes were printed from a conductive carbon-PLA filament (Protoplant) with water soluble polyvinyl alcohol (PVA) support structure (MatterHackers) on a MakerGear M3 FDM 3D-printer at 0.2 mm layer height and 100% infill at 50 mm s−1. Halfway through the printing of the electrodes, copper wire (Jameco Electronics, 24 AWG) was embedded along the length of the electrodes to improve base conductivity. Electrodes had a width of 1.7 cm and a length of 4.4 cm, giving a rectangular area of 7.5 cm2 when incorporated into the electrolyzer. The backsides of the electrodes were then masked with clear epoxy (JB Weld). Ni was deposited on these electrodes electrochemically via a Watt's nickel-plating solution comprised of 40.65 g of NiSO4·6H2O, 8.1 g of NiCl2·6H2O, and 5.4 g of H3BO3 added to 135 mL of deionized water. Electrodeposition was performed using a silver/silver chloride reference electrode (Hach) and a Ni foil counter electrode (99.5% purity, Alfa Aesar) at a constant current density of −2.5 mA cm−2 for three periods of two hours, resulting in deposition of a continuous Ni layer on the carbon-PLA substrate.2.3 Electrolyzer fabrication
The electrolyzer chassis was printed from Vero Blue resin (Stratasys) on an Object J750 Polyjet 3D-printer. It was fitted with abrasion resistant acrylic viewing windows (TAP Plastics, 1/8′′ × 5–13/16′′ × 2–1/8′′) in the front and back and glass slides (Fisher Scientific, 3′′ × 1′′ × 1 mm) as side windows. All viewing windows were sealed to the chassis using JB Weld clear epoxy. The gas collection manifold was 3D-printed from clear resin (Formlabs) on a Formlabs Form2 stereolithography 3D-printer. Titanium foil (Alfa Aesar) was inserted to the connection ports to provide electrical contact to the electrodes. The lid was then fitted with rubber septa for gas sampling for determination of the composition of the product gas by gas chromatography. Computer Aided Design (CAD) files for this device are available at http://echem.io. The electrodes were clicked into the electrolyzer through slots located in the lid and held in place via the compression of a titanium foil ribbon inside the lid. The compression of the titanium foil also allowed for a simple mechanism of electrical contact to the Ni-plated surface of the 3D-printed electrodes. The placement of the electrodes within the lid ensured they maintained an angle of 30° with respect to vertical.2.4 Electrode characterization
Optical microscopy (Amscope) was used to confirm the deposition of Ni and ensure the continuity of the Ni film. A symmetric electrode with Ni catalyst deposited on both sides was cross sectioned for microscopy by casting it in clear epoxy, sawing it in half, and polishing the cut surface with 400 grit sandpaper (3M). The prepared cross-section was imaged by scanning electron microscopy (SEM), and energy dispersive X-ray spectroscopy (EDS) maps were acquired over three minutes (Zeiss Sigma VP Scanning Electron Microscope). All measurements were taken with a beam voltage of 20 keV.2.5 Electrochemical characterization
All electrochemical experiments were carried out using a Biologic SP-300 bi-potentiostat. All current densities reported are normalized to the 2D rectangular area of the porous electrode that was immersed in the electrolyte. During these measurements, electrical contact was made with the electrodes through direct contact to the deposited Ni film, not the wires nor the carbon-PLA. 3-Electrode measurements in the 1.0 M NaOH electrolyte employed a mercury oxide (HgO) reference electrode (CHI Instruments) and a Ni foil counter electrode. Bubble dynamics were monitored by high speed videography (HSV) using an Edgertronic high-speed video camera (SC1) operating at 500 frames per second with a resolution of 1280 × 1024 pixels.2.6 Analysis of gas collection efficiency and product purity
Prior to operation, a syringe was used to draw electrolyte up into the gas collection chambers located in the headspaces above the cathodes and anodes. During electrolysis, the product gas bubbles floated upwards into the collection chambers, displacing the contained electrolyte. The gas volume collected was monitored throughout electrolysis by recording the height of the meniscus in the respective H2 and O2 collection chambers as a function of time (Fig. S1†). These recorded volumes were then used to determine the gas collection efficiency, defined as the volume of gas collected inside the collection chambers divided by the volume expected by Faraday's law based on the applied current. Each collection manifold contained a single port that was sealed with a rubber septum, from which product gas was sampled using a gas-tight syringe (Hamilton). The collected product gas was characterized using gas chromatography (SRI Instruments, 8610C) with a thermal conductivity detector (TCD) and using argon as the carrier gas. Product cross-over was calculated by dividing the amount of H2 collected in the anodic headspace (i.e. the cross-over gas) by the total amount of H2 measured in both the anodic and cathodic headspaces, as described previously.22,332.6 Finite element modeling
The potential field in the electrolyte and primary current distribution along the length of the electrodes were modeled using the COMSOL 5.4 Electrochemistry Multiphysics package. The potential field was determined by solving Laplace's equation, ∇2ϕ(x,z) = 0, for two-dimensional space where ϕ is the local potential of the electrolyte as a function of position.37 A single pair of electrodes opposing each other at a 60 degree angle were modeled in two dimensions. Along insulating walls, a zero gradient boundary condition in potential was applied in the direction normal to the wall. A constant potential was applied to the electrodes, with ϕ = 0 at the cathode and ϕ = V at the anode, where V is the applied voltage to the electrode pair. After solving for the potential as a function of position, the local current density is determined at the electrode boundary from Ohm's law, i = κ∇ϕ, where κ is the conductivity of the electrolyte. The reported current densities are normalized relative to the average current density that passes through the 2D-rectangular area of the electrode.3. Results and discussion
3.1 Fabrication and characterization of 3D-printed electrodes
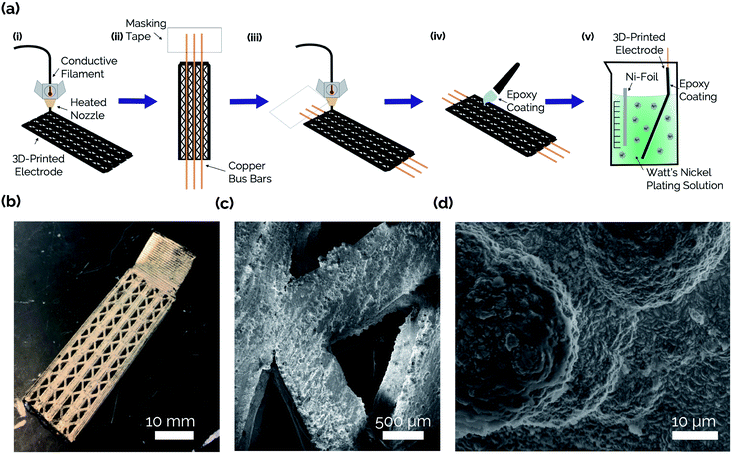
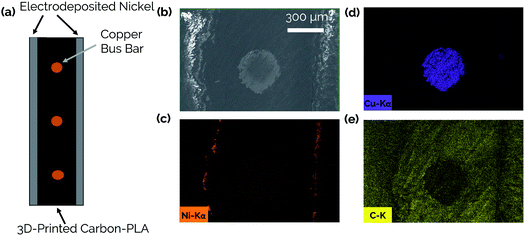
The steps involved with manufacturing the 3D-printed porous electrodes are shown in Fig. 2a. First, one half of an electrode was 3D-printed out of a carbon-PLA composite. Next, the print job was paused, and copper wires were inserted to improve conductivity throughout the interior of the electrode. This was necessary because transmission line measurement (TLM) confirmed that the Protopasta Carbon-PLA is fairly resistive, with a measured through-plane resistivity of 160 Ω cm. Therefore, the copper wires ensured a more even deposition of Ni across the carbon-PLA substrate during the subsequent electrodeposition step. Next, the top half of the electrode was printed with carbon-PLA, thereby sealing the copper wires within the electrode. Epoxy was then coated onto the inner surface of the electrode to ensure that the Ni electrocatalyst would only be electrodeposited onto the outer surface to form an asymmetric electrode structure.11 The electrodes were then immersed in a Ni-plating solution and a Ni film was electrodeposited onto the uncoated side of the electrode.Fig. 2b shows an optical image of the catalytic side of an as-made 3D-printed Ni-PLA electrode, revealing a metallic Ni coating that appears to be uniformly coated on the electrode surface. Front-view SEM images (Fig. 2c) and EDS elemental maps (Fig. S2†) taken of the Ni coated surface at high resolution also indicate that the electrodeposited Ni, while visibly rough, homogeneously coats the carbon-PLA surface. At higher magnification (Fig. 2d), the electrodeposition process is seen to result in a highly textured Ni surface with occasional micro-scale hemispherical features. To further characterize the electrodeposited Ni layer, cross-sectional SEM and EDS images were obtained of an as-made planar electrode with Ni deposited on both sides of the electrode (Fig. 3). The Cu wire is clearly seen in the center of the electrode in these images, which furthermore indicates that the carbon-PLA is in close physical contact with the Cu wire everywhere around its circumference, while a thin Ni layer is evident on the outer surfaces of the electrode. Based on the Ni EDS map, the average thickness of the Ni film was found to be 24 ± 4 μm over the areas of the electrode that were analyzed by SEM.
The performance of the as-made electrodes towards HER and OER was evaluated in 1.0 M NaOH. First, the electrode potential was held for 5 minutes at 1.5 V vs. RHE to pretreat the electrode. Next, cyclic voltammetry (CV) scans were recorded at 10 mV s−1 between −1.0 V and 2.5 V vs. RHE and are shown in Fig. 4. In addition to the OER and HER features that are evident at the positive and negative scan limits, respectively, smaller oxidation and reduction peaks are seen around 1.5 V vs. RHE that can be attributed to Ni oxidation and the reduction of the resulting oxidized Ni species.38 As seen in the CV cycles displayed in Fig. 4 and further demonstrated by analysis of charge density associated with the Ni oxidation feature (Fig. S3†), the magnitude of the Ni oxidation peaks is relatively constant with time, suggesting that the NiOOH/Ni(OH)2 surface layer maintains a relatively constant thickness during CV cycling. Prior work has demonstrated that the performance of Ni electrodes in alkaline solution becomes constant upon the achievement of a stable passivating oxide layer.39 During the negative segment of the CV scan, the onset potential for HER occurs around −0.2 V vs. RHE, consistent with previous reports of Ni HER electrocatalysts tested in NaOH.40,41 The onset for OER occurs around 1.6 V vs. RHE, which is also similar to that reported previously.22 For a current density of 50 mA cm−2, an overpotential of −0.6 V is required for HER, and an overpotential of 0.8 V is required for OER. Both the OER and HER features in the CV curve are dominated by ohmic losses at larger current densities, as reflected by the linear relationship between current density and applied potential. The Tafel slopes of the Ni-PLA electrodes were calculated from the iR-corrected CV curve to be 105 mV dec−1 (Fig. S4a†) and 157 mV dec−1 (Fig. S4b†) for the HER and OER, respectively. These Tafel slopes are similar to those values reported previously for Ni HER and OER electrodes in alkaline electrolytes.38,42–44
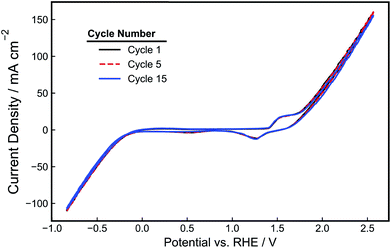 | ||
| Fig. 4 CV-curve (1st, 5th, and 15th cycles) of a 3D-printed, nickel-PLA electrode recorded at 10 mV s−1 in de-aerated 1.0 M NaOH. | ||
The stability of a pair of Ni-PLA 3D-printed electrodes was also evaluated at a constant current density of 20 mA cm−2 for a period of 4 hours during operation in a 2-electrode configuration (Fig. 5a). Cyclic voltammetry for each electrode (Fig. 5b and c) was also recorded in a 3-electrode arrangement before and after the stability test to assess whether any observed degradation could be attributed to the cathode, anode, or both electrodes. As demonstrated in Fig. 5a, the device performance is quite stable, with the electrode pair exhibiting only a 70 mV increase in voltage throughout the 4 hour period. In examining the CV curves in Fig. 5b and c, the loss in electrolyzer performance appears to originate primarily from changes to the anode. While the CV curves recorded for the cathode (Fig. 5b) exhibit very little change before and after the stability test, the OER feature at the positive scan vertex of the anode CV curves is seen to be substantially reduced after CV cycling (Fig. 5c). Consistent with the CV shown in Fig. 4, very little change is seen in the integrated charge associated with the Ni oxidation/reduction features, suggesting that there has not been significant change in the thickness of the catalytic NiOOH/Ni(OH)2 layer. However, the subtle decrease in the OER current density feature at the positive scan limit indicates that there is loss in OER activity. EIS measurements (Fig. S5†) were also conducted before and after the stability test to determine whether increases in ohmic overpotentials were contributing to the loss in efficiency during operation. These measurements found that the total series resistance in the cell increased by 0.26 Ω, which would result in an additional ohmic overpotential loss of 39 mV at a current density of 20 mA cm−2. This explains a significant portion of the 0.07 V increase in applied potential. However, it is likely that other factors, such as reduced catalytic activity at the surface of the anode, might have also contributed to the loss of efficiency during the stability experiment.
3.2 Description and demonstration of a passive membraneless electrolyzer
Side- and top-view renderings of a 3-cell membraneless electrolyzer constructed for this study are provided in Fig. 6. The bottom portion of the electrolyzer body consists of a 3D-printed rectangular chassis made of an acrylic resin that contains grooved edges for incorporation of viewing windows onto the front, back, and sides. These windows were included for the purpose of monitoring bubble dynamics during operation but would not be necessary in a commercial device. The top portion of the electrolyzer, which fits tightly within the chassis, consists of a monolithic 3D-printed lid component containing the product gas collection manifolds and six slots for inserting three pairs of clickable electrodes. Electrodes were positioned in the lid such that the anode and cathode of the middle cell faced the anode and cathode, respectively, of the two outer cells. This configuration allows two electrodes to share a common gas collection chamber. As seen in the top-view rendering in Fig. 6b, narrow channels located within the lid connect all of the H2 collection chambers to each other and all of the O2 collection chambers to each other. This gas manifold system allows for sampling of the anode and cathode product headspaces from just two gas sampling ports, which were located over the central cell. Each gas collection manifold is capable of holding ≈10 mL of product gas. Within the lid component, the anodes and cathodes are separated from each other by a 1 mm wide insulating baffle.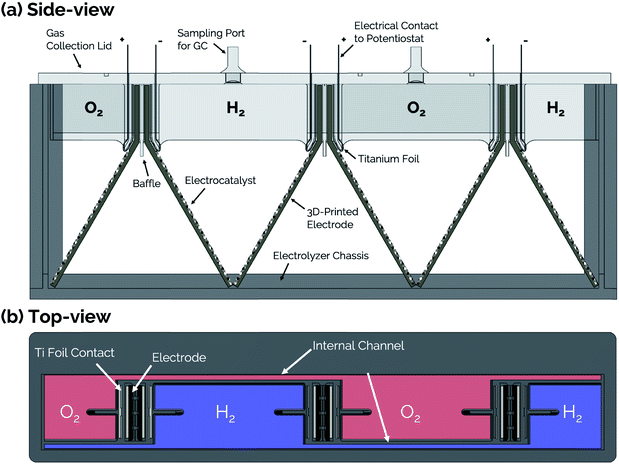 | ||
| Fig. 6 (a) Side-view and (b) top-view schematics of a modular, membraneless electrolyzer with 3D-printed “clickable” electrodes. | ||
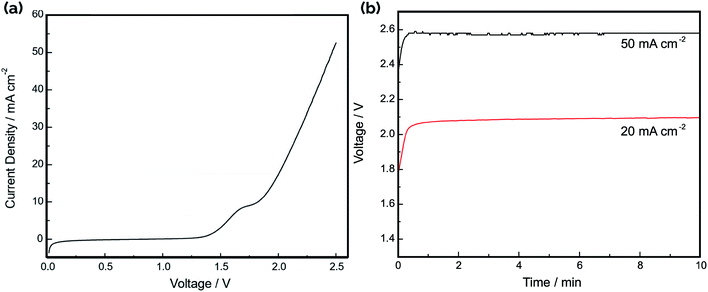
The current–voltage (IV) curve for the electrolyzer was recorded in 1.0 M NaOH by connecting the three cells in parallel, with the result shown in Fig. 7a. Consistent with the difference in HER and OER onset potentials noted in the CV curves in Fig. 4, the “turn-on” voltage for electrolysis occurs around 1.5 V. Fig. 7b shows the operating voltage at constant applied current densities of 20 mA cm−2 and 50 mA cm−2, displaying stable voltages that are in good agreement with the IV curves in Fig. 7a. The electrolysis efficiency was calculated as the ratio of the thermodynamic minimum voltage required for water splitting (1.23 V based on the Gibbs free energy change of reaction) to the applied voltage between the anodes and cathodes. Based on the IV curve in Fig. 7a, the voltage efficiency of the electrolyzer is 59% and 48% at current densities of 20 mA cm−2 and 50 mA cm−2, respectively. Although the observed turn-on voltage for the device is similar to those reported for other electrolyzers using electrodeposited Ni films as catalyst,41 the efficiencies at higher current densities are significantly worse. This can be largely attributed to the ohmic resistances in the system resulting from the conduction of ions across the electrode gap as well as the sheet resistance for electron conduction in the Ni film. The total resistance between a single electrode pair in 1.0 M NaOH was found to be 0.98 Ω using electrochemical impedance spectroscopy (EIS) (Fig. S6a†).
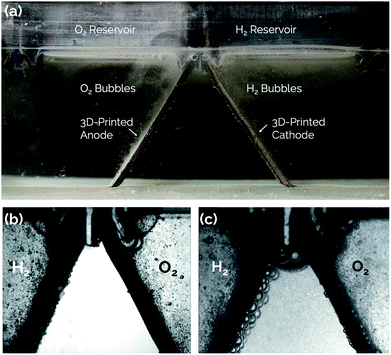
Gas chromatography (GC) analysis of the evolved product gas was performed at two operating current densities: 20 mA cm−2 and 50 mA cm−2. For operation at 20 mA cm−2, the measured cross-over of H2 was 3.6 ± 0.3%. For operation at 50 mA cm−2, the cross-over was determined to be 4.6 ± 0.7%. These cross-over values are high when compared to cross-over rates of both commercial electrolyzers and other reported membraneless electrolyzers.12,34,35,45 Therefore, high speed video analysis was conducted during electrolyzer operation to provide insights into the mechanisms of product gas cross-over. Representative still-frame images taken during electrolysis at a constant current density of 20 mA cm−2 are provided in Fig. 8. As shown in Fig. 8a and ESI Video S1† bubbles are seen to evolve primarily from the Ni-coated outer surfaces of the asymmetric electrodes and float upwards into the gas collection reservoirs, as intended. Fig. 8b contains a zoomed-in view of the upper portion of a single pair of electrodes that was captured shortly after starting the experiment, revealing no visual evidence of macroscopic bubbles traversing the electrode gap under these conditions. However, at longer times, HSV shows that smaller bubbles become entrained in the electrolyte, and convective cells that develop within the electrolyzer due to gas evolution from the electrodes are capable of facilitating cross-over of bubbles between the cathode and anode chambers (Fig. 8c). This observation of direct bubble cross-over corroborates the high rates of cross-over determined by GC analysis of the product gases sampled from the anode and cathode gas collection manifolds. As revealed in our previous study on passive membraneless electrolyzers,11 dissolved H2(aq) and O2(aq) transported by bubble-induced convection can also contribute to the total cross-over rate. However, in contrast to that study, HSV analysis (Fig. S7†) and GC measurements carried out for the three-cell electrolyzer studied here exhibited an increase in the % cross-over with increasing current density.
The gas collection efficiency of the device, defined as the mole percent of generated product that is collected in its gaseous state within the gas collection chamber,11 was determined by monitoring the volume of product gas in the collection chambers as a function of time during electrolysis at an applied current density of 20 mA cm−2. Fig. S8† shows the results of these measurements compared to the amount of gas that is expected based on the ideal gas law and Faraday's law, where 100% faradaic efficiency was assumed in the latter. From these curves, it is found that 92% of the generated H2 and 93% of the generated O2 is collected in the respective headspaces. This indicates that a relatively small amount of the product gas is lost to dissolution to the liquid phase or back reaction at the opposite electrode.
3.3 Challenges and opportunities for 3D-printed membraneless electrolyzers
A key challenge for membraneless electrolyzers is to effectively manage the transport of the electrochemically generated gas bubbles while operating at a practical current density and energy efficiency. The relationships between the operating conditions and the energy efficiency of an electrolyzer are well understood, but the conditions governing product purity are not as well defined due to the stochastic nature of multiphase flows in these membraneless electrolyzers. Furthermore, changes to the reactor design which improve the energy efficiency can also affect the rates of gas cross-over and therefore product purity. In this section, we discuss the energy efficiency and product cross-over for the membraneless electrolyzer presented in this report as well as opportunities to improve these metrics.For the membraneless electrolyzer in this study, an operating voltage of 2.58 V was required to maintain an average current density of 50 mA cm−2. Relative to the thermodynamic minimum voltage required for water splitting, 1.23 V, the energy efficiency of the electrolyzer is calculated to be 48%. Much of this efficiency loss can be attributed to the ohmic resistance of the six-electrode device, where for an EIS measured resistance of 0.50 Ω (Fig. S6b†) and total operating current of 1.125 A, an IR drop of 0.56 V is calculated. Most of this IR drop can be attributed to the loss due to ionic conduction through the electrolyte in the angled electrode configuration, because the IR drop due to conduction through the nickel film was calculated to be 0.0017 V—a negligible contribution to the overall IR drop. Due to a relatively high electrolyte concentration of 1.0 M NaOH, any additional overpotential losses due to concentration gradients are also expected to be negligible.
Although the energy efficiency for a state-of-the-art water electrolysis system is typically around 60 to 80%,6 lower energy efficiencies can be tolerable provided there is a sufficiently cheap source of electrical energy.8 The largest improvement to the efficiency of the membraneless electrolyzer can be achieved by decreasing the ohmic resistance of the cell. One way to improve the ohmic resistance is to increase the conductivity of the electrolyte. This can be achieved by increasing the electrolyte concentration and/or switching to a more conductive electrolyte such as sulfuric acid. However, the corrosiveness of highly concentrated acidic or alkaline electrolytes can be hazardous and limit the choice of materials which are resistant to degradation. Additionally, the kinetics for the oxygen evolution reaction are sluggish in acidic environments and require expensive catalysts such as iridium oxide. Another way to decrease the ohmic resistance is to decrease the average electrode separation distance. For an angled electrolyzer system, this is achieved by decreasing the separation angle between the electrodes.22
An additional benefit of decreasing the electrode separation angle is that the current distribution along the electrodes becomes more uniform, resulting in a more even utilization of electrocatalyst as a function of position on the electrode surface. Nonuniformities in the local current density arise due to a change in the ohmic resistance as a function of position on the electrode and depends on the ionic conduction pathway between the electrodes. Fig. S9a and b† show the simulated potential field and primary current distribution for a pair of electrodes opposing each other at a 60 degree angle, the same angle used in experimental devices. These simulations show that the largest current density occurs near the top of the electrode where the separation distance, and thus the solution resistance between the anode and cathode, is smallest. However, it does not occur at the exact top end of the electrode because the baffle acts as a physical separator that lengthens the distance ions must migrate from the top point of one electrode to the opposing electrode. The minimum current density occurs at the bottom of the electrode where the average distance for ion transport is largest. As shown in Fig. S9,† the maximum local current density that occurs close to the top of the electrodes is about three times larger than the average current density along the length of the electrode. Meanwhile, the local current density located at x/L = 0.8, where L is the length of the electrode and x is the distance from the top of the electrode, is approximately half the average current density. Because of the symmetric positioning of the electrodes, the primary current distribution is the same for both the cathode and the anode.
When the electrodes are parallel to each other, the electrode separation distance is constant, and the current distribution is theoretically uniform. At close separation distances, the ionic conduction pathway between the electrodes is shortest, but so is the pathway for product cross-over. Thus, operating at these close separation distances can improve the energy efficiency of the device, but can also decrease the product purity. In a previous study of a membraneless electrolyzer with a single pair of electrodes, it was demonstrated that the product cross-over was highest when the electrodes were oriented parallel to each other.11 Understanding the processes by which gas products cross from one electrode to the opposing collection chamber can help maintain product gas streams safely outside of flammability limits8—even when the electrode separation distance is narrow.
Presently, the demonstrated cross-over percentages for state of the art membraneless electrolyzers12,34 fall well below the purities achieved for PEM electrolyzers. Due to the ability of polymer electrolyte membranes to serve as physical barriers to prevent cross-over of evolved product gases, commercial PEM electrolyzers can generate H2 at a purity of typically >99.99%.45,46 Nonetheless, the lowest reported cross-overs shown for membraneless electrolysis are still significantly lower than what was measured in this study, with prior studies demonstrating 0.19% for H2 and 0.5% for O2 in an alkaline electrolyzer,34 and <1% for an acidic electrolyzer.12 In both of these studies, however, the products were separated using flow-based separation as opposed to the buoyancy-driven separation employed here. While bulk fluid flow based on forced advection can be beneficial for efficient separation of products, our team's previous work has shown that fluid flow resulting from bubble-induced convection can be detrimental to product purity by promoting the cross-over of dissolved H2(aq) and O2(aq).11 The difference in bubble collection mechanisms (advection vs. buoyancy) is thus a major reason why the hydrogen cross-over rate of 3.6% demonstrated in this work is much greater than previously reported cross-over rates for membraneless electrolyzer systems. Given that process safety is of critical importance for emerging technologies, it will be essential that future efforts be made to engineer electrodes/devices that achieve higher product purities.
Prior work on membraneless electrolyzers based on buoyancy-driven separation by Davis et al.11 has already demonstrated significantly lower cross-over, achieving a minimum of 1% cross-over for the optimized configuration. One explanation for the increased cross-over in the present study is the formation of bubble-induced convective cells that develop in the liquid electrolyte between adjacent anodes and cathodes. Because the previous study only considered a single electrode pair, this challenge did not arise. Bubble-induced convection is especially relevant to consider in the operation of gas evolving electrodes due to its substantial impact on mass and heat transfer, overpotential, limiting current density, and system resistance.47
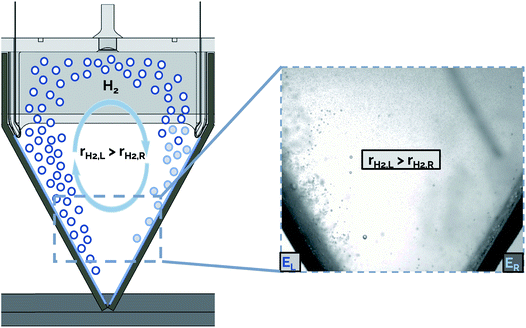
The presence of bubble-induced convection cells is evident from video recorded during electrolysis (ESI Video S2†), where bubble plumes are observed moving in circular cells that are most prevalent in the regions between the catalytically active outer surfaces of adjacent electrodes. In principle, the symmetry of the electrolyzer design employed in this work should mean that the bubble-induced convection cells originating from adjacent electrodes should, on average, be of similar size and opposing circulation. However, careful inspection of the convective cells during electrolyzer operation shows that this is not the case. As illustrated schematically in Fig. 9, non-uniform current densities from adjacent electrodes can lead to uneven bubble-induced convection, resulting in one large rotational convection cell. In this example, a higher rate of H2 gas evolution is shown from the electrode on the left (rH2,L) compared to that from the opposing electrode on the right (rH2,R), resulting in a convective cell with clockwise flow direction. We hypothesize that these large convective cells cause the electrolyte to circulate across the interelectrode gap, resulting in higher rates of cross-over of dissolved and gaseous product species.
In order to decrease the rate of gas cross-over in a membraneless electrolyzer stack, design changes should be implemented to discourage the formation of convective cells. The nonuniform bubbling shown in ESI Video S3† and Fig. 9 may be caused by poor impedance matching between adjacent electrode pairs. In this work, a possible reason for uneven impedances was degradation or changes to the electrodeposited nickel layer over extended periods of operation, which could increase the ohmic resistance within the electrode itself. Non-uniform rates of degradation between electrodes are expected to cause some electrode pairs to have a higher ohmic resistance than others, and therefore result in varying rates of reaction for different cathodes in the same electrolyzer stack. In future studies based on the approach described here, a more consistent electrode conductivity could be achieved by improving the adhesion of the metal layer to the 3D-printed substrate.
In addition to improving the impedance matching of electrode pairs, the formation of convective cells could also be dampened by modifying the architecture of the membraneless electrolyzer. For example, baffles could be added to impede the flow of electrolyte and better direct bubbles towards the collection chamber. Another approach could be to change the morphology of the porous electrodes themselves. Previous studies have shown that the bubble departure dynamics can be modified by changing the electrode mesh size and porosity48 as well as the surface wettability.49 A 3D-printed electrode could be designed with a unique geometry to achieve favorable bubble departure dynamics that are less likely to form a convective cell and therefore decrease the overall rate of cross-over. Such a design could be known a priori or could be obtained from a three-dimensional topology optimization algorithm. During three-dimensional topology optimization, a computer simulation iteratively optimizes a geometry based on a physical model.50 Leveraging the fabrication methods demonstrated in this study and elsewhere, 3D-printing of conductive flow-through electrodes provides an excellent opportunity for rapid prototyping of electrodes with optimal geometries (e.g. functionally graded mesh gauges, surface features, or mesh densities) for various flow regimes. Iterative techniques coupled with multi-physics continuum models of membraneless electrolyzers could also be utilized to generate electrodes with geometries that simultaneously minimize cross-over and maximize device efficiency by minimizing ohmic overpotentials associated with the electrode and ion transport in the solution. Lastly, recent work by Ambrosi has demonstrated that the application of metal-based 3D-printing processes51 can be advantageous in fabricating highly conductive 3D-printed electrodes. The higher conductivity of these 3D-printed electrodes will make mismatch of impedances less of an issue, thereby suppressing the formation of convective cells that can lead to uneven current densities and bubble flow patterns that lead to increased product cross-over rates.52 Improved electrode conductivity would also be advantageous to reduce IR-losses in the device and improve electrolysis efficiencies.
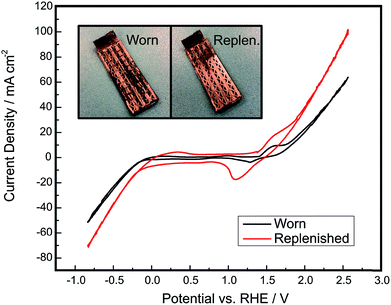
Through the approaches outlined above, there is significant potential to improve the electrolysis efficiency and product purity of membraneless electrolyzers based on buoyancy-driven separation of evolved product gases. If these metrics can be improved to levels at or above those currently achieved by commercial alkaline electrolyzers while maintaining lower capital costs, there should be significant opportunity to displace incumbent technologies. However, it is important to note that electrolysis efficiency, capital costs, and product purity (above safe limits) are not the only important metrics. Durability is also a critically important performance metric for electrolyzers, and membrane-free devices have an inherent advantage with respect to this metric because they lack membranes or dividers that could normally degrade in harsh environments.8,53–56 There is always the possibility of replacing or regenerating membranes and electrodes, but unfortunately it is very challenging to do so with conventional membrane electrode assemblies. In contrast, a membraneless electrolyzer architectures eliminate concerns for divider degradation and provides the opportunity for easy replacement or regeneration of degraded electrodes. This is a major potential advantage of the “clickable” electrodes demonstrated in this work, for which electrodes can be easily removed and regenerated by electrodepositing fresh electrocatalyst. This is in stark contrast to membrane electrode assemblies (MEAs), for which the entire MEA must be completely replaced if a single key component becomes significantly fouled or degraded. As shown in Fig. 10, a degraded clickable electrode can be easily regenerated by re-plating fresh Ni onto the electrode surface to improve its catalytic activity and electrical conductivity. The use of electrodeposition to regenerate a degraded electrode has previously been demonstrated for electrochemical cells.57,58 The particular electrode that was regenerated in this work was first operated as a cathode for approximately 4 hours of chronoamperometry experiments and then intentionally scratched with 220 grit sandpaper. The replenished electrode possesses a visibly more homogeneous nickel layer than the worn electrode and displays much higher current densities, nearly doubling the current density of OER at high overpotentials. This demonstrates that the electrodes in this system are capable of being externally treated and reutilized within the device, presenting opportunities for servicing and replacement of electrodes that are not present in current state of the art MEA-based architectures. This ability to easily repair and service electrodes in and out of the architecture would be highly desirable at commercial scales, where downtime due to the degradation of a single cell or electrode would cause significant losses in generated hydrogen.
Currently, the six-electrode cell operates at a hydrogen production rate of 0.24 g H2 per day. Although this production rate is still quite small compared to commercial electrolyzers or even previously demonstrated flow-based membraneless electrolyzers,36 a key advance demonstrated with this design compared to our previous demonstration of a passive electrolyzer is its extension to multiple electrode pairs. Due to the modular nature of the device, in which multiple electrode pairs can be easily integrated into the same manifold/lid and inserted into the same electrolyte reservoir, it is straightforward to imagine a larger electrolyzer containing hundreds or thousands of electrode pairs. Considering the 6-electrode cell from this work operating at a current density of 20 mA cm−2, the rate of hydrogen production normalized to the volume of the device is 0.0013 g H2 per cm3 per day. Based on this volumetric production rate, an electrolyzer volume of 0.75 m3 would be required to produce 1 kg of H2 per day, which would be an appropriate rate of H2 production to operate one H2 fuel cell vehicle.
Besides increasing the number of electrode pairs, larger hydrogen production rates can also be achieved by increasing the size of individual electrodes, but caution must be exercised with respect to potential trade-offs between efficiency and product purity. For angled electrodes such as those used in this work, increasing the length of the electrodes will result in lower electrolysis efficiency due to larger ohmic drops required to sustain ion transport across larger average electrode separation distances. Decreasing the electrode angle reduces the ohmic resistance and thereby allows for longer electrodes to be used, but we have previously shown that decreasing the electrode angle can result in lower product purity for this type of passive design.11 On the other hand, the width of the electrodes (i.e. extending into or out of the page as viewed in Fig. 6a) can be scaled indefinitely without adversely affecting the solution IR drop. Increasing the electrolyte conductivity by increasing the concentration of the aqueous electrolyte can help to reduce solution IR losses in membraneless electrolyzers irrespective of geometry but doing so can also adversely affect materials stability and overall process safety. This discussion highlights the fact that there are many key performance metrics for an electrolyzer, including but not limited to efficiency, product purity, scalability, stability, maintenance, safety, and cost. Moving forward, it will be essential that researchers developing membraneless electrolyzers take all of these metrics into account.
4. Conclusions
This study has demonstrated the application of 3D-printed electrodes into a novel “clickable” electrode architecture for water electrolysis in alkaline conditions in the absence of a pumped electrolyte. The 3D-printed flow-through electrodes, which were printed in a conductive polymer composite and coated with a thin layer of electrodeposited Ni, could be easily clicked in and out of the gas collection manifold through mechanical compression of a folded sheet titanium foil that also makes electrical contact to the Ni surface of the electrode. This allows for a low resistance contact, simple servicing of the electrodes, and improved scalability.The 3D-printed electrolyzer exhibited stable operating characteristics over short time periods while maintaining an electrolysis efficiency of 48% at an applied current density of 50 mA cm−2. These electrodes, due to their 3D-printed, clickable nature, could easily be replenished by electrodeposition. Furthermore, when examining the in situ high speed video footage captured during device operation, it was evident that the bubble evolution behavior was similar to that seen in prior studies. The performance of membraneless electrolyzers such as those investigated in this study may be improved by future research efforts that explore designing 3D-printed electrodes with optimized pore mesh geometries that better manage the trade-off between product cross-over and device efficiency.
Conflicts of interest
DVE is a co-founder of sHYp, B.V.Acknowledgements
JTD and DVE acknowledge funding from Shell International Exploration & Production New Energies Research & Technology Dense Energy Carriers Program. The authors also acknowledge Anna Dorfi for her help with obtaining SEM and EDS images, Xueqi Pang for his assistance in the stability experiments, the Columbia University Makerspace for access to its 3D-printers, Thomas Orr for assisting in the design and fabrication of electrolyzers, and Hod Lipson's Creative Machines Laboratory for access to their Stratasys Objet J750 to 3D-print the chassis of the electrolyzer.References
- H. Lipson and M. Kurman, Fabricated: The New World of 3D Printing, John Wiley and Sons, Inc., Indianapolis, Indiana, 2013 Search PubMed.
- K. Hajash, B. Sparrman, C. Guberan, J. Laucks and S. Tibbits, 3D Print. Addit. Manuf., 2017, 4, 123–131 CrossRef.
- M. Guvendiren, J. Molde, R. M. D. Soares and J. Kohn, ACS Biomater. Sci. Eng., 2016, 2, 1679–1693 CrossRef CAS PubMed.
- B. Gross, S. Y. Lockwood and D. M. Spence, Anal. Chem., 2017, 89, 57–70 CrossRef CAS PubMed.
- A. Ambrosi and M. Pumera, Chem. Soc. Rev., 2016, 45, 2740–2755 RSC.
- M. Carmo, D. L. Fritz, J. Mergel and D. Stolten, Int. J. Hydrogen Energy, 2013, 38, 4901–4934 CrossRef CAS.
- K. Zeng and D. Zhang, Prog. Energy Combust. Sci., 2010, 36, 307–326 CrossRef CAS.
- D. V. Esposito, Joule, 2017, 1, 651–658 CrossRef CAS.
- M. R. Shaner, H. A. Atwater, N. S. Lewis and E. W. McFarland, Energy Environ. Sci., 2016, 9, 2354–2371 RSC.
- J. T. Davis, D. E. Brown, X. Pang and D. V. Esposito, J. Electrochem. Soc., 2019, 166, F312–F321 CrossRef CAS.
- J. T. Davis, J. Qi, X. Fan, J. C. Bui and D. V. Esposito, Int. J. Hydrogen Energy, 2018, 43, 1224–1238 CrossRef CAS.
- S. M. H. Hashemi, P. Karnakov, P. Hadikhani, E. Chinello, S. Litvinov, C. Moser, P. Koumoutsakos and D. Psaltis, Energy Environ. Sci., 2019, 12, 1592–1604 RSC.
- Z. X. Low, Y. T. Chua, B. M. Ray, D. Mattia, I. S. Metcalfe and D. A. Patterson, J. Membr. Sci., 2017, 523, 596–613 CrossRef CAS.
- J. M. Lim, H. J. Lee, H. W. Kim, J. Yong Lee, J. T. Yoo, K. W. Park, C. K. Lee, Y. T. Hong and S. Y. Lee, J. Membr. Sci., 2015, 481, 28–35 CrossRef CAS.
- L. F. Arenas, C. Ponce de León and F. C. Walsh, Electrochem. Commun., 2017, 77, 133–137 CrossRef CAS.
- A. Ambrosi and M. Pumera, Adv. Funct. Mater., 2017, 1700655 Search PubMed.
- C. Zhao, C. Wang, R. Gorkin, S. Beirne, K. Shu and G. G. Wallace, Electrochem. Commun., 2014, 41, 20–23 CrossRef CAS.
- B. D. Gould, J. A. Rodgers, M. Schuette, K. Bethune, S. Louis, R. Rocheleau and K. Swider-Lyons, ECS J. Solid State Sci. Technol., 2015, 4, P3063–P3068 CrossRef CAS.
- J. R. Hudkins, D. G. Wheeler, B. Peña and C. P. Berlinguette, Energy Environ. Sci., 2016, 9, 3417–3423 RSC.
- G. Chisholm, P. J. Kitson, N. D. Kirkaldy, L. G. Bloor and L. Cronin, Energy Environ. Sci., 2014, 7, 3026–3032 RSC.
- O. O. Talabi, A. E. Dorfi, G. D. O'Neil and D. V. Esposito, Chem. Commun., 2017, 1–4 Search PubMed.
- G. D. O'Neil, C. D. Christian, D. E. Brown and D. V. Esposito, J. Electrochem. Soc., 2016, 163, F3012–F3019 CrossRef.
- G. P. Halada, Appl. Sci., 2017, 631–632 Search PubMed.
- A. Le Duigou, M. Castro, R. Bevan and N. Martin, Mater. Des., 2016, 96, 106–114 CrossRef.
- Y. Tao, H. Wang, Z. Li, P. Li and S. Q. Shi, Materials, 2017, 10, 1–6 Search PubMed.
- A. Le Duigou, M. Castro, R. Bevan and N. Martin, Mater. Des., 2016, 96, 106–114 CrossRef.
- F. Carmona and C. Mouney, J. Mater. Sci., 1992, 27, 1322–1326 CrossRef CAS.
- M. Ibrahim, Y. Mogan, S. N. Shafiqah Jamry and R. Periyasamy, ARPN J. Eng. Appl. Sci., 2016, 11, 6525–6530 Search PubMed.
- H. Gao and N. A. Meisel, Solid Free. Fabr. Symp., 2017, 1612–1626 Search PubMed.
- S. Klomp, M.Sc. thesis, Gent University, 2015.
- G. D. O’neil, S. Ahmed, K. Halloran, J. N. Janusz, A. Rodríguez and I. M. T. Rodríguez, Electrochem. Commun., 2019, 99, 56–60 CrossRef.
- A. Therdthianwong, P. Manomayidthikarn and S. Therdthianwong, Energy, 2007, 32, 2401–2411 CrossRef CAS.
- S. M. H. Hashemi, M. A. Modestino and D. Psaltis, Energy Environ. Sci., 2015, 8, 2003–2009 RSC.
- M. I. Gillespie and R. J. Kriek, J. Power Sources, 2018, 397, 204–213 CrossRef CAS.
- M. I. Gillespie, F. Van Der Merwe and R. J. Kriek, J. Power Sources, 2015, 293, 228–235 CrossRef CAS.
- M. I. Gillespie and R. J. Kriek, J. Power Sources, 2017, 372, 252–259 CrossRef CAS.
- J. Newman and K. E. Thomas-Alyea, Electrochemical Systems, John Wiley and Sons, Inc., Hoboken, NJ, 3rd edn, 2004 Search PubMed.
- X. Wang, H. Luo, H. Yang, P. J. Sebastian and S. A. Gamboa, Int. J. Hydrogen Energy, 2004, 29, 967–972 CrossRef CAS.
- A. Ambrosi and M. Pumera, Chem.–Eur. J., 2012, 18, 3338–3344 CrossRef CAS PubMed.
- C. C. L. McCrory, S. Jung, I. M. Ferrer, S. M. Chatman, J. C. Peters and T. F. Jaramillo, J. Am. Chem. Soc., 2015, 137, 4347–4357 CrossRef CAS PubMed.
- M. Gong, D. Y. Wang, C. C. Chen, B. J. Hwang and H. Dai, Nano Res., 2016, 9, 28–46 CrossRef CAS.
- M. Gong, W. Zhou, M. Tsai, J. Zhou, M. Guan, M. Lin, B. Zhang, Y. Hu, D. Wang, J. Yang, S. J. Pennycook, B. Hwang and H. Dai, Nat. Commun., 2014, 5, 1–6 Search PubMed.
- A. Lasia and A. Rami, J. Electroanal. Chem., 1990, 294, 123–141 CrossRef CAS.
- J. L. Weininger and M. W. Breiter, J. Electrochem. Soc., 1964, 111, 707–712 CrossRef CAS.
- F. Barbir, Sol. Energy, 2005, 78, 661–669 CrossRef CAS.
- M. Paidar, V. Fateev and K. Bouzek, Electrochim. Acta, 2016, 209, 737–756 CrossRef CAS.
- J. Zhu, X. Zhang, P. Lv, Y. Wang and J. Wang, Int. J. Hydrogen Energy, 2018, 43, 8632–8643 CrossRef CAS.
- Y. Zhang, M. D. Merrill and B. E. Logan, Int. J. Hydrogen Energy, 2010, 35, 12020–12028 CrossRef CAS.
- Y. Li, H. Zhang, T. Xu, Z. Lu, X. Wu, P. Wan, X. Sun and L. Jiang, Adv. Funct. Mater., 2015, 25, 1737–1744 CrossRef CAS.
- J. Mici, B. Rothenberg, E. Brisson, S. Wicks and D. M. Stubbs, Optomech. Eng., 2015, 9573, 957306 Search PubMed.
- A. Malladi and S. Sarma, IUP Journal of Mechanical Engineering, 2017, 10, 49–54 Search PubMed.
- A. Ambrosi and M. Pumera, ACS Sustainable Chem. Eng., 2018, 6, 16968–16975 CrossRef CAS.
- R. Borup, J. Meyers, B. Pivovar, Y. S. Kim, R. Mukundan, N. Garland, D. Myers, M. Wilson, F. Garzon, D. Wood, P. Zelenay, K. More, K. Stroh, T. Zawodzinski, X. J. Boncella, J. E. Mcgrath, O. M. Inaba, K. Miyatake, M. Hori, K. Ota, Z. Ogumi, S. Miyata, A. Nishikata, Z. Siroma, Y. Uchimoto, K. Yasuda, K. Kimijima and N. Iwashita, Chem. Rev., 2007, 107, 3904–3951 CrossRef CAS PubMed.
- S. Zhang, X. Yuan, H. Wang, W. Mérida, H. Zhu, J. Shen, S. Wu and J. Zhang, Int. J. Hydrogen Energy, 2009, 34, 388–404 CrossRef CAS.
- T. Oki, T. Katsumata, K. Hashimoto and M. Kobayashi, Mater. Trans., 2009, 50, 1864–1870 CrossRef CAS.
- L. Duclos, M. Lupsea, M. Guillaume, L. Svecova, P.-X. Thivel and V. Laforest, J. Cleaner Prod., 2017, 142, 2618–2628 CrossRef CAS.
- Gurudayal, J. W. Beeman, J. Bullock, H. Wang, J. Eichhorn, C. Towle, A. Javey, F. M. Toma, N. Mathews and J. W. Ager, Energy Environ. Sci., 2019, 12, 1068–1077 RSC.
- B. C. M. Martindale and E. Reisner, Adv. Energy Mater., 2016, 6, 1–9 Search PubMed.
Footnote |
| † Electronic supplementary information (ESI) available. See DOI: 10.1039/c9se00710e |
| This journal is © The Royal Society of Chemistry 2020 |

