
Rapid detection of synthetic cannabinoids in herbal highs using surface-enhanced Raman scattering produced by gold nanoparticle co-aggregation in a wet system†
Hiroki
Segawa
 *a,
Takao
Fukuoka
b,
Tamitake
Itoh
c,
Yuichi
Imai
d,
Yuko T.
Iwata
a,
Tadashi
Yamamuro
a,
Kenji
Kuwayama
a,
Kenji
Tsujikawa
a,
Tatsuyuki
Kanamori
a and
Hiroyuki
Inoue
a
*a,
Takao
Fukuoka
b,
Tamitake
Itoh
c,
Yuichi
Imai
d,
Yuko T.
Iwata
a,
Tadashi
Yamamuro
a,
Kenji
Kuwayama
a,
Kenji
Tsujikawa
a,
Tatsuyuki
Kanamori
a and
Hiroyuki
Inoue
a
aThird Department of Forensic Science, National Research Institute of Police Science, 6-3-1, Kashiwanoha, Kashiwa, Chiba 277-0882, Japan. E-mail: segawa@nrips.go.jp
bDepartment of Micro Engineering, Kyoto University, Kyoto daigaku-Katsura, Nishikyo-ku, Kyoto 615-8540, Japan
cHealth Research Institute, National Institute of Advanced Industrial Science and Technology, 2217-14, Hayashi-cho, Takamatsu, Kagawa 761-0395, Japan
dSTRAWB Inc., 1542-1, Nakahara-cho, Takahashi, Okayama 716-0045, Japan
First published on 7th October 2019
Abstract
Synthetic cannabinoids (SCs) are a major category of new psychoactive substances that are frequently distributed after addition to plants. To date, various SCs with small differences in their chemical structures have prevailed in the illegal drug market. Thus, the development of a method for rapid detection with high discrimination capability is critically important for the forensic field. Vibrational spectroscopy is a possible analytical technique for this purpose because it can sensitively reflect differences among chemical structures. In this study, we applied surface-enhanced Raman scattering (SERS) with gold nanoparticle co-aggregation in a wet system to plant samples containing SCs. The experimental protocol used was simple and involved only mixing of the sample with several other solutions. It was possible to detect SERS spectra from various stock solutions of SCs by this method. The method was then applied to street samples containing SCs. Some of the plant samples containing SCs did not produce significant SERS signals even though stock solutions of the same SCs did produce SERS spectra. We investigated the reason for this discrepancy and speculated that the solubility in aqueous solutions was a factor determining whether a significant SERS signal could be detected or not. According to this hypothesis, minimal sample pre-treatment methods were applied. This allowed for the detection of SERS spectra from the examined plant samples. The developed approach is a powerful method for screening analysis of SCs in plant fragments.
Introduction
Recently, the abuse of new psychoactive substances (NPSs) has been increasing and become a global problem.1,2 NPSs are synthetic drugs that are produced by slightly changing the chemical structures of template drugs. There are several categories of basic skeletons, such as phenethylamines, phencyclidine-type substances, piperazines, tryptamines, synthetic cathinones, and synthetic cannabinoids (SCs).3,4 SCs are a major category of NPSs, and many structural analogs with small differences have been synthesized by the creation of positional isomers, functional group substitutions, and methylene group elongation.5 In the illegal drug market, SCs are frequently distributed after being added to plant fragments. These plant products are called “herbal highs” and are often sold as “not for human consumption”. It is important to accurately identify SCs for forensic drug analysis because drug regulations can depend on small differences in the chemical structure.Vibrational spectroscopy, such as infrared absorption spectroscopy and Raman spectroscopy, may be suitable for drug screening purposes. Vibrational spectra sensitively reflect changes in chemical structures, and can be used for molecular fingerprinting. To date, vibrational spectroscopy has been applied to various kinds of drugs of abuse.6–13 Because these techniques have excellent molecular specificity, they are powerful screening techniques. The obtained information is useful for subsequent detailed instrumental analyses such as chromatography and mass spectrometry.
Surface-enhanced Raman scattering (SERS) is a phenomenon where the intensity of Raman scattering from molecules interacting with local surface plasmon resonance is dramatically enhanced.14 The enhancement factor can be up to 1014 and even Raman scattering signals from single molecules can be detected using this technique.15 This signal enhancement is important from a practical point of view because the weakness of Raman scattering signals is frequently referred to as a significant drawback of Raman spectroscopy. The spectral patterns of SERS and spontaneous Raman scattering are not always consistent with each other.16 However, the molecular specificity of the spectra is retained and SERS spectra can be used for molecular fingerprinting. The high sensitivity and molecular specificity of SERS enable detailed screening of drugs of abuse with their structural information. In practice, SERS has been applied to analyze various kinds of drugs of abuse.17–21 Focusing on the analysis of herbal highs, the ability to quench autofluorescence from the samples provided by the metal surfaces of SERS substrates is another important advantage. Applying SERS to herbal highs will offer the opportunity to obtain detailed vibrational spectra without complicated pre-treatment and autofluorescence.
We previously developed a SERS method for analyzing hypnotics.22 In our experimental scheme, co-aggregation of sample molecules and gold nanoparticles (AuNPs) in a wet system was applied (Fig. 1). This experimental scheme provided stable and reproducible SERS spectra even though measurement instability is frequently referred to as a major drawback of SERS.23
 | ||
| Fig. 1 Schematic of the present SERS experimental system using gold nanoparticle (AuNP) co-aggregation in a wet system. | ||
In this study, we aimed to apply our SERS method to SCs. First, various SC stock solutions were examined to determine the range of application. Then, real samples of herbal highs were analyzed. It will be shown that the developed SERS method could be applied to the analysis of various SCs.
Experimental
Chemicals
SC standards were kept as stock solutions in methanol and stored in a freezer (−20 °C). Crystalline SCs used for Raman microspectroscopy were purchased from Cayman chemicals (Ann Arbor, MI, USA). Methanol was purchased from FUJIFILM Wako Pure Chemical Corporation (Osaka, Japan). Real herbal highs were purchased from the street or through the Internet, and stored in a freezer (−20 °C). The SCs contained in the samples were previously identified in our laboratory.SERS experiment
AuNPs were synthesized following an established method.24,25 The average particle diameter was about 45 nm. Co-aggregation of the sample molecules and the AuNPs was performed as follows: (1) 6 μL of the aggregating agent (1 M sodium chloride solution) was dropped onto a small dish (<1 cm × 1 cm) made of aluminum foil, (2) 6 μL of the sample solution was added, and (3) 48 μL of a AuNP dispersion was added and mixed instantaneously. When the plant samples were measured directly, a piece of plant was placed on a dish before adding the aggregating agent, and 6 μL of water was added instead of the sample solution. After mixing, the samples were analyzed promptly. The instrument was a near-infrared (785 nm) portable Raman spectrometer (C12710, Hamamatsu Photonics, Hamamatsu, Japan). The irradiation power provided by the manufacturer was 50 mW, which corresponded to 6.4 × 10⁴ W cm−2. It should be noted that the actual irradiation power could not be monitored because the instrument was a closed system. The instrument was controlled by C12710 operating software (Hamamatsu Photonics). The exposure time depended on the signal-to-noise ratio. It should be noted that subtraction of the background signals originating from solvents or chemicals used in AuNP synthesis was not performed.Quantitative analysis by gas chromatography
The SCs contained in two real samples (samples B and C) were quantified by gas chromatography. The quantification was performed on an Agilent 6890 gas chromatograph equipped with a flame ionization detector and a 7683 autosampler (Agilent Technologies, Santa Clara, CA, USA). Standard solutions of JWH-210 and AM-2233 were serially diluted to 1, 5, 25 and 50 μg mL−1 in methanol. These solutions were used for calibration. The real samples were weighed and then soaked in methanol with a plant sample/methanol ratio of 10 mg![[thin space (1/6-em)]](https://www.rsc.org/images/entities/char_2009.gif) :1 mL. These solutions were sonicated for 5 min. After benchtop centrifugation, the supernatant was collected and diluted 10 times with methanol. The diluted supernatants were used as sample solutions. For all calibration and sample solutions, JWH-018 (10 μg mL−1) was added as an internal standard. A DB-5 ms column (30 m × 0.25 mm i.d., film thickness 0.25 μm; Agilent J&W, Folsom, CA, UA) was used for separation. The oven temperature was kept at 80 °C for 1 min, and then raised to 320 °C at a rate of 15 °C min−1 and held at this temperature for 19 min. The sample (1 μL) was injected with a split ratio of 1:5. The injection port temperature was 250 °C. Helium was used as a carrier gas at a flow rate of 1 mL min−1. ChemStation software (Agilent Technologies) was used for instrument control and data analysis.
:1 mL. These solutions were sonicated for 5 min. After benchtop centrifugation, the supernatant was collected and diluted 10 times with methanol. The diluted supernatants were used as sample solutions. For all calibration and sample solutions, JWH-018 (10 μg mL−1) was added as an internal standard. A DB-5 ms column (30 m × 0.25 mm i.d., film thickness 0.25 μm; Agilent J&W, Folsom, CA, UA) was used for separation. The oven temperature was kept at 80 °C for 1 min, and then raised to 320 °C at a rate of 15 °C min−1 and held at this temperature for 19 min. The sample (1 μL) was injected with a split ratio of 1:5. The injection port temperature was 250 °C. Helium was used as a carrier gas at a flow rate of 1 mL min−1. ChemStation software (Agilent Technologies) was used for instrument control and data analysis.
Quantitative analysis by SERS
Standard SC solutions (JWH-210 and AM-2233) were serially diluted to 1, 5, 10, 25, and 50 μg mL−1 with methanol. The prepared sample solutions were analyzed following the protocols described in the “SERS experiment” section. In this experiment, the sample solution did not contain the internal standard.Raman microspectroscopy
Raman microspectroscopy was applied to the herbal highs. Measurements were performed using a RAMAN force instrument (Nanophoton, Osaka, Japan). The excitation wavelength was 785 nm and the irradiation power was set between 5 and 20 mW depending on the signal-to-noise ratio. The objective lens was an Olympus (Tokyo, Japan) LCPLN 20XIR with a magnification of 20 times and a numerical aperture of 0.45. To obtain spectra of the standards, each solid SC was placed on a glass slide and covered with a cover slip. To obtain spectra from real herbal high samples, a piece of each plant was placed on a glass slide and covered with a cover slip. Measurements were performed in the XY mapping mode. This instrument was also used to obtain SERS signals for methanol extracts of herbal highs. The experimental protocols were the same as described earlier in the text (“SERS experiment” section), except that the RAMAN force instrument was used in place of the portable Raman spectrometer.Data processing
Spectral analysis was performed using Igor Pro 8 software (WaveMetrics, Lake Oswego, OR, USA). Cosmic ray spikes and noise were removed. After baseline subtraction, all frames were averaged. For Raman microspectroscopy measurements, singular value decomposition analysis was also performed to reduce noises. Quantification of SCs contained in the real herbal high samples was performed using Microsoft Excel 2016 (Redmond, WA, USA). Prediction of the solubility in water was performed using the Chemicalize online platform (ChemAxon, Budapest, Hungary).Results and discussion
SERS measurements of SC standards
Various standard solutions of SCs were analyzed by SERS with a portable Raman spectrometer to confirm the range of application of the present SERS method. Examined SCs are listed in Table 1, and the obtained spectra are presented in Fig. S1.† When obtaining such spectra, care should be taken as to the effect of background signals. We previously found that SERS signals from the target of interest and the background, which likely originated from the solvent and chemicals used for AuNP synthesis, were in competition.22 Thus, background spectra are shown in the figures for comparison with the SERS spectra of the analytes. Various kinds of SCs could be detected by the developed SERS method. It should be noted that although the final samples contained 10% methanol, this was not an issue for the current co-aggregation method. As mentioned in the “Introduction”, many SCs have similar chemical structures. Thus, the discrimination capability of the method is important from a practical point of view. The SERS spectra of JWH-016, JWH-018, and JWH-019 were compared to illustrate the discrimination capability (Fig. 2). JWH-016 and JWH-018 are positional isomers with JWH-016 possessing a 2-methylated indole ring and a shorter methylene chain than JWH-018 (Fig. 2a). Although there are only small structural changes between them, SERS spectra of these two SCs produced different spectral patterns and the SCs could be discriminated (Fig. 2b). By contrast, JWH-018 and JWH-019 had similar SERS spectra, and only subtle differences in the ratio of the 1336 cm−1 and 1367 cm−1 peaks or the presence of a minor peak at around 1270 cm−1 in the JWH-018 spectrum were observed (Fig. 2b). The structural difference between these two SCs is the length of the methylene chain. Therefore, these results show it is difficult to discriminate the length of the methylene chain by the present SERS method. Another example of closely related SCs is JWH-201, JWH-250, and JWH-302 (Fig. 2a). These three SCs are positional isomers with differences in the position of the methoxy group on the benzene ring. The SERS spectra of these SCs were different to each other and discrimination was feasible (Fig. 2c).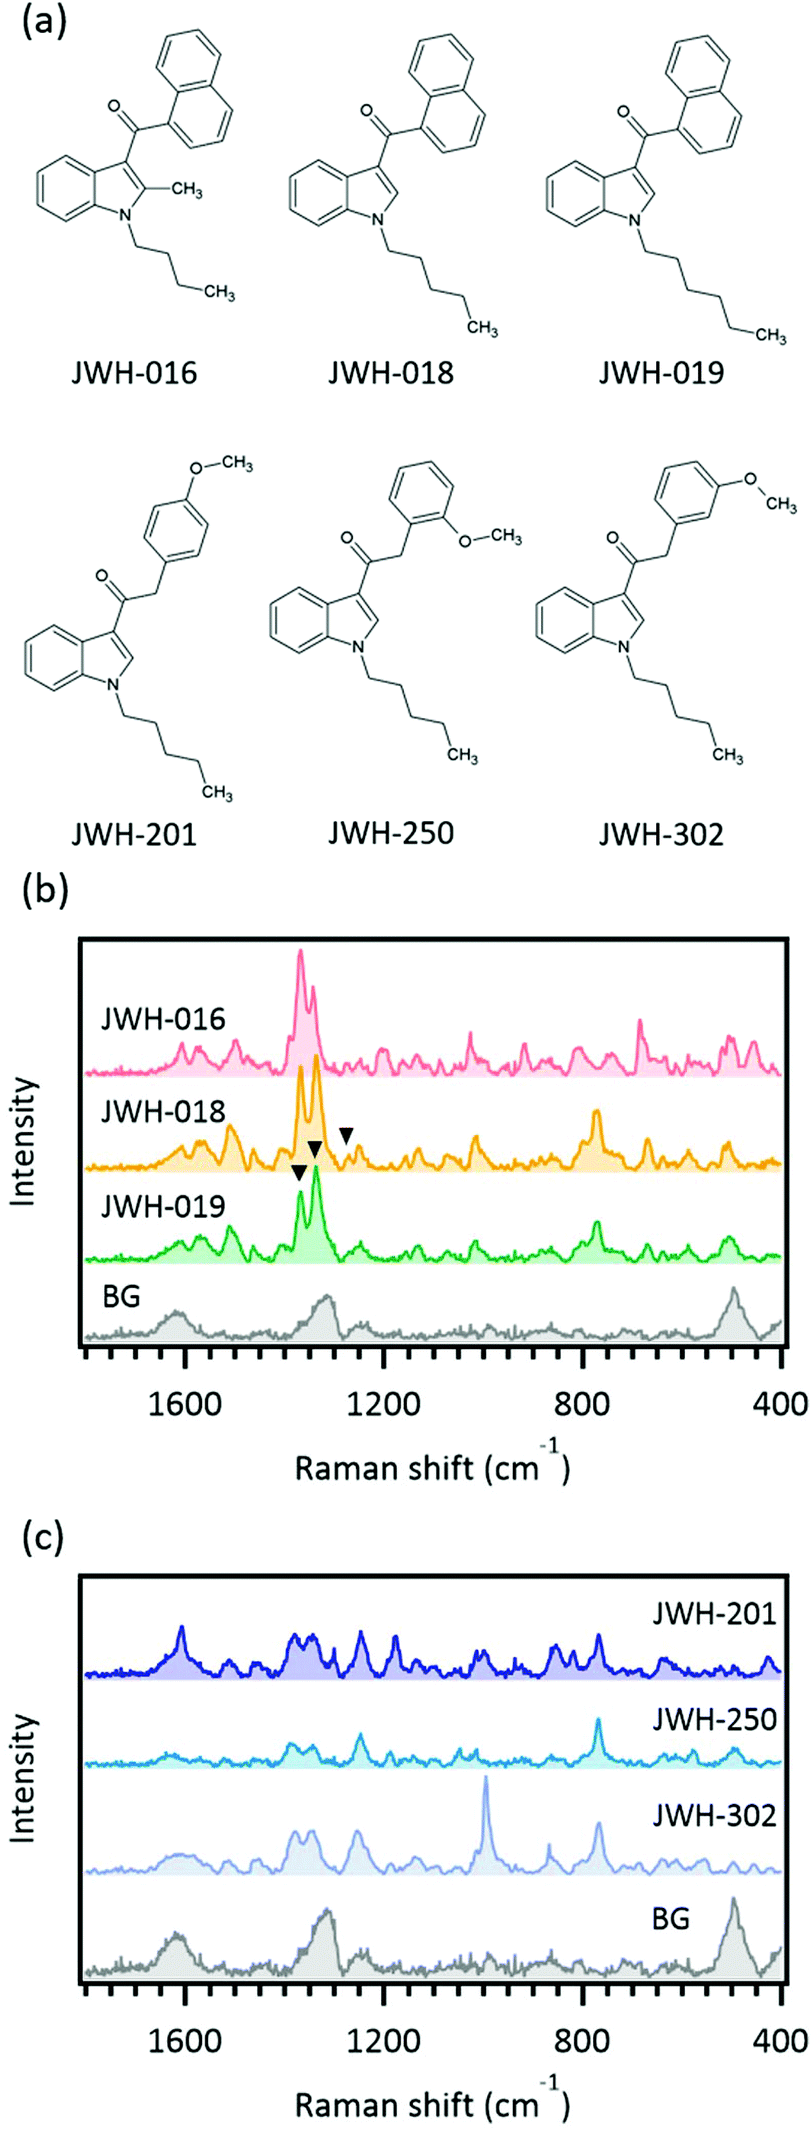 | ||
| Fig. 2 Measurement of the surface-enhanced Raman scattering spectra of standard solutions. (a) Chemical structures of examined synthetic cannabinoids, (b) spectra of methylene positional isomers, and (c) spectra of methoxy positional isomers. BG indicates the background measurement. Exposure was 1 s, 100 frames. Arrow heads indicate the peaks useful for discrimination. | ||
| Compound code or name | Result |
|---|---|
| Symbols: +, detected; and ±, detected but with a low signal-to-noise ratio. | |
| AB-FUBINACA | ± |
| AB-PINACA | ± |
| AM-1220 | + |
| AM-2233 | + |
| Cannabipiperidiethanone | + |
| CB-13 | + |
| 5-Fluoropentyl-3-pyridinoylindole | + |
| JWH-007 | + |
| JWH-016 | + |
| JWH-018 | + |
| JWH-019 | + |
| JWH-081 | + |
| JWH-122 | + |
| JWH-201 | + |
| JWH-210 | + |
| JWH-250 | + |
| JWH-302 | + |
| JWH-122-N-(5-hydroxypentyl) | + |
| NNE1 | + |
| MN-18 | + |
| Org27759 | + |
| Org29647 | + |
| RCS-4 | + |
It should be noted that some SCs did not produce significant SERS signals (Table 1), namely AB-FUBINACA and AB-PINACA. Compared with the other examined SCs, these two SCs have lost a ring (e.g., benzene, naphthalene, or an analog) from their structure. In place of this ring, AB-FUBINACA and AB-PINACA possess amide groups. In a previous study, we found that a benzodiazepine-type molecule with several carbonyl groups located close to each other did not produce a significant SERS signal.22 The AB-FUBINACA and AB-PINACA in the present study had two carbonyl groups at the γ-position. Therefore, the present results are consistent with the previous study.
Overall, these results suggest that the present SERS method has high qualification ability for SCs. However, care should be taken because some structurally similar compounds (e.g., with methylene chain length differences) can produce similar spectra, and some compounds do not give large signals.
Application to real herbal highs
We applied the developed SERS method to some real herbal highs containing SCs. The SCs were previously identified in our laboratory. The samples, components, and results of SERS analysis are summarized in Tables 2 and 3. Even though all SCs contained in the examined real herbal high samples were detected in the standard solutions (Table 1), SERS spectra were only detected for AM-1220 and AM-2233 in the real samples. The SERS spectrum obtained from sample A is shown in Fig. 3. This sample was identified as containing AM-1220 and AM-2233, and its SERS spectrum was well consistent with the summation of the SERS spectra of AM-1220 and AM-2233 standards. Before this measurement, the samples were not pre-treated. These results indicate that the present SERS method is feasible for rapid screening for SCs contained in herbal highs. However, many plant samples containing SCs did not produce significant SERS signals (Table 3), and this narrowed the application range for practical use. Thus, we investigated why SERS signals could not be obtained from the real herbal high samples. We hypothesized that three factors might affect SERS signal detection: (1) the amount of SCs contained in the real sample, (2) the affinity of SC molecules to the AuNP surface, and (3) the method of SC addition to the plant.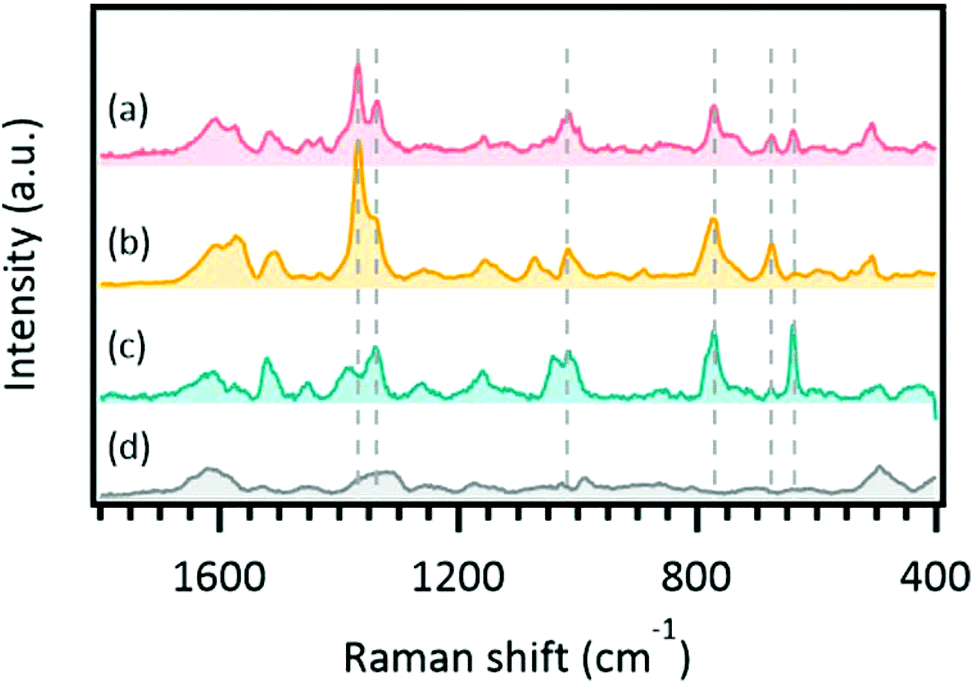 | ||
| Fig. 3 Surface-enhanced Raman scattering spectra of a real herbal high. (a) Spectrum obtained from sample A (Table 2), (b) standard spectrum of AM-1220, (c) standard spectrum of AM-2233, and (d) background spectrum. Dashed lines indicate peaks that coincide in the sample and standard spectra. Exposure was 1 s, 100 frames. | ||
| Sample | SCs contained |
|---|---|
| A | AM-1220, AM-2233 |
| B | AM-2233 |
| C | JWH-210 |
| D | AM-1220, AM-2233 |
| E | AM-1220, APICA |
| F | AM-1220, APICA, APINACA |
| G | APICA |
| H | JWH-081 |
| I | JWH-081 |
| J | JWH-122 |
| AM-1220 | AM-2233 | JWH-081 | JWH-122 | JWH-210 | APICA | APINACA | |
|---|---|---|---|---|---|---|---|
| The results for direct measurements and analysis of methanol extracts are given separately by a slash (i.e., direct measurement result/methanol extract result). Symbols: +, detected; −, not detected; and ±, detected but the spectrum was not a complete match for the standard. | |||||||
| A | +/+ | +/+ | |||||
| B | +/+ | ||||||
| C | −/+ | ||||||
| D | +/+ | −/+ | |||||
| E | ±/+ | −/± | |||||
| F | −/+ | −/± | −/± | ||||
| G | −/± | ||||||
| H | −/+ | ||||||
| I | −/+ | ||||||
| J | −/+ | ||||||
Quantification of SCs in real herbal high samples
When the amounts of SCs contained in plant samples are small, it is reasonable to expect that SERS spectra will not be observed. The SCs contained in sample B (AM-2233) and sample C (JWH-210) (Table 2) were roughly quantified by gas chromatography (Fig. S2†). The coefficient of determination obtained by linear regression was >0.999 for both SCs. The estimated concentrations of the SCs were 5.1 × 101 μg mg−1 for AM-2233 in sample B and 2.6 × 101 μg mg−1 for JWH-210 in sample C. Because the concentrations of these two SCs were on the same order, we speculated that the difference in concentration would not play a significant role in determining whether SERS signals could be observed.Comparison of concentration versus SERS intensity curves
Generally, strong SERS signals are obtained from molecules adsorbed onto the so called “hotspots” of a nanostructure.26 In the present experimental system, the area adjacent to the contact point of AuNPs corresponds to the hotspot because of the existence of a strong electric field coupled with local surface plasmon resonance. In a previous study, we found that adsorption onto hotspots was a competitive process.22 This means that molecules with low affinity to AuNP surfaces will not adsorb to hotspots in the presence of competing substances with higher affinity for AuNPs. The concentration versus SERS intensity curve can be used as a barometer for evaluating the affinity because molecules with high affinity will quickly reach a plateau.The concentration versus SERS intensity curves of AM-2233 and JWH-210 are shown in Fig. 4. These plots clearly showed a plateau under 10 μg mL−1, corresponding to 2.2 × 10⁻⁵ M AM-2233 and 2.7 × 10⁻⁵ M JWH-210, which indicates that these two SC molecules have similar affinities to AuNPs. Therefore, we speculated that a difference in the affinity to AuNPs was not a major factor determining whether SERS signals could be observed. Note that these calibration plots indicated that the present SERS method was not suitable for quantitative analysis. The intensity of signals does not show a linear relationship to the concentration, and saturated in the low concentration range.
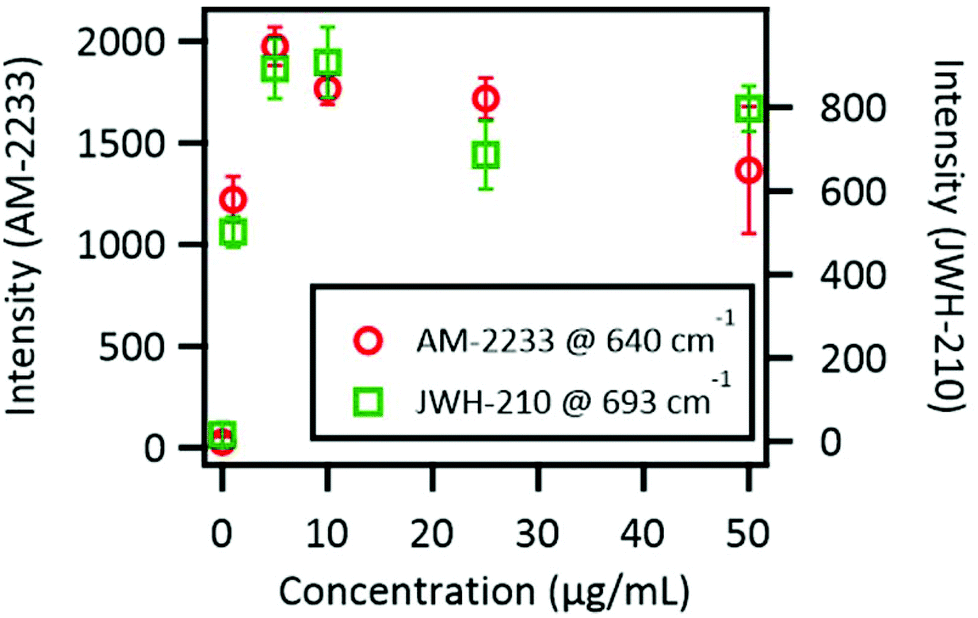 | ||
| Fig. 4 Measurement of dilution series of synthetic cannabinoids. Error bars indicate standard deviation of the peak height within 100 frame measurements. | ||
Observation of SC crystals on plant samples
As mentioned in the “Introduction”, herbal highs are made by adding SCs to plant fragments. It is believed that the SCs are added to plants by either powdering and coating or dissolution and soaking, but the exact production methods of herbal highs in clandestine laboratories remain unclear. When SCs permeated plant bodies, it is reasonable that significant SERS signals are not acquired by direct measurement because the method does not include any extraction steps. To confirm how SCs were added to the samples, Raman microspectroscopy was applied to the plant samples.Although near-infrared excitation (785 nm) was used, strong fluorescence from the plant body was observed and measurement of Raman scattering signals from the crystalline SC was difficult. However, on the periphery of the plant fragments, it was possible to obtain Raman spectra of SCs without severe interference from fluorescence. The Raman spectra obtained from the plant samples and standards, and the corresponding optical images are shown in Fig. 5. The spectrum obtained from the crystalline structure attached onto plant sample B (Table 2) could be ascribed to AM-2233. Similarly, the spectrum obtained from the crystalline structure attached onto plant sample C (Table 2) could be ascribed to JWH-210. These results indicate that the SCs added to real herbal high samples B and C did not permeate plant bodies. Therefore, the detection of a SERS signal from a real herbal high sample was not determined by the way the SC was added to the sample.
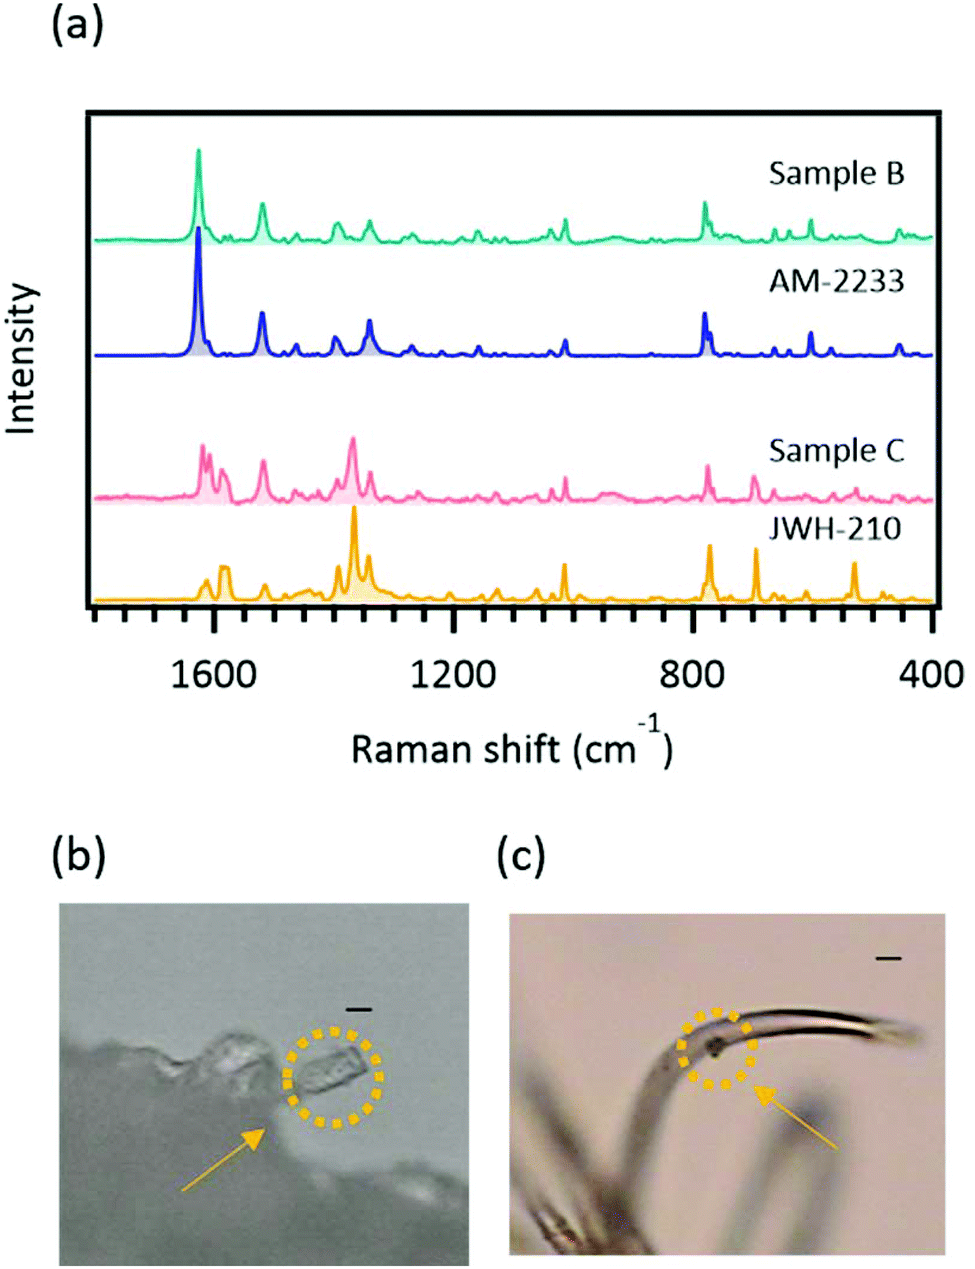 | ||
| Fig. 5 Measurement of spontaneous Raman scattering spectra of crystalline structures located on the surfaces of herbal highs. (a) Raman spectra obtained from herbal highs and standard compounds. (b) Optical image of the crystalline structure found in sample B, and (c) that found in sample C. Yellow arrows and broken circles indicate the positions of the crystalline structures. Black lines correspond to 10 μm. These data were obtained using a Raman microspectrometer. Exposure time was 3 s. | ||
SERS measurement of the methanol extract
For the quantification of the SCs, methanol extracts of the herbal highs were obtained. Interestingly, we could detect SERS signals from the methanol extracts of both sample B and sample C (Fig. 6) but direct analysis of sample C did not produce a significant SERS signal. Consequently, methanol extracts of all samples listed in Table 2 were prepared and measured. The results are summarized in Table 3. All samples examined in this study produced significant SERS signals (Fig. S3†).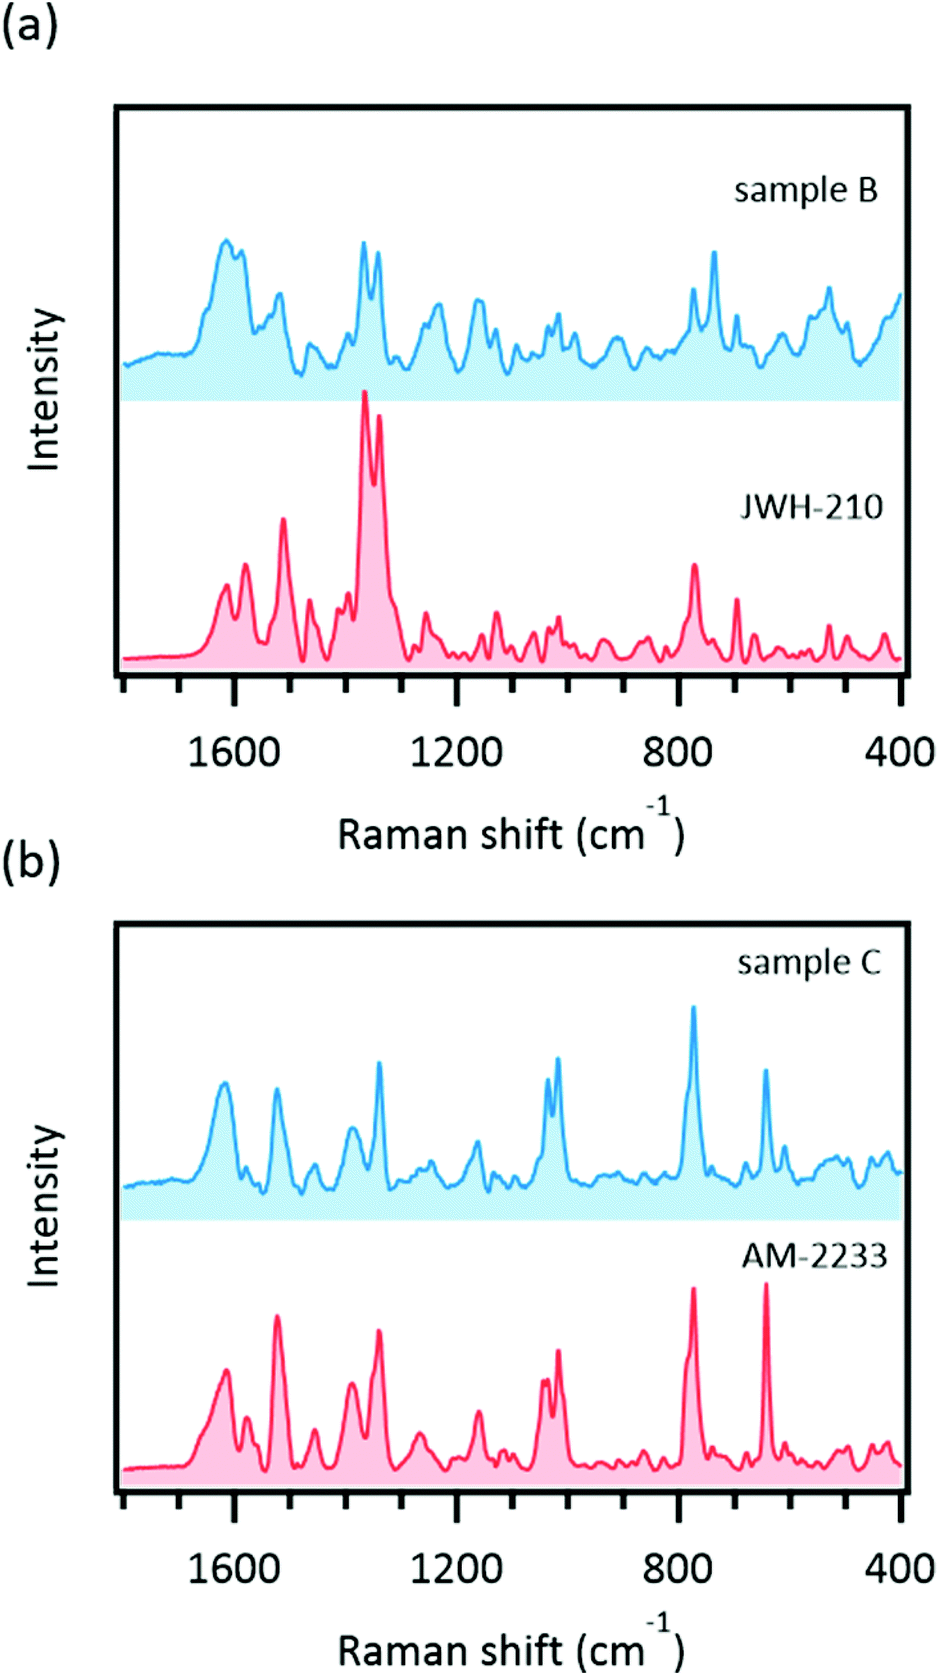 | ||
| Fig. 6 Surface-enhanced Raman scattering spectra of methanol extracts of sample B and sample C (in blue). Corresponding spectra of standard solutions are also shown (in red). These spectra were obtained by using a Raman microspectrometer with 1–5 s exposure time. | ||
The reason for the inconsistency between direct and indirect (methanol extract) analyses should be examined. According to the direct analysis experimental results, we hypothesized that three factors might affect SERS signal detection: (1) the amount of the SC, (2) the affinity of the SC to AuNPs, and (3) the method of SC addition. The preceding results (subsections “Quantification of SCs in real herbal high samples”, “Comparison of concentration versus SERS intensity curves”, and “Observation of SC crystals on plant samples”) indicated that these factors were not essential for SERS signal detection. The direct and indirect experimental procedures differed in how the sample was introduced to the experimental system. For direct analysis, a piece of the plant was soaked in the system, whereas for indirect analysis, a methanol solution of the sample was added to the system. Because the present SERS experimental system was composed of aqueous solutions (AuNP dispersion and sodium chloride solution), the analyte needs to dissolve in water to interact with the AuNPs. As confirmed by earlier results (“Observation of SC crystals on plant samples”), crystalline SC was observed on the plant surface. Thus, sufficient solubility in water might be important for SERS signal detection by direct analysis.
We checked the solubility differences of SC molecules examined in this study using Chemicalize. This online platform enables empirical prediction of physicochemical properties from the chemical structure. The results of the calculation are summarized as logS values in Table 4. LogS is the base 10 logarithm of the water solubility expressed in mol L−1. A higher logS indicates that a molecule has higher water solubility (e.g., the logS of methanol is 1.11 and that of hexane is −2.95). Interestingly, logS values of AM-1220 and AM-2233 were relatively high compared with those of the other examined SCs (Table 4). For AM-2233, a logS of −3.00 corresponded to about 4.6 × 10² μg mL−1 (1.0 × 10⁻³ M). This concentration should be sufficient to detect SERS signals as shown in the concentration versus SERS intensity curve (Fig. 4). By contrast, the logS for JWH-210 (−8.26) corresponds to about 2.0 ng mL−1 (5.5 × 10⁻⁹ M). Taking into consideration this water solubility difference, it is reasonable that only AM-1220 and AM-2233 produced significant SERS signals in the direct analysis (Table 3).
S values predicted by the Chemicalize platform for the examined synthetic cannabinoids at pH 7.4
| Name | LogS |
|---|---|
| AM-1220 | −4.05 |
| AM-2233 | −3.00 |
| JWH-081 | −7.24 |
| JWH-122 | −7.77 |
| JWH-210 | −8.26 |
| APICA | −6.18 |
| APINACA | −6.28 |
The presence of methanol would dramatically change the solute–solvent interaction. In the indirect analysis, methanol (10%) is present in the final sample for measurement. We speculate that this methanol helps solvate SC molecules in the experimental system and they can then reach the hotspots on the AuNP aggregates. Consequently, even the SERS signal of JWH-210, which had low water solubility, in sample C could be detected by indirect analysis. We noted that the methanol extracts had a greenish tint originating from components in the plant body. However, no significant interference from fluorescence was observed. We consider that this was because of quenching of fluorescence by the interaction of the fluorophore and AuNPs. This indicates that SERS is a powerful screening technique that enables highly sensitive vibrational spectroscopy with decreased fluorescence.
Conclusions
In this study, we aimed to extend the range of application of a previously reported SERS method for the rapid detection of SCs. For a standard solution measurement, the SERS method using AuNP co-aggregation in a wet system produced significant SERS signals from various SC molecules. By contrast, direct analysis did not produce sufficient SERS signals for street samples of plants containing SCs, the so-called herbal highs. We hypothesized that this might be caused by (1) the amount of SC contained in the plant sample, (2) the affinity of the SC to AuNPs, and (3) the method of SC addition to the plant. However, the experimental results did not support this hypothesis, and another reason was necessary to explain our observations. Interestingly, we found that methanol extracts of real herbal highs produced significant SERS signals even if the sample did not show any signal by direct analysis. This result indicated that solubility in water might be a major factor determining signal detection by direct analysis. In fact, only plant samples containing SC molecules with higher predicted water solubilities provided significant SERS signals by direct analysis. For methanol extracts, the final solvent composition of the experimental system was 9:1 (by volume) for water/methanol. We speculated that this 10% methanol could facilitate solvation of the SC molecules and their interaction with AuNP aggregates. Thus, simple pre-treatment by methanol extraction will enable application of the present SERS method to various street samples containing SCs. This result indicates that sufficient sensitivity is achieved with the present experimental protocol from a practical point of view.
Some caution should be taken when determining the presence of SCs using the developed method. First, assignment of a SERS spectrum to a particular SC molecule requires great care. As mentioned in the “SERS measurements of SC standards” section, many SCs have similar chemical structures and will produce similar SERS spectra. Therefore, a sophisticated discrimination method is required to facilitate identification of the SC. We are now measuring SERS spectra of various SCs to establish a spectral library. This will aid the application of statistical and chemometric approaches for spectral assignment. Second, the detection of several SCs simultaneously might be difficult with the present system. In this study, some samples previously identified as containing more than two SCs were analyzed by the developed SERS method (Table 3). However, the obtained SERS spectra were not always consistent with the sum of the spectra of the previously identified SCs. For example, sample F was identified as containing AM-1220, APINACA, and APICA. In the SERS spectrum of sample F, we could easily identify the characteristic spectral pattern of AM-1220 but it was difficult to find those of APINACA and APICA (Fig. S3†). In a previous study, we found that the adsorption of analyte molecules onto the hotspots of AuNP aggregates was a competitive process. This means that it might be difficult to obtain SERS spectra from several kinds of analyte molecules simultaneously if the molecules have large differences in their affinities to AuNPs. Therefore, it should be noted that the detection of a particular SC by the developed method does not exclude the possibility of the presence of other SCs in a sample. A combination of the present SERS method with a sophisticated data processing method and careful interpretation of the spectra will allow for simple and rapid screening of SCs contained in herbal highs.
Conflicts of interest
There are no conflicts to declare.Acknowledgements
The authors thank Hamamatsu Photonics (Hamamatsu, Japan) for the use of a portable Raman spectrometer. This work was supported by the Japan Society for the Promotion of Science KAKENHI Grant-in Aid for Young Scientists (B) (Grant Number JP17K12994). We thank Gabrielle David, PhD, from Edanz Group (http://www.edanzediting.com/ac) for editing a draft of this manuscript.References
- S. D. Brandt, L. A. King and M. Evans-Brown, Drug Test. Anal., 2014, 6, 587–597 CrossRef CAS PubMed.
- UNODC, World Drug Report 2018, 2018 Search PubMed.
- D. Favretto, J. P. Pascali and F. Tagliaro, J. Chromatogr. A, 2013, 1287, 84–95 CrossRef CAS PubMed.
- L. A. King and A. T. Kicman, Drug Test. Anal., 2011, 3, 401–403 CrossRef CAS PubMed.
- S. Hudson and J. Ramsey, Drug Test. Anal., 2011, 3, 466–478 CrossRef CAS PubMed.
- L. E. Jones, A. Stewart, K. L. Peters, M. McNaul, S. J. Speers, N. C. Fletcher and S. E. J. Bell, Analyst, 2016, 141, 902–909 RSC.
- J. S. Triplett, J. A. Hatfield, T. L. Kaeff, C. R. Ramsey, S. D. Robinson and A. F. Standifer, J. Forensic Sci., 2013, 58, 1607–1614 CrossRef CAS PubMed.
- R. Christie, E. Horan, J. Fox, C. O'Donnell, H. J. Byrne, S. McDermott, J. Power and P. Kavanagh, Drug Test. Anal., 2014, 6, 651–657 CrossRef CAS PubMed.
- K. Tsujikawa, T. Yamamuro, K. Kuwayama, T. Kanamori, Y. T. Iwata, K. Miyamoto, F. Kasuya and H. Inoue, Forensic Sci. Int., 2014, 242, 162–171 CrossRef CAS PubMed.
- K. M. C. Hans, S. Müller and M. W. Sigrist, Drug Test. Anal., 2012, 4, 420–429 CrossRef CAS PubMed.
- S. P. Stewart, S. E. J. Bell, N. C. Fletcher, S. Bouazzaoui, Y. C. Ho, S. J. Speers and K. L. Peters, Anal. Chim. Acta, 2012, 711, 1–6 CrossRef CAS PubMed.
- C. A. F. de Oliveira Penido, M. T. T. Pacheco, I. K. Lednev and L. Silveira, J. Raman Spectrosc., 2016, 47, 28–38 CrossRef.
- K. Tsujikawa, K. Kuwayama, H. Miyaguchi, T. Kanamori, Y. T. Iwata, T. Yoshida and H. Inoue, Anal. Chim. Acta, 2008, 608, 95–103 CrossRef CAS PubMed.
- T. Itoh, Y. S. Yamamoto and Y. Ozaki, Chem. Soc. Rev., 2017, 46, 3904–3921 RSC.
- K. Kneipp, Y. Wang, H. Kneipp, L. T. Perelman, I. Itzkan, R. R. Dasari and M. S. Feld, Phys. Rev. Lett., 1997, 78, 1667–1670 CrossRef CAS.
- Y. S. Yamamoto and T. Itoh, J. Raman Spectrosc., 2016, 47, 78–88 CrossRef CAS.
- Z. Han, H. Liu, J. Meng, L. Yang, J. Liu and J. Liu, Anal. Chem., 2015, 87, 9500–9506 CrossRef CAS PubMed.
- K. Dana, C. Shende, H. Huang and S. Farquharson, J. Anal. Bioanal. Tech., 2015, 6, 1–5 Search PubMed.
- F. Inscore, C. Shende, A. Sengupta, H. Huang and S. Farquharson, Appl. Spectrosc., 2011, 65, 1004–1008 CrossRef CAS PubMed.
- R. Dong, S. Weng, L. Yang and J. Liu, Anal. Chem., 2015, 87, 2937–2944 CrossRef CAS PubMed.
- S. Mabbott, O. Alharbi, K. Groves and R. Goodacre, Analyst, 2015, 140, 4399–4406 RSC.
- H. Segawa, T. Fukuoka, T. Itoh, Y. Imai, Y. T. Iwata, T. Yamamuro, K. Kuwayama, K. Tsujikawa, T. Kanamori and H. Inoue, Analyst, 2019, 144, 2158–2165 RSC.
- C. Muehlethaler, M. Leona and J. R. Lombardi, Forensic Sci. Int., 2016, 268, 1–13 CrossRef CAS PubMed.
- P. C. Lee and D. Meisel, J. Phys. Chem., 1982, 86, 3391–3395 CrossRef CAS.
- G. Frens, Nature, Phys. Sci., 1973, 241, 20–22 CrossRef CAS.
- T. Itoh and Y. S. Yamamoto, Analyst, 2016, 141, 5000–5009 RSC.
Footnote |
| † Electronic supplementary information (ESI) available: Additional experimental figures including spectra of the SCs and methanol extracts. See DOI: 10.1039/c9an01512d |
| This journal is © The Royal Society of Chemistry 2019 |