
 Open Access Article
 This Open Access Article is licensed under a
 Creative Commons Attribution 3.0 Unported Licence
Near-infrared fluorescent aza-BODIPY dyes for sensing and imaging of pH from the neutral to highly alkaline range†
Christoph
Staudinger
,
Johanna
Breininger
,
Ingo
Klimant
and
Sergey M.
Borisov
 *
*
Institute of Analytical Chemistry and Food Chemistry, Graz University of Technology, Stremayrgasse 9, 8010, Graz, Austria. E-mail: sergey.borisov@tugraz.at
First published on 8th February 2019
Abstract
New aza-BODIPY pH indicators with spectral properties modulated solely by photoinduced electron transfer (PET) are presented. The pH sensitive hydroxyl group is located in the meta-position of a phenyl substituent with respect to the aza-BODIPY core, which eliminates the conjugation to the chromophore. The new dyes show reversible “on”–“off” fluorescence response upon deprotonation of the receptor but no changes in the absorption spectrum, which is in contrast to state-of-the-art indicators of the aza-BODIPY family. This eliminates potential changes in the efficiency of the inner filter effect and Förster resonance energy transfer (FRET) and makes the new dyes suitable acceptors in light harvesting systems used for ratiometric pH imaging. The introduction of electron-withdrawing or electron-donating groups into the receptor results in a set of indicators suitable for measurements from physiological (pH 7) to very alkaline (pH 13) conditions. The new sensors are particularly promising for monitoring of pH changes in concrete, as was recently shown elsewhere.
1. Introduction
pH is one of the most important parameters in many applications1 (e.g. chemical industry, biotechnology2 and seawater measurements3,4). Although the pH electrode remains the most commonly used measurement device, optical pH sensor materials have been receiving increasing attention in the last few years. They can be deployed as inexpensive single-use sensors,2 can be read out remotely with optical fibers, they are not influenced by electromagnetic interferences and can be manufactured in a wide variety of formats. For instance, optical pH sensors are available as larger sensor films for imaging,5–7 as small spots integrated in microfluidic devices8–12 or in microtiter plates,13 on tapered fibers with only 8–140 μm tip diameter14,15 or in the form of nanoparticles.16,17Materials utilized for optical pH sensing include fluorescent indicators belonging to different chromophore classes (fluoresceins,18 rhodamines,19,20 perylenes,21,22 1,4-diketopyrrolo-pyrroles,23 HPTS,24,25 BODIPYs26–30 and aza-BODIPYs).3,29,31–35 Most of these dyes respond to pH changes in the near neutral and acidic ranges, enabling numerous applications in biology, medicine, environmental monitoring and biotechnology. In contrast, fluorescent indicators responding under alkaline conditions are comparably rare.22,36–38 Notably, sensing in the alkaline range is of primary interest in such fields as the paper industry, waste water treatment, leather processing, and metal mining and finishing, and during microbial production involving alkaliphiles.37 It is also of utmost importance for corrosion prediction and detection in steel-reinforced concrete structures, since the lifetime of these materials strongly depends on the internal pH. Whereas the pH values in concrete typically vary from 12.5 to 13.5 in the initial period, the medium becomes less alkaline with time but should stay above 10 to enable passivation of the steel components.38 Here durable and low-cost materials for pH sensing are of the highest interest.39,40
Reported fluorescent sensors for the alkaline range possess several limitations such as comparably short absorption and emission wavelengths in the case of coumarin38 and BODIPY36,37 chromophores and high hydrophobicity in the case of perylene dyes.22 Tetraaryl-aza-BODIPYs represent a particularly interesting class of fluorescent dyes showing absorption and emission in the red/NIR part of the spectrum, high molar absorption coefficients and extreme photostability.3,31 The applications of these dyes go well beyond classical sensing and imaging34,41,42 and include photothermal43 and photodynamic44 tumor therapy, photoacoustic imaging45–47 and energy conversion.48,49 With respect to optical pH sensing, aza-BODIPYs based on aromatic amines responding to pH under acidic conditions33 and those based on substituted phenols with a broader range of available pKa values31 have been reported. Importantly, deprotonation of the phenol receptor (or the amine) in the para-position with respect to the aza-BODIPY core not only results in fluorescence quenching due to acceptor-excited photoinduced electron transfer (PET)50 but also it is accompanied by a strong bathochromic shift of the absorption spectrum indicating additional intramolecular charge transfer (ICT) mechanisms.3 Although such behavior is usually not critical for most applications, it definitely results in a more complex sensor behavior. First, the pH dependent absorption of the indicators affects the magnitude of the inner filter effect which depends on the dye concentration and the thickness of the sensor foil. Second, in a multi-component system (consisting, e.g., of a pH indicator and a reference dye), both luminescence enhancement of the second component (due to lower absorption of the indicator at the excitation wavelength) and luminescence quenching (due to the inner-filter effect caused by the deprotonated form of the indicator) are possible. Third, since the absorption spectrum of the non-emissive deprotonated form of the indicator shows very good overlap with the emission spectrum of the protonated form and the concentration of the indicator in the sensor is fairly high (1–5 mM), quenching via Förster resonance energy transfer (FRET) is favored. Evidently, purely PET-based dyes make it possible to overcome the above limitations. Moreover, they would be attractive for application in light-harvesting systems for overcoming the limitation of the small Stokes shifts, typical of fluorescent dyes. For the latter, excitation at the maximum of the absorption band is virtually impossible since the excitation and emission light cannot be fully separated. In the light-harvesting system, excitation is performed at the absorption maximum of the energy donor with subsequent energy transfer to the acceptor. This allows the utilization of the high molar absorption coefficients of the donor and results in large effective Stokes shifts. The enhancement of the sensor brightness allows the production of thinner sensing layers with faster response times.
Herein we present 5 new aza-BODIPY pH indicator dyes which are decorated with a hydroxyl group in the meta-position of an aryl substituent. This receptor group is responsible for fluorescence quenching via the PET effect but neither induces the pH dependency of the absorption spectra nor negatively affects the fluorescence quantum yields. Due to electronic separation of the OH group from the electron-withdrawing core, the new dyes feature significantly higher pKa values compared to the state-of-the-art aza-BODIPY indicators and cover the pH range from ∼7 to 13. One of the indicators almost ideally matches the physiologically relevant conditions and the pH of seawater, whereas the other representatives are attractive for monitoring pH in concrete39,40,51 and studies of alkaliphilic bacteria.52
2. Experimental
2.1 Materials
4′-Butoxyactophenone, 3-hydroxybenzaldehyde, 4′-methoxyacetophenone, diisopropylethylamine (DIPEA), benzaldehyde, 3-hydroxy-4-methoxybenzaldehyde, and boron trifluoride diethyl etherate were purchased from TCI Europe (http://www.tcichemicals.com). 4′-Hydroxychalcone and 4-methoxybenzaldehyde were bought from ABCR (http://www.abcr.de). 2,4-Dichloro-3-hydroxybenzaldehyde and 2,6-difluoro-3-hydroxybenzaldehyde were obtained from Fluorochem (http://www.fluorochem.co.uk). 2-Chloro-3-hydroxybenzaldehyde, nitromethane, ammonium acetate, potassium carbonate, trifluoroacetic acid and anhydrous sodium sulfate were purchased from Sigma Aldrich (http://www.sigmaaldrich.com). Deuterated chloroform (CDCl3) was obtained from Euriso-top (http://www.eurisotop.com). All other solvents (reagent grade for synthesis, and analytical grade for spectroscopic measurements): tetrahydrofuran (THF), ethanol (EtOH) and cyclohexane (CH) as well as sodium chloride, potassium persulfate and the buffer salts (tris(hydroxymethyl)aminomethane (TRIS), bis(2-hydroxyethyl)amino-tris(hydroxymethyl)methane (BIS-TRIS), 2-morpholin-4-ylethanesulfonic acid (MES), 2-(cyclohexylamino)ethanesulfonic acid (CHES), 3-(cyclohexylamino)-1-propanesulfonic acid (CAPS) and sodium dihydrogen phosphate were purchased from Carl Roth (http://www.roth.de). Silica-gel (0.04–0.063 mm) and aluminium oxide were bought from Acros (http://www.fishersci.com). Polyurethane hydrogel (Hydromed D4) was purchased from AdvanSource Biomaterials (http://www.advbiomaterials.com). The poly(ethylene glycol terephthalate) (PET) support was from Pütz (http://www.puetz-folien.com). 5,5-Difluoro-1,3,7,9-tetraphenyl-5H-4λ4,5λ4-dipyrrolo[1,2-c:2′,1′-f][1,3,5,2]triazaborinine (tetraphenyl aza-BODIPY), 4-(5,5-difluoro-7-(4-hydroxyphenyl)-1,9-diphenyl-5H-4λ4,5λ4-dipyrrolo[1,2-c:2′,1′-f][1,3,5,2]triazaborinin-3-yl)-N-dodecylbenzamide (hydroxy dodecylamide aza-BODIPY), 3,7-bis(4-butoxyphenyl)-5,5-difluoro-1,9-diphenyl-5H-4λ4,5λ4-dipyrrolo[1,2-c:2′,1′-f][1,3,5,2]triazaborinine (dibutoxy aza-BODIPY) and 1-(4-butoxyphenyl)-4-nitro-3-phenylbutan-1-one (d3) were prepared according to the literature procedures.32.2 Methods
Buffers with concentrations of 100 mM and pH values ranging from 5 to 13 were prepared using piperazine, MES, bis-TRIS, TRIS, CHES or CAPS. The pH, adjusted by adding 1 M HCl or 1 M NaOH aqueous solution, was controlled using a SevenEasy™ pH meter (Mettler Toledo, http://www.mt.com) equipped with a glass electrode (SenTix® HW, WTW, http://www.wtw.com). The pH meter was calibrated using standard buffer solutions with pH values of 4.01, 7.01 and 10.01 (Hanna Instruments, http://www.hannainstruments.at). The ionic strength of the buffers was set to 100 mM with NaCl as the background electrolyte. The NMR spectra were recorded on a 300 MHz instrument (Bruker) in CDCl3 with tetramethylsilane (TMS) as a standard. MALDI-TOF mass spectra were recorded on a Micromass TofSpec 2E instrument in the reflectron mode at an accelerating voltage of +20 kV.Absorption measurements were performed using a Cary 50 UV-VIS spectrophotometer from Varian, Palo Alto, USA (http://www.varianinc.com). Emission and excitation spectra were recorded on a Fluorolog® 3 Spectrofluorometer from Horiba Scientific (http://www.horiba.com) equipped with an R2658 photomultiplier tube from Hamamatsu (http://www.hamamatsu.com) or on an F-7000 fluorescence spectrophotometer from Hitachi (http://www.hitachi-hightech.com). 100-OS precision cuvettes from Hellma Analytics with a light path of 10 mm were used (http://www.hellma-analytics.com). The fluorescence quantum yields were determined relative to dibutoxy aza-BODIPY dye (Φ = 36% in chloroform).53
The pH sensing behavior of the dyes was investigated by diluting a THF stock solution (0.5 mg mL−1) with EtOH and subsequently mixing the resulting solution with a buffer in a ratio of 1![[thin space (1/6-em)]](https://www.rsc.org/images/entities/char_2009.gif) :1. The concentration of the dyes in the final solution was ∼1.5 × 10⁻⁶ M. The pH response of the dyes physically entrapped in hydrogel D4 was investigated in glass cuvettes (1 cm path length) with the foils positioned diagonally. The cuvettes were filled with buffers and washed with water after each pH buffer change.
:1. The concentration of the dyes in the final solution was ∼1.5 × 10⁻⁶ M. The pH response of the dyes physically entrapped in hydrogel D4 was investigated in glass cuvettes (1 cm path length) with the foils positioned diagonally. The cuvettes were filled with buffers and washed with water after each pH buffer change.
The pH sensors utilizing the Dual Lifetime Referencing (DLR) technique were read out using a Firesting compact phase fluorometer from Pyroscience GmbH (http://www.pyroscience.com) and the measurement set-up described previously.54 The planar foils were cut into circles and mounted on the distal end of a 1 m plastic optical fiber (Ratioplast, http://www.ratioplast.com) with the help of a home-made adaptor. The modulation frequency, LED intensity and integration time were set at 3 kHz, 80% and 16 ms, respectively. The sensors were submerged in a buffer containing 10 mM phosphate and 2 mM borate with an ionic strength of approximately 150 mM (adjusted by the addition of sodium chloride). The pH of the solution was adjusted between 5 and 12 (with steps of 0.4 pH units) by the addition of hydrochloric acid and sodium hydroxide (both 300 mM).
The imaging experiments were conducted using an AD-130GE RGB + NIR camera from JAI (http://www.jai.com). A high power yellow LED array with 12 LEDs (“12× OSRAM Oslon SSL 80 gelb Rund-Platine”) with a passive cooler and a lens array with an emission angle of 30° (all obtained from LED-Tech.de Optoelectronics (http://www.led-tech.de)) was used as the excitation source. A combination of emission filters (a foil filter (“026 bright red”) from LEE filters (http://www.leefilters.com) and an RG640 glass filter from Hoya (http://www.hoyafilter.com)) was mounted in front of the camera lens. The sensor material was glued to the bottom of a plastic Petri dish and submerged in the buffers during the measurements. The measurement times were 2000 ms and 600 ms for the RGB and NIR channels, respectively. The images were recorded with 12 bit color depth per channel.
Calibration curves and apparent pKa values were obtained by fitting the plot of fluorescence intensity vs. pH with the Boltzmann sigmoid:
 | (1) |
2.3 Sensor foil preparation
Sensor foils were prepared via knife-coating the “cocktail” containing Hydromed D4 (10 wt% with respect to the solvent) and dye (0.2 wt% with respect to the polymer) in THF on the PET support. Spacers of 1 Mil (25 μm) or 3 Mil (76 μm) were used, resulting in ∼3 and 8 μm thick sensing layers after solvent evaporation. DLR referenced sensors were prepared by additionally adding microcrystalline powder of Egyptian blue55 (40 wt% with respect to the hydrogel).2.4 Synthesis
The synthetic procedures for the intermediates and NMR and MS spectra of the indicators can be found in the ESI (Fig. S6–S18†).:CH 3:1), the solution was partitioned between DCM and aqueous NaHCO3 solution (3 × 25 mL) and dried over sodium sulfate. The solvent was removed under reduced pressure. The crude product was purified by column chromatography (silica-gel, DCM:CH 3:1, detection by TLC with DCM:CH 3:1 and UV/VIS spectroscopy) and recrystallization from MeOH to yield red-purple crystals.
Yield: 26.1 mg (55%).
MS (MALDI): 729.3868 (calculated: 729.3557).
1H NMR (300 MHz, chloroform-d): δ = 8.04 (t, J = 7.9 Hz, 6H), 7.61 (s, 1H), 7.50 (d, J = 7.5 Hz, 1H), 7.30 (d, J = 7.8 Hz, 1H), 7.06–6.90 (m, J = 8.0 Hz, 8H), 6.86 (d, J = 7.4 Hz, 1H), 5.06 (s, 1H), 4.13–3.90 (m, 6H), 1.88–1.70 (m, 6H), 1.51 (dd, J = 14.9, 7.4 Hz, 6H), 0.99 (t, J = 7.3 Hz, 9H).
13C APT NMR (76 MHz, chloroform-d): δ = 161.83, 161.44, 160.73, 159.26, 156.72, 155.91, 145.83, 144.78, 143.58, 141.34, 134.28, 131.83, 131.54, 131.01, 129.76, 125.12, 124.23, 123.94, 121.49, 118.24, 117.44, 116.42, 116.01, 114.83, 77.16, 67.97, 31.35, 19.38, 13.98.
Yield: 25.8 mg (39%), red crystals.
MS (MALDI): 763.2911 (calculated: 763.3168).
1H NMR (300 MHz, chloroform-d): δ = 8.19–7.98 (m, J = 18.0, 8.9 Hz, 6H), 7.39–7.28 (m, J = 13.0, 6.9 Hz, 2H), 7.17–7.07 (m, 2H), 7.05–6.93 (m, 5H), 6.87 (d, J = 8.7 Hz, 2H), 5.84 (s, 1H), 4.03 (dt, J = 12.5, 6.3 Hz, 6H), 1.88–1.71 (m, J = 7.8, 5.7 Hz, 6H), 1.57–1.47 (m, J = 15.0, 7.5 Hz, 6H), 1.00 (t, J = 7.3 Hz, 9H).
13C APT NMR (76 MHz, chloroform-d): δ = 162.06, 161.42, 160.80, 160.40, 155.51, 152.15, 146.41, 144.96, 144.00, 138.75, 132.20, 131.97, 131.60, 130.85, 127.23, 125.77, 124.80, 124.27, 123.82, 121.77, 119.60, 117.60, 116.11, 114.84, 77.16, 67.96, 31.37, 19.38, 13.97.
Yield: 41.3 mg (63%), green crystals.
MS (MALDI): 671.1675 (calculated: 671.1368).
1H NMR (300 MHz, chloroform-d): δ = 8.20–7.95 (m, 6H), 7.35 (d, J = 5.7 Hz, 2H), 7.15 (s, 1H), 7.08–6.97 (m, J = 10.8, 4.0 Hz, 5H), 6.91 (d, J = 8.4 Hz, 2H), 3.89 (d, J = 3.2 Hz, 9H).
Yield: 36.9 mg (53%), purple metallic crystals.
MS (MALDI): 639.1469 (calculated: 639.1959).
1H NMR (300 MHz, chloroform-d): δ = 8.16–7.97 (m, 6H), 7.09–6.82 (m, 10H), 3.96–3.78 (m, 9H).
13C APT NMR (76 MHz, chloroform-d): δ = 162.56, 161.68, 161.44, 161.30, 155.61, 152.16, 149.69, 146.58, 146.40, 144.55, 140.68, 140.43, 132.10, 131.49, 130.89, 130.10, 124.98, 124.53, 123.97, 122.12, 118.02, 117.13, 117.01, 114.48, 114.37, 114.26, 111.47, 111.15, 77.16, 55.54.
Yield: 66.4 mg (98%), purple metallic crystals.
MS (MALDI): 645.2808 (calculated: 645.2617).
1H NMR (300 MHz, chloroform-d): δ = 8.17–8.00 (m, J = 8.6, 3.5 Hz, 6H), 7.79 (d, J = 1.8 Hz, 1H), 7.64 (dd, J = 8.4, 1.7 Hz, 1H), 7.49 (t, J = 7.3 Hz, 2H), 7.42 (d, J = 7.0 Hz, 1H), 7.07–6.87 (m, 7H), 5.64 (s, 1H), 4.05 (t, J = 6.4 Hz, 2H), 3.97 (s, 3H), 3.89 (s, 3H), 1.86–1.74 (m, J = 14.5, 6.6 Hz, 2H), 1.56 (s, 2H), 0.99 (t, J = 7.3 Hz, 3H).
3. Results and discussion
3.1 Synthesis
The synthesis of indicators 1–5 was conducted based on the well-known route via nitro-chalkones (Fig. 1).56 Here, two different nitro-chalkones (bx and dx) are reacted to give the unsymmetrical product (ex) along with two symmetrical derivatives bearing no and two pH sensing functionalities, respectively. Partly due to this reason and partly because crude nitro-chalkones were used, the yield of the aimed product in the condensation reaction is typically low (5–10%). Nevertheless, it is still acceptable since both chalkones and nitrochalkones can be prepared on a large scale from inexpensive chemicals. The ligand ex is converted to the corresponding BF2 chelate (indicator x) with a good yield (40–90%). The introduction of substituents into all phenyl rings improved the solubility of the dyes and simplified the chromatographic separation.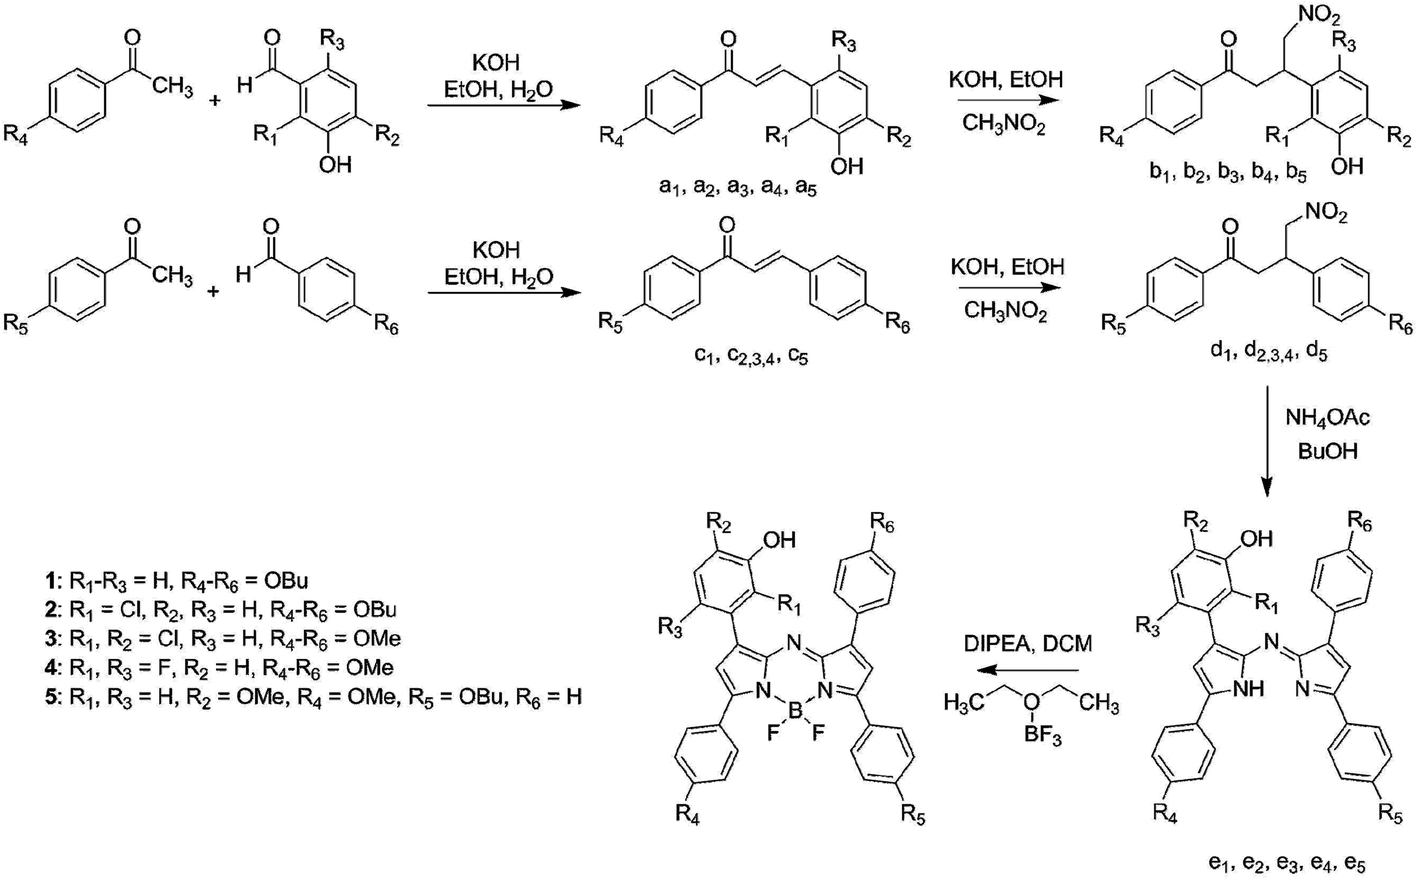 | ||
| Fig. 1 Synthetic route to the new aza-BODIPY dyes. Intermediates with indices belong to the respective dye. | ||
3.2 Photophysical properties of the indicators
The spectral properties of the new dyes are almost identical (Table 1, Fig. S1 of the ESI†) and are very similar to those of the reported representatives of the aza-BODIPY family (Fig. 2). The dyes show the absorption and emission maximum in the NIR part of the spectrum. The molar absorption coefficients are around 80000 L mol−1 cm−1, a typical value for this dye class. The fluorescence quantum yield is about 25%, except for indicator 5 whose Φ is ∼2-fold lower. Fluorescence decay times show the same trend with values of ∼2.6 ns for indicators 1–4 and only ∼1.5 ns for indicator 5. The most important structural difference between indicators 1–4 and indicator 5 is the methoxy group in the o-position to the hydroxyl group. This provides the possibility of hydrogen bonding between these two groups and might cause a reduction in quantum yield and fluorescence lifetime. The brightness of the dyes is therefore significantly higher than that of the previously reported purely PET-based aza-BODIPY dye with a meta-hydroxyl group in the “lower” phenyl ring (Φ of 10%).3
 | ||
| Fig. 2 pH dependence of absorption (solid lines) and emission spectra (dashed lines) of indicator 3 (a) and the state-of-the-art hydroxy-aza-BODIPY pH indicator31 (c) in hydrogel D4; (b) and (d) show the pH equilibria for the respective dyes. | ||
| Compound | λ abs, nm | λ em, nm | ε, M−1 cm−1 | Φ, % | τ, ns | pK′ab |
pK′ac |
|---|---|---|---|---|---|---|---|
| a Protonated form of the dyes. b Determined in solution in EtOH/H2O (1/1). c Determined in a Hydromed D4 sensor foil in a concentration of 0.2 w%. d Dye solubility is insufficient for the titration. | |||||||
| 1 | 696 | 720 | 83200 |
24 | 2.54 | n.d.d | 11.7 |
| 2 | 696 | 721 | 85400 |
27 | 2.69 | 11.1 | 10.8 |
| 3 | 695 | 721 | 80700 |
26 | 2.56 | 7.8 | 7.5 |
| 4 | 694 | 720 | 73300 |
27 | 2.67 | 10.3 | 10.3 |
| 5 | 698 | 722 | 90000 |
14 | 1.57 | n.d.d | 11.6 |
3.3 pH sensing properties of the indicators and sensors
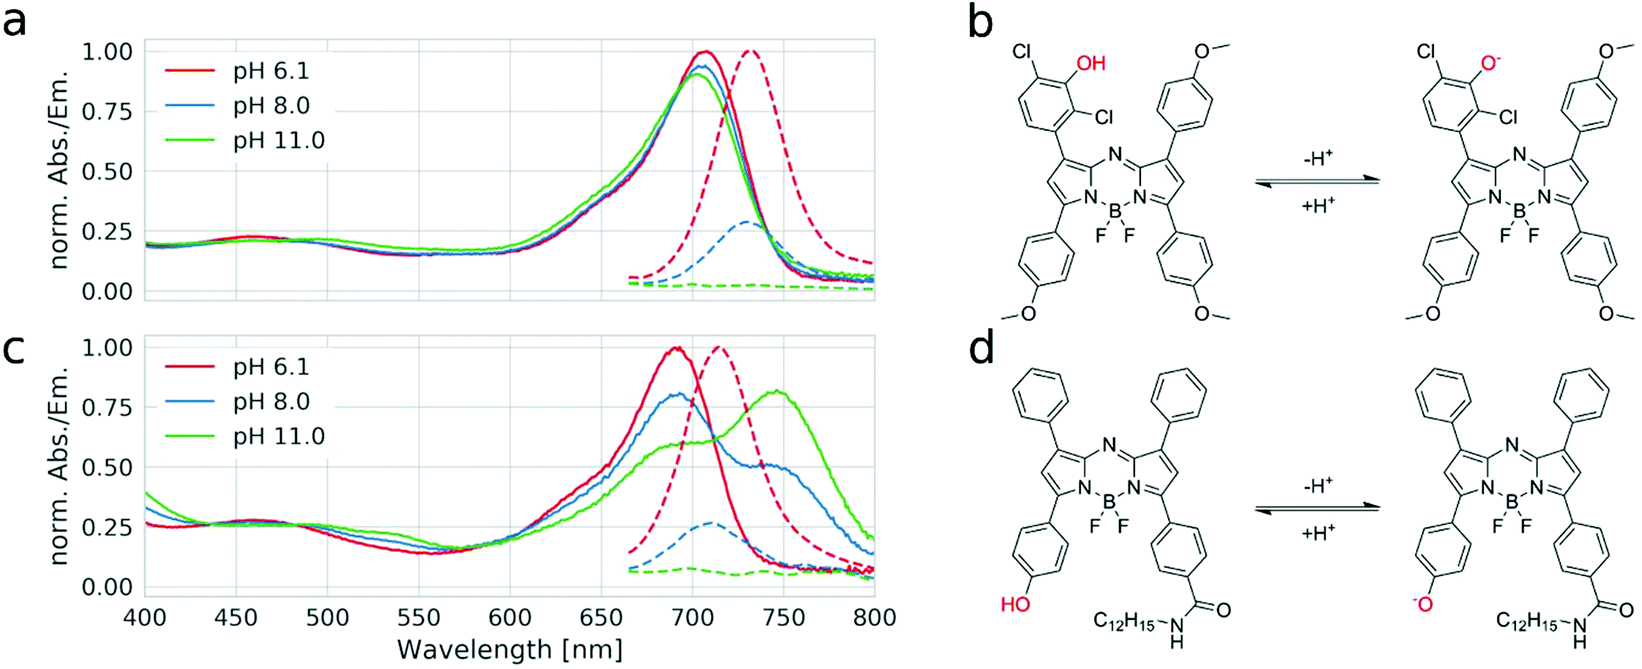
Fig. 2a exemplarily shows the pH dependency of the absorption and emission spectra for indicator 3 (the spectral changes for other indicators are almost identical). It is evident that deprotonation of the hydroxyl group has almost no effect on the absorption spectra, but it results in complete quenching of the fluorescence of the indicator. This confirms that PET is the only mechanism responsible for the spectral changes and ICT is not involved. In contrast, a state-of-the-art aza-BODIPY indicator with a hydroxyl group in the para-position shows an ∼55 nm bathochromic shift of the absorption upon deprotonation, due to the enhancement of the ICT effect (Fig. 2c). This behavior is undesired, due to the increasing overlap between the emission of the protonated form and the absorption of the non-emissive deprotonated form of the indicator, as it promotes fluorescence quenching via FRET. Evidently, the new dyes overcome this drawback. The pH-independent absorption of the new dyes is particularly advantageous in the case of broad-range sensors (obtained by mixing several indicators with different pKa values) and in multi-parameter sensors (obtained by a combination of probes for different species in one material) since undesired enhancement or quenching of the luminescence of the components due to modulation of the inner filter effect is avoided.The fluorescence response of the new dyes to pH is typical of the “on”–“off” indicators (Fig. S2 of the ESI,†Fig. 3b). Generally, the pKa values (Table 1) are significantly higher than those for the state-of-the-art aza-BODIPY dyes with conjugated phenol and the same substitution character. The relatively high pKa values of the new dyes can be explained by the electronic decoupling of the hydroxyl group from the electron withdrawing core of the dye. Interestingly, the apparent pKa for dye 1 is even higher than that for phenol (pKa = 9.99).57 This may be explained by the fairly hydrophobic character of the chromophore creating a microenvironment where the more polar anionic form is less stabilized than the uncharged form. Indicator 2, which is decorated with a single chlorine atom in the ortho-position towards the hydroxyl group, features only a slightly lower pKa value (Table 1). Two fluorine atoms located in the ortho and para-positions towards the hydroxyl group further decrease the pKa value by about 1 unit. As can be seen, the effect of two chlorine atoms in the ortho-position towards the hydroxyl group (indicator 3) is much stronger (pKa = 7.8), making this indicator promising for measurements under physiological conditions in marine environment due to pKa almost ideally matching the pH of seawater. On the other hand, indicators 1, 2, 4 and 5 are expected to be promising for imaging of pH on concrete surfaces51 and the investigation of alkaliphilic bacteria.52 In fact, we recently demonstrated high potential of the new sensors for monitoring the pH dynamics in concrete.39,40 The dyes can also be used as essential components for the preparation of broad range pH sensors (usually obtained by mixing multiple pH indicators).31 Notably, only a few aza-BODIPY indicators have been reported with similarly high pKa values and they require higher synthetic effort31 or are no longer fluorescent and can only be used as absorption based indicators.58
 | ||
| Fig. 3 Structures with apparent pKa values (a) and titration curves (b) of the new aza-BODIPY indicators immobilized in polyurethane hydrogel D4. | ||
Table 2 compares the properties of fluorescent pH indicators used in sensors for measurements in highly alkaline media. As can be seen, only BODIPYs28 and aza-BODIPYs (this work) have so far allowed for the fine-tuning of the pKa value and the dynamic range of the sensors. Compared to the former, the new dyes show about 150 nm bathochromically shifted absorption and emission spectra, which is beneficial for application in environments with high autofluorescence and scattering but also for in vivo measurements.
| Dye-class | Matrix | λ max abs/exc, nm | λ max em, nm | pK′a | Comment | Ref. |
|---|---|---|---|---|---|---|
| Coumarin | Cross-linked 1,4-bis(acryloyl)piperazine | 370 | 470 | 11.9 | Short wavelength absorption and emission | 38 |
| BODIPY | Polyurethane hydrogel D4 | 523 | 532 | 11.44 | Comparably short wavelength of absorption and emission | 37 |
| BODIPY | Polymeric hydrogel | 502 | 508 | 10.8 | Comparably short wavelength of absorption and emission | 36 |
| BODIPY | Polyurethane hydrogel D4 | 522–540 | 537–550 | 0.5–12.83 | Comparably short wavelength of absorption and emission | 28 |
| Perylene | Polyurethane hydrogel D4 | 586 | 595 | 10.56 | Extremely limited tuneability of the pKa | 22 |
| Perylene | Polyurethane hydrogel D4 | 650 | 662 | 10.15 | Extremely limited tuneability of the pKa | 22 |
| Aza-BODIPYs | Polyurethane hydrogel D4 | 694–698 | 720–722 | 7.5–11.7 | Tuneable pKa, NIR absorption and emission, high photostability; excellent spectral compatibility with robust reference materials | This work |
In order to overcome the limitations of fluorescence intensity measurement, we prepared pH sensor materials which rely on the Dual Lifetime Referencing (DLR) technique. This method relies on the use of a second emitter with a much longer luminescence decay time (micro- or millisecond time domain). It enables a robust read-out independent of the intensity of the excitation light and sensitivity of the photodetector and compensates for some variation in the thickness of the sensor foil. Similar to the previously reported aza-BODIPY indicators, the new dyes are spectrally compatible with the robust inorganic emitters Egyptian Blue55 and Cr-GAB.59 In fact, the sensors prepared on the basis of dyes 3 and 4 and Egyptian blue as a reference material were excellently suitable for robust referenced read-out with a compact phase fluorometer (Fig. S3 of the ESI†). The resolution of these sensors estimated from the standard deviation of the measured phase angle (∼0.11°) was 0.003 pH units when measured close to the apparent pKa of the sensors. Clearly, this referencing scheme can also be applied for the other dyes of the series.
3.4 Application of the new dyes in donor–acceptor light harvesting systems
Another application which benefits from the less complex behavior of the novel indicators is signal enhancement by light harvesting. In such a scheme a suitable antenna dye (donor) is used in a high concentration to absorb the excitation light and transfer the energy via FRET to the pH sensitive acceptor dye. Thereby the overall brightness of the sensor material is significantly enhanced. Such an enhancement is not possible by simply using a higher concentration of the indicator since this would lead to undesired negative effects like aggregate formation, strong inner filter effect and shift of the apparent pKa caused by homo-FRET (energy transfer from the protonated form of the indicator to its deprotonated form). By employing an antenna dye to enhance the absorption of the sensor film the above problems can be avoided since the antenna dye cannot reabsorb the emitted fluorescence or act as a FRET acceptor for the pH sensitive dye. Moreover, this scheme enables an artificial increase of the Stokes shift of the sensor material, due to the hypsochromically shifted absorption of the antenna dye. A large Stokes shift is beneficial as excitation and emission light can be separated more easily and with lower losses. Moreover, potentially remaining antenna fluorescence can be used for ratiometric measurements.State-of-the-art para-substituted-hydroxy aza-BODIPY indicators are not ideal for this concept as the efficiency of energy transfer depends on the overlap of the absorption and emission spectra of the donor and the acceptor, respectively. A strong bathochromic shift in the absorption of the acceptor upon deprotonation (see Fig. 2a) results in reduced FRET efficiency and a “turn on” effect of the donor, which reduces the dynamics of the sensor.
Fig. 4a depicts the composition of the light harvesting system which relies on the pH-insensitive tetraphenyl aza-BODIPY as an energy donor and indicator 3 as an acceptor. Importantly, the absorption spectrum of 3 is bathochromically shifted by approximately 40 nm due to the electron donating ether groups (see Fig. S4 of the ESI†), thus ensuring excellent spectral overlap between the emission of the donor and the absorption of the acceptor. The protonated indicator can indeed be efficiently excited via energy transfer from the donor (Fig. 4b). The corresponding emission spectra (Fig. 4c) of the materials clearly show that the light harvesting concept leads to a strong signal enhancement (∼3.4 fold) of the fluorescence of the pH indicator. The energy transfer is very efficient since only a small amount of residual donor fluorescence is visible. In basic media (Fig. 4d and e), the fluorescence emission of the acceptor is completely quenched. In contrast, the residual fluorescence of the donor remains constant (Fig. 4e, peak at 690 nm). Furthermore, no “turn on” of donor emission is visible upon deprotonation of the indicator. Therefore, even a simple long-pass emission filter (e.g. at 700 nm) makes it possible to collect almost the entire fluorescence from the indicator. The strong signal enhancement can either be used to prepare thinner and faster responding sensor films or to obtain sensors with better signal-to-noise ratios. Additionally, the residual fluorescence from the donor is also very useful for referencing purposes.
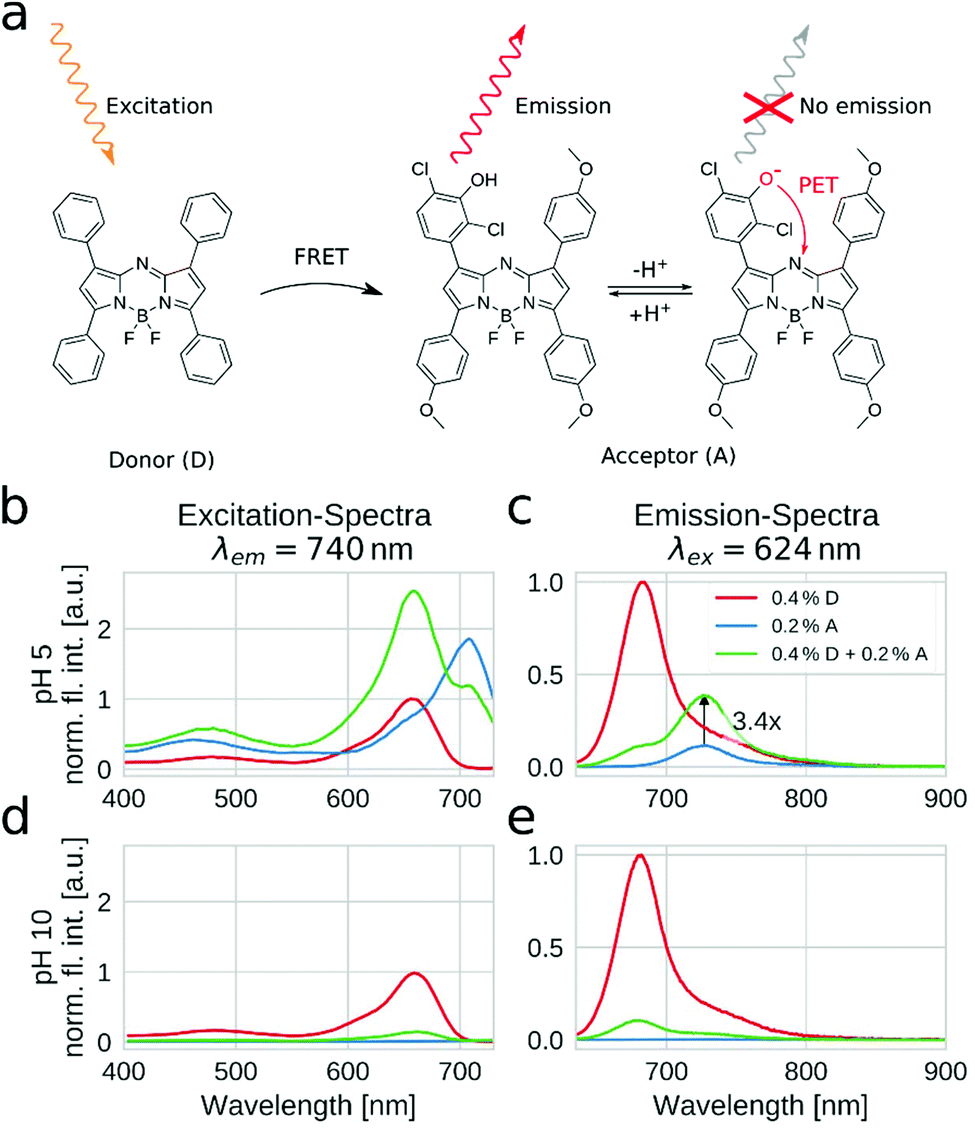 | ||
| Fig. 4 Enhancement of the fluorescence properties of the pH sensor via light harvesting. Chemical structures of the employed donor (tetraphenyl aza-BODIPY) and acceptor (indicator 3) (a). Excitation (b, d) and emission (c, e) spectra at pH 5 (b, c) and pH 10 (d, e) for the sensor material employing light harvesting (green) and for the corresponding sensor materials containing only the donor (red) and only the acceptor (blue). The concentrations of the dyes are given in wt% with respect to the polymer. The spectra were recorded with sensor foils of approximately 3 μm sensor layer thickness in the right angle mode. The emission intensities are normalized to the emission intensity of the pure donor for every plot. The absorption spectra of the sensor foil are depicted in Fig. S1 in the ESI.† | ||
3.5 Ratiometric imaging of the pH distribution
As was shown above, light harvesting not only enhances the brightness of the sensors but also allows the utilization of the residual fluorescence of the donor for referencing purpose. Thus, ratiometric imaging of the pH distribution with an inexpensive setup becomes possible. The imaging set-up consists of a yellow high power LED and a 4-channel camera (blue, green, red and NIR channels)5 equipped with a long-pass emission filter (Fig. S5†). Fig. 5 shows the spectral properties of the sensor material (0.4 wt% antenna dye and 0.2 wt% indicator 3) along with the spectral sensitivity of the red and NIR channels of the camera. As can be seen, the emission of the indicator in the NIR channel is modulated by pH. On the other hand, the residual emission of the donor dye in the red channel is virtually pH independent, thus enabling ratiometric referencing. Although this set-up may not be ideal due to the fact that only a small portion of the emission of the donor and the acceptor is collected in the respective channels (Fig. 5), the camera is compact, affordable (∼2000 €) and contains no moving elements. A spectral camera with custom emission filters on a rotating wheel60 may be an interesting alternative if higher signals are desired. Nevertheless, due to strong brightness enhancement via light harvesting, even the current combination is promising for imaging of the pH distribution (Fig. 6a). The calibration curve generated from ratiometric images (Fig. 6b) is very similar to that obtained for the unreferenced fluorescence intensity measurements (Fig. 3). It should be mentioned here that the Dual Lifetime Referencing scheme can also be used as an alternative to the ratiometric two wavelength imaging as recently demonstrated for sensors applied for the investigation of corrosion processes in concrete.39,40 On the other hand, the DLR sensors require much more expensive cameras operating in the time or the frequency domain, which may be a serious limitation.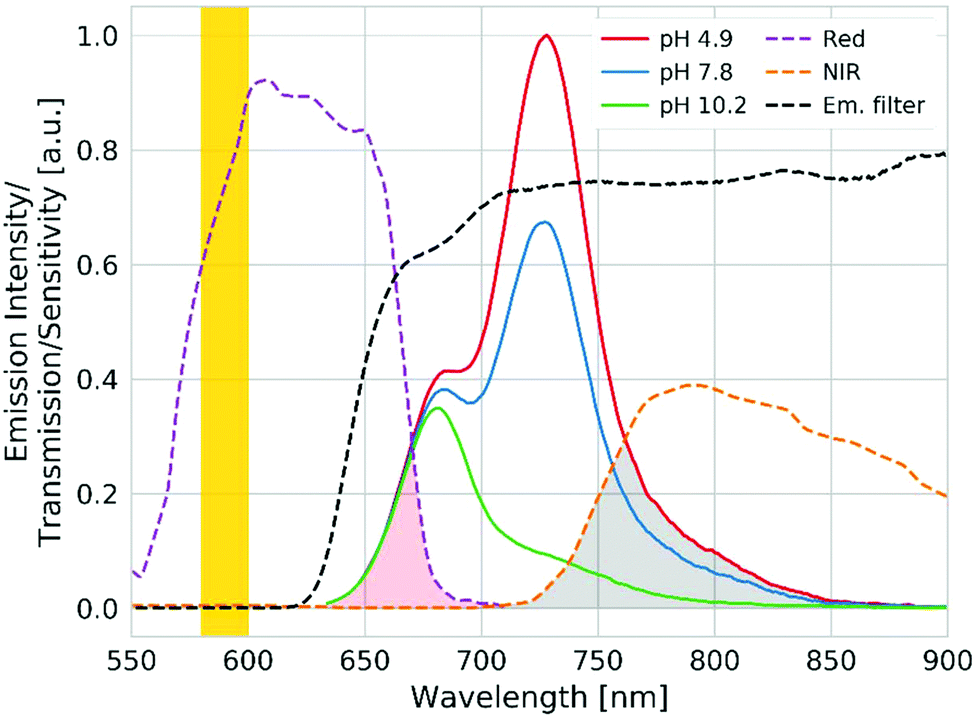 | ||
| Fig. 5 pH dependency of the emission spectrum of the sensor and the optical properties of the imaging set-up. The orange vertical line indicates excitation from the high power 590 nm LED; dashed purple and orange lines show the relative sensitivity of the red and NIR channels of the camera, respectively (adapted from http://www.jai.com). The dashed black line is the transmission of the used emission filter (RG640 from Hoya combined with the “bright red” foil filter from LEE filters in the front). | ||
 | ||
| Fig. 6 Imaging of the pH distribution with the dual chip RGB/NIR camera. (a) False-color images for the fluorescence ratio (NIR/red channel) for the sensor material between pH 6 and 10. (b) The fit of the corresponding response curve with the Boltzmann sigmoid function. | ||
4. Conclusions
In conclusion, we prepared 5 new pH-sensitive aza-BODIPY indicator dyes that feature different substitution patterns compared to the state-of-the-art analogs. The new indicators possess good quantum yields in the “on” state and no detectable fluorescence in the “off” state. They are purely PET-based, featuring nearly pH independent absorption spectra and therefore constant magnitude of the inner filter effect in sensor materials. These properties make the new dyes promising for application in multi-parameter sensors and systems utilizing signal enhancement via light harvesting. The apparent pKa values between 7.5 and 11.7 enable measurements from physiological conditions to very alkaline media. Whereas the indicator bearing two chlorine atoms in the ortho-position ideally matches the pH of seawater, the other dyes have very high pKa values due to the decoupling from the electron withdrawing core of the dye. The dynamic range of these sensors corresponds to typical pH changes occurring in concrete which promote corrosion and deterioration of the structures. Therefore, they are not only suitable for the detailed investigation of these processes as recently demonstrated by our group, but potentially also for long-term monitoring of concrete “heath” with low-cost optical sensors. They may also be promising for the investigation of alkaliphiles or for the design of optical CO2 sensor materials utilizing fluorescent pH indicators as transducers.Conflicts of interest
There are no conflicts to declare.Acknowledgements
This work was supported by the European Union's Horizon 2020 project STEMM-CCS (grant number 654462).References
- D. Wencel, T. Abel and C. McDonagh, Anal. Chem., 2012, 86, 15–29 CrossRef PubMed.
- E. Vachette, C. Fenge, J.-M. Cappia, L. Delaunay, G. Greller and B. Magali, BioProcess Int., 2014, 12, 23–25 Search PubMed.
- T. Jokic, S. M. Borisov, R. Saf, D. A. Nielsen, M. Kühl and I. Klimant, Anal. Chem., 2012, 84, 6723–6730 CrossRef CAS PubMed.
- M. Larsen, S. M. Borisov, B. Grunwald, I. Klimant and R. N. Glud, Limnol. Oceanogr.: Methods, 2011, 9, 348–360 CrossRef CAS.
- J. Ehgartner, H. Wiltsche, S. M. Borisov and T. Mayr, Analyst, 2014, 139, 4924–4933 RSC.
- Z. Jiang, X. Yu and Y. Hao, Sensors, 2017, 17, 1316 CrossRef PubMed.
- M. Moßhammer, M. Strobl, M. Kühl, I. Klimant, S. M. Borisov and K. Koren, ACS Sens., 2016, 1, 681–687 CrossRef.
- I. B. Tahirbegi, J. Ehgartner, P. Sulzer, S. Zieger, A. Kasjanow, M. Paradiso, M. Strobl, D. Bouwesa and T. Mayr, Biosens. Bioelectron., 2017, 88, 188–195 CrossRef CAS PubMed.
- P. Gruber, M. P. C. Marques, P. Sulzer, R. Wohlgemuth, T. Mayr, F. Baganz and N. Szita, Biotechnol. J., 2017, 12, 1600475 CrossRef PubMed.
- E. Poehler, C. Herzog, S. A. Pfeiffer, C. Lotter, A. J. Peretzki, D. Aigner, T. Mayr, E. Beckert and S. Nagl, Procedia Eng., 2015, 120, 175–179 CrossRef CAS.
- E. B. Magnusson, S. Halldorsson, R. M. T. Fleming and K. Leosson, Biomed. Opt. Express, 2013, 4, 1749–1758 CrossRef PubMed.
- L. Florea, C. Fay, E. Lahiff, T. Phelan, N. E. O'Connor, B. Corcoran, D. Diamond and F. Benito-Lopez, Lab Chip, 2013, 13, 1079–1085 RSC.
- S. Wu, S. S. Wu, Z. Yi, F. Zeng, W. Wu, Y. Qiao, X. Zhao, X. Cheng and Y. Tian, Sensors, 2018, 18, 564 CrossRef PubMed.
- I. Kasik, J. Mrazek, T. Martan, M. Pospisilova, O. Podrazky, V. Matejec, K. Hoyerova and M. Kaminek, Anal. Bioanal. Chem., 2010, 398, 1883–1889 CrossRef CAS PubMed.
- A. S. Kocincova, S. M. Borisov, C. Krause and O. S. Wolfbeis, Anal. Chem., 2007, 79, 8486–8493 CrossRef CAS PubMed.
- S. W. Bishnoi, C. J. Rozell, C. S. Levin, M. K. Gheith, B. R. Johnson, D. H. Johnson and N. J. Halas, Nano Lett., 2006, 6, 1687–1692 CrossRef CAS PubMed.
- R. V. Benjaminsen, H. Sun, J. R. Henriksen, N. M. Christensen, K. Almdal and T. L. Andresen, ACS Nano, 2011, 5, 5864–5873 CrossRef CAS PubMed.
- H. N. Kim, K. M. K. Swamy and J. Yoon, Tetrahedron Lett., 2011, 52, 2340–2343 CrossRef CAS.
- D. Aigner, S. M. Borisov, F. J. Orriach Fernández, J. F. Fernández Sánchez, R. Saf and I. Klimant, Talanta, 2012, 99, 194–201 CrossRef CAS PubMed.
- Q.-J. Ma, H.-P. Li, F. Yang, J. Zhang, X.-F. Wu, Y. Bai and X.-F. Li, Sens. Actuators, B, 2012, 166–167, 68–74 CrossRef CAS.
- D. Aigner, S. M. Borisov, P. Petritsch and I. Klimant, Chem. Commun., 2013, 49, 2139–2141 RSC.
- D. Pfeifer, I. Klimant and S. M. Borisov, Chem. – Eur. J., 2018, 24, 10711–10720 CrossRef CAS PubMed.
- D. Aigner, B. Ungerböck, T. Mayr, R. Saf, I. Klimant and S. M. Borisov, J. Mater. Chem. C, 2013, 1, 5685–5693 RSC.
- H. R. Kermis, Y. Kostov and G. Rao, Analyst, 2003, 128, 1181–1186 RSC.
- D. Wencel, B. D. MacCraith and C. McDonagh, Sens. Actuators, B, 2009, 139, 208–213 CrossRef CAS.
- Z. Li, L.-J. Li, T. Sun, L. Liu and Z. Xie, Dyes Pigm., 2016, 128, 165–169 CrossRef CAS.
- Y. S. Marfin, M. V. Shipalova, V. O. Kurzin, K. V. Ksenofontova, A. V. Solomonov and E. V. Rumyantsev, J. Fluoresc., 2016, 26, 2105–2112 CrossRef CAS PubMed.
- R. Gotor, P. Ashokkumar, M. Hecht, K. Keil and K. Rurack, Anal. Chem., 2017, 89, 8437–8444 CrossRef CAS PubMed.
- A. Loudet and K. Burgess, Chem. Rev., 2007, 107, 4891–4932 CrossRef CAS PubMed.
- T. C. Werner, C. Huber, S. Heinl, M. Kollmannsberger, J. Daub and O. S. Wolfbeis, Fresenius’ J. Anal. Chem., 1997, 359, 150–154 CrossRef CAS.
- M. Strobl, T. Rappitsch, S. M. Borisov, T. Mayr and I. Klimant, Analyst, 2015, 140, 7150–7153 RSC.
- J. Killoran, S. O. McDonnell, J. F. Gallagher and D. F. O'Shea, New J. Chem., 2008, 32, 483–489 RSC.
- S. O. McDonnell and D. F. O'Shea, Org. Lett., 2006, 8, 3493–3496 CrossRef CAS PubMed.
- J. Murtagh, D. O. Frimannsson and D. F. O'Shea, Org. Lett., 2009, 11, 5386–5389 CrossRef CAS PubMed.
- A. Kamkaew and K. Burgess, Chem. Commun., 2015, 51, 10664–10667 RSC.
- T. Gareis, C. Huber, O. S. Wolfbeis and J. Daub, Chem. Commun., 1997, 1717–1718 RSC.
- M. Hecht, W. Kraus and K. Rurack, Analyst, 2013, 138, 325–332 RSC.
- T. H. Nguyen, T. Venugopala, S. Chen, T. Sun, K. T. V. Grattan, S. E. Taylor, P. A. M. Basheer and A. E. Long, Sens. Actuators, B, 2014, 191, 498–507 CrossRef CAS.
- C. Grengg, C. B. Müller, C. Staudinger, F. Mittermayr, J. Breininger, B. Ungerböck, S. M. Borisov, T. Mayr and M. Dietzel, Cem. Concr. Res., 2019, 116, 231–237 CrossRef CAS.
- B. Müller, C. Grengg, V. Schallert, M. Sakoparnig, C. Staudinger, J. Breininger, F. Mittermayr, B. Ungerböck, S. Borisov, M. Dietzel and T. Mayr, RILEM Tech. Lett., 2018, 3, 39–45 CrossRef.
- N. Adarsh, M. S. Krishnan and D. Ramaiah, Anal. Chem., 2014, 86, 9335–9342 CrossRef CAS PubMed.
- H. He, J. Zhang, Y. Xie, Y. Lu, J. Qi, E. Ahmad, X. Dong, W. Zhao and W. Wu, Mol. Pharm., 2016, 13, 4013–4019 CrossRef CAS PubMed.
- Y. Xu, T. Feng, T. Yang, H. Wei, H. Yang, G. Li, M. Zhao, S. Liu, W. Huang and Q. Zhao, ACS Appl. Mater. Interfaces, 2018, 10, 16299–16307 CrossRef CAS PubMed.
- Y. Xu, M. Zhao, L. Zou, L. Wu, M. Xie, T. Yang, S. Liu, W. Huang and Q. Zhao, ACS Appl. Mater. Interfaces, 2018, 10, 44324–44335 CrossRef CAS PubMed.
- H. Li, P. Zhang, L. P. Smaga, R. A. Hoffman and J. Chan, J. Am. Chem. Soc., 2015, 137, 15628–15631 CrossRef CAS PubMed.
- Y. Gawale, N. Adarsh, S. K. Kalva, J. Joseph, M. Pramanik, D. Ramaiah and N. Sekar, Chem. – Eur. J., 2017, 23, 6570–6578 CrossRef CAS PubMed.
- K. Miki, A. Enomoto, T. Inoue, T. Nabeshima, S. Saino, S. Shimizu, H. Matsuoka and K. Ohe, Biomacromolecules, 2017, 18, 249–256 CrossRef CAS PubMed.
- T. Li, T. Meyer, R. Meerheim, M. Höppner, C. Körner, K. Vandewal, O. Zeika and K. Leoa, J. Mater. Chem. A, 2017, 5, 10696–10703 RSC.
- J. Min, T. Ameri, R. Gresser, M. Lorenz-Rothe, D. Baran, A. Troeger, V. Sgobba, K. Leo, M. Riede, D. M. Guldi and C. J. Brabec, ACS Appl. Mater. Interfaces, 2013, 5, 5609–5616 CrossRef CAS PubMed.
- D. Aigner, S. A. Freunberger, M. Wilkening, R. Saf, S. M. Borisov and I. Klimant, Anal. Chem., 2014, 86, 9293–9300 CrossRef CAS PubMed.
- E. Liu, M. Ghandehari, C. Brückner, G. Khalil, J. Worlinsky, W. Jin, A. Sidelev and M. A. Hyland, Cem. Concr. Res., 2017, 95, 232–239 CrossRef CAS.
- J. L. Slonczewski, M. Fujisawa, M. Dopson and T. A. Krulwich, in Advances in Microbial Physiology, Elsevier, 2009, vol. 55, pp. 1–317 Search PubMed.
- P. W. Zach, S. A. Freunberger, I. Klimant and S. M. Borisov, ACS Appl. Mater. Interfaces, 2017, 9, 38008–38023 CrossRef CAS PubMed.
- C. Staudinger, M. Strobl, J. Breininger, I. Klimant and S. M. Borisov, Sens. Actuators, B, 2019, 282, 204–217 CrossRef CAS.
- S. M. Borisov, C. Würth, U. Resch-Genger and I. Klimant, Anal. Chem., 2013, 85, 9371–9377 CrossRef CAS PubMed.
- A. Gorman, J. Killoran, C. O'Shea, T. Kenna, W. M. Gallagher and D. F. O'Shea, J. Am. Chem. Soc., 2004, 126, 10619–10631 CrossRef CAS PubMed.
- Z. Rappoport, CRC handbook of tables for organic compound identification, CRC Press, 1967, p. 434 Search PubMed.
- S. Schutting, T. Jokic, M. Strobl, S. M. Borisov, D. de Beer and I. Klimant, J. Mater. Chem. C, 2015, 3, 5474–5483 RSC.
- S. M. Borisov, K. Gatterer, B. Bitschnau and I. Klimant, J. Phys. Chem. C, 2010, 114, 9118–9124 CrossRef CAS PubMed.
- M. Kühl, L. Behrendt, E. Trampe, K. Qvortrup, U. Schreiber, S. M. Borisov, I. Klimant and A. W. Larkum, Front. Microbiol., 2012, 3, 402 Search PubMed.
Footnote |
| † Electronic supplementary information (ESI) available. See DOI: 10.1039/c9an00118b |
| This journal is © The Royal Society of Chemistry 2019 |