A novel electrochemical strategy based on porous 3D graphene-starch architecture and silver deposition for ultrasensitive detection of neuron-specific enolase
Yishan
Fang
 *ab,
Yanping
Li
b,
Ming
Zhang
b,
Bo
Cui
*ab,
Qiong
Hu
c and
Lishi
Wang
c
*ab,
Yanping
Li
b,
Ming
Zhang
b,
Bo
Cui
*ab,
Qiong
Hu
c and
Lishi
Wang
c
aState Key Laboratory of Biobased Material and Green Papermaking, Qilu University of Technology, Shandong Academy of Sciences, Jinan, 250353, China. E-mail: fangysh123@qlu.edu.cn; cuibopaper@163.com; Fax: +860531 89631195; Tel: +86 0531 89631195
bSchool of Food Science and Engineering, Qilu University of Technology, Shandong Academy of Sciences, Jinan 250353, China
cSchool of Chemistry and Chemical Engineering, South China University of Technology, Guangzhou 510641, People's Republic of China
First published on 24th January 2019
Abstract
This work was aimed at designing a novel and ultrasensitive electrochemical immunoassay strategy to detect neuron-specific enolase (NSE) with a triple signal amplification strategy. A greatly enhanced sensitive detection of NSE was achieved by using porous three-dimensional graphene-starch architecture (3D-GNS) modified on the immunosensor's surface to construct a unique 3D immunoelectrode, which would greatly accelerate electron transfer and capture more protein molecules. 3D-GNS was prepared with starch as a crosslinking agent and stabilizer, which is biocompatible and environmentally friendly. Aggregation-free gold nanoparticle (AuNP) incorporated ordered mesoporous carbon–silica (OMCSi–Au) with good catalytic activity was synthesized as the tracing tag for labeling signal antibody (Ab2). After a sandwich-type immunoreaction, the OMCSi–Au labeled Ab2 was trapped on the surface of the immunosensor, and the high concentration of AuNPs with high dispersion greatly catalyzed the deposition of silver nanoparticles. The deposited silver nanoparticles (AgNPs) could be tested directly with anodic stripping voltammetric analysis (ASV) in potassium chloride solution to monitor the immunoreactions, which greatly enhanced the sensitivity of protein markers with a detection limit of 0.008 pg mL−1, and a linear range of 0.02 pg mL−1 to 35 ng mL−1 for neuron-specific enolase antigen. This proposed immunosensor displayed acceptable accuracy, good stability, and high sensitivity. Good results were also obtained in agreement with the enzyme-linked immunosorbent assay method, which provides greatly promising potential in clinical applications.
1. Introduction
Nowadays, ultrasensitive and accurate determination of biomarkers at ultralow levels in blood or tissue has gained a wide range of applications in clinical cancer screening and early diagnosis.1,2 Neuron specific enolase (NSE), as a tumor marker, is well known for its sensitivity and reliability in small cell lung cancer. The rapid and accurate detection of NSE shows great importance in the clinical diagnosis and treatment of related cancers and diseases.3,4 Recently, many methods have been set up for NSE detection, including fluorescence immunoassay, radioimmunoassay, chemiluminescence immunoassay, ELISA, etc. However, most of these analytical methods have poor specificity, require complex procedures, and are high cost and labor intensive.5,6 As a powerful analytical method, electrochemical immunosensors have become very popular and have been widely applied in many fields, because of the intrinsic advantages of simple operation, high sensitivity, reliable detection, low cost, and miniaturized instruments.7,8In order to develop ultrasensitive immunosensors for low-cost and low-abundance detection of biomarkers, signal amplification based on various nanomaterials is the most popular strategy,9,10 such as quantum dots,11,12 carbon nanotubes13,14 bionanospheres,14,15 gold nanoparticles,15,16 magnetic beads,17,18 and graphene.15,19 Most of these can be used as sensor platforms or excellent carriers to load numerous proteins, which can greatly amplify the transduction signal. Three-dimensional graphene (3D-GN), as a novel type of bulk material, has been developed and attracted wide interest in recent years. Compared with graphene, 3D-GN provides a porous structure and retains a larger specific surface area, which was suitable for integration with nanostructured materials without agglomeration. Moreover, 3D-GN with porosity is more facile to transmit all kinds of ions and molecules, allowing them to be diffused conveniently and quickly.20,21 With its excellent properties, 3D-GN is an ideal scaffold for the fabrication of composite electrodes, which has great potential for the improvement of biosensing efficacy.22,23 Meanwhile, to create its more applications in biosensors, novel 3D-GN composites with higher performance are always expected, more and more efforts have been made to receive various 3D-GN composites.24,25 However, most of the synthetic methods are complicated; the reagents are poisonous and can cause environmental pollution. Starch is a glucose polymer, one of the most plentiful natural polysaccharides. It is cheap, biodegradable, and widely used, but little attention has been paid to the preparation of starch nanostructures and nanocomposites.26,27 According to the latest reports,28–30 starch can be used as a good stabilizer and coupling agent for fabrication of nanocomposites. Thus, in this study, a porous 3D graphene-starch architecture (3D-GNS) was prepared using starch as a crosslinking agent and stabilizer, which is biocompatible and environmentally friendly. With chitosan (CS), 3D-GNS/CS composites modified on the immunosensor's surface, it was used to immobilize the primary antibody (Ab1) through the glutaraldehyde (GA) cross-linker,31,32 enhancing the stability and the sensitivity of the immunosensor.
Silver nanoparticles (AgNPs), one of the most used metal nanoparticles, have been extensively applied in electrochemical immunosensors because of their unique abilities such as lower oxidation potential, the precision of the detection, and facile stripping conditions. Compared with gold nanoparticles, they can be directly detected at a more negative potential, and have a relatively sharp peak.33,34 It is conducive to reduce the interference of reducing species and to improve the sensitivity of detection. However, few studies have been performed on the use of Ag nanoparticles as labels, because most methods involve a complicated preparation process and time-consuming labeling procedure, and in particular the AgNP probes are unstable. Thus, great effort has been made to develop their stability.32,35 Note that AuNPs can catalyze the deposition of silver in situ;36–38 AuNP-catalyzed silver deposition for the amplification of the electrochemical responses in the immunoassay has been quickly developed,38,39 and it not only greatly improves the stability of silver but also possesses good biocompatibility and ease of functionalization with proteins. However, the AuNPs over the synthesis often suffer serious aggregation with a broad size because of their less effective control.
Thus, in this study, aggregation-free AuNP incorporated OMCSi was fabricated through a coordination-assisted synthetic approach. OMCSi is an attractive material compared to mesoporous silica or mesoporous carbons.40,41 Compared with ordered mesoporous carbon (OMS), OMCSi could effectively improve the hydrophilicity of the mesoporous structures due to its incorporated silica, which is more convenient to facilitate the binding of biomolecules. Besides, OMCSi possesses a large pore volume, high mechanical stability, and high specific surface area.42,43 It greatly enhanced the catalytic activity, stability, and dispersity of the gold nanoparticle in OMCSi, which could be more beneficial and easier to further combine with labeled antibodies to prepare tagged antibodies and catalyze silver deposition.
In brief, the introduction of 3D-GNS modified on an immunosensor surface constructed a unique 3D immunoelectrode, which greatly accelerated electron transfer, efficiently improved the detection signal, and in particular strengthened the stability. Meanwhile, OMCSi–Au probes possessed a high content of AuNPs for signal amplification, while numerous AuNPs loaded on OMCSi would greatly induce silver deposition for ASV, which gave rise to a lower detection limit. This method excluded the deoxygenation procedure, complete cross-talk, complicated acid dissolution step, and metal preconcentration, and showed a lower detection limit. This study proposed good stability, acceptable accuracy, and high sensitivity, exhibiting great potential in clinical diagnosis and promising application for low-abundance biomarker determination.
2. Experimental
2.1 Chemicals
The NSE ELISA kit including neuron-specific enolase (NSE), NSE capture antibody (Ab1) and NSE signal antibody (Ab2) was purchased from Linc-Bio Science Co. Ltd (Shanghai, China). The clinical serum samples were obtained from the Southern Hospital of Guangzhou, China. The serum samples came from healthy subjects and lung cancer patients. Chloroauric acid, phenol, tetraethyl orthosilicate (TEOS), acetylacetone, and formalin solution (37 wt%) were acquired from Shanghai Chemical Corp. Glutaraldehyde, bovine serum albumin (BSA), graphene oxide, chitosan, and silver enhancer solutions A and B were achieved from Sigma-Aldrich Chemical Co. (USA).The washing solution was prepared with Tris–HNO3 buffer (0.1 M, pH 7.4) and 0.05% (w/v) Tween-20. Silver enhancer solutions A and B were mixed together and freshly diluted 30 times to obtain a solution for silver-deposition enhancement.
2.2 Apparatus
All electrochemical testings were carried out on an electrochemical workstation (CHI 660E, Chenhua, Shanghai). Nitrogen sorption–desorption isotherms from Barrett–Joyner–Halenda (BJH) and Brunauer–Emmett–Teller (BET) measurements were obtained on a Micromeritcs Tristar II 3020 analyzer (USA). Scanning electron micrographs were obtained with a ZeissUltra 55 for morphology characterization (FE-SEM, Germany), while transmission electron microscopy (TEM) was performed with a JEM 2100 (Japan Electronics Co., Ltd). X-ray photoelectron spectroscopy (XPS) was executed using an Escalab 250 X-ray spectrometer (USA).2.3 Synthesis of 3D-GNS
Starch powders (Acros, potato starch, 0.05 g) were dissolved in water at 100 °C for 40 min (10.0 mL), then GO suspension (2 mg mL−1, 50 mL) was added and mixed uniformly under vigorous stirring for 2 hours. Subsequently, the mixtures were transferred to a 100 mL Teflon-lined autoclave and maintained at 180 °C for 12 h. The obtained 3D architecture was washed with deionized water, and then lyophilized for 48 hours. Finally, the as-prepared 3D-GNS was dissolved in 1% CS to obtain a 1 mg mL−1 solution.2.4 Preparation of mesoporous carbon–silica–Au composites
Base on previous reports with some modification,42–44 resol precursor solution (2.5 g) and TEOS (0.5 g) were sequentially added into Pluronic F127 solution (in absolute ethanol) with vigorous stirring for 20 min. To it, 1.5 ml of HAuCl4 solution (48.5 mM) was added dropwise. At the same time, 0.025 g acetylacetone was added together to obtain a clear solution. After stirring for 30 min, the solution was coated on the Al2O3-decorated Si wafer to form a thin film with 4000 rpm for 60 s, followed by evaporated ethanol at 40 °C, and thermopolymerized for 24 h at 120 °C. The as-made films were calcined at a temperature of 300 °C under nitrogen for 2 h in a tube furnace, and then at 650 °C for another 3 h under a nitrogen flow to obtain the OMCSi–Au composite material.2.5 Preparation of signal antibody (Ab2) probes
According to previous reports with some minor modification,15,16 the OMCSi–Au products dispersed in DI water were stirred to obtain a homogeneous dispersion (6 mg mL−1), and then adjusted to pH 9.0 by using 0.05 M sodium hydroxide solution. Next, 100 μL of anti-NSE (1 mg mL−1) solution was submerged in OMCSi–Au suspension, maintained at 4 °C and shaken for 12 h under slow stirring. Afterward, into the above suspension, 1% BSA solution (0.1 mL) was added dropwise to block possible remaining active sites, and stirred at 4 °C for another 2 h. After centrifugation, the final bioconjugates were further washed by using Tris–HNO3 buffer, and resuspended in pH 7.4 Tris–HNO3 solution.2.6 Fabrication of the immunosensor
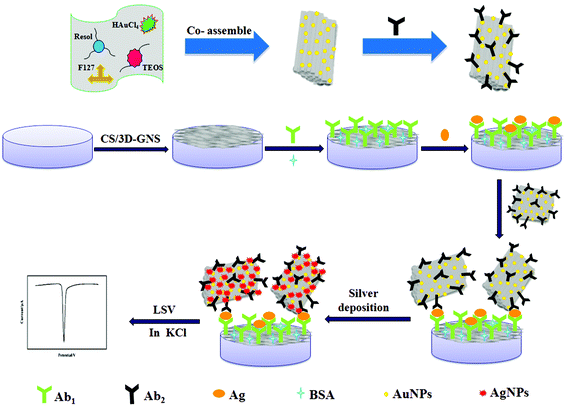
(i) As shown in Scheme 1A, 5 μL of 3D-GNS–CS solution (1 mg mL−1) was added dropwise on a pretreated glassy carbon electrode (GCE), and dried under an infrared lamp. (ii) The modified electrode was incubated in 2.5% GA solution (pH 7.4 PBS) for 2 h, followed by rinsing with water. (iii) 5 μL of 25 μg mL−1 anti-NSE (Ab1) were added dropwise onto the working electrode surface, and placed for 30 min at 25 °C, and was allowed to react at 4 °C overnight. (iv) Subsequently, after the removal of the excess antibody with the washing solution, the working electrode was blocked with 1% BSA solution for 60 min. Ultimately, the sensing interface was washed using the washing solution and the sensor was stored at 4 °C.2.7 Measurement procedure
To carry out the immunoreactions and electrochemical measurements, different concentrations of NES standards or serum samples were assayed using Ab1/3D-GNS–CS as the immunosensing probe as well as OMCSi–Au–Ab2 as the molecular tags. Firstly, the target antigen with various concentrations was dropped on the immunosensor surface, and incubated for 45 min at 25 °C. Next, the immunosensor was further incubated with 10 μL of Ab2–OMCSi–Au hybrids for 40 min at room temperature. After washing with the washing solution and pH 7.4 Tris–HNO3, 20 μL of silver enhancer solution was used for silver-deposition enhancement within 6 min at 25 °C in a dark incubator, followed by rinsing with water. Finally, the ASV was carried out on the immunosensor from −0.075 to 0.175 V at 50 mV s−1 in 1.0 M potassium chloride solution. The electrochemical responses at −0.028 V were recorded for quantitative measurement of NSE. The preparation procedure for the immunosensor is shown in Scheme 1.3. Results and discussion
3.1 Characterization of OMCSi–Au, OMCSi–Au–Ab2
The morphology of GO and 3D-GNS was characterized by SEM in Fig. 1. As shown in Fig. 1A, GO reveals a thin laminar structure and folded edges, while the 3D-GNS composite shows a highly porous structure because of the hydrothermal treatment (Fig. 1B), facilitating the self-assembly between GO and starch.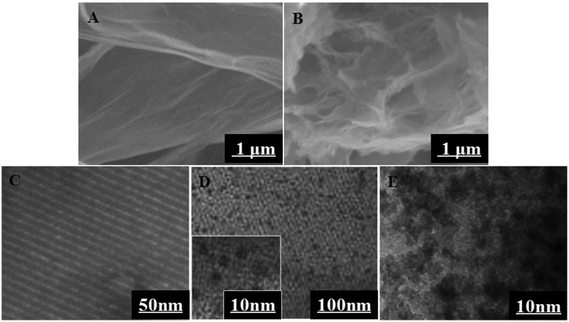 | ||
| Fig. 1 SEM images of the Go (A), and 3D-GNS (B); TEM images of the OMCSi (C), OMCSi–Au (D), and Ab2–OMCSi–Au (E). | ||
TEM images for OMCSi confirmed the stable uniform morphology with ordered pores (Fig. 1C). Notably, numerous monodispersed gold nanoparticles are highly dispersed into the carbon–silica matrix, which are located inside mesochannels and do not destroy the structure of OMCSi (Fig. 1D). When Ab2 was bound to OMCSi–Au, the surface of the OMCSi–Au became rougher, uniformly and obviously coated with an amorphous thin layer (Fig. 1E), which verified the successful preparation of Ab2–OMCSi–Au nanoprobes in Fig. 1E.
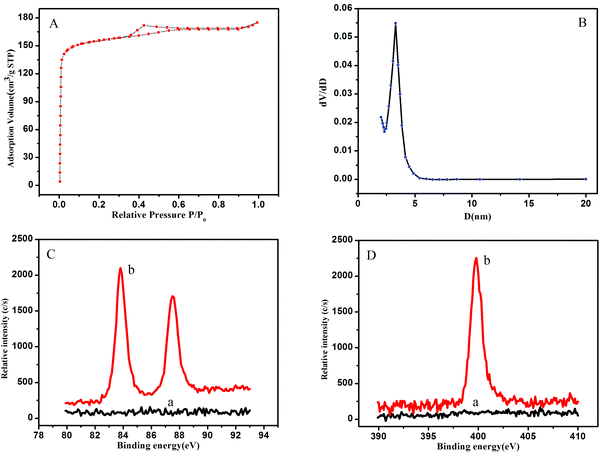
The N2 sorption–desorption isotherm (Fig. 2A) of the OMCSi–Au materials reveals typical type-IV curves, characteristic of mesoporous solids with a uniform pore size. Derived from the adsorption branches by the BJH model, the pore size distribution curve displayed relatively uniform mesopores (Fig. 2B). The mesopore size of the OMCSi–Au sample is about 3.2 nm, the BET surface area is 486 m2 g−1, and the pore volume is 0.29 cm3 g−1.
The synthesis of OMCSi–Au was further characterized by XPS, as shown in Fig. 2C. In contrast to the XPS spectrum of OMCSi (curve a), obvious diffused peaks at 83.90 and 87.57 eV were observed in the spectrum of OMCSi–Au, which can be assigned to Au 4f (curve b). As is well known, SH or amine groups in protein can easily interact with AuNPs, thus the antibodies could be accessible to loading on the surface of OMCSi–Au to obtain labeled Ab2.45,46 As shown in Fig. 2D, an obvious N 1s peak can be observed at 399.50 eV in the XPS spectra of labeled Ab2 (curve b), whereas the XPS spectra of the tracing tag showed no N 1s peak (curve a). All these results further verified that the antibodies were successfully immobilized on the tracing tag.
3.2 Electrochemical characterization of the immunosensor
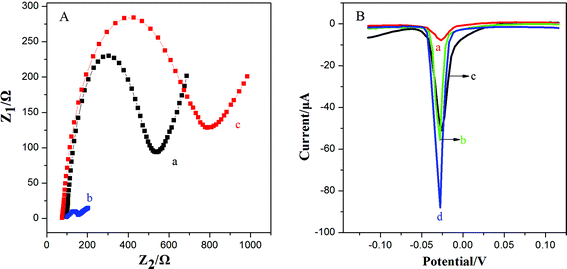
This work utilized 3D-GNS to construct an ultrasensitive immunosensor for NSE detection. After 3D-GNS was doped with chitosan, the resulting CS/3D-GNS modified electrode revealed much lower electron transfer resistance than CS/GCE in Fig. 3A (curves a and b). After Ab1 was assembled to CS/3D-GNS/GCE with CS through the GA cross-linker, the resistance increased greatly (Fig. 3A, curves c), manifesting that the antibodies had been successfully modified on the electrode surface.Fig. 3B shows the linear sweep stripping voltammetric curve of different modified electrodes in 1.0 M potassium chloride solution. When Ab2–OMCSi–Au was coupled onto the NSE/Ab1–CS/3D-GNS modified electrode and AgNPs were formed, a sharp stripping current signal was obtained (curve d), whereas the Ab2–OMC–Au label tags with the NSE/Ab1–CS/3D-GNS modified electrode showed a smaller response after the same incubation processes (curve b), while a weaker current peak was also present on the Ab2–OMSi–Au label tags assembled in the same way of incubation processes with NSE/Ab1–CS/3D-GNS (curve c). This phenomenon revealed that the OMCSi materials could lead to better conductivity and higher sensitivity than OMC or OMSi, which may be attributed to the adjustable compositions between carbon and silica in the OMCSi composite materials. Moreover, in comparison with curve d, the Ab2–OMCSi–Au/NSE/Ab1–CS modified electrode (curve a) showed a significantly poor signal peak, which indicated that the existence of the 3D-GNS composite film on the electrode can quite efficiently improve the detection sensitivity, which can be attributed to its porous three dimensional architecture, good electrochemical stability and good electron transfer ability, leading to a higher sensitivity of the proposed strategy.
3.3 Optimization of experimental conditions
In this study, with the increase of silver enhancement solution concentration or deposition time, the deposition of silver on the electrode surface could increase, which could produce a higher background current. Thus, the ratio of signal to noise (S/N) was used to state the optimization of silver deposition conditions in this work. Upon diluting silver enhancer solution successively, the ratio of S/N significantly increased, and reached the maximum signal at 30-fold dilution. With the increase in silver deposition time, the peak current increased from 1 min to 6 min, and then decreased after 6 min. Thus, 30-fold dilution of silver enhancer solutions was chosen for silver deposition, and a duration of 6 min was considered the optimal deposition time.To improve the stability of the method and achieve an optimal response signal, the ratio of starch and GO for preparation of 3D-GNS was also crucial. Various weight ratios of starch and GO of 5![[thin space (1/6-em)]](https://www.rsc.org/images/entities/char_2009.gif) :
:![[thin space (1/6-em)]](https://www.rsc.org/images/entities/char_2009.gif) 1, 3
1, 3![[thin space (1/6-em)]](https://www.rsc.org/images/entities/char_2009.gif) :
:![[thin space (1/6-em)]](https://www.rsc.org/images/entities/char_2009.gif) 1, 2
1, 2![[thin space (1/6-em)]](https://www.rsc.org/images/entities/char_2009.gif) :
:![[thin space (1/6-em)]](https://www.rsc.org/images/entities/char_2009.gif) 1, 1
1, 1![[thin space (1/6-em)]](https://www.rsc.org/images/entities/char_2009.gif) :
:![[thin space (1/6-em)]](https://www.rsc.org/images/entities/char_2009.gif) 1, 1
1, 1![[thin space (1/6-em)]](https://www.rsc.org/images/entities/char_2009.gif) :
:![[thin space (1/6-em)]](https://www.rsc.org/images/entities/char_2009.gif) 2, 1
2, 1![[thin space (1/6-em)]](https://www.rsc.org/images/entities/char_2009.gif) :
:![[thin space (1/6-em)]](https://www.rsc.org/images/entities/char_2009.gif) 3, 1
3, 1![[thin space (1/6-em)]](https://www.rsc.org/images/entities/char_2009.gif) :
:![[thin space (1/6-em)]](https://www.rsc.org/images/entities/char_2009.gif) 5 (w/w) were used. A higher or lower influence on the formation of the 3D architecture, and a higher concentration of starch would reduce the current response of the sensor due to its non-conductivity. Considering the analytical response and stability characteristics, the 1
5 (w/w) were used. A higher or lower influence on the formation of the 3D architecture, and a higher concentration of starch would reduce the current response of the sensor due to its non-conductivity. Considering the analytical response and stability characteristics, the 1![[thin space (1/6-em)]](https://www.rsc.org/images/entities/char_2009.gif) :
:![[thin space (1/6-em)]](https://www.rsc.org/images/entities/char_2009.gif) 2 weight ratio of starch and GO was used for the preparation of 3D-GNS.
2 weight ratio of starch and GO was used for the preparation of 3D-GNS.
The effect of the incubation temperature from 10 to 50 °C on the immunosensor was studied. After incubation with 5 ng mL−1 NSE for 40 min, the immunosensor had a maximum stripping current response at 35 °C. Nevertheless, higher temperature could damage the antibody–antigen complex. Considering the analytical simplification, and the lifetime, response characteristics, and the activity of biomolecules, all experiments were performed at room temperature.
Another important factor that affects the immunosensor is the incubation time. When the increment of incubation time was from 10 min to 70 min, the stripping peak current increased for NSE, but a longer incubation time would not raise the response signal after 40 min, thus 40 min of incubation time was used for the detection of NSE.
3.4 Analytical performance
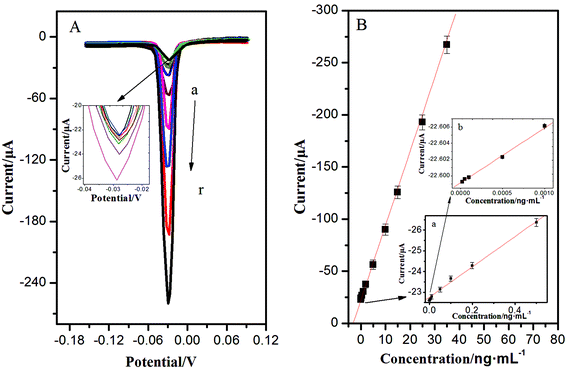
With a sandwich-type immunoreaction, the immunosensor deposited with AgNPs can be easily measured by ASV, showing a significant stripping peak at −0.028 V. This sharp stripping peak was in favour of acquiring high detection precision. Under optimum conditions, the calibration plots between the corresponding current response and the target concentrations showed a good linear relationship in the ranges from 0.02 pg mL−1 to 35 ng mL−1; the increase of peak current was proportional to the analyte concentration, and the detection limit was 0.008 pg mL−1 for NSE (the mean blank value plus three times s.d.) (Fig. 4). Compared with previous studies for detection of NSE in Table 1, the as-proposed immunoassay had exhibited better stability, easier operation, and lower detection limit. This is mainly due to the unique 3D immunoelectrode, the essential performance of a high surface-to-volume ratio of OMCSi–Au, and the aggregation-free AuNPs. Numerous AuNPs could greatly and catalytically amplify the silver deposition. What's more, the quantitative detection of AgNPs was carried out through a one-step stripping analysis without the addition of substrate or any pretreatment.| Method | Detection limit (ng mL−1) | Linear range (ng mL−1) | Incubation time of NSE | Ref. |
|---|---|---|---|---|
| Microfluidic competitive enzyme immunoassay based CRET | 2.1 × 10⁻⁷ | 4.2 × 10⁻⁷ to 4.4 × 10⁻⁵ | 35 min | 47 |
| Alternating current impedance protocol based electrochemical immunoassay | 5.0 × 10⁻⁴ | 1 × 10⁻³ to 5 × 10⁻² | 60 min | 48 |
| NiHCFNPs/DA based electrochemical immunoassay | 3.0 × 10⁻⁴ | 0.001 to 100 | 30 min | 49 |
| ZnCdHgSe QDs/PDPIT/ITO based photoelectrochemical immunosensor | 2.0 × 10⁻⁴ | 1 × 10⁻³ to 100 | 30 min | 50 |
| Dual-color QD based fluorescence immunosensor | 1.0 | 3 to 100 | 45 min | 51 |
| Multiplexing determination by immunocapture LC-MS/MS | 2.1 × 10⁻¹ | 5 to 500 | — | 52 |
| Au NPs/L-tryptophan/caffeic acid based electrochemical immunosensor | 8 × 10⁻² | 0.2 to 25 | 30 min | 53 |
| Au–silica based electrochemical immunosensor | 5 × 10⁻² | 0.1 to 2000 | 40 min | 54 |
| Functional CNTs/Au based electrochemical immunosensor | 3.3 × 10⁻² | 0.1 to 2000 | 60 min | 55 |
| Ru–SiO2@PEI based ECL immunosensor | 1.0 × 10⁻⁵ | 1.0 × 10⁻⁵ to 10 | 80 min | 56 |
| Plasmonic gold chip based NIR | 0.15 | 2.67 to 100 | 120 min | 57 |
| PDA coated plasmonic chip based SPFS | 0.5/1.4 | 1 to 100 | 15 min | 58 |
| OMCSi–Au/3D-GNS induced silver deposition based electrochemical immunoassay | 8.0 × 10⁻⁶ | 1.0 × 10⁻⁵ to 35 | 40 min | This work |
3.5 Specificity, stability, and reproducibility of the immunosensors
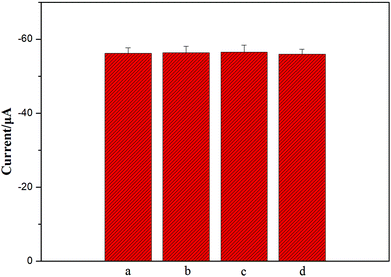
To further investigate the specificity of the as-prepared method for NSE detection, 1 ng mL−1 alpha fetoprotein (AFP), 1 ng mL−1 human chorionic gonadotrophin (HCG), and 1 ng mL−1 carcinoembryonic antigen (CEA) were the possible interferents to evaluate the specificity of this sensing strategy. Two different types of 5 ng ml−1 NSE incubation solution were separately exposed to the immunosensors: one with interference and the other without interference. Each solution was measured five times per run. The relative standard deviations (RSD) were about 0.33%, 0.52%, and 0.41% for NSE, respectively (Fig. 5). Meanwhile, the response of a mixture including 5 ng mL−1 NSE, 1 ng mL−1 AFP, 1 ng mL−1 HCG, and 1 ng mL−1 CEA was also detected, and 2.3% of RSD was obtained. Obviously, there were no apparent current changes when the incubation solution contained interfering agents (Fig. 5), and the results confirm good specificity of the as-prepared biosensor.Meanwhile, when the immunosensors were stored at 4 °C, the peak currents of the immunosensors all dropped less than 5% and 10% of their initial responses after a storage period of 2 weeks and one month, respectively. Apparently, the fact shows that the immunosensors are of good stability, and highlights that the porous 3D graphene-starch architecture modified on the immunosensor surface has high stability for the immunosensors.
The interassay and intra-assay precisions of the established biosensor were estimated at two concentration levels (5, 20 ng mL−1) five times. For interassay detection, the coefficients of variation (CV) were 4.6% and 5.1%, while the CVs were 3.0% and 3.9% for intra-assay detection, respectively, showing that the immunosensor has acceptable reproducibility and good precision.
3.6 Clinical application in human serum
The reliability and application of the established strategy were evaluated by analytical determinations of actual serum samples. We collected several individuals with lung cancer or normal serum specimens according to the rules of the local ethical committee, which were from the Southern Hospital of Guangzhou, China, and informed consent was obtained for any experimentation with human subjects. Prior to the assay, the serum samples with appropriate pretreatment were necessary. Firstly, the serum sample supernatants were obtained after centrifugation at 2500 rpm for 6 min under 4 °C. Secondly, when the serum NSE marker level was beyond the calibration range, we would dilute them appropriately with 0.02 M pH 7.4 PBS. Five clinical serum samples were evaluated with the proposed method, and comparison studies were performed with the traditional ELISA method. The results are listed in Table 2; the relative errors with acceptable results between the two methods were less than 4%. In addition, recovery experiments were also performed by adding different amounts of NSE into human serum, and the recoveries were in the range of 97–103%. These results showed that the established strategy has good potential for clinical sample analysis and diagnosis.| Sample | Signal response of the proposed immunosensor (μA) | Proposed immunosensor (ng mL−1, n = 5) | The reference method (ELISA) (ng mL−1) | Relative deviation (%) |
|---|---|---|---|---|
| 1 | 117.68 | 13.76 | 13.51 | 1.85 |
| 2 | 27.09 | 0.65 | 0.67 | −2.99 |
| 3 | 46.44 | 3.45 | 3.36 | 2.68 |
| 4 | 92.11 | 10.06 | 10.28 | −2.14 |
| 5 | 22.80 | 0.027 | 0.026 | 3.85 |
4. Conclusion
An ultrasensitive electrochemical immunosensing method with a triple signal amplification strategy for cancer biomarkers was proposed, which combined 3D-GNS/CS as the matrix, OMCSi–Au materials as the label, and AuNP-induced silver deposition on the immunosensor surface. In particular, no specific detection conditions were required in all analysis processes, such as acid dissolution, metal pretreatment, deoxygenation, and high stripping potential, which not only simplified the detection process, but also reduced the time consumption. The proposed immunosensor showed great performance for NSE with acceptable reproducibility, stability, reliable detection, and high sensitivity, and it provides great potential in clinical application.Conflicts of interest
There are no conflicts of interest to declare.Acknowledgements
We greatly appreciate the support from the National Natural Science Foundation of China (No. 21705084), the Natural Science Foundation of Shandong Province of China (No. ZR2017BB074), the National Training Program of Innovation and Entrepreneurship for Undergraduates (No. 201710431040), and the Special Funds for Taishan Scholars Project.References
- Y. Q. Zhang, A. Rana, Y. W. Stratton, M. F. Czyzyk-Krzeska and L. Esfandiari, Anal. Chem., 2017, 89, 9201–9208 CrossRef CAS PubMed.
- M. K. Sethi, W. S. Hancock and S. Fanayan, Acc. Chem. Res., 2016, 49, 2099–2106 CrossRef CAS PubMed.
- Y. Fan, J. T. Liu, Y. Wang, J. P. Luo, H. R. Xu, S. W. Xu and X. X. Cai, Biosens. Bioelectron., 2017, 95, 60–66 CrossRef CAS PubMed.
- X. Zhang, H. Ke, Z. M. Wang, W. W. Guo, A. M. Zhang, C. S. Huang and N. Q. Jia, Analyst, 2017, 142, 2253–2260 RSC.
- M. M. Vareiro, J. Liu, W. Knoll, K. Zak, D. Williams and A. T. A. Jenkins, Anal. Chem., 2005, 77, 2426–2431 CrossRef CAS PubMed.
- D. A. Palmer and J. N. Miller, Anal. Chim. Acta, 1995, 303, 223–230 CrossRef CAS.
- R. Wang, W. D. Liu, A. J. Wang, Y. D. Xue and J. J. Feng, Biosens. Bioelectron., 2018, 99, 458–463 CrossRef CAS PubMed.
- Y. Q. Lin, K. Y. Liu, C. Wang, L. B. Li and Y. X. Liu, Anal. Chem., 2015, 87, 8047–8051 CrossRef CAS PubMed.
- Y. R. Liang, Z. M. Zhang, Z. J. Liu, K. Wang and Z. Zhang, Biosens. Bioelectron., 2017, 91, 199–202 CrossRef CAS PubMed.
- G. Dutta and P. B. Lillehoj, Analyst, 2017, 142, 3492–3499 RSC.
- Z. B. Chen and M. H. Lu, Anal. Chim. Acta, 2017, 979, 24–30 CrossRef CAS PubMed.
- Y. F. Wu, P. Xue, Y. J. Kang and K. M. Hui, Anal. Chem., 2013, 85, 3166–3173 CrossRef CAS PubMed.
- S. M. Majd and A. Salimi, Anal. Chim. Acta, 2018, 1000, 273–282 CrossRef PubMed.
- X. B. Jia, T. T. Song, Y. Liu, L. L. Meng and X. Mao, Anal. Chim. Acta, 2017, 969, 57–62 CrossRef CAS PubMed.
- G. S. Lai, H. L. Zhang, T. Tamanna and A. Yu, Anal. Chem., 2014, 86, 1789–1793 CrossRef CAS PubMed.
- W. L. Gao, W. T. Wang, S. H. Yao, S. Wu, H. L. Zhang, J. S. Zhang, F. X. Jing, H. J. Mao, Q. H. Jin, H. Cong, C. P. Jia, G. J. Zhang and J. L. Zhao, Anal. Chim. Acta, 2017, 958, 77–84 CrossRef CAS PubMed.
- Y. M. Shlyapnikov and V. N. Morozov, Anal. Chim. Acta, 2017, 966, 47–53 CrossRef CAS PubMed.
- J. Tang, D. P. Tang, R. Niessner, G. N. Chen and D. Knopp, Anal. Chem., 2011, 83, 5407–5414 CrossRef CAS PubMed.
- Q. Zhou, G. H. Li, Y. J. Zhang, M. Zhu, Y. K. Wan and Y. F. Shen, Anal. Chem., 2016, 88, 9830–9836 CrossRef CAS PubMed.
- Y. Shi, X. Y. Zhou, J. Zhang, A. M. Bruck, A. C. Bond, A. C. Marschilok, K. J. Takeuchi, E. S. Takeuchi and J. G. Yu, Nano Lett., 2017, 17, 1906–1914 CrossRef CAS PubMed.
- J. Teng, X. Zeng, X. Xu and J. G. Yu, Mater. Lett., 2018, 214, 31–33 CrossRef CAS.
- M. Azahar Ali, K. Mondal, Y. Y. Jiao, S. Oren, Z. Xu, A. Sharma and L. Dong, ACS Appl. Mater. Interfaces, 2016, 8, 20570–20582 CrossRef PubMed.
- X. C. Dong, H. Xu, X. W. Wang, Y. X. Huang, M. B. Chan-Park, H. Zhang, L. H. Wang, W. Huang and P. Chen, ACS Nano, 2012, 6, 3206–3213 CrossRef CAS PubMed.
- F. N. Xi, D. J. Zhao, X. W. Wang and P. Chen, Electrochem. Commun., 2013, 26, 81–84 CrossRef CAS.
- P. Si, X. C. Dong, P. Chen and D. H. Kim, J. Mater. Chem. B, 2013, 1, 110–115 RSC.
- Y. J. Han, Z. M. Luo, L. H. Yuwen, J. Tian, X. R. Zhu and L. H. Wang, Appl. Surf. Sci., 2013, 266, 188–193 CrossRef CAS.
- S. Chairam, W. Konkamdee and R. Parakhun, J. Saudi Chem. Soc., 2017, 21, 656–663 CrossRef CAS.
- N. P. Bacalzo Jr., L. P. Go, C. J. Querebillo, P. Hildebrandt, F. T. Limpoco and E. P. Enriquez, ACS Appl. Nano Mater., 2018, 1, 1247–1256 CrossRef.
- B. Arce, J. M. J. Santillán, D. M. Arboleda, D. Muraca, L. B. Scaffardi and D. C. Schinca, J. Phys. Chem. C, 2017, 121, 10501–10513 CrossRef.
- F. Ortega, L. Giannuzzi, V. B. Arce and M. A. García, Food Hydrocolloids, 2017, 70, 152–162 CrossRef CAS.
- G. S. Lai, J. Wu, H. X. Ju and F. Yan, Adv. Funct. Mater., 2011, 21, 2938–2943 CrossRef CAS.
- Y. S. Fang, X. J. Huang, L. S. Wang and J. F. Wang, Biosens. Bioelectron., 2015, 64, 324–332 CrossRef CAS PubMed.
- J. Li, J. Wu, L. Cui, M. M. Liu, F. Yan and H. X. Ju, Analyst, 2016, 141, 131–136 RSC.
- Y. He, S. B. Xie, X. Yang, R. Yuan and Y. Q. Chai, ACS Appl. Mater. Interfaces, 2015, 7, 13360–13366 CrossRef CAS PubMed.
- J. S. Lee, A. K. R. Lytton-Jean, S. J. Hurst and C. A. Mirkin, Nano Lett., 2007, 7, 2112–2115 CrossRef CAS PubMed.
- S. J. Park, T. A. Taton and C. A. Mirkin, Science, 2002, 295, 1503–1506 CrossRef CAS PubMed.
- J. Zhang, Z. B. Xiong and J. D. Chen, Sens. Actuators, B, 2017, 246, 623–630 CrossRef CAS.
- K. Y. Chumbimuni-Torres, Z. Dai, N. Rubinova, Y. Xiang, E. Pretsch, J. Wang and E. Bakker, J. Am. Chem. Soc., 2006, 128, 13676–13677 CAS.
- D. J. Lin, C. Y. Mei, A. L. Liu, H. L. Jin, S. Wang and J. C. Wang, Biosens. Bioelectron., 2015, 66, 177–183 CrossRef CAS PubMed.
- P. Lu, C. Xing, H. J. Li, X. K. Gai, Q. H. Wei, L. Tan, C. X. Lu, W. Z. Shen, R. Q. Yang and N. Tsubaki, Int. J. Hydrogen Energy, 2016, 41, 10680–10687 CAS.
- M. E. Davis, Nature, 2002, 417, 813–821 CrossRef CAS PubMed.
- M. Si, D. Feng, L. B. Qiu, D. S. Jia, A. A. Elzatahry, G. F. Zheng and D. Y. Zhao, J. Mater. Chem. A, 2013, 1, 13490–13495 CAS.
- Y. S. Fang, Q. Hu, X. T. Yu and L. S. Wang, Sens. Actuators, B, 2018, 258, 238–245 CrossRef CAS.
- D. Y. Zhao, J. Am. Chem. Soc., 2012, 134, 17653–17660 CrossRef PubMed.
- D. J. Lin, J. Wu, M. Wang, F. Yan and H. X. Ju, Anal. Chem., 2012, 284, 3662–3668 CrossRef PubMed.
- J. Ye, L. P. Zhu, M. X. Yan, Q. J. Zhu, Q. Q. Lu, J. S. Huang, H. Cui and X. R. Yang, Anal. Chem., 2019, 91, 1524–1531 CrossRef CAS PubMed.
- T. Yang, M. Vdovenko, X. Jin, I. Y. Sakharov and S. Zhao, Electrophoresis, 2014, 35, 2022–2028 CrossRef CAS PubMed.
- A. C. Barton, F. Davis and S. P. J. Higson, Anal. Chem., 2008, 80, 9411–9416 CrossRef CAS PubMed.
- J. Han, Y. Zhuo, Y. Q. Chai, Y. L. Yuan and R. Yuan, Biosens. Bioelectron., 2012, 31, 399–405 CAS.
- X. Y. Yu, Y. Y. Wang, X. M. Chen, K. B. Wu, D. C. Chen, M. Ma, Z. J. Huang, W. Z. Wu and C. Y. Li, Anal. Chem., 2015, 87, 4237–4244 CAS.
- H. Li, Z. Cao, Y. Zhang, C. Lau and J. Lu, Analyst, 2011, 136, 1399–1405 RSC.
- S. B. Torsetnes, M. S. Levernæs, M. N. Broughton, E. Paus, T. G. Halvorsen and L. Reubsaet, Anal. Chem., 2014, 86, 6983–6992 CAS.
- W. B. Lu, L. Tao, Y. Wang, X. W. Cao, J. Ge, J. Dong and W. P. Qian, Ionics, 2015, 21, 1141–1152 CrossRef CAS.
- B. Wang, T. Liang, J. Li, H. Yu and X. Y. Chu, Int. J. Electrochem. Sci., 2017, 12, 7607–7615 CrossRef CAS.
- X. T. Yu, W. Cheng, Q. Li, C. H. Luo, L. Yan, D. C. Zhang, Y. B. Yin, S. J. Ding and H. X. Ju, Talanta, 2012, 93, 433–438 Search PubMed.
- L. M. Zhou, J. S. Huang, B. Yu and T. Y. You, Sci. Rep., 2016, 6, 22234 CrossRef CAS PubMed.
- B. Liu, Y. L. Li, H. Wan, L. Wang, W. Xu, S. J. Zhu, Y. Y. Liang, B. Zhang, J. T. Lou, H. J. Dai and K. Qian, Adv. Funct. Mater., 2016, 26, 7994–8002 CrossRef CAS.
- M. Toma, S. Izumi and K. Tawa, Analyst, 2018, 143, 858–864 RSC.
| This journal is © The Royal Society of Chemistry 2019 |

