
Fabrication of a self-assembled and flexible SERS nanosensor for explosive detection at parts-per-quadrillion levels from fingerprints†
Thakshila
Liyanage
a,
Ashur
Rael
a,
Sidney
Shaffer
a,
Shozaf
Zaidi
a,
John V.
Goodpaster
a and
Rajesh
Sardar
 *ab
*ab
aDepartment of Chemistry and Chemical Biology, Indiana University-Purdue University Indianapolis, 402 N. Blackford Street, Indianapolis, Indiana 46202, USA. E-mail: rsardar@iupui.edu
bIntegrated Nanosystems Development Institute, Indiana University-Purdue University Indianapolis, 402 N. Blackford Street, Indianapolis, Indiana 46202, USA
First published on 5th February 2018
Abstract
Apart from high sensitivity and selectivity of surface-enhanced Raman scattering (SERS)-based trace explosive detection, efficient sampling of explosive residue from real world surfaces is very important for homeland security applications. Herein, we demonstrate an entirely new SERS nanosensor fabrication approach. The SERS nanosensor was prepared by self-assembling chemically synthesized gold triangular nanoprisms (Au TNPs), which we show display strong electromagnetic field enhancements at the sharp tips and edges, onto a pressure-sensitive flexible adhesive film. Our SERS nanosensor provides excellent SERS activity (enhancement factor = ∼6.0 × 10⁶) and limit of detection (as low as 56 parts-per-quadrillions) with high selectivity by chemometric analyses among three commonly military high explosives (TNT, RDX, and PETN). Furthermore, the SERS nanosensors present excellent reproducibility (<4.0% relative standard deviation at 1.0 μM concentration) and unprecedentedly high stability with a “shelf life” of at least 5 months. Finally, TNT and PETN were analyzed and quantified by transferring solid explosive residues from fingerprints left on solid surfaces to the SERS nanosensor. Taken together, the demonstrated sensitivity, selectivity, and reliability of the measurements as well as with the excellent shelf life of our SERS nanosensors obviate the need for complicated sample processing steps required for other analytical techniques, and thus these nanosensors have tremendous potential not only in the field of measurement science but also for homeland security applications to combat acts of terror and military threats.
Introduction
With the prevalence of explosives in terrorist attacks, inexpensive, swift, accurate, reliable, and reproducible trace residue detection on real world surfaces without liquid–liquid extraction or swabbing is extremely important, but remains a substantial challenge for homeland security. In this article, we report fabrication of a novel label-free, surface-enhanced Raman scattering/spectroscopy (SERS) nanosensor by “self-assembling” chemically synthesized gold triangular nanoprisms (Au TNPs) on commercially available, pressure-sensitive flexible adhesive film. Additionally, this nanosensor is capable of detecting three different explosives (TNT, RDX, and PETN) at parts-per-quadrillion (ppq) levels with 100% classification accuracy, as determined with chemometric analyses. The unreactive nature of the adhesive film allows unprecedented stability of our nanosensor over at least 5 months under normal laboratory conditions, which overcomes the most pressing problem with existing SERS nanosensors.Raman spectroscopy observes vibrational-frequency modes such that the Raman signal from a molecule forms a characteristic spectrum or “molecular fingerprint”. Further, the non-destructive nature of Raman spectroscopy provides an additional chemical analysis advantage. Moreover, it is possible through SERS to not only to amplify the normally weak Raman signal of a molecule by bringing it in close contact with metallic nanostructures, but also to avoid strong background fluorescence. The nanostructure acts as a SERS substrate, and the resulting SERS signal amplification comes from the localized surface plasmon resonance (LSPR) properties1 of the nanostructure, which arise from collective oscillations of its conduction electrons when their resonance frequency matches that of the incident photons.2,3 The LSPR properties create strong (EM)-field enhancements (“hot spots”) around the nanostructures through EM-field localization in which metallic nanostructures act as nanoantennas, and field enhancement is considered to be the major contributor to effective SERS enhancement.4 The efficiency of SERS is characterized by the enhancement factor (EF) for a given SERS substrate.
The EF is defined by Raman signal amplification under normal conditions (i.e., without using metallic nanostructures). Low EF values are ∼10–103 and more typical values are in the range of ∼105–106. Nanostructures with a large numbers of hot spots and electrical fields with higher amplitudes make excellent SERS substrates and provide higher SERS sensitivity.2,3,5 In this context, chemically-synthesized Au TNPs display strong EM-field enhancement at their sharp tips6,7 as compared to spherical Au nanoparticles and Au nanorods that are commonly used as SERS substrates for trace explosive detection. In this regard, Ag nanostructures are capable of displaying higher SERS EF2,8 and thus are commonly used in explosive detection.9 However, Au is very stable under harsh conditions such as extremely hot and humid environments, and Au photobleaching/photodecomposition in solution under laser excitation in SERS analysis is negligible compared to Ag, which decomposes much faster under similar conditions. Finally, Au nanostructures display strong binding affinity for nitrogen-containing explosive molecules.10–12 For comparison, we have experimentally observed SERS EF of an ∼6.0 × 10⁶ for our Au TNT-based SERS nanosensor, which exhibits high stability.
An important prerequisite for advanced SERS-based detection and quantification is an efficient sampling process in which analytes can be directly transferred to the sensors without compromising their characteristics. Recently, various flexible nanostructure-based SERS sensors have been fabricated for analysis of several different types of analytes including trace explosives.13–16 Among them, cotton-17 and paper-based18 SERS swabs showed good sensitivity. However, the lack of appropriate attachment of three-dimensional nanostructures onto the surface of these SERS sensors hinders the proper sampling efficiency from rugged or uneven surfaces. Furthermore, for the swab-based explosive analysis, the sample collection requires swabbing and solvent-extraction procedures that could change sample characteristics, specifically in a fingerprint impression. To obviate the current challenges, we have developed an entirely new approach of assembling Au TNTs onto a flexible adhesive surface through a programmable “stamping” technique to prepare label-free SERS “nanosensors”, as illustrated in Fig. 1. A unique advantages of our nanosensor is that the explosive molecules can come directly into contact with the TNPs and thus enhance the sensitivity of the measurements with limits of detection as low as ∼900, 50, and 50 ppq for TNT, RDX, and PETN, respectively. These limits are at least 103 fold better than other SERS-based methods and 106 fold more sensitive than gas chromatography-mass spectrometry (GC-MS).19,20 Most importantly, we have also demonstrated that our SERS nanosensor detects trace amounts of explosives transferred from a fingerprint to simulate real-world applications for homeland security applications.21 Taken together, the simplicity of our SERS-based nanosensor fabrication along with its unprecedentedly high sensitivity and excellent selectivity will have broad implications not only for the field of measurement science2,3,8,22 but also on trace explosive detection, and thus will help reduce the threat to public safety.
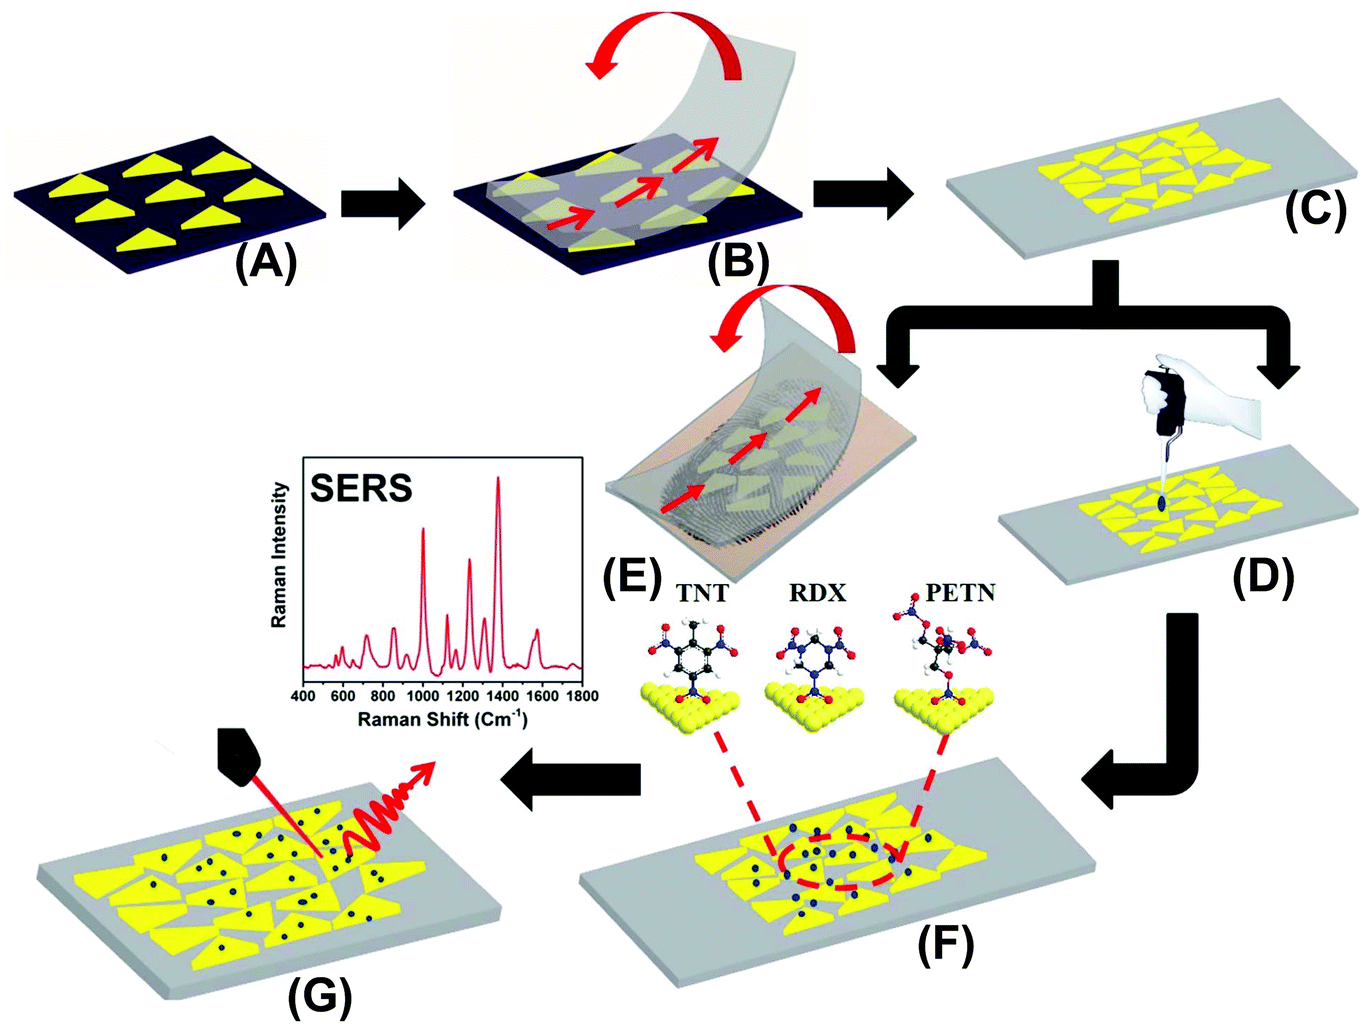 | ||
| Fig. 1 Design of Au TNP- based SERS nanosensor for detection of trace explosives: (A) a self-assembled layer of Au TNPs onto an APTES functionalized glass coverslip were prepared. (B) Au TNPs were transferred to a flexible adhesive substrate by the stamping technique, which produced a SERS nanosensor (C). Explosive molecules either drop-casted from a solution (D) or transferred from a thumb impression (E) directly onto the SERS nanosensor (F). (G) SERS spectra were collected using benchtop Raman spectrometer at a 785 nm diode laser excitation. The fabrication approach of SERS nanosensor is a schematic representation; none of the figures present an exact number and/or density of Au TNPs in each step. The image is not to scale. | ||
Experimental section
Chemicals
Chloro(triethylphosphine) gold(I) (Et3PAuCl, 97%), poly(methylhydrosiloxane) (PMHS, Mn = 1700–3300), trioctylamine (TOA, 98%), ACS grade acetonitrile (CH3CN, 99.9%), methanol (99.8%), and (3-aminopropyl)-triethoxysilane, (APTES, 94%) were purchased from Sigma-Aldrich, and ethanol (190 proof) was from Decon laboratories. Glass coverslips (Cat. No. 12548C) were purchased from Fisher Scientific. RBS35 Detergent was obtained from Thermo Scientific and used as received. A Thermo Scientific Barnstead Nanopure system was utilized to achieve water Purity at 18.2 MΩ cm and the same nanopure water was used for all cleaning processes. Separate explosive solutions of pentaerythritol tetranitrate (PETN), cyclotrimethylenetrinitramine (RDX) 2,4,6 trinitrotoluene (TNT), 2,4-dinitrotoluene (DNT), and trinitrobenzene (TNB) were purchased from RESTEK Chromatography Products and Solutions. Scotch magic-tape (Cat. No. 810) was purchased from 3M corporation to serve as our flexible adhesive film. Milligram quantities of PETN and TNT were obtained from explosive purchased via Bureau of alcohol, Tobacco, and Firearms and Explosives (STF) license held by J. V. G.SERS measurements
SERS analysis was performed using a Foster + Freman Foram 785 HP Raman system with a 785 nm diode laser excitation source with 20 mW of power and 5 μm spot size. The SERS data were acquired for each nanosensor with 10 scans (1 × 20 mW, 9 × 80 mW) from 400–2000 cm−1, 16 s acquisition time and a 5 μM laser spot diameter. Automatic baseline correction was performed in OMNIC software before acquired spectra were plotted.Chemometric analysis
All chemometric analysis was conducted using JMP Software (SAS, Cary, NC). The SERS spectra were first normalized to unit vector length by dividing the intensity at each wavelength by the square root of the sum of squares of all intensities. The normalized spectra were then analyzed using principal components analysis (PCA) and linear discriminant analysis (LDA) to build a classification model. The model was testing using leave-one-out cross-validation to generate classification accuracies for the various explosives.Preparation of SERS nanosensor and explosive detection
The preparation of our flexible and adhesive SERS nanosensor is described in Fig. 1. Au TNPs with ∼42 nm edge lengths were synthesized according to our literature procedure (see ESI and Fig. S1†).23–26 Au TNPs in acetonitrile were immobilized onto a APTES-functionalized glass substrate through incubation to form a self-assembled layer of TNPs (A), which avoided unwanted Au TNP aggregation. The Au TNP-bound coverslips were washed thoroughly with acetone to remove loosely adsorbed organic compounds (PMHS and TOA) and dried under nitrogen flow. 3M adhesive tape was placed on the Au TNP-containing glass coverslip, pressed gently with the thumb, and removed at a 90° angle (B). This procedure resulted in successful transfer of the self-assembled Au TNPs from the glass to a flexible adhesive substrate by stamping, producing the nanosensor (C). We selected 3M adhesive tape for SERS nanosensor fabrication because has a less “sticky” nature that should extract a solid residue from the contaminated surface, whereas “stickier” adhesive would be expected to destroy the sample. The explosive detection and quantification were examined via two different methods. Firstly, each explosive solution in methanol (2.0 microliter (μL) at a time for three times) was separately drop-casted on a SERS nanosensor, followed by slow evaporation of solvent at room temperature (D). Secondly, our adhesive nanosensors were directly placed onto glass slides containing explosive molecules as thumb impressions and these were directly transferred onto the surface of Au TNPs (E). In both cases, the explosives molecules were physorbed onto the Au TNP surface through Au–N interactions (F). SERS spectra were collected using a bench-top Raman spectrometer (G). The EFs and limits of detection (LODs) were determined using literature procedures,18,27 which are described in the ESI.†Results and discussion
Microscopy and spectroscopy characterizations of SERS nanosensor and its explosive detection ability
To construct the self-assembled SERS nanosensors, we selected the –NH2 surface terminal group to bind to Au TNP because it forms relative weak electrostatic interactions with metal nanostructures28 that can be broken by applying moderately strong mechanical force such as found with lifting the adhesive tape substrate as described in the Experimental section. We characterized our SERS nanosensor by scanning electron microscopy (SEM) as shown in Fig. 2A and B. The images show randomly distributed and oriented Au TNPs on the adhesive substrate. Such disorder creates a unique SERS substrate because of “accidental” formation of a large number of hot spots where TNPs come into close proximity with each other. Moreover, through discrete dipole approximation (DDA) calculations, we calculated the local field intensity enhancement at 785 nm excitation for an Au TNP (see Fig. 2C). Clearly, a strong and localized EM-field enhancement was calculated at their sharp tips, which is an ideal LSPR property for SERS-based trace analyte detection and quantification. It is also important to recognize that the LSPR peak wavelength position of metal nanostructures and the wavelength of the incident light source (i.e., the laser) control the hot spot intensity. An ideal nanostructure for SERS application should be one whose LSPR peak is longer than but close to the wavelength of the laser source. In this context, for trace explosive detection, laser excitation with low energy photons (e.g., 785 nm) is a prerequisite to avoid sample decomposition. According to our DDA calculations, the LSPR dipole peak of ∼42 nm Au TNPs was at 781 nm (Fig. 2D, black curve). The LSPR dipole peak of our Au TNPs attached onto flexible adhesive films appeared at ∼820 nm (Fig. 2D, red curve). This ∼40 nm red-shift in dipole peak position of TNPs compared to DDA calculations could be due to near-field plasmonic coupling between randomly distributed and oriented Au TNPs, as shown in Fig. 2B. Moreover, the LSPR dipole peak of Au TNPs at ∼820 nm makes them ideal SERS substrates for low energy laser excitation as compared to Ag nanoparticles, which display an LSPR peak <600 nm and have been previously studied for SERS applications.3,29,30 Additionally, in the context of EM-field driven SERS enhancement mechanism, it is critical to select higher energy incident laser excitation photons as compared to main LSPR peak (i.e., dipole peak of TNP) of metallic nanostructures to achieve maximum SERS EF. Our selection of 785 nm laser excitation source for Au TNPs with 820 nm dipole peak is in agreement with the previous finding by Van Duyne and coworkers.31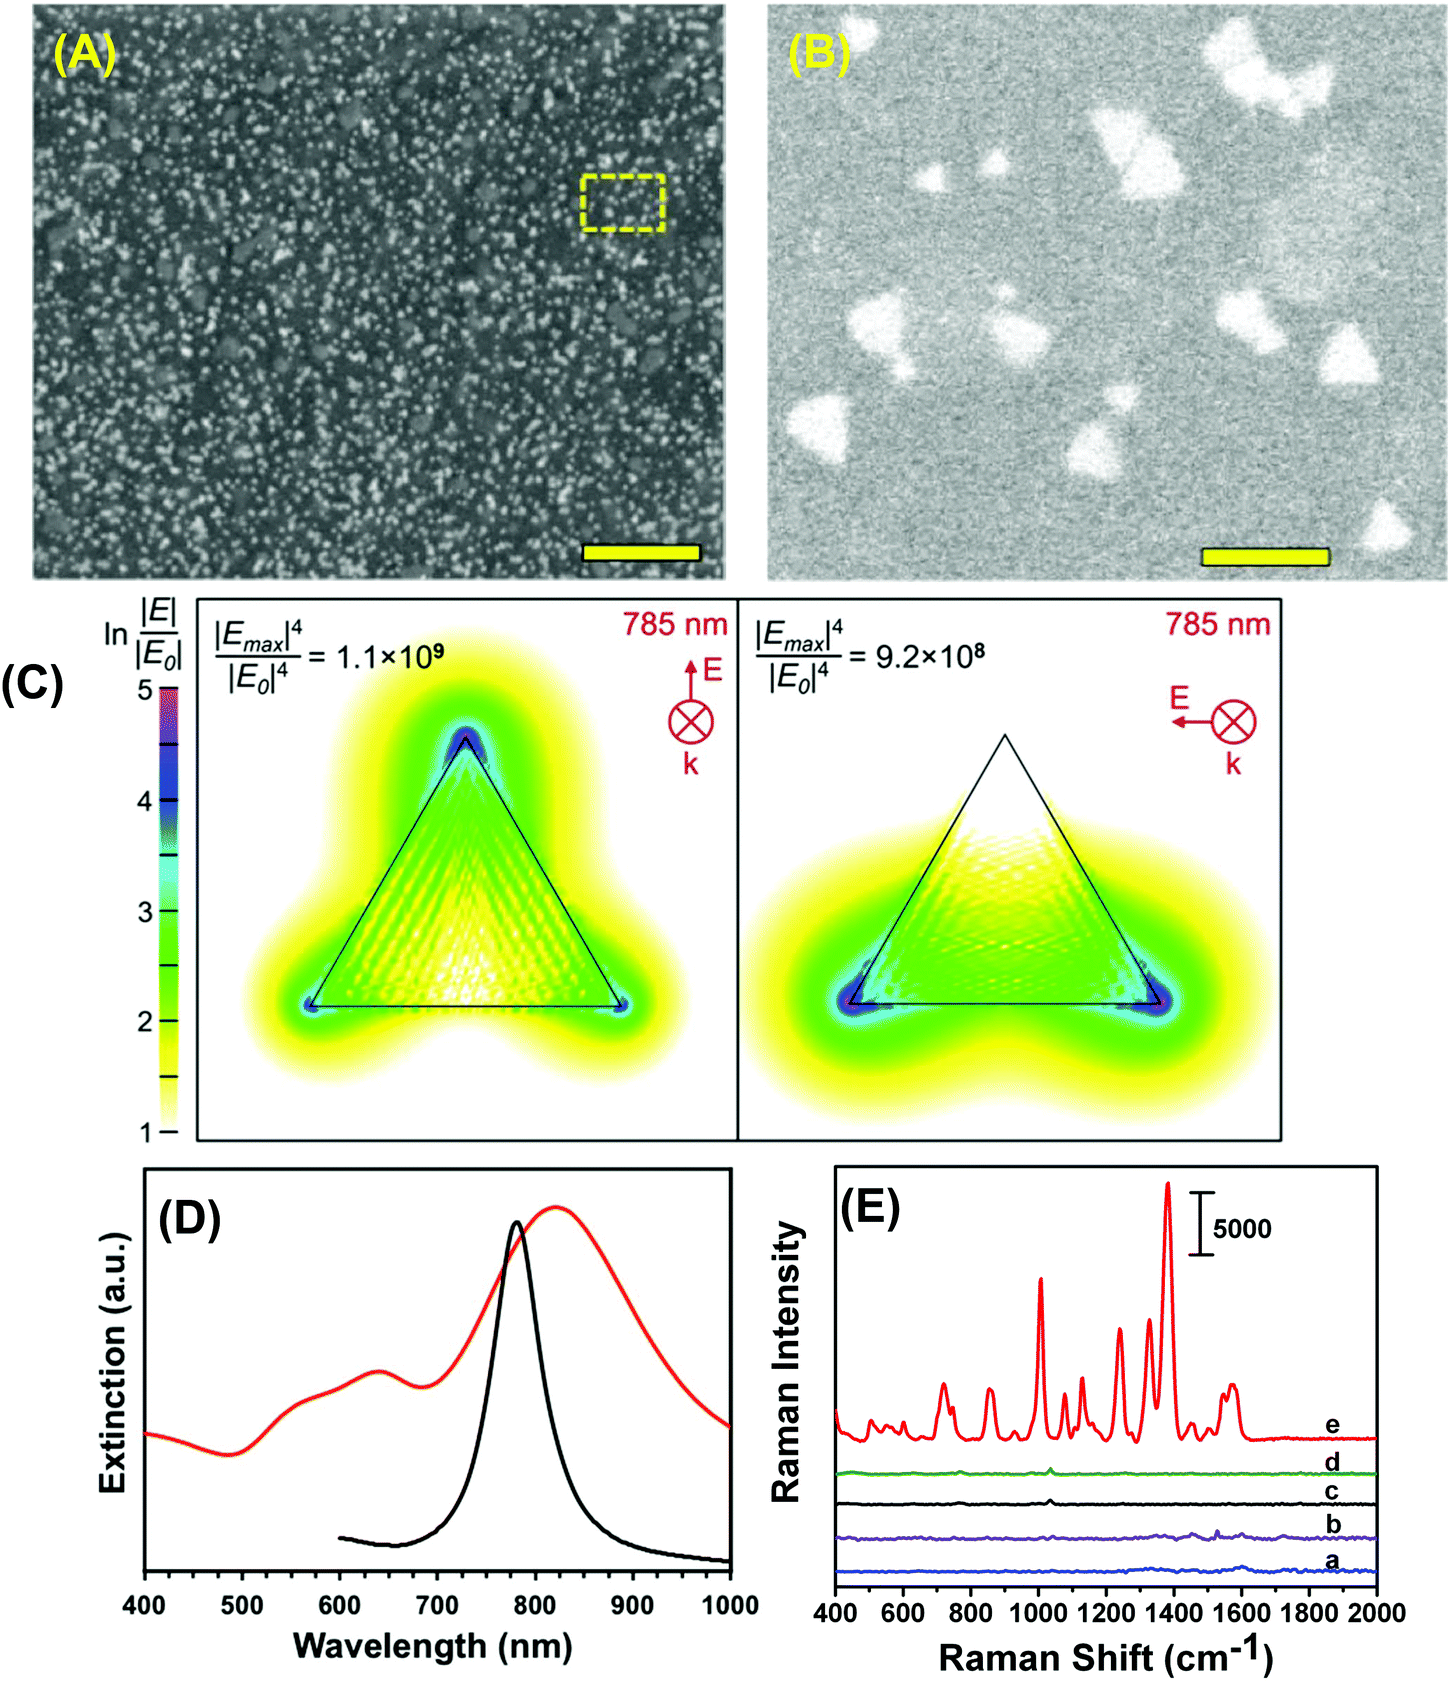 | ||
| Fig. 2 (A) Low magnification SEM image of our SERS nanosensor (1.0 μm scale bar). (B) High magnification SEM image of the expanded region of the nanosensor shown in dotted box in (A). Scale bar is 100 nm. (C) DDA simulated EM-field for a TOA-coated Au TNP (42 nm edge length, 8 nm thick); TNP is denoted by the triangle overlay. The EM-field is presented in the surface plane of the TNP in both primary modes and resulted from excitation with 785 nm linear polarized light as used with the SERS measurements reported. (D) Experimental LSPR spectra of Au TNPs self-assembled onto 3M adhesive tape (red curve) and their DDA-simulated spectrum (black curve). (E) Comparison of Raman signals under different experimental conditions: bare transparent 3M adhesive tape (a), total 6.0 μL of 1.0 mM TNT solution drop-casted on 3M tape (b), bare SERS nanosensor (c), total 6.0 μL of methanol drop-casted on SERS nanosensor (d), and total 6.0 μL of 1.0 mM TNT solution in methanol drop-casted on SERS nanosensor (e). Scale bar represents counts per second. | ||
Because TNT is a very commonly used military grade high explosive and it also serves as a reference for explosive power (e.g., TNT equivalency), we used it as a model system to investigate the detection, identification, and quantification capabilities of our SERS nanosensor. Fig. 2E shows Raman spectra detailing parts of the nanosensor and the responses that were collected as following: (a) bare transparent 3M adhesive tape, (b) total 6.0 μL of a 1.0 millimolar (mM) TNT solution in methanol drop-casted on adhesive tape, (c) only the SERS nanosensor, (d) total 6.0 μL of methanol drop-casted on SERS nanosensor, and (e) total 6.0 μL of a 1.0 mM TNT solution drop-casted on the SERS nanosensor. The nanosensor demonstrates significant enhancement in characteristic Raman peak intensities of TNT at 1380 (C–N stretch), 1234 (benzene ring), 1122 (CH3 deformation), 1002 (symmetry aromatic stretch), and 860 cm−1 (NO2 scissoring) (see Table S1A† for a more detailed list of frequencies) as compared with TNT on just 3M adhesive tape. Fig. S2† provides additional SERS spectra. Our experimentally observed Raman peaks were slightly shifted as compared to normal Raman vibrational modes of bulk TNT,32 which could be due to changes in orientation of TNT molecules upon adsorption onto (111) planes of Au TNP during slow solvent evaporation.33 Finally, we experimentally calculated the EF of our nanosensor to determine the SERS performance and it was ∼6 × 10⁶. For additional information concerning experimental EF calculation, please see the ESI and Fig. S2.† However, we are not certain of the reason for the nearly three orders of magnitude difference between the experimentally determined and DDA-calculated SERS EF (∼1.1 × 10⁹) of our nanosensor. One possible reason for this deviation could be an overestimation of the number of TNT molecules (NSERS ∼ 2.9 × 10⁵) that were present on the surface of the Au TNPs. According to ESI eqn (1),† SERS EF is inversely proportional to NSERS, thus overestimation of TNT molecules certainly lowers the EF values. Thus, the highest SERS EF value from the DDA calculations was observed at the sharp tips of TNP in contrast to the experimental value, which were determined by taking in to the consideration that TNT molecules adsorbed onto the entire (i.e., sharp tips and edges, and flat terraces) Au TNP surface. Additionally, in the NSERS calculation we considered all the nanostructures present onto SERS nanosensors were triangular in shape. However, approximately 5% nonprismatic nanostructures (mostly spherical) were present in the nanosensors (see Fig. S1†). The spherical nanoparticles display much lower EM-field enhancement as compared to TNPs that would result in lower SERS EF value.6 Nevertheless, to the best of our knowledge, this is the highest value reported in the literature for Au nanostructure-based, flexible SERS nanosensors.13,17,18
Selectivity of SERS nanosensor
An analytical technique with extremely high selectivity is of paramount importance for homeland security applications because most items of evidence are either impure or may contain many interferents. In most trace analytes detection, defining selectivity at a very low concentration provides an added advantage for label-free analytical techniques in comparison to traditional methods such as GC-MS and electrochemistry that require fairly large amount of sample. In this context, military TNT samples often contain low levels of trinitrobenzene (TNB) and dinitrotoluene (DNT). To investigate selectivity, a total 6.0 μL, 100 fM solution of either TNB or DNT was drop-casted onto SERS nanosensors and the Raman spectra were acquired. Fig. 3A illustrates a comparison of SERS spectra of TNB, DNT, and TNT. Though the frequency and intensity of vibrational bands are visibly different in each spectrum, we performed (PCA) and DA analyses for specificity testing and precise differentiation between these compounds. As shown in Fig. 3B, the variation in SERS spectra between these three nitrobenzene derivatives was well described by PC 1 (70.1% of total variance) and PC 2 (24.5% of total variance). The first two PCs (cumulatively 94.6% of total variance) readily separated the compounds. DA analysis using PCs 1 and 2 resulted in 100% classification accuracy, with all spectra being predicted with a probability of 1. Taken together, our label-free SERS characterization demonstrated excellent classification capacity.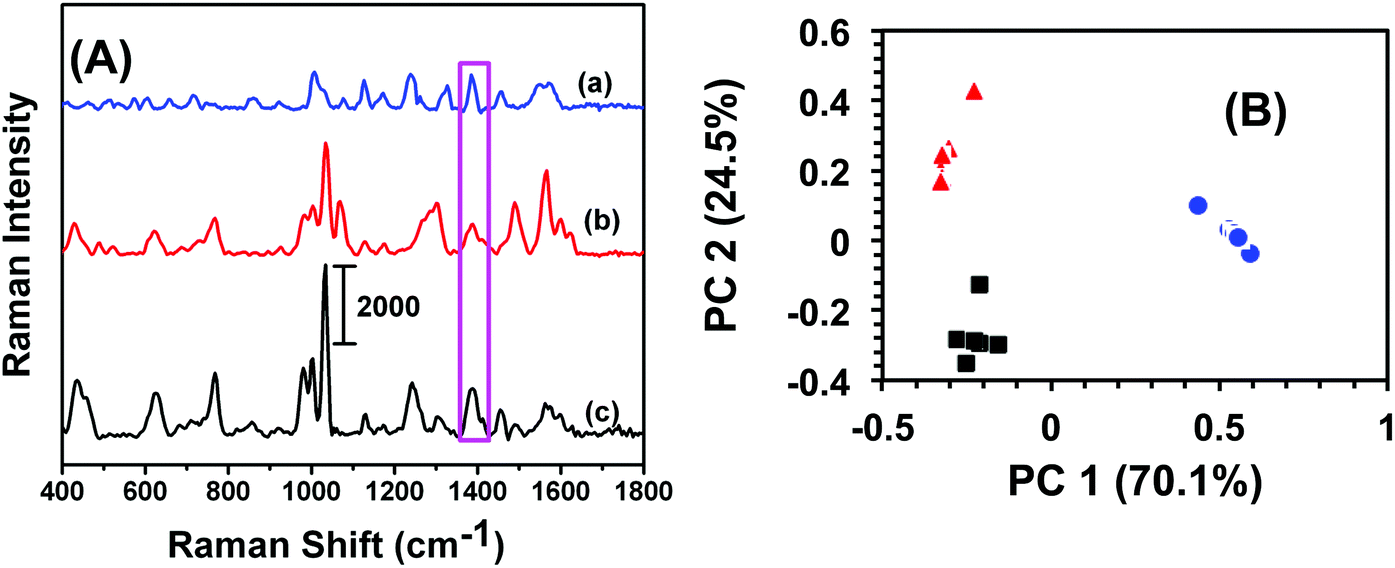 | ||
| Fig. 3 (A) Representative SERS spectra acquired using the nanosensor from 100 fM: (a) TNT, (b) TNB, and (c) DNT at 1380 cm−1 (purple box). Scale bar represents counts per second. (B) Plot of PCA scores for SERS at 100 fM concentration of TNT (blue spheres), TNB (red triangles), and DNT (black square). DA classified 100% of spectra correctly. Here n = 18, DA prediction 100%. | ||
Reproducibility of SERS nanosensor
For any type of a label-free sensing approach, reproducibility in SERS nanosensor fabrication and long shelf life are prerequisites for accurate analytical measurement and for bringing the technology forward for real world applications. We have adopted two different reproducibility tests for our SERS nanosensor for trace explosive detection: (1) analyze multiple spots in the same nanosensor (i.e., spot-to-spot variation) and (2) measure the SERS characteristics of multiple nanosensors (i.e., batch-to-batch variation). In the first reproducibility test, SERS spectra from nine randomly selected spots of a single nanosensor were collected using TNT as a standard explosive at 1.0 μM concentration, and the results are shown in Fig. S3A.† A negligible variation in SERS intensity was observed with the relative standard deviation (RSD) determined to be 2.7% (Fig. 4A). This value is better than other flexible SERS nanosensors constructed with adhesive tape13 and with other substrates14–18,34 including those used for explosive detection at the same or higher analyte concentrations. | ||
| Fig. 4 Histograms of SERS intensity of TNT at 1380 cm−1 collected from (A) 9 randomly selected spots on a particular nanosensor; (B) four randomly selected areas of four different nanosensors (1–4, 5–8, 9–12, and 13–16), which were prepared from four different batches of Au TNPs; (C) one SERS nanosensor over an entire month; (D) 20 individual nanosensors over the course of 5 months. The error bars in (C) and (D) represent measurements from six spots each. | ||
Considering a large area of our SERS nanosensor was uncovered by Au TNPs (see Fig. 2B), this RSD value is considerably low. This could be due to use of a high concentration (1.0 μM) of TNT in the spot-to-spot variation analysis in which presence of TNT molecules at the hotspots is likely increased. Moreover, the large laser spot size (5 μM diameter) used in our experiments provides an ensemble measurement of the SERS intensity or the nanosensor. We conducted two additional spot-to-spot variation analyses by using 100 pM and 100 fM of TNT where an ∼8% and ∼11% RSD were observed, respectively (see Fig. S4†). Nevertheless, these values are still lower than noble metal nanostructure-based flexible SERS nanosensors as mentioned above.13,14,17,18,34
In the second reproducibility test, four SERS nanosensors were prepared from four different batches of Au TNPs, and SERS spectra were collected from four randomly selected spots on each nanosensor (Fig. S3B†). As illustrated in Fig. 4B, the RSD of SERS peak intensity of TNT was found to be 3.6%. We also examined the stability/shelf life of our SERS nanosensors under normal laboratory storage conditions but protected from prolong light exposure. In this case, we also formulated two different approaches: firstly, a total 6.0 μL 1.0 μM of TNT solution was drop-casted onto six randomly selected spots of a single nanosensor and the SERS spectra were collected each day for an entire month. Fig. 4C shows SERS peak intensity at 1380 cm−1 as a function of day where only a small difference in intensity was observed with 3.1% RSD. Secondly, we prepared twenty SERS nanosensors from five different batches of Au TNPs at once, and SERS spectra were collected weekly using single nanosensors. Importantly, only 3.5% RSD (Fig. 4D) was observed over the course of five months. The Raman spectra for various reproducibility tests are provided in the ESI, see Fig. S4.† We believe that such extraordinary characteristics of our SERS nanosensors arise from the programmable fabrication approach we adopted along with the high stability of Au TNPs under normal laboratory storage conditions. Taken together, our results demonstrate the excellent reproducibility of our SERS nanosensors that will be crucial for future technological development. In addition to the reproducibility characteristic, the long shelf life is very encouraging, specifically for the analysis of explosive residue at post-blast scenes when the nanosensor-containing explosive residue will be stored and analyzed days later from the sample collection location.
Detection, quantification, and classification of TNT, RDX and PETN using SERS nanosensors
With proven selectivity and reproducibility, we now investigate the feasibility of use of our SERS nanosensors for quantitative detection of TNT as a standard explosive. We prepared a TNT solution in methanol covering the range of 100 μM to 100 fM through serial dilution. A total 6.0 μL solution of a particular concentration was drop-casted on three different spots on two different nanosensors. Fig. 5A shows the SERS spectra for different TNT concentrations where the low standard deviation of the Raman peak intensity supports exceptional reproducibility in our fabrication. Moreover, a wide linear range spanning seven orders of magnitude (Fig. 5B, 105 to 10−1 nM) between the TNT concentration and the Raman peak intensity was observed. The LOD was determined using a more sophisticated equation27 and found to be ∼0.9 parts-per-trillions (ppt) (see ESI† for detail LOD calculation). The reason of using one-sided prediction interval of the blanks using student's t-distribution and the standard deviation of three blanks according to the (n − 1) degree of freedom rather commonly used experimental method (i.e., three times of the standard deviation (3σ) in the intensity of the Raman peak of interest) for our LOD calculation is following: no Raman peaks appeared in the blank sample at the calibration peak wavelength (e.g., 1380 cm−1 for TNT). Therefore, 3σ value should be zero and the LOD would be less accurate.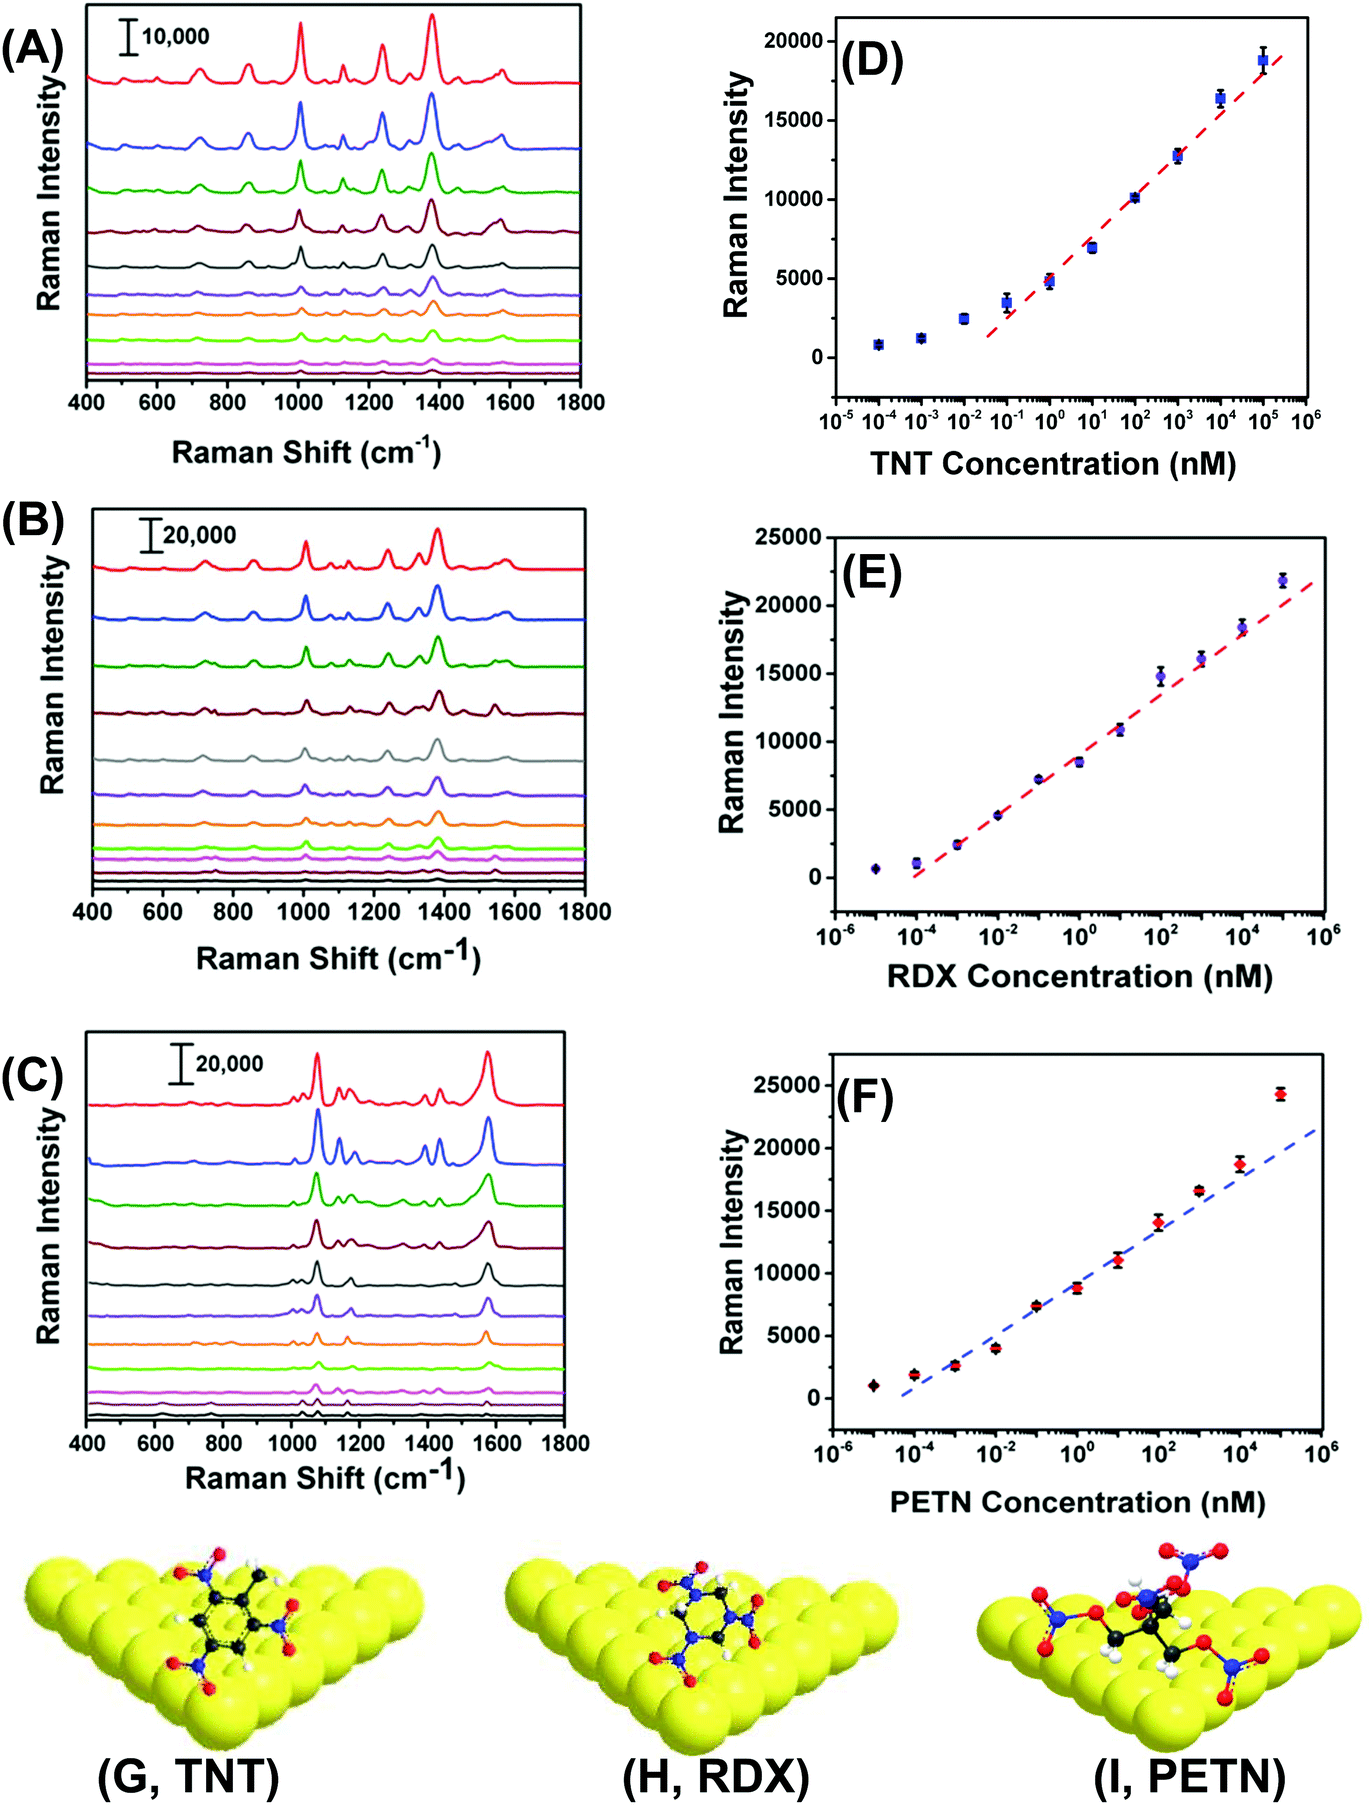 | ||
| Fig. 5 SERS spectra of (A) TNT from 100 μM to 100 fM, (B) RDX from 100 μM to 10 fM, and (C) PETN from 100 μM to 10 fM concentration ranges on flexible and adhesive SERS nanosensors. The plot of SERS intensity as function of (D) TNT (at 1380 cm−1) and (E) RDX (at 1380 cm−1), and (F) PETN (at 1570 cm−1) versus explosive concentration on logarithm scale. The dashed lines represent the linear concentration ranges. Average SERS intensity was determined from 6 measurements. (G–I) Schematic illustration of physorption of the three different explosive molecules onto the Au TNP surface. The scale bars in (A), (B) and (C) represent counts per second. The images are not to scale. | ||
Importantly, we were able to quantify TNT at 100 fM concentration with the signal-to-noise ratio of 5.9. The sensitivity of our SERS nanosenor is at least two orders of magnitude better than other Au nanostructure-based SERS nanosensors (see Table S2†). We believe this excellent sensitivity is because of the strong EM field enhancement of Au TNPs at their sharp tips and edges. Furthermore, our detection technique provides multiple advantages over conventional and well-established analytical methods such as GC-MS, ion-mobility MS, electrochemistry, and fluorometry that require large sample amounts, expensive sample processing, a specific laboratory environment, and labeling.19,20,35–38
RDX and PETN are also commonly used in acts of terror but only six and two SERS-based detection reports, respectively, are available, see Table S2† and references therein. Furthermore, the literature methods not only suffer from poor sensitivity, but because of the use of Klarite substrate,39,40 the advantages of flexibility and adhesive properties are diminished versus our SERS nanosensor. Therefore, there is an unmet need to develop an ultrasensitive nanosensor that is capable of detecting and quantifying these explosives along with an efficient sampling process, which would better expand potential applications of SERS nanosensors. With this aim we were able to quantitatively measure RDX and PETN utilizing our SERS nanosensors with LODs of 56 and 56 ppq, respectively. Fig. 5B, C, E, and F show Raman spectra and calibration plots for RDX and PETN. Strikingly, RDX and PETN displayed a large linear range spanning ten (105 to 10−4 nM) and nine (104 to 10−4 nM) orders of magnitude between the concentration and the Raman peak intensity. To explain the ∼15 fold better sensitivity for either RDX or PETN in comparison to TNT, we proposed a simple adsorption model of these three explosives onto (111) facets of Au TNP (Fig. 5G–I). TNT is a planar and rigid molecule, and thus the adsorption onto the Au TNP surface requires TNT to be flat if one envisions three Au–N interactions per molecule. Under this circumstance, the number of TNT molecules per nm2 surface area is expected to be low. In contrast, RDX and PETN molecules are capable of forming multiple Au–N interactions without occupying a large surface area because of the high degree of flexibility in their molecular structure. This type of binding could result in more molecules effectively adsorb onto the TNP surface per unit area. Moreover, presence of multiple interactions for RDX and PETN with Au surface enhances their ability to adsorb on SERS substrate in comparison to TNT in which it would be difficult to achieve successive Au–N interaction with all N atoms because of the rigid benzene-ring containing structure. Nevertheless, the sensitivity (3.1 femtogram) we achieved for either RDX or PETN is at least three-orders of magnitude better than current literature reports, see Table S2† for comparison.
Next, we performed chemometric analysis to develop univariate calibration plots for TNT, RDX, and PETN for Raman peaks at 1380, 1380, and 1570 cm−1, respectively. PCA factor loadings exhibited a very high magnitude at these positions in agreement with the high intensity, concentration dependence, and absence in the blank of these peaks. Multivariate calibration in the 100 fM to 100 μM concentration range with partial least square (PLS) corroborated the univariate calibration curves, but PLS did not provide improvement under these conditions (PLS calculation not shown). At the reported limit of quantification of 100 fM, PCA and DA were highly effective in separating the blank, PETN, RDX, and TNT, as shown in Fig. 6A. The variation described by PC 1 (58.2% of total) distinguished TNT and RDX from the blank and PC 2 (27.9% of total) differentiated PETN from the Blank. DA using the 3 PCs yielded a 100% prediction accuracy. This is representative of the ability of our sensor ability to discern the blank from the analytes in the investigated range of 100 fM to 100 μM using PCA and DA.
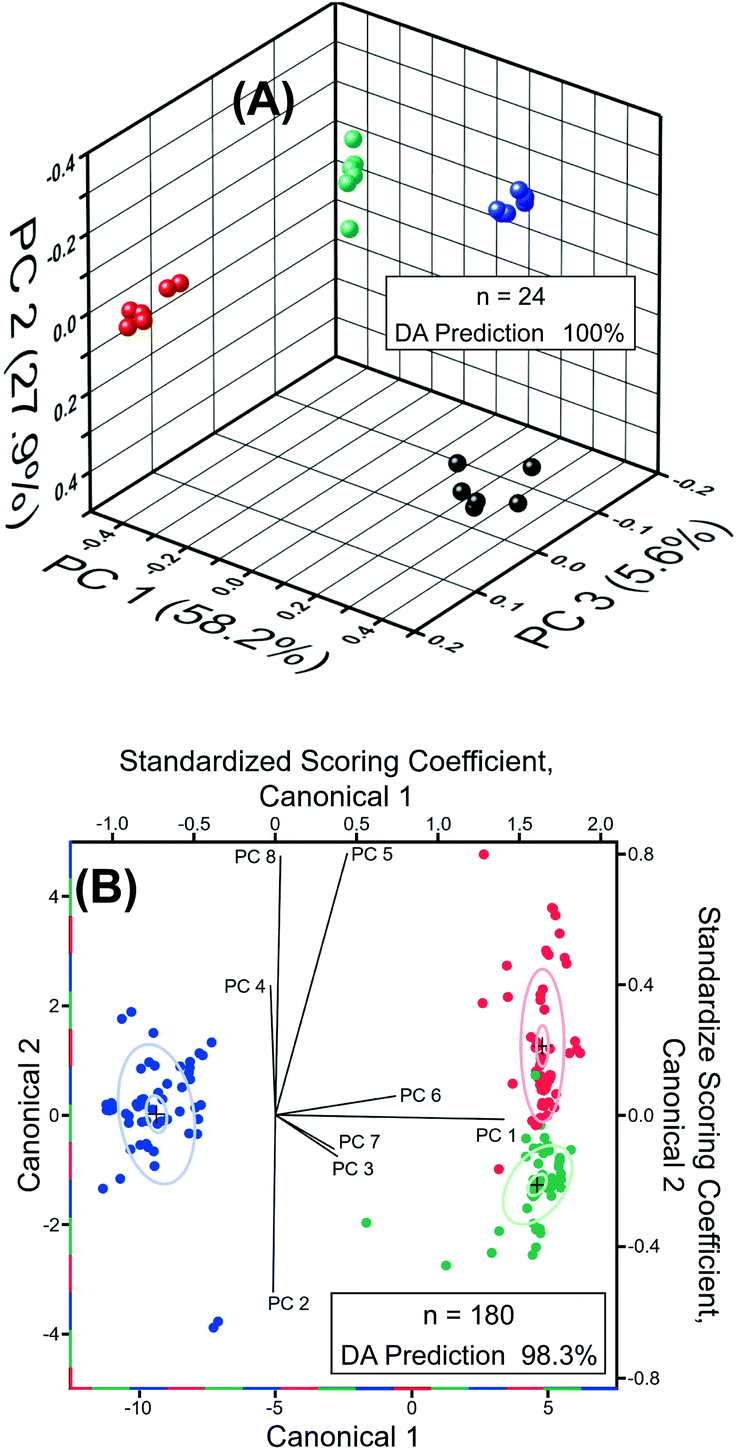 | ||
| Fig. 6 (A) PCA scores plotted at the 100 fM LOQ for SERS of RDX (red), TNT (green), PETN (blue), and blank (black) using the SERS nansensor. Inset, DA classified 100% of spectra correctly, all with a probability of 1, using PCs 1–3 (91.7% of total variance). (B) DA canonical biplot (left and bottom axis) for SERS from 100 fM to 100 μM showing differentiation of RDX (red), TNT (green), and PETN (blue). DA coefficient loadings ray plot (top and left axis) for PCs 1–8 used in DA. Inset, DA classified 98.3% of spectra correctly, using PCs 1–8 (93.6% of total variance). | ||
Classification of RDX, TNT, and PETN using the reported sensor was highly effective, resulting in greater than 98% classification accuracy from DA (8 PCs, n = 180) of the normalized SERS spectra of RDX, TNT, and PETN across the entire concentration range tested, i.e., 100 fM to 100 μM (Fig. 6B). Due to the similarity of TNT and RDX SERS spectra in the 400 cm−1 to 2000 cm−1 range, the PCs that most strongly differentiate TNT and RDX yield very small amounts of variation, PC 5 (3.3%) and PC 8 (1.4%). The dominance of PCs 5 and 8 in the differentiation of TNT and RDX and in the structure of Canonical Variate 2 is evident in the scoring coefficients. PC 5 and 8 also provided the most obvious visual division of TNT and RDX in three-dimensional PCA plots of the normalized spectra from 100 fM to 100 μM (not shown), which is expected based on the role they play in structuring Canonical Variate 2. PC 1 (61.9% of total variance) is the primary contributor to Canonical Variate 1 and provides the differentiation of PETN from RDX and TNT. Three 1.0 nM RDX spectra were misclassified as TNT by DA of the normalized spectra from 100 fM to 100 μM. This misclassification is visually attributable to the abnormally high intensities of the 1075, 1130, and 1325 cm−1 peaks, which were not present in the blank, making the misclassified spectra characteristic of higher concentrations of TNT. The 1130 and 1325 cm−1 regions have intense loadings in PCs 5 (both) and 8 (1325 cm−1) corroborating the observations concerning the role of these peaks in misclassification due to the importance of PCs 5 and 8 for the differentiation of RDX and TNT. Colocation of a PETN peak at 1075 cm−1 obscured the effect of this peak on misclassification in the PC Loadings. This misclassification did not occur in pairwise DA of PETN/RDX, PETN/TNT, and RDX/TNT (n = 120) from 100 fM to 100 μM. Pairwise DA resulted in 100% classification accuracy for all spectra and the previously misclassified spectra were predicted with a probability of one. Taken together, detection, quantification, and classification of these three explosives by our experimental measurement using Au TNP-based SERS nanosensors and our statistical investigation using chemometric will open new opportunities for trace explosive detection.
Direct sampling of TNT and PETN on fingerprints using SERS nanosensors
We expected that one of the unique aspects of our flexible and adhesive SERS nanosensor would be efficient sampling from real-world surfaces by placing the nanosensor on top of the trace residue without the need of any solvent wetting and swabbing steps as reported in the literature.17,18 To test our assumption, we demonstrated here direct sampling of TNT from fingerprints that were prepared by pressing a thumb into powdered TNT and repeatedly placing the thumb onto a series of glass slides. Fig. 7A illustrates Raman spectra of TNT after transferring the solid residue from glass slide to adhesive SERS nanosensors and that the symmetric –NO2 Raman vibrational stretch of TNT is clearly visible even from the 10th glass slide. Fig. S5† shows the SEM image of the number ten-glass slide before and after solid TNT collection using our SERS nanosensor. Clearly, trace amount of solid was transferred from glass slide to nanosensor unequivocally proving a very effective sample collection strategy with our SERS-based sensing approach. It is important to mention that the lack of linearity in the Raman signal versus glass slide number (Fig. 7B) originates because the nature of transferring solid residue from one slide to another through repeatedly placing a thumb is not identical. Finally, as shown in Fig. 7C and D, we also analyzed PETN from fingerprint samples because no such study is currently available for this explosive with results showing similar characteristics to trace detection of TNT.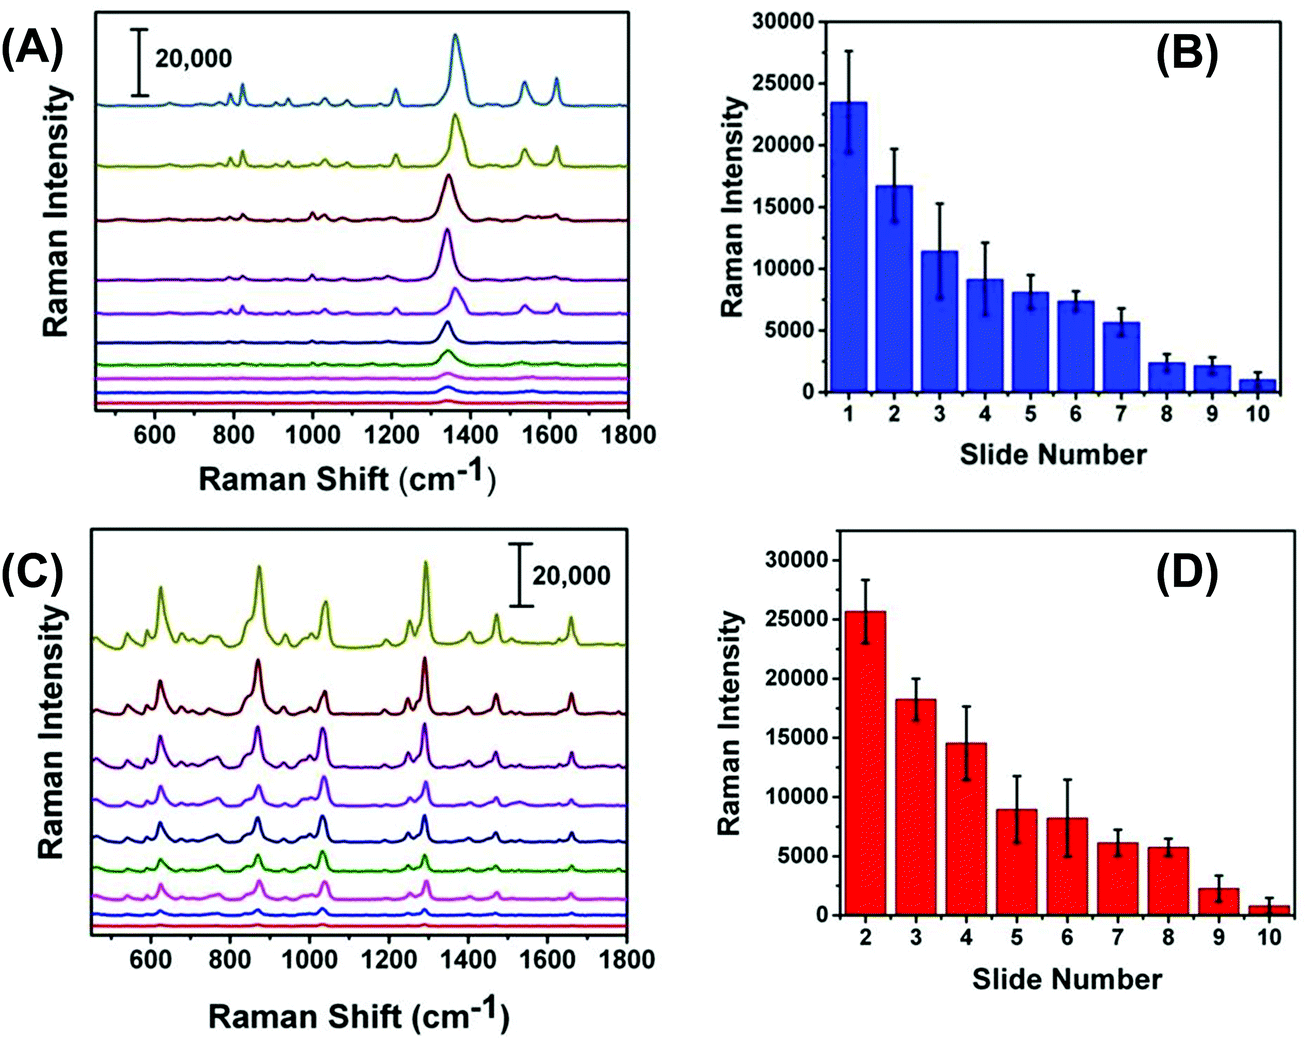 | ||
| Fig. 7 SERS nanosensor spectra of (A) TNT and (C) PETN collected by transferring fingerprint explosive residue from glass to SERS nanosensors. The top and bottom spectra are number 1 and 10 glass slides in which explosives powder was transferred from 1 to 2 to higher number slides through subsequent thumb pressing with the thumb exposed only once and depositing a decreasing amount of residue on each slide. The plot of SERS intensity (B) TNT (1380 cm−1) and (D) PETN (1290 cm−1) as function of slide number. Scale bars in (A) and (C) represent counts per second. | ||
In addition to the detection of explosives on fingerprints, our SERS-based analysis can be applied to the SERS imaging of latent fingerprint (LFP), which is an impression of a finger's ridge pattern formed onto solid surfaces. Currently, Fourier transform infrared (FTIR)41 and normal Raman spectroscopy42 techniques are commonly used for LFP analysis. Moreover, mass spectrometry (MS)43 and nanoplasmonic44 techniques are also capable of imaging LFPs. However, in many practical scenarios, LFP could contain only microscopically (<1 μg) visible explosive residue on uneven and complex surfaces. Therefore, neither portable FTIR, Raman, nor MS instrument might be capable of detecting trace explosive onto a solid surface at real crime scene. As a proof of concept, Fig. S6† shows the microscopy image of an LFP impression containing TNT residue on our flexible SERS substrate that was transferred from a glass slide. Taken together, the demonstrated sample collection efficiency and trace detection of solid explosive residue is a step forward for successful application of our flexible and adhesive SERS nanosensors in both homeland security and military applications.
Conclusion
In summary, we have developed an ultrasensitive SERS nanosensor for trace explosive detection by self-assembling Au TNPs onto a commercially available, flexible and adhesive film through a programmable stamping method. This level of versatility has not been previously demonstrated in nanosensor-based explosive detection. By utilizing our SERS nanosensors, we quantitatively detected TNT, RDX, and PETN from standard solutions with LODs as low as of 56 ppq, which is the highest sensitivity ever reported in the literature for trace explosive detection.9 We hypothesize that such outstanding sensitivity arises from the strong EM field enhancement of TNPs at their sharp tips and edges. Importantly, our demonstrated selectivity through experimental SERS characterizations and statistical calculations proves the unique ability of our nanosensors to distinguish various types of explosives. Notably, our SERS nanosensors showed unprecedented stability and shelf life with the RSD values of Raman signal of <4.0%. Furthermore, the direct sampling efficiency of our nanosensor on fingerprints from glass will obviate the need of the swabbing, which requires a wet surface for extraction of solid explosive residue and is currently very commonly used at the airports for screening purposes. We believe our flexible and adhesive SERS nanosensor will have the ability to collect trace amounts of sample from post-blast scenes and thus greatly improve explosive detection and instantaneous analysis in homeland security applications when coupled with portable Raman spectrometers. Additionally, use of a commercially available inexpensive adhesive film could potentially allow large scale, low-cost production of SERS nanosensors. Finally, our SERS nanosensor for trace explosive detection can successfully be used for detection of other chemical such as pesticides residue on fruits and vegetables,13,16 forensic drug analysis,8 and biological3,45–48 sensing (e.g. protein, DNA and microRNAs), thus opening new avenues in measurement science.Author contributions
T. L. and R. S. conceived the original idea and designed the SERS nanosensors. R. S. performed electron microscopy analysis. T. L. and S. S. performed the SERS sensing experiments and collected and analyzed the SERS data. A. R. and S. Z. performed DDA calculations; A. R. and J. V. G. conducted the chemometric analysis. All authors contributed to write the manuscript.Conflicts of interest
There are no conflicts to declare.Acknowledgements
DDA and chemometric works were supported by the National Science Foundation grant, CBET-1604617. We thank Prof. B. B. Muhoberac (IUPUI) for helpful suggestions.References
- P. K. Jain, X. Huang, I. H. El-Sayed and M. A. El-Sayed, Acc. Chem. Res., 2008, 41, 1578–1586 CrossRef CAS PubMed.
- C. L. Haynes, A. D. McFarland and R. P. Van Duyne, Anal. Chem., 2005, 77, 338A–346A CrossRef CAS.
- P. L. Stiles, J. A. Dieringer, N. C. Shah and R. P. Van Duyne, Annu. Rev. Anal. Chem., 2008, 1, 601–626 CrossRef CAS PubMed.
- M. Moskovits, J. Raman Spectrosc., 2005, 36, 485–496 CrossRef CAS.
- R. G. Freeman, K. C. Grabar, K. J. Allison, R. M. Bright, J. A. Davis, A. P. Guthrie, M. B. Hommer, M. A. Jackson, P. C. Smith, D. G. Walter and M. J. Natan, Science, 1995, 267, 1629–1632 CrossRef CAS PubMed.
- E. Hao and G. C. Schatz, J. Chem. Phys., 2004, 120, 357–366 CrossRef CAS PubMed.
- G. K. Joshi, S. L. White, M. A. Johnson, R. Sardar and P. K. Jain, J. Phys. Chem. C, 2016, 120, 24973–24981 CAS.
- C. Muehlethaler, M. Leona and J. R. Lombardi, Anal. Chem., 2016, 88, 152–169 CrossRef CAS PubMed.
- A. Hakonen, P. O. Andersson, M. Stenbaek Schmidt, T. Rindzevicius and M. Kaell, Anal. Chim. Acta, 2015, 893, 1–13 CrossRef CAS PubMed.
- T. Demeritte, R. Kanchanapally, Z. Fan, A. K. Singh, D. Senapati, M. Dubey, E. Zakar and P. C. Ray, Analyst, 2012, 137, 5041–5045 RSC.
- Z. Guo, J. Hwang, B. Zhao, J. H. Chung, S. G. Cho, S.-J. Baek and J. Choo, Analyst, 2014, 139, 807–812 RSC.
- S. S. R. Dasary, A. K. Singh, D. Senapati, H. Yu and P. C. Ray, J. Am. Chem. Soc., 2009, 131, 13806–13812 CrossRef CAS PubMed.
- J. Chen, Y. Huang, P. Kannan, L. Zhang, Z. Lin, J. Zhang, T. Chen and L. Guo, Anal. Chem., 2016, 88, 2149–2155 CrossRef CAS PubMed.
- N. Chen, P. Ding, Y. Shi, T. Jin, Y. Su, H. Wang and Y. He, Anal. Chem., 2017, 89, 5072–5078 CrossRef CAS PubMed.
- Z. Han, H. Liu, J. Meng, L. Yang, J. Liu and J. Liu, Anal. Chem., 2015, 87, 9500–9506 CrossRef CAS PubMed.
- P. Wang, L. Wu, Z. Lu, Q. Li, W. Yin, F. Ding and H. Han, Anal. Chem., 2017, 89, 2424–2431 CrossRef CAS PubMed.
- Z. Gong, H. Du, F. Cheng, C. Wang, C. Wang and M. Fan, ACS Appl. Mater. Interfaces, 2014, 6, 21931–21937 CAS.
- C. H. Lee, L. Tian and S. Singamaneni, ACS Appl. Mater. Interfaces, 2010, 2, 3429–3435 CAS.
- K. E. Gregory, R. R. Kunz, D. E. Hardy, A. W. Fountain III and S. A. Ostazeski, J. Chromatogr. Sci., 2011, 49, 1–7 CAS.
- K. S. Bradley, J. Forensic Sci., 2005, 50, 96–103 CrossRef CAS PubMed.
- R. S. Golightly, W. E. Doering and M. J. Natan, ACS Nano, 2009, 3, 2859–2869 CrossRef CAS PubMed.
- N. Lorenzo, T. Wan, R. J. Harper, Y.-L. Hsu, M. Chow, S. Rose and K. G. Furton, Anal. Bioanal. Chem., 2003, 376, 1212–1224 CrossRef CAS PubMed.
- G. K. Joshi, S. Deitz-McElyea, T. Liyanage, K. Lawrence, S. Mali, R. Sardar and M. Korc, ACS Nano, 2015, 9, 11075–11089 CrossRef CAS PubMed.
- G. K. Joshi, P. J. McClory, B. B. Muhoberac, A. Kumbhar, K. A. Smith and R. Sardar, J. Phys. Chem. C, 2012, 116, 20990–21000 CAS.
- G. K. Joshi, K. A. Smith, M. A. Johnson and R. Sardar, J. Phys. Chem. C, 2013, 117, 26228–26237 CAS.
- G. K. Joshi, K. N. Blodgett, B. B. Muhoberac, M. A. Johnson, K. A. Smith and R. Sardar, Nano Lett., 2014, 14, 532–540 CrossRef CAS PubMed.
- E. Massarini, P. Wästerby, L. Landström, C. Lejon, O. Beck and P. O. Andersson, Sens. Actuators, B, 2015, 207, 437–446 CrossRef CAS.
- R. Sardar, J.-W. Park and J. S. Shumaker-Parry, Langmuir, 2007, 23, 11883–11889 CrossRef CAS PubMed.
- K. M. Mayer and J. H. Hafner, Chem. Rev., 2011, 111, 3828–3857 CrossRef CAS PubMed.
- M. E. Stewart, C. R. Anderton, L. B. Thompson, J. Maria, S. K. Gray, J. A. Rogers and R. G. Nuzzo, Chem. Rev., 2008, 108, 494–521 CrossRef CAS PubMed.
- A. D. McFarland, M. A. Young, J. A. Dieringer and R. P. Van Duyne, J. Phys. Chem. B, 2005, 109, 11279–11285 CrossRef CAS PubMed.
- S. Sil, D. Chaturvedi, K. B. Krishnappa, S. Kumar, S. N. Asthana and S. Umapathy, J. Phys. Chem. A, 2014, 118, 2904–2914 CrossRef CAS PubMed.
- T. Chen, H. Wang, G. Chen, Y. Wang, Y. Feng, W. S. Teo, T. Wu and H. Chen, ACS Nano, 2010, 4, 3087–3094 CrossRef CAS PubMed.
- H. Zhou, Z. Zhang, C. Jiang, G. Guan, K. Zhang, Q. Mei, R. Liu and S. Wang, Anal. Chem., 2011, 83, 6913–6917 CrossRef CAS PubMed.
- R. Zhang, C.-L. Sun, Y.-J. Lu and W. Chen, Anal. Chem., 2015, 87, 12262–12269 CrossRef CAS PubMed.
- M. Riskin, R. Tel-Vered, T. Bourenko, E. Granot and I. Willner, J. Am. Chem. Soc., 2008, 130, 9726–9733 CrossRef CAS PubMed.
- S. Ben-Jaber, W. J. Peveler, R. Quesada-Cabrera, E. Cortes, C. Sotelo-Vazquez, N. Abdul-Karim, S. A. Maier and I. P. Parkin, Nat. Commun., 2016, 7, 12189 CrossRef CAS PubMed.
- E.-C. Lin, J. Fang, S.-C. Park, F. W. Johnson and H. O. Jacobs, Nat. Commun., 2013, 4, 1636 CrossRef PubMed.
- S. Botti, L. Cantarini, S. Almaviva, A. Puiu and A. Rufoloni, Chem. Phys. Lett., 2014, 592, 277–281 CrossRef CAS.
- S. Botti, S. Almaviva, L. Cantarini, A. Palucci, A. Puiu and A. Rufoloni, J. Raman Spectrosc., 2013, 44, 463–468 CrossRef CAS.
- R. Bhargava, R. Schwartz Perlman, D. C. Fernandez, I. W. Levin and E. G. Bartick, Anal. Bioanal. Chem., 2009, 394, 2069–2075 CrossRef CAS PubMed.
- E. D. Emmons, A. Tripathi, J. A. Guicheteau, S. D. Christesen and A. W. Fountain, Appl. Spectrosc., 2009, 63, 1197–1203 CrossRef CAS PubMed.
- D. R. Ifa, N. E. Manicke, A. L. Dill and R. G. Cooks, Science, 2008, 321, 805–805 CrossRef CAS PubMed.
- T. Peng, W. Qin, K. Wang, J. Shi, C. Fan and D. Li, Anal. Chem., 2015, 87, 9403–9407 CrossRef CAS PubMed.
- S. S. Sinha, S. Jones, A. Pramanik and P. C. Ray, Acc. Chem. Res., 2016, 49, 2725–2735 CrossRef CAS PubMed.
- J. L. Abell, J. M. Garren, J. D. Driskell, R. A. Tripp and Y. Zhao, J. Am. Chem. Soc., 2012, 134, 12889–12892 CrossRef CAS PubMed.
- H.-N. Wang, B. M. Crawford, A. M. Fales, M. L. Bowie, V. L. Seewaldt and T. Vo-Dinh, J. Phys. Chem. C, 2016, 120, 21047–21055 CAS.
- T. T. Chuong, A. Pallaoro, C. A. Chaves, Z. Li, J. Lee, M. Eisenstein, G. D. Stucky, M. Moskovits and H. T. Soh, Proc. Natl. Acad. Sci. U. S. A., 2017, 114, 9056–9061 CrossRef CAS PubMed.
Footnote |
| † Electronic supplementary information (ESI) available: Experimental procedure for Au TNPs synthesis, analytical techniques, LOD and EF calculations, DDA simulation, TEM image of Au TNPs, Raman spectra for EF calculations, Raman spectra for reproducibility verification, tables comparing Raman vibrational bands of TNT, RDX and PETN and sensitivity of different SERS nanosensors, and SEM image of explosive from fingerprint impression. See DOI: 10.1039/c8an00008e |
| This journal is © The Royal Society of Chemistry 2018 |