
 Open Access Article
 This Open Access Article is licensed under a Creative Commons Attribution-Non Commercial 3.0 Unported Licence
Controllable synthesis and enhanced gas sensing properties of a single-crystalline WO3–rGO porous nanocomposite†
Qin Haoa,
Tie Liua,
Jingyuan Liu*a,
Qi Liua,
Xiaoyan Jinga,
Hongquan Zhangb,
Guoqing Huangc and
Jun Wang*a
aKey Laboratory of Superlight Material and Surface Technology, Ministry of Education, Harbin Engineering University, 150001, PR China. E-mail: zhqw1888@sohu.com; Fax: +86 451 8253 3026; Tel: +86 451 8253 3026
bSchool of Automation, Harbin Engineering University, 150001, PR China
cHandan Purification Equipment Research Institute, Handan 056027, P. R. China
First published on 2nd March 2017
Abstract
In this paper, we report on a facile hydrothermal approach combined with a subsequent annealing process for the controllable synthesis of a single-crystalline WO3–rGO porous nanocomposite. The crystal structure, morphology and chemical composition of the as-obtained product were well-characterized by X-ray diffraction, transmission electron microscopy, X-ray photoelectron spectroscopy, Fourier transform infrared spectroscopy and Brunauer–Emmett–Teller analysis. The results indicate that this hybrid structure is composed of single-crystal WO3 porous nanoflakes with a size of 500 × 500 nm2 growing through or anchoring into a sheet-like rGO matrix. We explore the sensing performance of the gas sensor based on the as-synthesized product. Impressively, gas testing shows that the WO3–rGO nanocomposite exhibits an excellent kinetic response speed and good sensitivity toward NO2 and some volatile organic compound pollutants at a low temperature (90 °C). The pseudo 3-D structure provides many channels for gas diffusion and clearly enhances sensing properties. As such, this graphene-based composite shows promising potential as a high-performance gas sensing material for real-time gas detection.
1. Introduction
Research studies of promising and high-quality functional materials play a significant and continuing role in material science and chemical engineering domains.1–4 In recent years, research interest has focused on the development of self-assembled graphene-related materials with unique nano/microstructures and these structures are expected to provide more handles to tailor the properties for different applications, such as gas sensors,1,4–6 catalysis,7 lithium ion batteries8,9 and pseudocapacitive materials.10–13 Graphene-related materials have stood out in the gas sensing field and attracted increasing attention for the detection of pollutants, and toxic and combustible gases at relatively low temperature.14–16 These low-cost materials exhibit excellent electrical conductivity, chemical stability, large accessible surface areas and environmental friendliness. As reported, graphene and reduced graphene oxide (rGO) have been considered as promising candidates for gas detection; numerous studies have been launched into their gas sensitive properties.14,15 However, during synthesis, studies indicate that these thin graphene sheet-like structures often undergo aggregation or restacking that is driven by minimum surface energy, which is detrimental to the enhancement of properties. Therefore, studies have focused on avoiding the aggregation of graphene sheets to achieve the fabrication of high-quality material with desirable properties.16–20In recent literatures, hybrid nano/micro-structures are confirmed as very effective in preventing the aggregation of graphene sheets, thus advancing progress in improving gas sensors. For instance, Sun et al. used a solution-heated method to synthesize reduced graphene oxide-based macroporous films. This rGO–oxide composite of porous films exhibited much better sensing performance than those of the corresponding pure oxide films in detecting ethanol gas.5 Also, Zhang et al. synthesized rGO–SnO2 heterojunction aerogels via a simple sol–gel method. The test results indicated that the formation of a heterojunction structure between SnO2 and rGO enhanced gas sensing activity to some VOCs gases, especially to phenol.21 Similarly, Xiao et al. obtained SnO2 nanoparticles decorated graphene composite, the gas tests showing that this composite exhibited a good sensing activity and response kinetics toward hydrogen.22 Clearly, there is a great potential in gas sensors and the properties of graphene-based gas sensing materials should be further enhanced for large-scale application.
However, the current semiconductor oxide–rGO based gas sensors still contain many limitations for practical application, especially at working temperature and response speed.18,21,23 The parameters mentioned above are crucial for the evaluation of gas sensors.24 And research indicated that there would be substantially difference in the sensing properties, while the chemical composition maintained but the morphologies changed, even a small variation in surface feature or crystal structure is taken place.25–28 Therefore, at the current stage, the main emphasis in studies should be devoted to the synthesis of multifarious hybrid sensing materials with appropriate hetero-structure, optimization of composition and morphology, so as to improve the material's real-time gas detection performance at ppm, sub-ppm, even ppb level.14,17,19,20 Tungsten(VI) trioxide (WO3) represents an important and application-wide class of semiconductor oxides, and its micro-structure can be easily controlled by changing the solvents or additives, according to recent reports.25–27 There are many cases of interest in which WO3 is used as a major functional component of sensing materials for the detection of gases, such as VOCs, NO2 and H2S.26–29 To the best of our knowledge, although scholars have reported on the synthesis of graphene-related nanocomposite, there is little attention given to the details of preparing a WO3–rGO composite and its application as a gas sensing material.25,27,29,30
In this work, reduced graphene oxide based nanocomposite (WO3–rGO) has been successfully prepared by adopting a facile and eco-friendly hydrothermal process combining a post-calcination treatment. The synthetic route follows a typical pathway to obtain high-quality composite with hierarchical architecture. Note that this method requires a high concentration of GO precursor and introduces a small amount of W into the reaction system to prevent GO stacking. A series of techniques was used to characterize the morphology and analyse the chemical composition of as-obtained products. To investigate the potential application, gas sensors based on as-synthesized WO3–rGO composite (called “S1”), pure WO3 lamellas (S2, control group) and the original GO nanosheets (S3, control group) were fabricated and subsequently investigated for gas sensing performances. Interestingly, the WO3–rGO nanocomposite can be used as an effective sensing material for detection of NO2 at a low operating temperature (90 °C). We also found that WO3–rGO nanocomposite exhibited much better response than control groups. We describe and discuss these in detail below.
2. Experimental section
2.1 Materials
The graphite powder was purchased from Sinopharm chemical reagent Co. Ltd. Before using, the graphite powder of size 300–400 mesh was sieved out. Other chemical reagents were of analytical grade and used directly after commercial purchase without further purification, unless otherwise noted.2.2 Synthesis of graphene oxide
Graphene oxide (GO) was prepared from natural graphite powder through a modified Hummers' method, which is presented briefly as follows:8,10,14 in a typical synthesis, 5 g of graphite powder was added into 100 mL of H2SO4 (98%) under an ice bath atmosphere (0 ± 5 °C) and stirred for 2 h. Subsequently, 30 g KMnO4 was slowly added into the solution and also kept below 5 °C by an ice bath. Next, the mixture was transferred into a water bath atmosphere and stirred for 45 min at 50 ± 5 °C. After that, 300 mL of distilled water was added into the brown mixture which was then heated to 90 °C with stirring for 15 min. To remove excess KMnO4, 40 mL of H2O2 (5%) and 200 mL distilled water were poured into the mixture. The colour of the mixed solution turned to golden yellow. Finally, the as-prepared GO was washed with 3 wt% HCl and deionized water until the pH ≈ 7, then dispersed into individual sheets in distilled water at a concentration of 1 mg mL−1 with the aid of ultrasound, for further use.2.3 In situ synthesis of WO3–rGO nanocomposite
Based on the fact that the dry GO sheets were difficult to disperse evenly in deionized water, we used a pre-obtained GO solution to prepare the target WO3–rGO nanocomposite in the following one-pot process. Typically, GO solution was ultrasonically dispersed in 60 mL distilled water (DW) and transferred to a boiling 3-neck-flask. Next, 1 mmol sodium tungstate hydrate (Na2WO4·2H2O, 99.5% purity) and sodium oxalate (Na2C2O4·2H2O, 99.5% purity) were added and dissolved ultrasonically into the above solution. In brief, a moderate amount of acidic solution (2 M HCl) was added dropwise at a controlled rate (ca. 0.1 mL per minute) by a microsyringe under vigorous stirring until the pH value of the whole solution was adjusted to 2. Then, the above mixture was transferred into a Teflon-lined stainless-steel autoclave and kept at 160 °C for 10 h. After cooling down naturally, the solid-precursor material was collected by symmetric centrifugation and washed several times with ethanol and distilled water in turn to remove excess ions. After freeze drying, the sample was calcined at 400 °C under N2 atmosphere for 2 h with a heating rate of 5 °C min−1. During the formation of nanocomposite and high-temperature treatment, GO was partly reduced to rGO. Finally, a fine powder (the target sample) was obtained and collected for characterization and analysis. The process to synthesize the control group is displayed in the ESI.† Corresponding photographs of three samples solution are also provided in Fig. S1.†To investigate the effect of rGO amount on sensing activity, a series of WO3–rGO samples with different contents of rGO (about 4.1 wt%, 6.1 wt%, 7.9 wt% and 9.7 wt%, respectively) was prepared with different rGO amounts by adjusting the addition of GO in solutions of 10 mL, 15 mL, 20 mL and 25 mL, denoted as S1–10, S1–15, S1–20 and S1–25, respectively, while the other conditions remained the same.
2.4 Characterization
The X-ray diffraction (XRD) patterns of as-obtained sample were collected by a Rigaku TTR-III operated at 40 kV and 150 mA with high-intensity Cu-Kα radiation (λ = 0.15406 nm). The morphology and micro-structure of samples were mainly investigated by a transmission electron microscope (FEITEM, Tecnai G220S-Twin) with an accelerating voltage of 120 kV (HR-TEM at 200 kV). Energy-dispersive X-ray spectrometry (EDX) was employed to research the elemental compositions of the samples. Surface chemical analysis of simples was performed by X-ray photoelectron spectroscopy (XPS, PHI 5400 ESCA System) with an Al-Kα radiation source. The specific surface areas were evaluated by the Brunauer–Emmett–Teller (BET) equation from a micrometrics TriStar II 3020 instrument at a liquid nitrogen temperature. Pore-size distribution was estimated using the Barrett–Joyner–Halenda (BJH) method from the desorption branch of isotherms. Sample was degassed under vacuum at 90 °C for 3 h before gas tests.2.5 Fabrication and measurement of gas sensor
The fabricating procedure, taking the sensor based on S1 as an example, was carried out following a similar process described in previous literature:31 a specific amount of S1 was dispersed with deionized water to form a homogeneous suspension with ultrasonic or continued grinding, and then uniformly coated onto a ceramic tube to form a sensing film (with a thickness of ca. 10 μm). Pt leads, used as electrical contacts, were attached to a pair of Au electrodes which were printed previously. After the calcined process (at 150 °C for 2 h to improve the reproducibility), a Ni–Cr alloy coil was inserted into the tube as a heater for tuning the operating temperature. The schematic diagram and the physical photograph of the sensor are shown in Fig. 1a–c. The sensors were measured in a chamber with a volume of 10 L under laboratory conditions (20% RH, 25 °C). During the process, a moderate tested gas was injected into the chamber and diluted by fresh air to achieve a certain concentration. The gas sensing data were collected through a steady-state process conducted on a commercial NMDOG Multifunctional Precision Sensor Analysis Tester (Changsha Dingcheng Scientific Instrument Co., Ltd., Hunan, China).21,25,31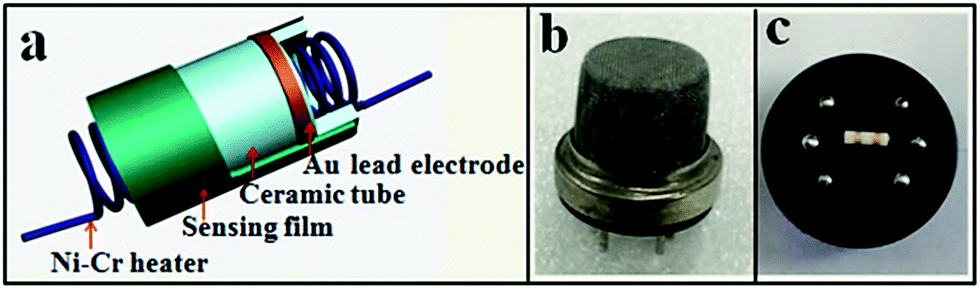 | ||
| Fig. 1 (a) Schematic diagram of the gas sensor, (b, c) photograph of the sensor. | ||
The gas response (R) of the sensor is defined as R = Rg/Ra for oxidizing gas or the reciprocal (Ra/Rg) for reducing gas, where Ra and Rg are the measured resistances of the sensor in air and in the testing gas atmosphere, respectively. The response time and recovery time are defined as the time taken by the sensor to achieve 90% of the total resistance change after the sensor was exposed to the tested gas and air, respectively.
3. Results and discussions
3.1 Structural and morphological characteristics
To examine the crystal structure and phase composition, XRD patterns of the final target product (WO3–rGO), the standard card of WO3 (JCPDS no. 43-1035) and the original GO samples are depicted in Fig. 2. As displayed clearly, Fig. 2a presents the XRD patterns of the as-obtained GO sample, from which a strong peak at 2θ = 11.26°, corresponding to the (001) interlayer, indicates the successful preparation of GO by the oxidation of graphite.5,14 Fig. 2b and c are the standard cards of WO3 (JCPDS no. 43-1035) and the target WO3–rGO composite. The XRD pattern in Fig. 2c confirms that the tungsten oxide in as-obtained composite is monoclinic WO3 with lattice parameters: a × b × c = 7.297 × 7.539 × 7.688 Å3 (space group: P21/n(14)), and which was indexed with a relevant crystallographic standard database structure (JCPDS no. 43-1035).25,26 In addition, the corresponding lattice planes (the hkl values) are marked at the right diffraction angles. By comparison, most peaks of the black curve agree well with the reported values of monoclinic WO3 and no other crystalline peaks from impurity appear. More noticeably, the characteristic diffraction peak of GO is no longer observed which confirm that GO has transformed to a reduction state of GO (rGO).16 And coupled with the strong and sharp peaks, XRD results indicate that the WO3–rGO sample possess high purity and crystallinity. A similar analysis was carried out to WO3 lamellas (S2).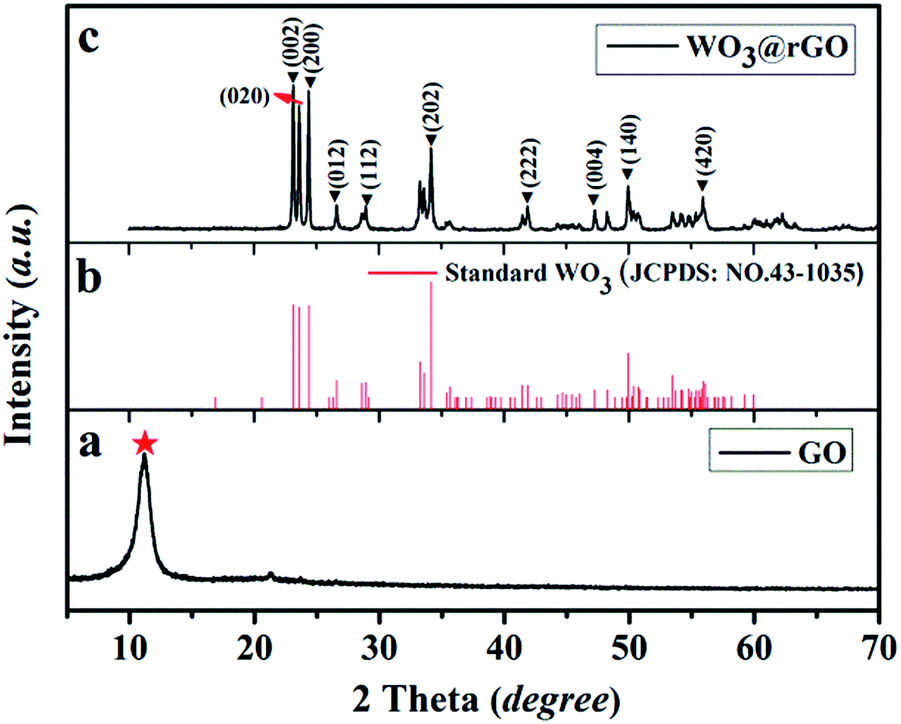 | ||
| Fig. 2 XRD pattern of the as-obtained samples: (a) the GO, (b) JCPDS of WO3 and (c) the target WO3–rGO composite, S1. | ||
As confirmed, an optimized solution-based process is crucial to the synthesis composite with special architecture.4,30 During this experiment, benefit from feasible hydrothermal techniques, like high homogeneity at the molecular level, facile compositional control and mild solution system, we realize the successful preparation of mono-crystalline WO3–rGO.32 The formation of WO3 nanoflakes is attributed to the hydrolysis of Na2WO4 to H2WO4·2H2O under weak acid buffer conditions.26 A simplified reaction is illustrated by the following formula:
| Na2WO4 + 2H+ + 2H2O → H2WO4·2H2O (light yellow)↓ + 2Na+ |
On the surface of GO nanosheets, the presence of numerous functional groups, such as –OH, –COO– and epoxy, results in tight C–O–W bonding of WO3 nanosheets to GO, which is confirmed by the following characterizations.
The morphological and structural features of the as-obtained samples were investigated in detail with corresponding TEM images shown in Fig. 3. A low-resolution TEM image of the as-obtained WO3–rGO sample is displayed in Fig. 3a, from which paper-like rGO sheets of greater crinkling than GO (Fig. 3e) are observed. The rGO sheets present a nearly transparent and micrometre-long sheet-like structure which overlaps at the edges. Also, we see clearly that the dark-coloured WO3 nanoflakes embed into the plicated rGO sheets and grow together, presenting a quadrilateral morphology. As such, TEM observations are in disagreement with the XRD patterns, which reflect that the obtained WO3 flakes in the composite are not dominated by any crystallographic facets. As observed in TEM, the flake planes are not oriented parallel to one another, but inversely and irregularly arranged. We believe that the WO3 nanoflakes anchored onto or growing through the rGO sheets can greatly avoid the restacking process of rGO nanosheets.29 From Fig. 3b, the evident and well-ordered lattice fringe reveals that WO3 nanoflakes existing in the composite form a single-crystalline structure.26 The fringe pattern indicates that a single crystalline flake has interplanar distances of 0.364 and 0.376 nm, corresponding to the (200) and (020) crystal planes of the monoclinic WO3 phase, respectively.26,32 Impressively, the clear and distinct diffraction spots of the selected area electron diffraction (SAED) pattern (Fig. 3c) also confirm that the WO3 is of a single crystalline structure as well.26 Similarly, Fig. 3d and e show the low-TEM images of the control groups S2 and S3, respectively. Fig. 3d presents the as-prepared WO3 nanolamellas with a uniform size of 500 × 500 nm2 (length × width). We also notice that these nanolamellas are thin and have a rough and porous structure. In Fig. 3e, the TEM image of the original GO sheets is also given, from which we note that the sheet is also nearly transparent with many crinkles. Next, the HR-TEM image of S2 is shown in Fig. 3f, from which an enlarged image (inset) is taken. The distance between adjacent lattice planes is measured at ca. 0.364 nm, which matches well with the (200) plane of WO3.27 And the corresponding SAED pattern is clearly shown in Fig. 3g (the inset). The EDS element analysis of S1 in Fig. S3† confirms that the hierarchical composite consists of W, O and C elements.
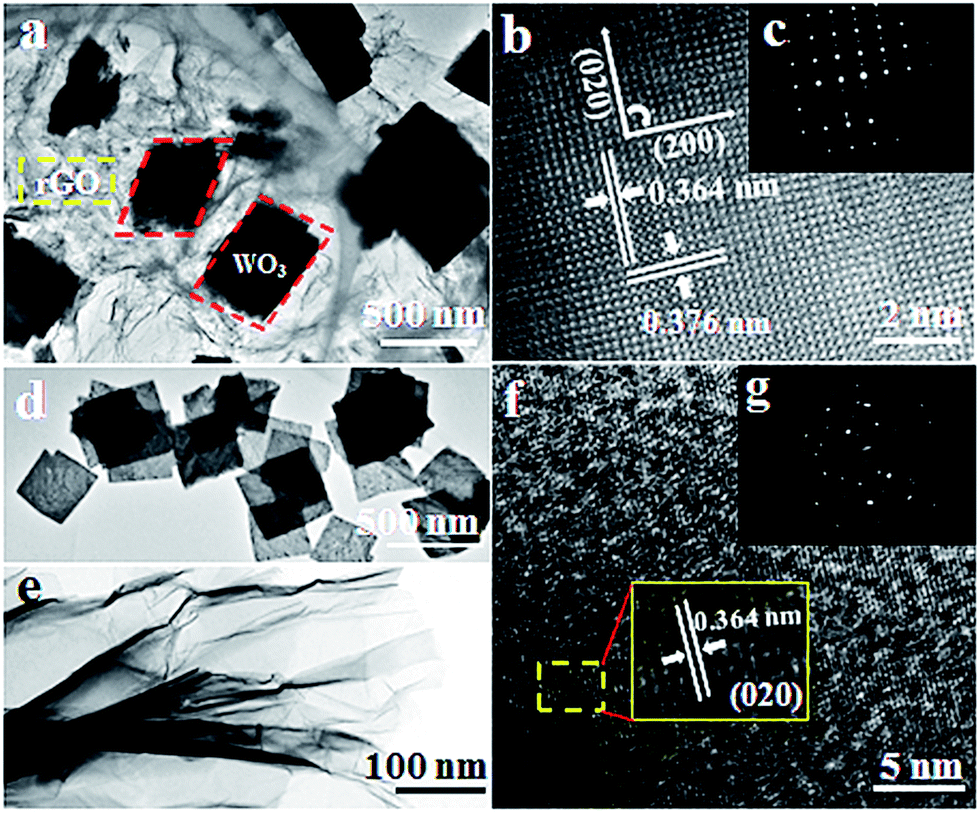 | ||
| Fig. 3 TEM images: (a) low-resolution, (b) high-resolution and (c) SAED image of WO3–rGO; (d) LR-image of WO3 nanolamellas, (e) LR-image of the original GO, (f) HR-image and (g) SAED of WO3 nanolamellas. | ||
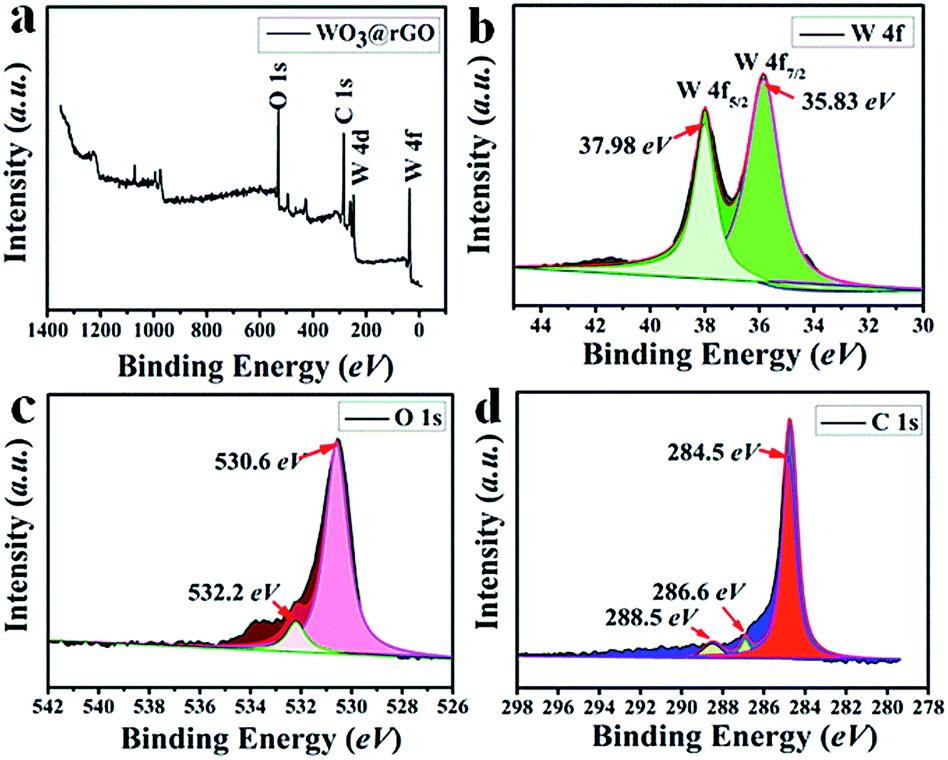
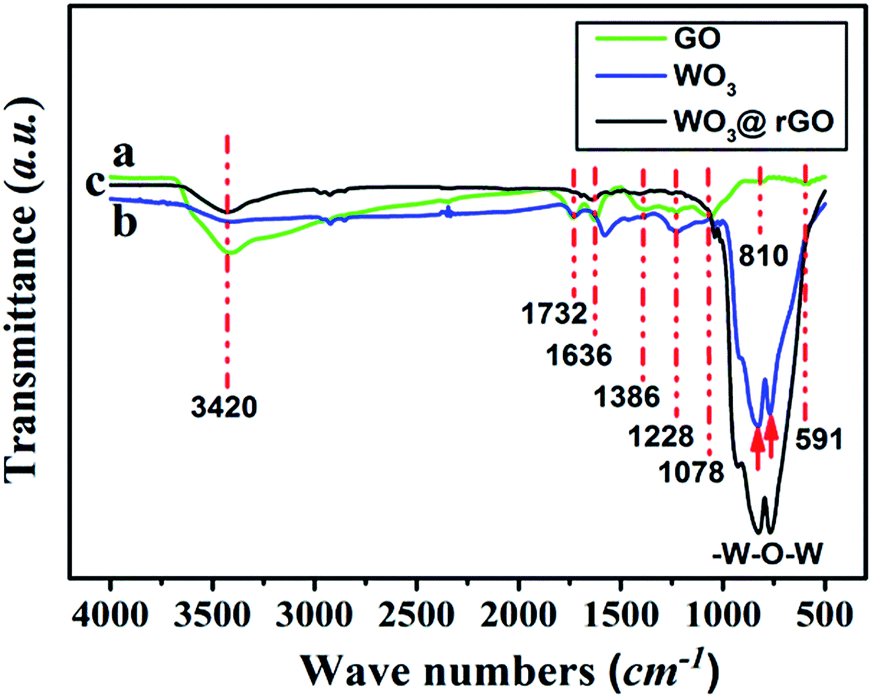
To complete the previous analysis, XPS analysis reveals the surface chemical composition and electronic states of the elements of the WO3–rGO product (Fig. 4). All the binding energies obtained in the XPS spectra were calibrated for specimen charging by referencing to the C 1s peak (set at 284.60 eV).5,30 The full wide-scan spectrum of the as-obtained WO3–rGO composite is presented in Fig. 4a, from which we observe clearly characteristic peaks of W, O and C elements. The high-resolution W 4f spectrum in Fig. 4b, displays two peaks with binding energy values of 37.98 and 35.83 eV for W 4f5/2 and W 4f7/2 indicating the W(VI) oxidation state of WO3–rGO sample.25,26,32 The O 1s peaks (Fig. 4c) at 530.1 and 532.0 eV match well with oxygen species in the as-obtained composite. As acknowledged widely, the peak at ∼530.6 eV can be assigned to typical surface lattice oxygen and the peak at 532.2 eV is characteristic of surface adsorbed oxygen species.5,30,32 The surface adsorbed oxygen species play a positive role in the enhancement of gas sensing performances because they act as a key component to react with test gas molecules. Fig. 4d shows the C 1s spectrum of WO3–rGO, where three strong peaks at 284.6, 286.6 and 288.4 eV, are attributed to C–C, C–O and C![[double bond, length as m-dash]](https://www.rsc.org/images/entities/char_e001.gif) O bands in graphene-based materials, respectively.5,14,29 To further confirm and identify the composition, especially rGO, we carried out FT-IR analysis which reveals FT-IR absorption spectra of WO3, GO and WO3–rGO composite (Fig. 5). As shown in green (Fig. 5a), the most obvious absorption peak at 3420 cm−1 of high frequency is ascribed to the stretching vibration of –O–H.14,33 And as reported, the absorption band at 1636 cm−1 is ascribed to the skeletal vibration of GO sheets.6,34 Absorption bands at 1732, 1386 and 1078 cm−1 are ascribed to a typical stretching vibration of –CO (carboxyl), deformation vibration of –O–H and stretching vibration of –C–O (alkoxy), respectively.5,26 The weak absorption peaks at around 810 and 591 cm−1 are due to the epoxide groups situated at the edges of the GO sheets.21,35 As for the target WO3–rGO composite (in black, Fig. 5c), absorption bands at 1732, 1386 and 1078 cm−1 weaken distinctly, suggesting that reduced GO forms during the synthetic process.17 Besides, as for the WO3–rGO composite, absorption bands at low frequencies (below 1000 cm−1) are ascribed to the vibration of W–O–W of crystalline WO3, which are not observed in the spectrum of GO but appear in WO3 (in blue, Fig. 5b).29 Compared with GO, the peak intensity of oxygen-containing functional groups (mainly –OH, –C–O and –CO) weakens distinctly in the spectrum of WO3–rGO composite, which is caused by the formation of nanocomposite and high-temperature annealing process.17,29,33 Accordingly, upon hydrothermal treatment, GO is reduced to rGO gradually and is accompanied by the formation of C–O–W bond. The annealing process is also carried out to promote the reduction of GO by losing oxygen-containing functional groups.27 Additionally, no other evident absorption peaks are observed from the WO3–rGO sample, indicating that no new bonding forms between the WO3 and rGO matrix. Combined with the XRD pattern, these observations above confirm the successful preparation of WO3–rGO sheet-like composite.
O bands in graphene-based materials, respectively.5,14,29 To further confirm and identify the composition, especially rGO, we carried out FT-IR analysis which reveals FT-IR absorption spectra of WO3, GO and WO3–rGO composite (Fig. 5). As shown in green (Fig. 5a), the most obvious absorption peak at 3420 cm−1 of high frequency is ascribed to the stretching vibration of –O–H.14,33 And as reported, the absorption band at 1636 cm−1 is ascribed to the skeletal vibration of GO sheets.6,34 Absorption bands at 1732, 1386 and 1078 cm−1 are ascribed to a typical stretching vibration of –CO (carboxyl), deformation vibration of –O–H and stretching vibration of –C–O (alkoxy), respectively.5,26 The weak absorption peaks at around 810 and 591 cm−1 are due to the epoxide groups situated at the edges of the GO sheets.21,35 As for the target WO3–rGO composite (in black, Fig. 5c), absorption bands at 1732, 1386 and 1078 cm−1 weaken distinctly, suggesting that reduced GO forms during the synthetic process.17 Besides, as for the WO3–rGO composite, absorption bands at low frequencies (below 1000 cm−1) are ascribed to the vibration of W–O–W of crystalline WO3, which are not observed in the spectrum of GO but appear in WO3 (in blue, Fig. 5b).29 Compared with GO, the peak intensity of oxygen-containing functional groups (mainly –OH, –C–O and –CO) weakens distinctly in the spectrum of WO3–rGO composite, which is caused by the formation of nanocomposite and high-temperature annealing process.17,29,33 Accordingly, upon hydrothermal treatment, GO is reduced to rGO gradually and is accompanied by the formation of C–O–W bond. The annealing process is also carried out to promote the reduction of GO by losing oxygen-containing functional groups.27 Additionally, no other evident absorption peaks are observed from the WO3–rGO sample, indicating that no new bonding forms between the WO3 and rGO matrix. Combined with the XRD pattern, these observations above confirm the successful preparation of WO3–rGO sheet-like composite.
 | ||
| Fig. 4 XPS spectra of as-obtained WO3–rGO composite: (a) survey scan; high-resolution (b) W 4f, (c) O 1s, and (d) C 1s spectrum. | ||
 | ||
| Fig. 5 FT-IR spectra of the as-obtained GO (a, in green), WO3 (b, in blue) and WO3–rGO (c, in black). | ||
The surface structural characteristics of the as-obtained three samples were further analysed by N2 adsorption–desorption techniques. The corresponding BET data are displayed in Fig. S4† and summarized in Table 1. As shown in Fig. S4a,† the prepared sample exhibits a surface area of 102.3 m2 g−1 and the isotherm profile is categorized as type IV with a small hysteresis loop, which indicates that a porous structure (mesopores and micropores) exists as part of the hierarchical structure.30,32,36 The pore-size distribution (inset, S4b†) was determined by BJH method from the desorption branch of the isotherm, from which we observe that the average pore diameter of the sample is 15–40 nm (mesoporous, mainly). These favourable porous structures not only contribute to the increase of specific surface area (S1 > S2 > S3) and active sites, but also to an increase of transfer channels for gas diffusion. All the BET data are consistent with the observed results of TEM images. The BET data of other samples (S2, S3) are shown in Fig. S4† and are summarized in Table 1.
| Number | Materials | BET surface area/(m2 g−1) | R |
|---|---|---|---|
| a R, response at 90 °C. | |||
| S1 | WO3–rGO | 102.3 | ∼4.3 |
| S2 | WO3 | 36.2 | ∼1.8 |
| S3 | GO | 24.5 | ∼1.1 |
3.2 Gas sensing properties
To highlight the advantages in the gas sensing area of these interesting structures, gas sensors based on the as-prepared products were fabricated to evaluate their sensing properties. Operating temperature is one of the most significant parameters for a successful gas sensor. As known, the whole sensing process is intimately associated with the variation of temperature, which influences gas diffusion, gas adsorption/desorption and crucial sensing reactions. Therefore, parallel experiments were carried out to determine the optimum operating temperature, ranging from 20 °C to 200 °C, while exposing the sensor to 10 ppm of ambient NO2. The test responses toward 10 ppm NO2 at different temperatures are summarized in Fig. 6. We notice that the response values of tested sensors vary dramatically with operating temperature. Namely, the responses all increase with operating temperature at the initial phase and reach a maximum value at a specific temperature. After achieving the maximum, a distinct decline is observed, confirming the existence of optimal temperature. Fig. 6 demonstrates that the optimal working temperature of WO3–rGO composite appears at 90 °C, while pure WO3's optimal working temperature is 140 °C. In detail, the response values at 90 °C are 1.6, 2.1, 4.3, 2.9, 1.8 and 1.1 for S1–10, S1–15, S1–20, S1–25, S2 and S3 toward NO2, respectively. We can notice that the composite enhances gas sensing response, especially with respect to working temperature, which is comparable to recent reports.27,33,37 Also, the result indicates that the amount of rGO in the composite has an important role in NO2 detection. By comparison, the responses of S1–20 sensor are superior to other sensors based on composites with other contents. We also provide the gas sensing results of the original GO sample, which has a weak sensing response to NO2 in the temperature range 20–220 °C. To illustrate the advantages of the composite, we summarize the response results of S1 and S2 with a bar graph in Fig. 7a. Based on repeated trials, the response of porous WO3–rGO composite achieves a peak value of 4.3, which is almost fourfold higher than the control group (S2) at 90 °C. The significant enhancement in the response of S1 toward NO2 is mainly ascribed to the successful attachment of WO3 nanosheets onto rGO to form a 3-D WO3–rGO hybrid nanostructure. Besides, the favorable morphology and porous structure in the composite provides many channels for gas diffusion.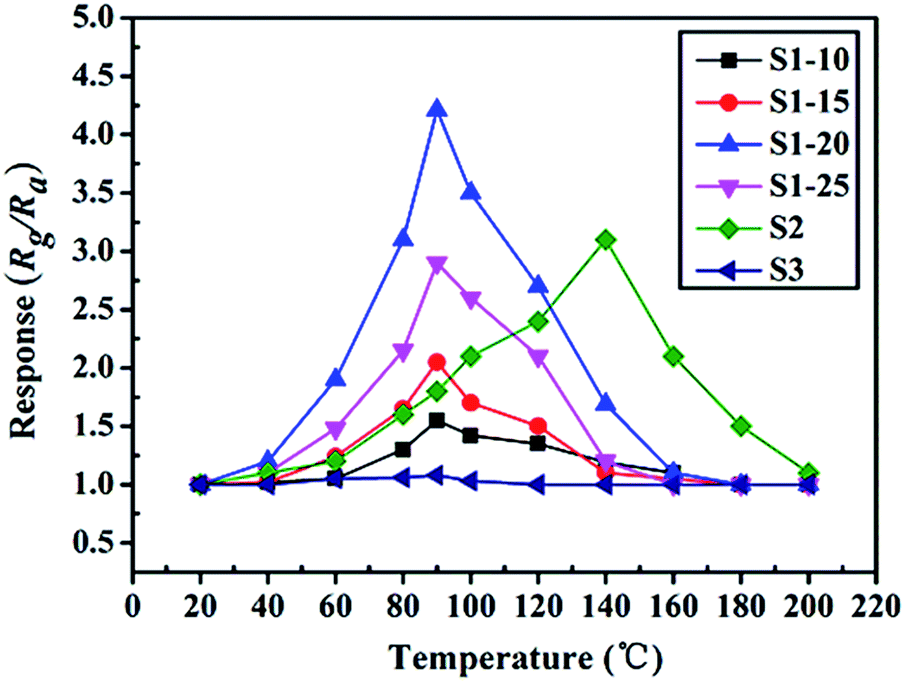 | ||
| Fig. 6 NO2 gas sensing property of the sensors at different working temperatures. | ||
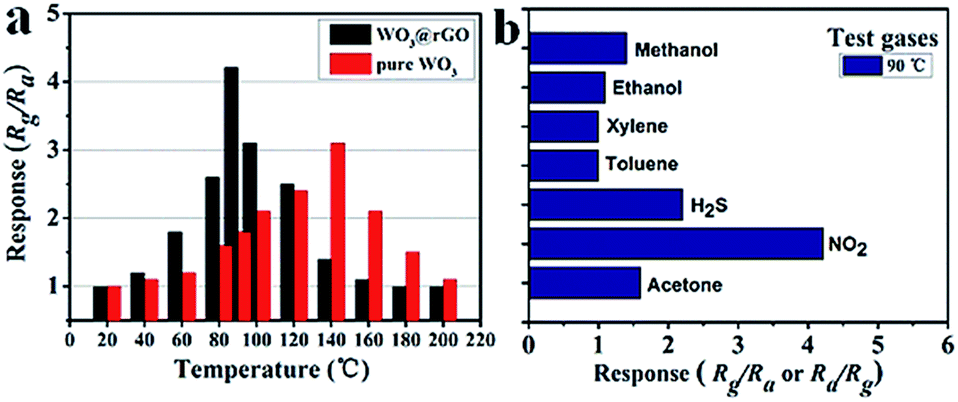 | ||
| Fig. 7 (a) Response of S1 and S2 versus operating temperature to 10 ppm NO2, (b) response of sensor based on S1 to 10 ppm various gases at 90 °C. | ||
Selectivity is an important parameter of gas sensors for their practical application; the gas response toward a specific gas needs to be markedly higher than for other gases. To explore the selectivity of S1, a bar graph (Fig. 7b) of the sensor based on as-obtained WO3–rGO toward several different gases like methanol, ethanol, acetone, NO2 and H2S, is displayed. All gases were tested at 90 °C under same concentration (10 ppm). As shown, the sensor possesses a good selectivity to NO2 gas in comparison to other tested gases. It is worth noting that the responses to methanol (∼1.4), ethanol (∼1.1), toluene (∼1) and xylene (∼1) are minor and can be ignored, when compared to NO2.
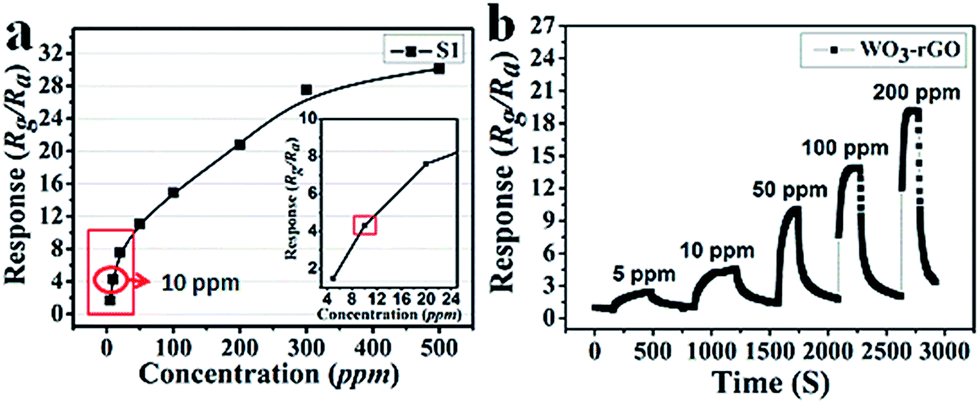
Next, the dynamic response transients' features of S1 at 90 °C are summarized in Fig. 8a to highlight the monotonicity of response versus gas concentration. Clearly, the response value increases with the increase in gas concentration, indicating that the sensor (S1) responds well to this variation. Besides, it is noteworthy that at a lower concentration range the response is more acute. As mentioned, the response value of a sensor mainly depends on the surface chemical reaction. Hence, when the concentration of the test gas is relatively low, there are fewer reactions occurring on the surface. Along with the increase in concentration, the sensing reaction increases sharply, resulting in a linear trend. However, when the concentration exceeds 200 ppm and continues rising, this trend levels off because most active sites have already reached saturation. In Fig. 8b, the dynamic response transients of S1 present nearly a square shape, which suggests that when the sensor is exposed to NO2 gas, the response value achieves a maximum quickly. The maintained state can also be explained by saturated reaction sites not causing effective resistance variation or changing slightly. While the sensor is exposed to fresh air, the response returns to a near baseline level.
 | ||
| Fig. 8 (a) The relationship plots of response versus concentration and (b) dynamic response transients of S1 sample to 5–200 ppm NO2 at 90 °C. | ||
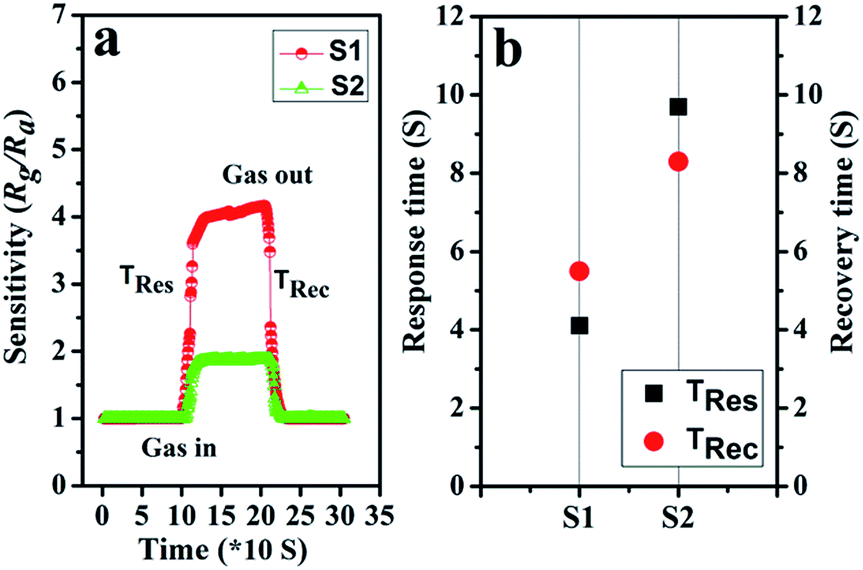
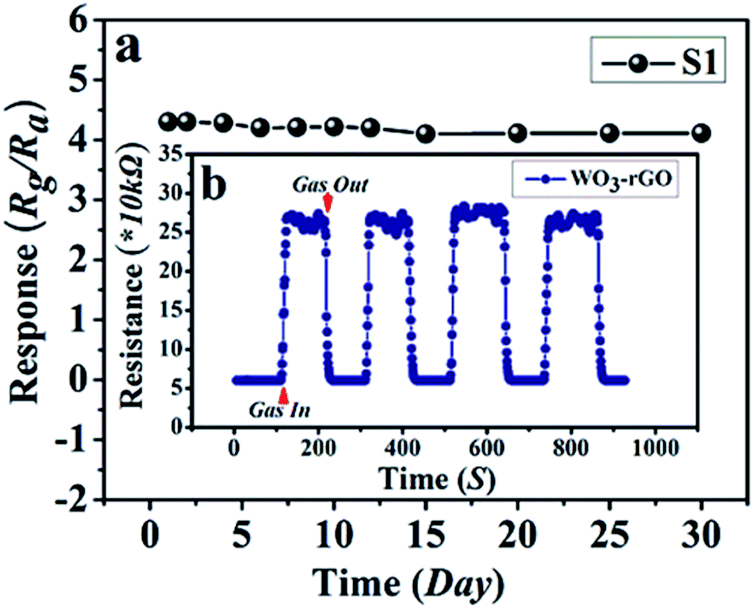
The response and recovery times also play a vital part in the practical detection to some detrimental and dangerous gases.21,34 In theory, fast charge separation occurs at the interface of the heterostructure and the body of sensing material, so that the generated electrons can efficiently react with test gases during the sensing process and bring about an efficient response/recovery speed.6,34,38 Besides, a favourable nano/micro-structure also benefits gas diffusion and mass transport, and improvements in response/recovery time, such as a porous and surface-roughened sheet-like structure. To evaluate our sensing material systematically, Fig. 9 shows the response and recovery times of sensors toward 10 ppm NO2. By contrast, the response times are 4.1 and 10.3 s for S1 and S2, while the corresponding recovery times are 5.8 and 8.7 s, respectively. The long-term cyclic stability of the sensor based on S1 composite was measured (Fig. 10). From Fig. 10a the sensor exhibits nearly constant sensing signals in one month and quite similar shapes at each time to 10 ppm NO2 during the test (Fig. 10b), confirming its improved stability and repeatable performance in application.
 | ||
| Fig. 9 (a) The dynamic NO2 response transients of S1 and S2 at 90 °C; (b) the plot of response/recovery time of sensors. | ||
 | ||
| Fig. 10 (a) Long-term stability of gas sensor based on S1 to 10 ppm NO2 at 90 °C; (b, the inset) the dynamic resistance transients of S1 to 10 ppm NO2 during the stability test. | ||
3.3 Gas sensing mechanism
Gas sensors based on binary composite have attracted a lot of attention owing to their excellent sensing performance. As reported in previous literature, a popular and widely accepted gas sensing mechanism model was employed to illustrate the sensing process of the target WO3–rGO composite, namely surface-controlled model.4,14,30,36In this case, the resistance of sensor produces regular signal variations caused by the adsorption, reaction and desorption processes of gas molecules on the surface/interface. When the sensor is exposed to air, oxygen molecules in air will be chemisorbed and dissociates on the surface of the sensing film. These O2 molecules will capture electrons, transferring them from a conduction band to chemisorbed oxygen and generating ion-adsorbed oxygen species (O2−, O−, O2−) film on the surface of the sensing layer. This results in a decrease in carrier density and formation of an electron depletion region (EDR) near the surface of sensing materials, leading to an initial resistance.29,39–41 The specific reactions are as follows (eqn (1)–(3)):
| O2 (gas) → O2 (ads) | (1) |
| O2 (ads) + e− → O2− (ads) | (2) |
| O2− (ads) + e− → 2O− (ads) | (3) |
On exposure to NO2 (target gas), the NO2 as an oxidizing gas with relatively strong electrophilic property,37 seizes electrons from the energy band of the sensing film and pre-adsorbed oxygen ions as in the reactions below:
| NO2 (ads) + e− → 2NO2− | (4) |
| NO2 (gas) + O2− + 2e− → NO2− + 2O− (ads) | (5) |
These eqn (4) and (5) indicate that the total resistance increases with the injection of NO2 gas, leading to a significant increase in the sensor's resistance. When NO2 supply is cut off, the gas sensing reaction starts on the recovery stage and the adsorbed NO2− ions begin to desorb. This process will release electrons trapped by adsorbed NO2− and O− ions back into the conduction band, forming an electron accumulation region (EAR) near the surface.27,32 Thus, the resistance will recover to its initial value, and generate another electrical signal. Eventually, a gas sensing cycle is obtained. The reaction in this stage is simply described by eqn (6):
| NO2− (ads) + 2O− (ads) → NO2 (gas) + O2 (gas) + 2e− (ads) | (6) |
As the sensing test indicates, the whole of the WO3–rGO composite presents p-typed gas sensing behaviour. During the process, it means that p-type metal oxides only chemisorb as much oxygen as possible to compensate for their deficiencies,42,43 if the number of active sites and concentration of surface oxygen on p-type materials are not limited.
As confirmed, a gas sensor based on WO3–rGO sheet-like composite exhibits much enhanced response properties, compared with that of pure WO3 and GO. The excellent gas sensing performance mainly results from the following factors: first, compared to the test data of pristine GO nanosheets, the co-presence of WO3 and rGO have an intimate contact at the nano-level, which further contributes to the improvement of the whole sensing performance, especially in regard to response; second, the well-known electrochemical activity of rGO nanosheets is believed to play a further beneficial role on the functional behaviour.14 The outstanding conductivity of rGO supported material dramatically improves electron transfer efficiency of the composite, embodied in the enhancement of the sensor's response/recovery speed. And as reported, the products, WO3 and rGO, both possess better sensing properties toward the test NO2 gas.26,32,33 The synergistic effect is also employed to explain the enhancement of composite's properties.26–29 Besides, the interesting 3-D structural characteristics, loose and porous structure, and large available surface area, are crucially important to shorten the response and recovery times, and to enhance response of the gas sensor.
4. Conclusions
In summary, a facile and cost-effective hydrothermal synthesis method was successfully employed to prepare 3-D WO3–rGO composite. The novel structure of as-obtained sample was characterized by a series of analytic techniques, and its gas sensing properties were investigated at length. We found that the introduction of WO3 into rGO nanosheets significantly enhanced the whole NO2 sensing performance, reflecting in low working temperature, responding effectively and having a wide linear range and good selectivity to NO2. The reasons for this phenomenon are discussed and explained by the formation of hetero-junctions, good electron transporting properties, and porous and ordered sheet-shaped structure. We believe that hierarchical WO3–rGO composite will have a great application not only in the gas-sensing field but also in other advanced functional material frontiers. We anticipate our work here provides more incentive to support the preparation of high-performance graphene-supported material in related areas.Acknowledgements
The author thanks the financial supports of the National Natural Science Foundation of China (51402065 & 61473095), Fundamental Research Funds of the Central University (HEUCFZ), the Major Project of Science and Technology of Heilongjiang Province (GA14A101), International Science & Technology Cooperation Program of China (2015DFR50050) and Natural Science Foundation of Heilongjiang Province (B201404).Notes and references
- R. A. Potyrailo, C. Surman, N. Nagraj and A. Burns, Chem. Rev., 2011, 111, 7315–7354 CrossRef CAS PubMed.
- R. Sui and P. Charpentier, Chem. Rev., 2012, 112, 3057–3082 CrossRef CAS PubMed.
- Y. Xu, L. Chen, X. Wang, W. Yao and Q. Zhang, Nanoscale, 2015, 7, 10559–10583 RSC.
- J. H. Lee, Sens. Actuators, B, 2009, 140, 319–336 CrossRef CAS.
- S. Xu, F. Sun, Z. Pan, C. Huang, S. Yang, J. Long and Y. Chen, ACS Appl. Mater. Interfaces, 2016, 8, 3428–3437 CAS.
- Y. Yang, C. Tian, J. Wang, L. Sun, K. Shi, W. Zhou and H. Fu, Nanoscale, 2014, 6, 7369–7378 RSC.
- X. An, J. C. Yu, Y. Wang, Y. Hu, X. Yu and G. Zhang, J. Mater. Chem., 2012, 22, 8525 RSC.
- Y. Du, X. Zhou, X. Zhou, L. Hu, Z. Dai and J. Bao, J. Mater. Chem. A, 2015, 3, 6787–6791 CAS.
- S. Zhang, H. Liu, C. Huang, G. Cui and Y. Li, Chem. Commun., 2015, 51, 1834–1837 RSC.
- Z. Gao, W. Yang, J. Wang, N. Song and X. Li, Nano Energy, 2015, 13, 306–317 CrossRef CAS.
- C. Wu, X. Lu, L. Peng, K. Xu, X. Peng, J. Huang, G. Yu and Y. Xie, Nat. Commun., 2013, 4, 2431 Search PubMed.
- G. Wang, L. Zhang and J. Zhang, Chem. Soc. Rev., 2012, 41, 797–828 RSC.
- Y. Zhai, Y. Dou, D. Zhao, P. F. Fulvio, R. T. Mayes and S. Dai, Adv. Mater., 2011, 23, 4828–4850 CrossRef CAS PubMed.
- H. Zhang, J. Feng, T. Fei, S. Liu and T. Zhang, Sens. Actuators, B, 2014, 190, 472–478 CrossRef CAS.
- A. Cagliani, D. M. A. Mackenzie, L. K. Tschammer, F. Pizzocchero, K. Almdal and P. Boggild, Nano Res., 2014, 7, 743–754 CrossRef CAS.
- D. Zhang, H. Chang, P. Li, R. Liu and Q. Xue, Sens. Actuators, B, 2016, 225, 233–240 CrossRef CAS.
- Y. Xiao, Q. Yang, Z. Wang, R. Zhang, Y. Gao, P. Sun, Y. Sun and G. Lu, Sens. Actuators, B, 2016, 227, 419–426 CrossRef CAS.
- A. Lipatov, A. Varezhnikov, P. Wilson, V. Sysoev, A. Kolmakov and A. Sinitskii, Nanoscale, 2013, 5, 5426–5434 RSC.
- S. Wang, X. Gao, J. Yang, Z. Zhu, H. Zhang and Y. Wang, RSC Adv., 2014, 4, 57967–57974 RSC.
- J. Li, Q. Li, Y. Zeng, T. Tang, Y. Pan and L. Li, RSC Adv., 2015, 5, 717–725 RSC.
- D. Guo, P. Cai, J. Sun, W. He, X. Wu, T. Zhang, X. Wang and X. Zhang, Carbon, 2016, 99, 571–578 CrossRef CAS.
- Z. Zhang, X. Zou, L. Xu, L. Liao, W. Liu, J. Ho, X. Xiao, C. Jiang and J. Li, Nanoscale, 2015, 7, 10078–10084 RSC.
- G. Lu, L. E. Ocola and J. Chen, Adv. Mater., 2009, 21, 2487–2491 CrossRef CAS.
- Y. Liu, J. Parisi, X. Sun and Y. Lei, J. Mater. Chem. A, 2014, 2, 9919–9943 CAS.
- S. Srivastava, K. Jain, V. N. Singh, S. Singh, N. Vijayan, N. Dilawar, G. Gupta and T. D. Senguttuvan, Nanotechnology, 2012, 23, 205501 CrossRef PubMed.
- T. Kida, A. Nishiyama, Z. Hua, K. Suematsu, M. Yuasa and K. Shimanoe, Langmuir, 2014, 30, 2571–2579 CrossRef CAS PubMed.
- P. Su and S. Peng, Talanta, 2015, 132, 398–405 CrossRef CAS PubMed.
- V. K. Tomer, S. Devi, R. Malik, S. P. Nehra and S. Duhan, Sens. Actuators, B, 2016, 229, 321–330 CrossRef CAS.
- J. Shi, Z. Cheng, L. Gao, Y. Zhang, J. Xu and H. Zhao, Sens. Actuators, B, 2016, 230, 736–745 CrossRef CAS.
- X. Jie, D. Zeng, J. Zhang, K. Xu, J. Wu, B. Zhu and C. Xie, Sens. Actuators, B, 2015, 220, 201–209 CrossRef CAS.
- T. Liu, J. Liu, Q. Liu, D. Song, H. Zhang, H. Zhang and J. Wang, Nanoscale, 2015, 7, 19714–19721 RSC.
- L. Hu, B. Qu, C. Li, Y. Chen, L. Mei, D. Lei, L. Chen, Q. Li and T. Wang, J. Mater. Chem. A, 2013, 1, 5596–5602 CAS.
- M. Bao, Y. Chen, F. Li, J. Ma, T. Lv, Y. Tang, L. Chen, Z. Xu and T. Wang, Nanoscale, 2014, 6, 4063–4066 RSC.
- D. Yang, K. Kang, D. Kim, Z. Li and I. Park, Sci. Rep., 2015, 5, 8149 CrossRef PubMed.
- Y. Feng, N. Feng, G. Zhang and G. Du, CrystEngComm, 2014, 16, 214–222 RSC.
- F. Qu, J. Liu, Y. Wang, S. Wen, Y. Chen, X. Li and S. Ruan, Sens. Actuators, B, 2014, 199, 346–353 CrossRef CAS.
- U. Yaqoob, A. S. M. I. Uddin and G. S. Chung, Sens. Actuators, B, 2016, 224, 738–746 CrossRef CAS.
- Y. Tian, J. Li, H. Xiong and J. Dai, Appl. Surf. Sci., 2012, 258, 8431–8438 CrossRef CAS.
- A. K. Nayak, R. Ghosh, S. Santra, P. K. Guha and D. Pradhan, Nanoscale, 2015, 7, 12460–12473 RSC.
- D. Sarkar, X. Xie, J. Kang, H. Zhang, W. Liu, J. Navarrete, M. Moskovits and K. Banerjee, Nano Lett., 2015, 15, 2852–2862 CrossRef CAS PubMed.
- T. Liu, J. Liu, Q. Liu, Y. Sun, X. Jing, H. Zhang and J. Wang, CrystEngComm, 2016, 18, 5728–5735 RSC.
- P. A. Russo, N. Donato, S. G. Leonardi, S. Baek, D. E. Conte, G. Neri and N. Pinna, Angew. Chem., Int. Ed., 2012, 51, 11053–11057 CrossRef CAS PubMed.
- S. Cao, W. Zeng, H. Long and H. Zhang, Mater. Lett., 2015, 159, 385–388 CrossRef CAS.
Footnote |
| † Electronic supplementary information (ESI) available. See DOI: 10.1039/c6ra28379a |
| This journal is © The Royal Society of Chemistry 2017 |