 Open Access Article
 This Open Access Article is licensed under a
 Creative Commons Attribution 3.0 Unported Licence
Clean air in the Anthropocene
Jos
Lelieveld
*
Max Planck Institute for Chemistry, Hahn-Meitner-Weg 1, 55128 Mainz, Germany. E-mail: jos.lelieveld@mpic.de; Tel: +49 6131 305 4000
First published on 12th July 2017
Abstract
In atmospheric chemistry, interactions between air pollution, the biosphere and human health, often through reaction mixtures from both natural and anthropogenic sources, are of growing interest. Massive pollution emissions in the Anthropocene have transformed atmospheric composition to the extent that biogeochemical cycles, air quality and climate have changed globally and partly profoundly. It is estimated that mortality attributable to outdoor air pollution amounts to 4.33 million individuals per year, associated with 123 million years of life lost. Worldwide, air pollution is the major environmental risk factor to human health, and strict air quality standards have the potential to strongly reduce morbidity and mortality. Preserving clean air should be considered a human right, and is fundamental to many sustainable development goals of the United Nations, such as good health, climate action, sustainable cities, clean energy, and protecting life on land and in the water. It would be appropriate to adopt “clean air” as a sustainable development goal.
1 Introduction
In the past century, the influence of mankind on the environment has grown immensely, and has essentially developed into a geological force, hence the Earth system has entered the Anthropocene epoch.1 During the second half of the 20th century this influence accelerated sharply, with a doubling of the human population from 3 to 6 billion (and probably 9 billion in 2050), and with leaps in agricultural, economic and industrial activity.2 Globally, more than 50% of the population lives in the urban environment, typically associated with degraded and poor air quality. However, air pollution emissions and their impacts extend well beyond the city boundaries, also transforming biogeochemical cycles and contributing to regional and global climate change.3 The World Health Organization (WHO) has identified air pollution as a major environmental health risk, and notes that its abatement will also reduce emissions of carbon dioxide (CO2) and short-lived climate pollutants. Nearly 90% of humanity lives in areas where the WHO air quality guideline of 10 μg m−3 annual average PM2.5 is exceeded4 (PM2.5 is fine particulate mass with a diameter less than 2.5 μm). It has been estimated that worldwide about 3.3 million deaths were attributable to PM2.5 and ozone (O3) pollution in the year 2010,5,6 and it will be argued here that this number needs to be revised upward.Building on the Millennium Development Goals by the United Nations (UN), articulated for the period 2000 until 2015, the General Assembly of the UN has adopted 17 Sustainable Development Goals (SDGs) to be pursued for the subsequent phase up to 2030 (Fig. 1). The SDG Knowledge Platform on the topic “atmosphere” focusses on the Agenda for Sustainable Development paragraphs related to climate change, e.g. by calling for the reduction of CO2 and other greenhouse gas emissions. It also acknowledges the need to enhance the implementation of strategies to monitor the Earth’s atmosphere, and mentions international agreements such as the Montreal Protocol on Substances that Deplete the Ozone Layer. While the prominence of atmospheric composition is undisputed with respect to ozone loss in the stratosphere and climate change, it is crucial that the UN also recognise the central importance for air quality and public health. In terms of the value of lives lost and ill health, air pollution is costing OECD societies plus China and India an estimated 3.5 trillion US dollars per year, with a rising trend.7
 | ||
| Fig. 1 The 17 SDGs of the UN, aimed at ending poverty, protecting the planet, and ensuring prosperity for all as part of the sustainable development agenda. Each goal has specific targets to be achieved over the period 2015–2030 (http://www.un.org/sustainabledevelopment/sustainable-development-goals/). An 18th SDG aimed at clean air should be added. | ||
It is proposed here to adopt an additional SDG on “clean air”, at the same level as good health, clean water, sustainable industrialization and cities, responsible production, climate action, marine and terrestrial life (SDGs 3, 6, 9, 11, 12, 13, 14, 15, respectively), not only because ambient air pollution is the leading environmental risk factor of the global burden of disease,8 but also because many other SDGs cannot be achieved without considering air quality. The next Section 2 focusses on results from the Faraday Discussion meeting Atmospheric chemistry in the Anthropocene, held in York, UK, from 22–24 May 2017, which presented scientific results that underpin this statement. Section 3 presents an update of the contribution of outdoor air pollution sources to the global burden of disease by Lelieveld et al.,6 taking into account recent health data and statistics by the WHO, and revised integrated exposure–response (IER) functions to compute mortality attributable to ambient air pollution.8 Section 4 discusses the link between air quality and climate change, and the concluding Section 5 reiterates the “clean air” proposal in view of recent developments regarding air quality in the Anthropocene.
2 Atmospheric chemistry in the Anthropocene
An important subject of the Faraday Discussion meeting was the link between atmospheric chemistry and the biosphere, starting with a dedicated session, and revisited in subsequent sessions that focussed on chemical processes and air quality aspects. The discussion reflected a central quality of the Anthropocene, namely that human influence, through atmospheric composition change, profoundly interferes with the biological state of the environment, associated with adverse effects on ecosystems and agricultural crops, changing biogeochemical cycles and public health risks. It also manifested a growing interest in the complex interactions between the physical–chemical and biological workings of the Earth system. Many studies presented in York addressed processes across and at interfaces, e.g. on multiphase and heterogeneous chemistry, including air pollution impacts on bioaerosols and human tissue, being novel developments in the field. In the following paragraphs the presentations are briefly summarized, and details can be found in the referenced articles.Brüggemann et al. (DOI: 10.1039/C7FD00022G) reported their discovery that organic surfactants of biogenic origin (biofilms) lead to volatile organic compound (VOC) production through sunlight-induced radical chemistry, a potential major marine source of VOCs and reaction products that can influence secondary organic aerosols (SOA) and oxidants in the background atmosphere. A modelling study of natural and anthropogenic halogen chemistry indicated significant effects on oxidant formation. It found that iodine and bromine chemistry may actually help improve air quality by reducing ozone, while chlorine chemistry might have a moderate opposite effect (Sherwen et al., DOI: 10.1039/C7FD00026J). Anthropogenic land use change was shown to reduce biogenic VOC emissions and consequent SOA formation, which is expected to influence air quality and climate change (Scott et al., DOI: 10.1039/C7FD00028F). While aerosols decrease direct and increase diffuse sunlight, thus cooling and drying the climate system, the net primary productivity (net carbon uptake) of forest expanses e.g. in the Amazon and the boreal region may change in converse directions (Unger et al., DOI: 10.1039/C7FD00033B). Because of the geographically counterbalancing outcomes, the net effect on global atmospheric CO2 may thus be small.
The interaction of some noxious air pollutants, such as polycyclic aromatic hydrocarbons (PAHs), with SOA appears to remarkably strongly affect the properties of aerosols, e.g. by increasing the SOA mass, particle number concentration and viscosity, which may influence the long-range transport potential of PAHs (Zelenyuk et al., DOI: 10.1039/C7FD00032D). Charnawskas et al. (DOI: 10.1039/C7FD00010C) showed that a combination of soot and semi-solid SOA can act as ice nuclei. It seems that biogenic SOA does not (especially when mixed with sulfate), but anthropogenic SOA can actually affect mixed ice-liquid water clouds and hence precipitation by enhancing glaciation, depending on the particle phase state. Long-term aircraft measurements taken from commercial airliners, presented by Petzold et al. (DOI: 10.1039/C7FD00006E), demonstrate that the relative humidity distribution over ice in cirrus clouds, RHice, strongly correlates with ice particle number concentrations. Measurements showed that within thin cirrus clouds in the subtropics and tropics RHice ≈ 100% and at mid-latitudes RHice ≈ 105% (only occasionally higher).
A dedicated session of the Faraday meeting addressed new research tools (not elaborated here†), which was also reflected in discussions of atmospheric chemistry processes, showing that recent instrument development is opening new territory for research. For example, Tong et al. (DOI: 10.1039/C7FD00023E) studied interactions of mineral dust with SOA particles, leading to formation of reactive oxygen species (ROS) in aqueous solution, e.g. from the decomposition of organic hydroperoxides. This could be a main mechanism of oxidant formation in clouds and fogs, and possibly also in the human respiratory tract, causing oxidative stress with health outcomes. Liu et al. (DOI: 10.1039/C7FD00005G) uncovered that air pollutants such as O3 and NO2 can enhance the allergenic potential of proteins in bioaerosols, e.g. through their nitration and oligomerization. The extent of these processes depends on the RH due to moisture-induced phase transition of proteins, also highlighting the importance of cloud processing of aerosols. Increasing tropospheric O3 in the Anthropocene can promote pro-allergic protein modifications and may have contributed to the observed increase of allergies.
New particle formation (NPF) in the atmosphere can be induced by a number of processes that involve anthropogenic and natural (including biogenic) precursor gases, and current theory explains NPF in clean and moderately polluted environments, however, not in heavily polluted megacities. NPF is nevertheless observed in megacities, e.g. in China, which indicates that molecular cluster scavenging may be over-, or their growth under-estimated (Kulmala et al., DOI: 10.1039/C6FD00257A). The recently constructed atmospheric reaction chamber HELIOS was shown to simulate realistic atmospheric conditions, and used to study the chemistry of isoprene, reaction intermediates, oxidant recycling and SOA yields (Ren et al., DOI: 10.1039/C7FD00014F). An upcoming research topic is the atmospheric chemistry of Criegee intermediates (CIs), i.e. biradicals formed from the reaction of ozone with olefinic VOCs of natural and anthropogenic origin, which can react with SO2 and NO2. Caravan et al. (DOI: 10.1039/C7FD00007C) performed laboratory studies on the CI reaction with NO2, and found that NO3 is not a likely product, while a species with the exact mass of the Criegee–NO2 adduct was observed, possibly the major reaction product.
Another emerging topic is that of fine particulate (PM1) chemistry and thermodynamics, e.g. based on aerosol mass spectrometer measurements in field campaigns. PM1 measurements from a tower and a zeppelin indicated excess ammonium with respect to inorganic ions (Schlag et al., DOI: 10.1039/C7FD00027H). It was shown that heterogeneous reactions with organic compounds, notably (di)carboxylic acids, i.e. oxidation products of atmospheric VOCs, likely explain the NH3 uptake. This suggests that NH3 emission controls will have benefits for air quality beyond the reduction of inorganic ammonium salts, i.e. from controlling SO2 and NO2 emissions. Murphy et al. (DOI: 10.1039/C7FD00086C) used a thermodynamic gas-particle partitioning model to study the impact of the ammonium/(bi)sulfate ratio on the pH of aerosols. It was found that an increase of this ratio may lead to a steep rise of particle pH, which influences the chemistry and environmental impacts of aerosols.
3 Public health impact of air pollution
The session on “The air we breathe: past, present and future”, provided compelling support for dedicating an SDG to clean air. To contribute to the Faraday Discussion on this topic, our group used a global atmospheric chemistry-general circulation model,9 applying emission estimates from the Emission Database for Global Atmospheric Research (EDGAR) as boundary conditions.10 The model results have been combined with IER functions, following Lelieveld et al.,6 updated according to Cohen et al.,8 to compute the relative risk of mortality by acute lower respiratory infections (ALRI) in childhood, chronic obstructive pulmonary disease (COPD), cerebrovascular disease (CEV), leading to mortality by ischaemic and haemorrhagic stroke (i.e. CEVI and CEVH, respectively), ischaemic heart disease (IHD) and lung cancer (LC) (Fig. 2). These diseases are related to PM2.5, while COPD is additionally related to O3. All data sets used as input for the calculations, such as country level baseline mortality rates for these diseases and population data, have been adopted from the WHO Global Health Observatory (http://www.who.int/gho/database/en/), being representative of the year 2015. | ||
| Fig. 2 Air pollution related mortality by ischaemic heart disease (IHD), chronic obstructive pulmonary disease (COPD), cerebrovascular disease (CEV) through ischaemic and haemorrhagic stroke (CEVI and CEVH), acute lower respiratory infections in childhood (ALRI) and lung cancer (LC). | ||
The minimum risk exposure level distribution for annual mean PM2.5, adopted in the IER functions, is 2.4–5.9 μg m−3, which is lower than the previously assumed range of 5.8–8.8 μg m−3,11 and that of O3 is 33.3–41.9 ppbv.8 This recent downward adjustment of the lower bound for PM2.5, i.e. from 5.8 to 2.4 μg m−3, is a main reason for the higher mortality estimates presented here compared to earlier work, since a larger fraction of the population is exposed to hazardous levels of air pollution. Further, the mortality rates for COPD are significantly higher than reported previously. Thus, the state-of-the-science is that only the very low PM2.5 concentrations <2.4 μg m−3 do not contribute to morbidity and mortality. The results presented here agree closely with those of Cohen et al.8 for the year 2015, on average within a few percent. Our global estimates for PM2.5 compare well, and for O3 they are slightly higher, largely related to the different methodologies in calculating the global concentration distributions of ozone.
Our updated results indicate a total mortality attributable to outdoor air pollution of 4.33 million persons per year, which is about 30% higher than estimated previously by Lelieveld et al. and by the global burden of disease (GBD) for the year 2010.5,6 The statistical uncertainty range is estimated at ±50% (95% confidence interval). Note that the IERs for very high levels of PM2.5 are associated with the largest uncertainty, as epidemiological data for such conditions are scarce. About 739![[thin space (1/6-em)]](https://www.rsc.org/images/entities/char_2009.gif) 500 per year are due to ALRI, 743000 per year to COPD, 377000 per year to CEVI, 491000 per year to CEVH (hence 868000 per year in total due to CEV), 1.4 million per year to IHD, 282000 to LC and 298000 per year due to O3 related COPD (hence 1.04 million in total due to COPD) (Fig. 2). The estimated mortality attributable to air pollution in the EU-28 is 274000 per year, and for Europe as a whole 332000 per year (not including Russia and Ukraine). The global total number of years of life lost (YLL) is 123 million per year, which implies that each individual who dies prematurely due to air pollution loses about 28 years of his/her life. The life expectancy reduction is largest for ALRI as it affects infants, especially in countries where nutrition and medical care are deficient, being on average 54 years, and 20–25 years for the other disease categories.
500 per year are due to ALRI, 743000 per year to COPD, 377000 per year to CEVI, 491000 per year to CEVH (hence 868000 per year in total due to CEV), 1.4 million per year to IHD, 282000 to LC and 298000 per year due to O3 related COPD (hence 1.04 million in total due to COPD) (Fig. 2). The estimated mortality attributable to air pollution in the EU-28 is 274000 per year, and for Europe as a whole 332000 per year (not including Russia and Ukraine). The global total number of years of life lost (YLL) is 123 million per year, which implies that each individual who dies prematurely due to air pollution loses about 28 years of his/her life. The life expectancy reduction is largest for ALRI as it affects infants, especially in countries where nutrition and medical care are deficient, being on average 54 years, and 20–25 years for the other disease categories.
Considering that the diseases attributable to air pollution are analogous to those from tobacco smoking, the problem of degraded air quality may be characterized as “passive outdoor smoking”. Among the leading GBD risk factors, ambient particulate matter pollution ranks fifth, after high blood pressure, smoking, diabetes and high cholesterol,8 and it is reiterated that it is the largest environmental risk factor in the GBD. To put the problem in context, the WHO estimates that the number of people who die annually from malaria and HIV/AIDS together is about 1.5–1.6 million, which is roughly one third compared to air pollution. It should be mentioned that the loss of life from malaria and HIV/AIDS has been brought down significantly in the past decade as a result of active research, and energetic prevention and control programmes, which are also needed for global air pollution.
Table 1 ranks the countries where the annual mortality exceeds 30000 individuals per year. China and India lead, partly related to their large population size. On the other hand, the population weighted, per capita mortality attributable to air pollution is highest in the Ukraine and Russia, with about 1.7 × 10⁻³ and 1.6 × 10⁻³ persons per year, respectively, while in China it is ∼1.0 × 10⁻³ persons per year (i.e. one per 1000 person-years) (Fig. 3). The attribution to source sectors in Table 1 is from Lelieveld et al.,6 calculated by omitting the respective emissions in the model. On a global scale, residential energy use for heating and cooking is the largest source category (31%), notably because it is the major one in Asia. In Eastern Asia and Europe agricultural emissions are important, notably NH3 from animal husbandry and fertilizer use, because this gas is an effective precursor of PM2.5.12 In Germany, for example, 24000 deaths per year may be prevented by banning NH3 emissions from agriculture while, for comparison, it is 11000 deaths per year for road traffic emissions. Note that the latter is 3.5 times the annual number of fatalities by traffic accidents in Germany.
| Country | Deaths (×103) | Residential energy | Agriculture | Natural | Power generation | Industry | Biomass burning | Road traffic |
|---|---|---|---|---|---|---|---|---|
| a Including South Sudan. | ||||||||
| China | 1319 | 32 | 29 | 9 | 18 | 8 | 1 | 3 |
| India | 921 | 50 | 6 | 11 | 14 | 7 | 7 | 5 |
| Russia | 216 | 7 | 43 | 1 | 22 | 8 | 8 | 11 |
| Nigeria | 157 | 14 | 1 | 77 | 0 | 0 | 8 | 0 |
| Pakistan | 126 | 31 | 2 | 57 | 2 | 2 | 2 | 3 |
| USA | 115 | 6 | 29 | 2 | 31 | 6 | 5 | 21 |
| Indonesia | 83 | 60 | 2 | 0 | 5 | 4 | 27 | 2 |
| Japan | 79 | 12 | 38 | 0 | 17 | 18 | 5 | 10 |
| Ukraine | 77 | 6 | 52 | 0 | 18 | 9 | 5 | 10 |
| Bangladesh | 72 | 55 | 10 | 0 | 15 | 7 | 7 | 6 |
| Sudana | 57 | 1 | 0 | 92 | 1 | 0 | 6 | 0 |
| Germany | 54 | 8 | 45 | 0 | 13 | 13 | 1 | 20 |
| Egypt | 45 | 1 | 3 | 92 | 2 | 1 | 0 | 1 |
| Brazil | 39 | 9 | 4 | 1 | 2 | 6 | 71 | 7 |
| Iran | 32 | 1 | 6 | 81 | 4 | 3 | 1 | 4 |
| Italy | 32 | 7 | 39 | 6 | 15 | 14 | 2 | 17 |
| Vietnam | 32 | 51 | 12 | 0 | 13 | 8 | 12 | 4 |
| Turkey | 31 | 9 | 29 | 15 | 19 | 11 | 6 | 11 |
| Poland | 31 | 15 | 43 | 0 | 16 | 10 | 3 | 13 |
| N-Korea | 30 | 21 | 38 | 0 | 20 | 12 | 4 | 5 |
| World | 4333 | 31 | 20 | 18 | 14 | 7 | 5 | 5 |
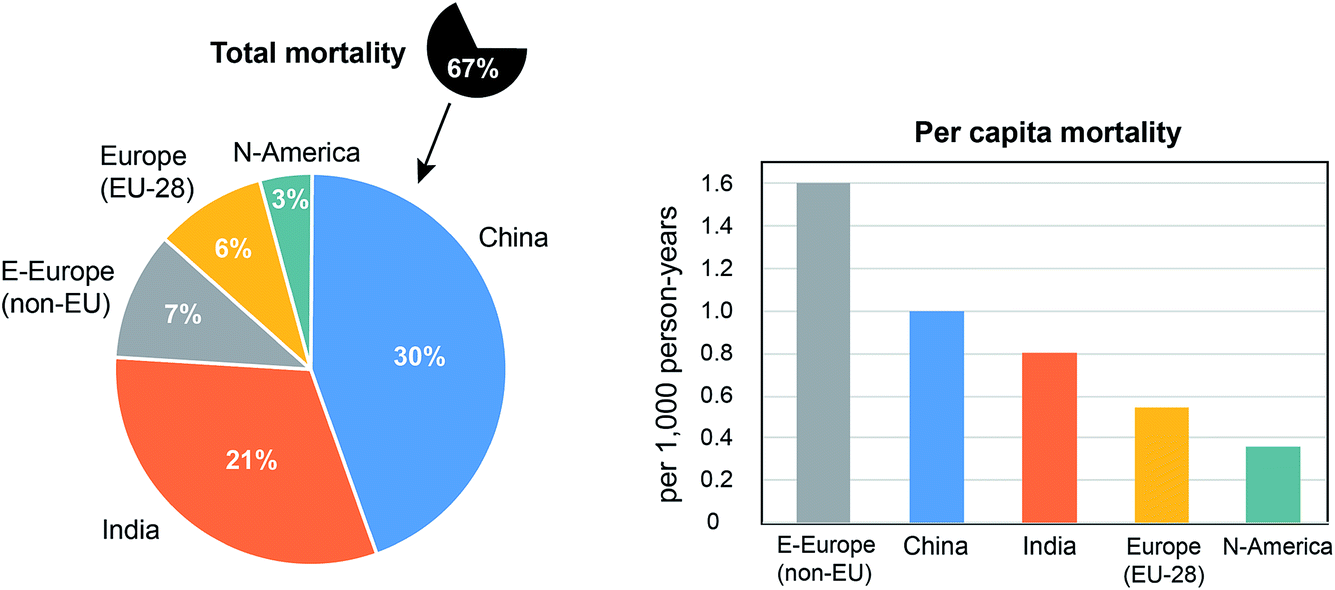 | ||
| Fig. 3 Mortality attributable to air pollution in China, India, Eastern Europe (Russian Federation, Ukraine, i.e. non-EU), Europe (EU-28) and North America, together 67% of 4.33 million in the year 2015 (left), and the per capita mortality per 1000 person per years (right). | ||
Another contribution to the Faraday Discussion by Lacey et al. (DOI: 10.1039/C7FD00011A), also applying a chemistry-transport model combined with IER functions, focussed on the impacts of air pollution on public health in Africa, where population, urbanisation and industrialization are increasing rapidly. Based on improved Africa-specific emission estimates, residential energy use was found to contribute most to anthropogenic air pollution related mortality. In future, impacts related to fossil energy use are expected to become more prominent. Further, Archibald et al. (DOI: 10.1039/C7FD00004A) applied a chemistry-climate model to study the reduction of mortality due to air pollution emission controls in the last decades, focussing on the USA and Western Europe. An alternative time trajectory of emissions was considered as a “world avoided” scenario. A business-as-usual scenario since 1970 was compared to one that accounts for the legislation that has been implemented between 1970 and 2010. It was found that more than 520000 mortalities have been mitigated owing to extensive reduction in sulphate aerosol and improvements in O3 and NO2 pollution. This sends the important message that air pollution controls in the USA and EU have actually achieved considerable public health benefits, even though additional efforts will be essential to come down from the high numbers presented in Table 1 and Fig. 3.
4 Short-lived climate pollutants
While air pollutants have a typical lifetime in the atmosphere of a few days to weeks, greenhouse gases (GHGs) such as CO2, methane (CH4), nitrous oxide (N2O) and halocarbons remain airborne for years up to more than a century. Since this is longer than the mixing time scale of the whole atmosphere (about a year), the radiative forcing of climate by the increase of these gases is inevitably a global phenomenon. Tropospheric O3, which also acts as a GHG, has an intermediate lifetime of about a month and can disperse on a hemispheric scale. The human-induced increase of CO2 contributes about 55–60% to the radiative forcing of climate by GHGs, and all non-CO2 gases together about 40–45%.3 The recent total radiative forcing of climate by increasing GHGs is about 3 W m−2.In addition, anthropogenic fine aerosol particles (i.e. PM2.5) cause regional radiative forcings that can be either positive (warming) due to the absorption of sunlight by black carbon (BC) or negative by the backscattering of sunlight by water-soluble acids, salts and organics. The net aerosol radiative forcing of climate is determined by the specific pollutant mixture in the particles and is generally negative (cooling). Furthermore, the aerosols can affect cloudiness (indirect effects) because they act as cloud condensation nuclei, also leading to a negative radiative forcing. The overall radiative forcing by aerosols (direct and indirect), averaged globally, is estimated at −0.9 W m−2 and may thus mask approximately 30% of the climate warming by GHGs.3
Because the control of CO2 emissions has shown to be challenging, short-lived climate pollutants (SLCPs), including CH4, O3, some hydrofluorocarbons (HFCs) and BC, have come into the fore. SLCPs offer the advantage of responding relatively rapidly to control measures, which is particularly helpful if climate change needs to be averted in the near term. Considering that SLCPs also affect public health and ecosystems, policies on air quality and climate intersect, and it is useful to consider win–win strategies. While the latter may be expected for mitigation measures that address BC and O3, a general reduction of PM2.5 to improve public health will likely moderate the overall negative radiative forcing of aerosols. On the other hand, air pollution controls are often achieved through technology improvements, which typically also improve energy efficiency and reduce GHG emissions. It should be stressed that advocating SLCP control, e.g. of CH4, O3 and halocarbons, does not justify reduced attention for CO2 control; both are needed and should be regarded as complementary, i.e. with distinct temporal effects.
In the Faraday Discussion, Edwards et al. (DOI: 10.1039/C7FD00063D) corroborated that road transportation is responsible for emissions of both CO2 and SLCPs, e.g. BC and HFCs. Trends in short- and long-lived emissions for light- and heavy-duty transport globally and in the USA, EU, and China over the period 2000–2030 were presented, together with prospective vehicle technologies to reduce these emissions. Tailpipe emission intensities of CO, NOx, N2O, and BC from light and heavy duty vehicles globally and in the USA, EU and China have declined in the period 2000–2015, by factors of approximately 2–10 depending on the pollutant and region. However, absolute traffic emissions of SCLPs have decreased less rapidly, and even increased in China. While the short-lived emissions of vehicles have thus decreased, significant reductions in CO2 will be required by mid-century to meet climate change mitigation targets.
Finally, Shindell et al. (DOI: 10.1039/C7FD00009J) addressed the social cost of CH4 through its harmful effects on public health, agriculture and forest ecosystems. Methane has direct and indirect effects on climate forcing, including the formation of tropospheric O3, which has negative health outcomes and causes crop loss. It was found that the social costs of methane are about 50–100 times larger than of CO2. The increase of atmospheric CH4 since 2007, after a decade of constant CH4 concentrations, may have offset much of the societal benefits from a slowdown in the growth rate of CO2 emissions. The results of Shindell et al. (DOI: 10.1039/C7FD00009J) indicate that policies aimed at reducing CH4 emissions can have climate and air quality benefits at relatively low cost. Methane emission controls have the potential to play a major role in societal efforts to meet SDGs including climate action, good health, zero hunger, protecting life on land, and affordable and clean energy.
5 Concluding remarks
The Faraday Discussion meeting presented compelling evidence for a significant Anthropocene footprint discernible in the composition and chemistry of the atmosphere. The field has developed powerful tools to measure and to model processes that control atmospheric composition, and determine the environmental impacts, e.g. on air quality and climate. Considerable progress has been achieved regarding the climate forcing of reactive GHGs and aerosols, offering knowledge that can be used to formulate policies on SLCPs such as HFCs, CH4 and O3. Much uncertainty remains on the chemistry and radiative properties of aerosols. Direct and indirect effects of aerosols on radiative forcing are important to estimate the climate sensitivity to GHG emissions. If the net cooling effect of aerosols would be smaller than assumed, for example due to light absorption by BC, the estimated rate of warming due to increasing CO2 based on observations would be proportionally smaller. An emerging topic in atmospheric chemistry is the impact of aerosols and ROS on public health.Results from our group, based on updated air pollution, health and population data sets, suggest that the mortality attributable to outdoor air pollution amounts to 4.33 million individuals per year, associated with 123 million years of life lost. This refers to deaths that could have been avoided when annual average PM2.5 would be below 2.4 μg m−3 and O3 below 33.3 ppbv. More than 70% of the mortality occurs in Asia, and more than 50% in China and India (together 2.2 million per year). While the latter countries lead the ranking of total mortality, the per capita mortality is highest in Eastern Europe with 1.6 persons per 1000 inhabitants per year, being more than twice that in India and four times compared to North America (Fig. 3). The steepest recent increase in air pollution related mortality occurs in South Asia, especially India. It should be noted that globally about 18% (up to 780000 deaths per year) cannot be easily managed, and are thus difficult to avoid, being attributable to natural PM2.5, mostly aeolian desert dust.
Recently, Zhang et al. investigated the relationship between exports of goods and services and the exposure to poor air quality.13 In effect, by exporting goods and services, many countries in Asia and Eastern Europe “import” air pollution related mortality. These countries exchange monetary revenue against health expenditure through emissions embodied in exports. It is conceivable that some polluting industries have moved, e.g. from the EU and the USA, to regions with more permissive environmental regulations. To prevent such practices, international norms and agreements are needed, and an indispensable step will be that the UN adopt an SDG on “clean air”. In view of the recently updated IER functions, with the minimum risk exposure level lowered from 5.9 to 2.4 μg m−3 (annual average PM2.5), air quality standards will need to be revised, currently being 12 μg m−3 in the USA and 25 μg m−3 in the EU. The air quality guideline by the WHO of 10 μg m−3 PM2.5 should also be reconsidered, even though its global implementation could already reduce mortality attributable to air pollution by more than 50%.14
Acknowledgements
Open Access funding provided by the Max Planck Society.References
- P. J. Crutzen, Nature, 2002, 415, 23 CrossRef CAS PubMed.
- W. Steffen, J. Grinevald, P. Crutzen and J. McNeill, Philos. Trans. R. Soc., A, 2011, 369, 842–867 CrossRef PubMed.
- Intergovernmental Panel on Climate Change (IPCC), Climate Change 2013, ed. T. F. Stocker and et al., Cambridge University Press, Cambridge, UK and New York, NY, USA, 2013 Search PubMed.
- M. Brauer, et al. , Environ. Sci. Technol., 2016, 50, 79–88 CrossRef CAS PubMed.
- S. S. Lim, et al. , Lancet, 2012, 380, 2224–2260 CrossRef.
- J. Lelieveld, J. S. Evans, M. Fnais, D. Giannadaki and A. Pozzer, Nature, 2015, 525, 367–371 CrossRef CAS PubMed.
- OECD, The cost of air pollution, OECD Publishing, 2014, DOI:10.1787/9789264210448-en.
- A. J. Cohen, et al. , Lancet, 2017 DOI:10.1016/S0140-6736(17)30505-6.
- A. Pozzer, P. Zimmermann, U. M. Doering, J. van Aardenne, H. Tost, G. Janssens-Maenhout and J. Lelieveld, Atmos. Chem. Phys., 2012, 12, 6915–6937 CAS.
- M. Crippa, G. Janssens-Maenhout, F. Dentener, D. Guizzardi, K. Sindelarova, M. Muntean, R. Van Dingenen and C. Granier, Atmos. Chem. Phys., 2016, 16, 3825–3841 CAS.
- R. T. Burnett, et al. , Environ. Health Perspect., 2014, 122, 397–403 Search PubMed.
- A. Pozzer, A. Tsimpidi, V. Karydis, A. de Meij and J. Lelieveld, Atmos. Chem. Phys. Discuss., 2017 DOI:10.5194/acp-2017-390.
- Q. Zhang, et al. , Nature, 2017, 543, 705–709, DOI:10.1038/nature21712.
- D. Giannadaki, A. Pozzer and J. Lelieveld, Environ. Health, 2016, 15, 88, DOI:10.1186/s12940-016-0170-8.
Footnote |
| † Additional papers were presented at the meeting that provided insight into new instrumentation, not discussed here. These papers were: Brown et al. (DOI: 10.1039/C7FD00001D), Giorio et al. (DOI: 10.1039/C7FD00025A), Isaacman VanWertz et al. (DOI: 10.1039/C7FD00021A), Marsh et al. (DOI: 10.1039/C7FD00008A), Smith et al. (DOI: 10.1039/C7FD00020K) and Vaughan et al. (DOI: 10.1039/C7FD00002B). |
| This journal is © The Royal Society of Chemistry 2017 |