
 Open Access Article
 This Open Access Article is licensed under a
 Creative Commons Attribution 3.0 Unported Licence
Synthesis of highly functionalised plasma polymer films from protonated precursor ions via the plasma α–γ transition†
Solmaz
Saboohi
a,
Bryan R.
Coad
ab,
Hans J.
Griesser
a,
Andrew
Michelmore
 *ac and
Robert D.
Short
ad
*ac and
Robert D.
Short
ad
aFuture Industries Institute, University of South Australia, Mawson Lakes, South Australia 5095, Australia. E-mail: andrew.michelmore@unisa.edu.au
bSchool of Agriculture, Food and Wine, University of Adelaide, Adelaide SA 5005, Australia
cSchool of Engineering, University of South Australia, Mawson Lakes, South Australia 5095, Australia
dMaterials Science Institute and Department of Chemistry, University of Lancaster, City of Lancaster, UK
First published on 1st February 2017
Abstract
Chemically functionalized surfaces may be produced via plasma polymerization, however a high degree of functional group retention is often difficult to achieve. Here, the plasma polymerization of three structurally related ester precursors, ethyl isobutyrate (EIB), methyl isobutyrate (MIB) and ethyl trimethylacetate (ETMA) is compared at low and high pressure. In moving from a low pressure to higher pressure regime, significant changes in the plasma chemistry and resulting plasma polymer deposit were observed with much higher retention of chemical functionality at the higher pressure observed. Until now these changes would have been attributed to a decrease in the energy/molecule, however we show by direct measurement of the chemistry and physics of the plasma that there is fundamental shift in the properties of the plasma and surface interactions which explain the results. At low pressure (α regime) precursor fragmentation and neutral deposition dominate resulting in poor functional group retention. Increasing the pressure such that the sheath region close to surfaces becomes collisional (γ regime) favours production of protonated precursor ions which retain functionality and dominate the deposition process rather than radical species.
Introduction
The utility of materials is significantly enhanced when they are functionalized with specific surface chemical motifs that impart new physical, chemical or biological properties.1 This is the case in the fabrication of antibacterial surfaces2 and surfaces for stem cell culture and maintenance of pluripotency,3,4 biosensors and surfaces for water treatment,5 and various types of reactive surfaces.6,7In this context, the process of plasma polymerization (PP) is attractive for coating a wide range of substrates.8–10 PP offers a number of specific advantages over other coating techniques as it provides a one-step, solvent-free process, irrespective of material type and format (scaffolds, sheets or 2-d materials, fibres, hollow fibres, beads, etc.) and already supports a number of industrial products.11,12
However, the general view is that PP processes lack specificity and produce films that bear only moderate resemblance to the starting precursor or polymers prepared by conventional polymerization techniques.13 Extensive fragmentation of the volatile precursor molecule usually occurs in the plasma phase, followed by re-assembly of the various fragments into a solid polymeric coating. This process is most often described in terms of free radical chemistry.14 This view is supported by the considerable scrambling of molecular structural elements that is evident even where functional group retention has been the objective.15 For example, in the attempt to produce surfaces containing primary amines, the retained nitrogen is in a mix of primary, secondary, and tertiary amines.16–18 For this reason, PP has not been considered a suitable technique for the deposition of surface coatings that incorporate complex chemical motifs.
Attempts to retain chemistry from the precursor into coatings have largely focused on low power plasmas, in order to minimize the fragmentation of the starting compound.19,20 The use of low power decreases the energy delivered per precursor molecule which is captured in the Yasuda parameter W/FM, where W is the power input, F is the precursor flowrate and M is the precursor molecular weight.21 This parameter has been used since the 1980s as a guide to optimise plasma processes. In some cases, this is achieved by pulsing the plasma to obtain even lower time-averaged power.22 The use of low power though presents some problems; it may be difficult to maintain plasma at very low power inputs, the deposition rate can be very slow, and the deposits may be soluble.23–25
While there is general agreement that low power results in higher functional group retention through the plasma deposition process, there is no such consensus on the pressure that should be used. In a recent round robin study of researchers in the field, the operating pressure varied from less than 0.01 mbar to 0.2 mbar,26 with no correlation between W/FM and functional group retention observed. A more extensive literature survey by d’Agostino and Palumbo showed an even greater spread in the pressures routinely used by researchers in the field.27
Pressure is important in plasma processing as interactions at the surface are governed by the physics in this region, which in turn are influenced by the particle density. At low pressure, the density of particles is very low and the mean free path is high. Under these conditions the plasma is sustained by the acceleration of bulk electrons, and the electrical sheath that forms near the surface is collision-less.28 This results in the plasma being homogeneously distributed throughout the reactor and is known as alpha mode (α).29 When the pressure is increased such that the sheath region becomes collisional, electrons may be liberated in the sheath and heated by the strong electric field. When this breakdown of the sheath occurs, the plasma density near surfaces increases relative to the bulk plasma resulting in higher ion flux to the surface, but the ion energy is reduced due to ion-neutral collisions on approach to the surface. This is termed gamma (γ) mode. Therefore, operating the plasma on either side of the α → γ transition may result in very different processes at the surface and therefore plasma deposits with different properties.
Utilising a series of related ester precursors as shown in Table 1, this study addresses the effect of traversing between the α–γ regimes through changes in pressure at constant power input. The effect on the chemistry of the ions and neutrals reaching surfaces is measured by plasma phase mass spectrometry, and the relative contribution of ions to the deposition process is estimated by measuring plasma parameters and deposition rates. Finally, the combined effect of these on the chemical composition of the resulting plasma polymers is discussed.
| Precursor | Structure | Molecular weight (amu) | Low/high pressures tested (mbar) |
|---|---|---|---|
| Methyl isobutyrate (MIB) |
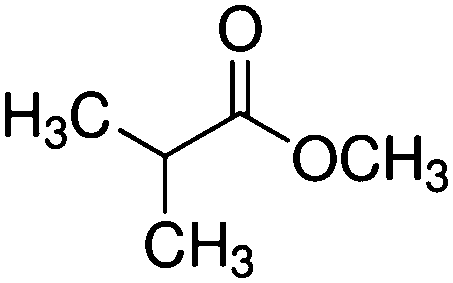
|
102 | 0.026/0.08 |
| Ethyl isobutyrate (EIB) |
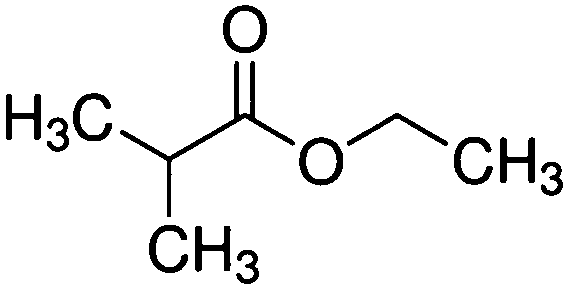
|
116 | 0.026/0.08 |
| Ethyl trimethylacetate (ETMA) |

|
130 | 0.01/0.07 |
| Ethyl bromoisobutyrate (EBIB) |
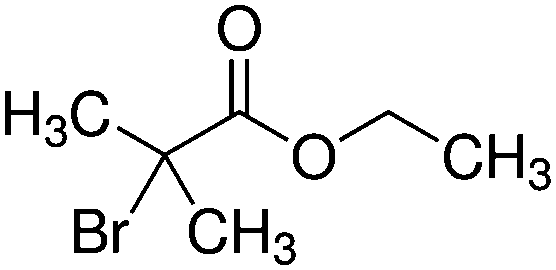
|
194/196 | n/a |
Experimental section
Plasma polymerization
Plasma polymer (pp) coatings from three precursors, ethyl isobutyrate (EIB, 99%, Sigma-Aldrich), methyl isobutyrate (MIB, 99% Sigma-Aldrich) and Ethyl trimethylacetate (ETMA, 99%, Sigma-Aldrich) were deposited using a stainless steel vacuum chamber. The plasma reactor used has been described and characterized elsewhere.30 The chamber was pumped down by a two-stage rotary pump to reach a base pressure below 0.002 mbar. Silicon wafers were used as substrates after solvent-cleaning with ethanol and acetone followed by drying under a stream of dry nitrogen. EIB, MIB and ETMA precursor vapours were introduced into the chamber via a 13 mm ball valve after degassing using liquid nitrogen. Then plasma was ignited using an RF power generator (13.56 MHz, RFG050 Coaxial Power Systems, UK) with a matching network (AMN150, Coaxial Power Systems, UK). Thin films discussed below were deposited at a fixed RF input power at 50 W using the pressures detailed in Table 1.Plasma mass spectrometry (MS)
A quadrupole mass spectrometer (Hiden EQP1000 energy resolving mass spectrometer) was mounted along the reactor midline axis. The system was differentially pumped during operation using a turbomolecular pump. The internal pressure remained below 5 × 10⁻⁷ mbar. A grounded 100 μm orifice was used during sampling. The mass spectrometer was operated in residual gas analysis (RGA) and positive ion mode to acquire spectra of both plasma-phase neutral species, and ions, respectively. For RGA, neutral species entered the mass spectrometer and were ionised using an electron impact source run at 100 μA and 70 eV. The ion optics were tuned to give a maximum signal at the molecular ion at m/z of m/z 102, 116 and 130 m/z for MIB, EIB and ETMA, respectively.The ion energy distributions (IEDs) of the protonated molecular ions at different plasma pressures were measured. In positive ion mode, the ion optics were first tuned to the peak ion energy at each pressure for the protonated precursor by acquiring the ion energy distribution. The positive ion mass spectra were then collected at this peak ion energy over the range m/z 0–400.
OctIV probe
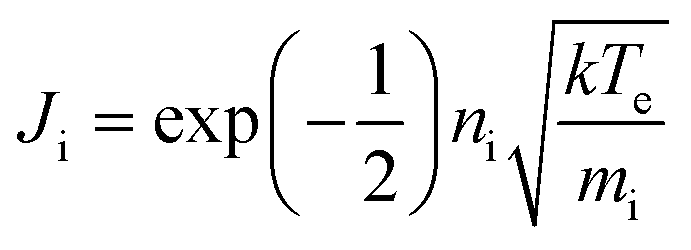
The ion flux to the RF electrode was measured using an Impedans OctIV ion flux probe (Impedans, Dublin) placed in series between the matching network and the RF electrode. The ion flux for a collision-less sheath is given by the Bohm flux,where ni is the plasma density, k is Boltzmann's constant, Te is the electron temperature and mi is the ion mass. For a homogeneous plasma, the ion flux is constant to all surfaces in contact with the plasma.28 This was the case for low pressure plasmas. At higher pressure, while there were variations in glow throughout the chamber, visual observation showed the glow intensity was similar in the vicinity of the RF electrode and earthed surfaces. Therefore, the ion flux to the substrate was taken to accord with the measured ion flux to the rf electrode.31 The OctIV probe was also used to measure the RF Voltage and electrode current.
Quartz crystal microbalance (QCM)
A quartz crystal microbalances (QCM) manufactured by Sycon Instruments, was used to measure the deposition rate during plasma polymer film deposition. It consisted of a 7 mm diameter 6 MHz gold crystal in the centre of the bottom electrode. The silicon wafer substrates were placed as close as practicable to the QCM during plasma polymerization experiments.X-ray photoelectron spectroscopy (XPS)
XPS was used to determine the chemical composition of the surface layers of the plasma polymer films. PP coated samples were analyzed using a Kratos Axis Ultra DLD X-ray photoelectron spectrometer (XPS) equipped with a monochromatic Al Kα source. Samples were analyzed at a photoelectron emission angle normal to the sample surface. Survey spectra were acquired at 120 eV pass energy and high-resolution C 1s and O 1s spectra were recorded at 20 eV pass energy. Quantifications of atomic percentages and curve fitting analysis were performed by Casa XPS software (ver. 2.3.16 Pre rel. 1.4, Casa Software Ltd). Spectra were corrected for sample charging by offsetting the binding energy relative to the C–C component of the C 1s spectrum, which was set to 285.0 eV.Results
Plasma mode determined by I–V
In this study we aim to investigate the differences in plasma deposition in α and γ modes. As mentioned above, the particle density in the sheath is important in determining the plasma mode. Transitioning between α and γ mode can then be achieved by simply increasing the pressure, or for reactive precursors, increasing power which results in higher particle density via precursor fragmentation. For a given precursor, predicting the transition point as a function of pressure and power is not trivial as the fragmentation pattern and collision cross-sectional areas are not known. For this study, we chose to use a constant RF power input, and the plasma mode was altered by operating the plasma at two pressures, one in α mode and one in γ mode as shown in Table 1. In Fig. 1, the Ohmic current to the RF electrode is plotted as a function of applied RF power for the three precursors and at two different pressures. The transition between α and γ modes is denoted by a discontinuity in the plot. For all three precursors at low pressure, the plots result in a linear correlation above ∼5 W. This shows that at the lower pressures used, the plasma remains in α mode across the power inputs tested here. However for the higher pressures, there is a distinct discontinuity in the plots at approximately 20–30 W, indicating that as the power is increased the plasmas transition to γ mode. It is expected that larger precursors would have larger cross-sectional areas, which increases the likelihood of collisions. Thus, the observation that ETMA transitions at a lower pressure than MIB and EIB is expected. As can be seen from Fig. 1, at constant RF power of 50 W, the low pressure plasmas are operating in the α mode, while at the higher pressure they have transitioned to γ mode. This was confirmed by visual observation of the plasma, which showed homogeneous distribution in α mode, and increased density near surfaces in γ mode. Therefore, further studies focussed on these high and low pressures at a constant RF power of 50 W.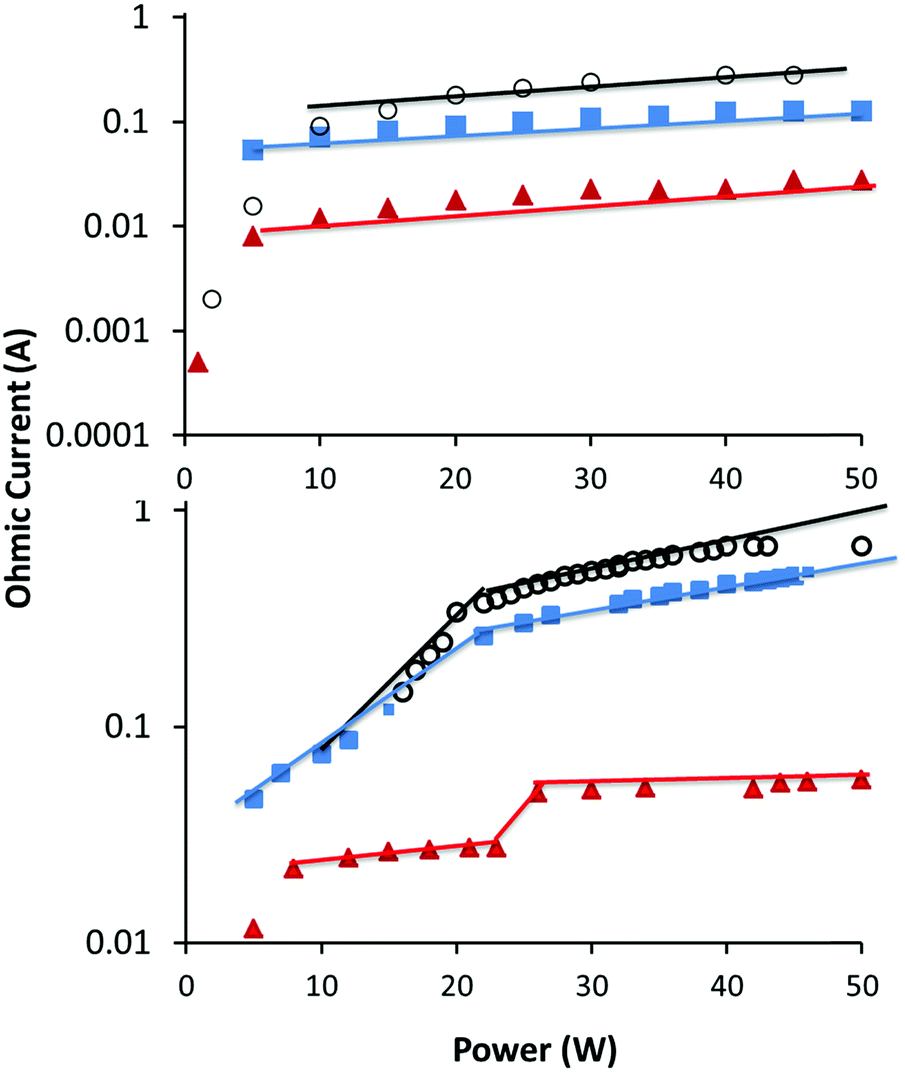 | ||
Fig. 1 Ohmic current vs. power at low (top) and high (bottom) pressure for MIB ( ), EIB ( ), EIB ( ) and ETMA (○). The transition from α to γ mode is shown by a discontinuity in the plots. ) and ETMA (○). The transition from α to γ mode is shown by a discontinuity in the plots. | ||
Ion energy distributions
The ion energy distributions of the precursor ions are shown in Fig. 2. At low pressure the ion energy distributions show sharp peaks for MIB and ETMA, indicative of a collisionless sheath. In the case of EIB, there is a low energy tail indicating there is a minor amount of ions which collide with neutral species while traversing the sheath.32 When the pressure was increased to 0.08 mbar for MIB and EIB and 0.07 mbar for ETMA at the same power, the ion energy distributions exhibited broad peaks with intensity shown down to 0 eV. This is typical of a collisional sheath, where ions gain energy from the electrical potential drop but then lose energy due to collisions with neutral molecules as they approach the substrate, resulting in a broad distribution of ion energies.33 These results confirm the I–V analysis above showing that at the low pressures used here, the plasmas are in the α regime (i.e. collision-less sheaths); when the pressure is increased, the sheaths become collisional and the plasmas enter the γ regime. These observations were further confirmed by visual inspection of the plasmas. At low pressure the plasma was homogeneously distributed throughout the chamber, while at higher pressure, the intensity of the plasma was increased in the vicinity of the RF electrode and the chamber walls relative to the bulk of the plasma, as previously observed for this chamber.34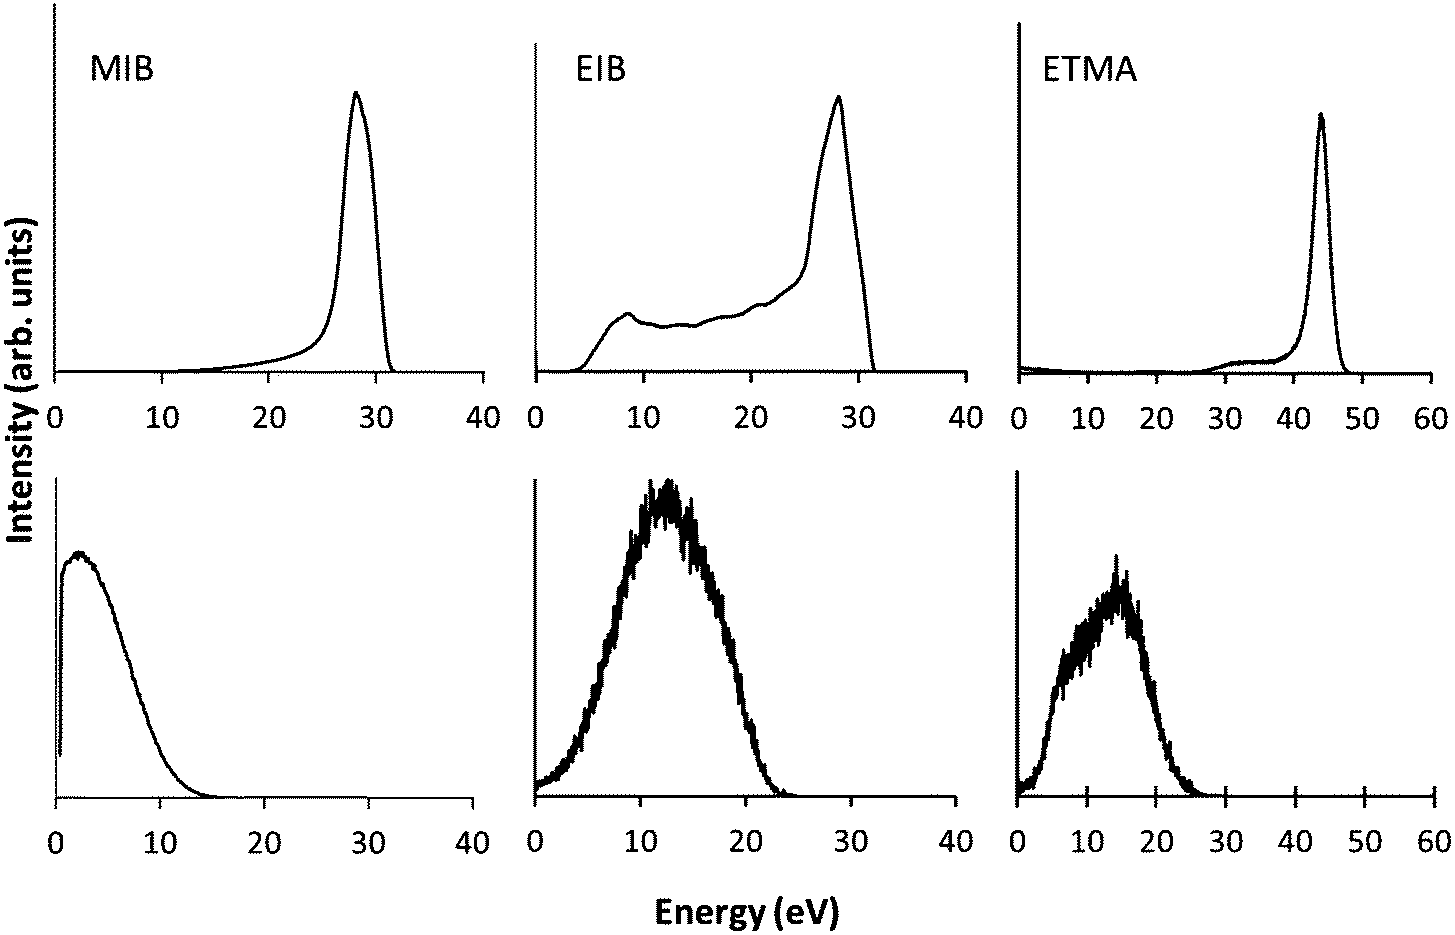 | ||
| Fig. 2 Ion energy distributions of MIB, EIB and ETMA precursors at 50 W at varying pressure (top = lower pressure, bottom = higher pressure). | ||
Plasma phase mass spectrometry
As discussed above, electron–molecule collisions in the plasma result in ionisation and fragmentation of the precursor. Fragmentation potentially results in loss of functionality and scrambling of the chemical motifs present in the precursor. The chemistry of the plasma phase can be measured using plasma phase mass spectrometry. The positive ion mass spectra for the 3 precursors are shown in Fig. 3, which shows that at low pressure, a peak corresponding to the protonated precursor molecule is observed (103, 117 and 131 m/z respectively). However these peaks were not the dominant peaks for MIB and EIB. For example, for EIB, two peaks at 71 and 89 m/z were measured at higher intensity than the protonated precursor peak at 117 m/z. The peak at 89 m/z is assigned to elimination of ethylene as shown in Scheme 1, and the peak at 71 m/z is assigned to elimination of the ethoxy group. The spectrum for ETMA shows fragmentation of the precursor but to a lesser degree, as the most intense peak is the protonated precursor.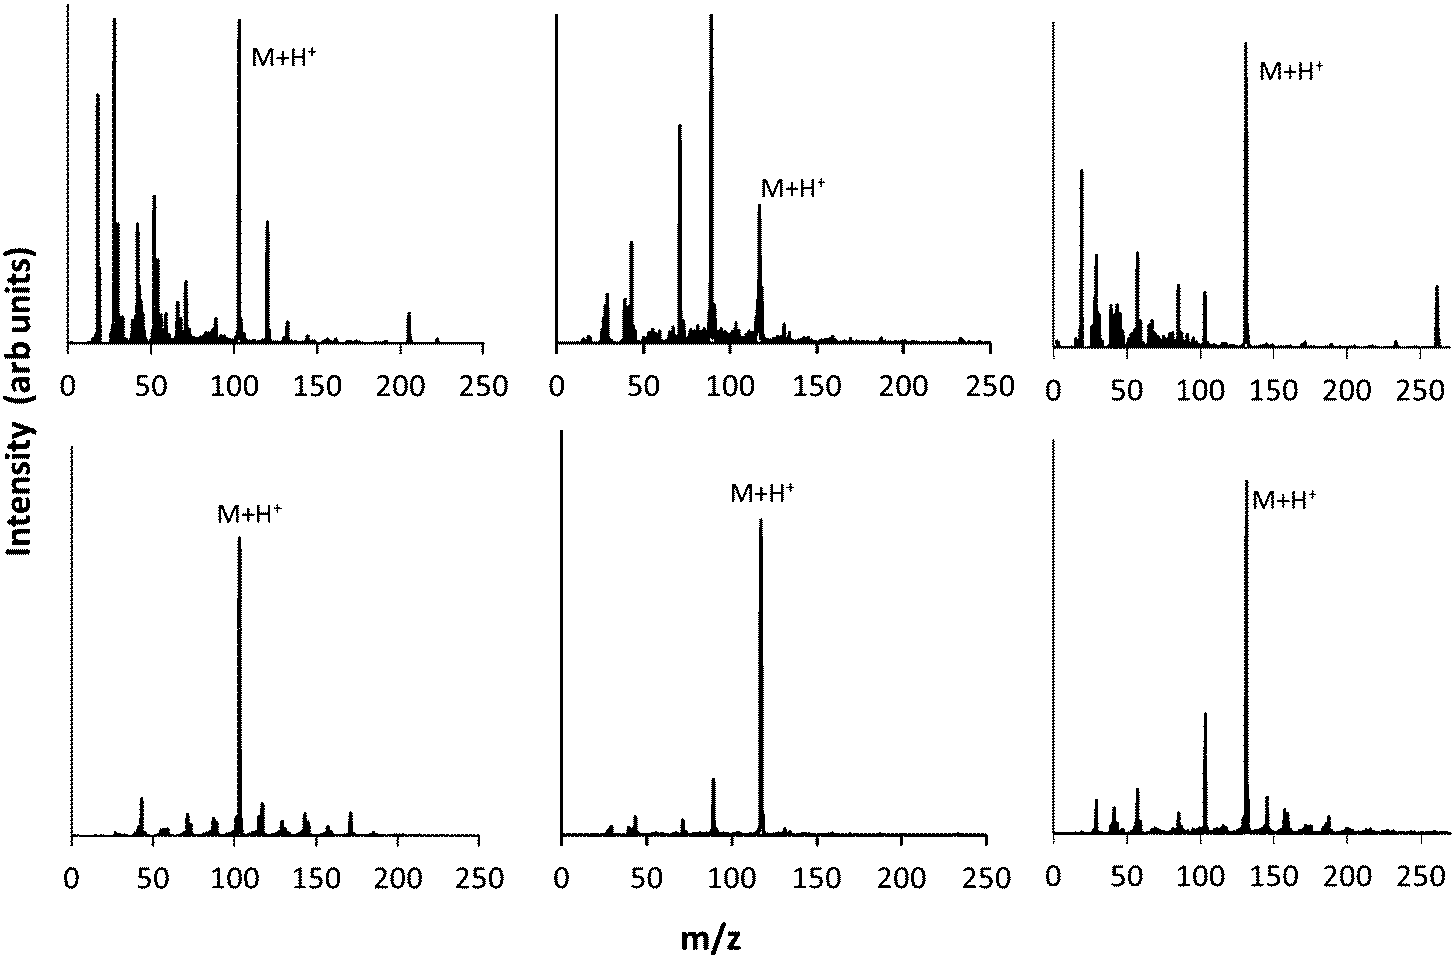 | ||
| Fig. 3 Plasma phase mass spectrum of positive ions at low (top) and high pressure (bottom) for precursors MIB (left) EIB (middle) and ETMA (right). | ||
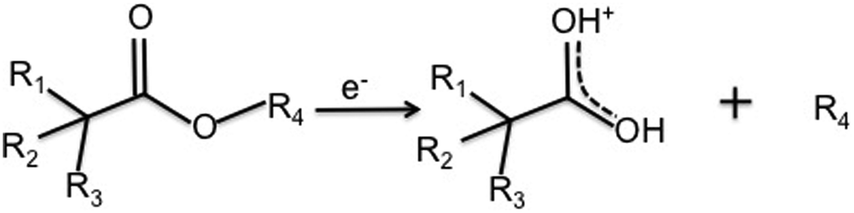 | ||
| Scheme 1 Elimination of the alkyl group (R4) from precursors to form resonance stabilised ions. For the precursors in this study, the products are 89 m/z for MIB and EIB, and 103 m/z for ETMA. | ||
When the pressure was increased and the plasma operated in the γ regime, the dominant peaks became the protonated precursors. In the spectrum of EIB, the peaks at 71, 89 m/z which had been observed at high intensity in the α regime were measured to be only minor peaks in the γ regime. For ETMA, the peak at 103 m/z corresponding to the protonated precursor after cleavage of the ethyl group was the second most intense peak, and showed slightly higher intensity than analogous peaks for MIB and EIB. This may be due to the increased molecular size of ETMA resulting in higher probability of secondary collisions. Thus, under these conditions, the ions arriving at the surface are almost entirely protonated precursor ions which retain the chemical structures in the precursor.
In contrast, the neutral mass spectra shown in Fig. 4 show extensive fragmentation of the precursor under all conditions studied here. For example, the neutral spectrum of EIB in the γ regime shows a peak at 116 m/z corresponding to the intact precursor. This peak though is relatively minor compared to peaks at 88, 71, 59, 43 and 28 m/z. These fragment peaks all exhibit high intensity relative to the intact precursor. This is consistent with previous observations of neutral species in plasmas, which show the intensity of the precursor is usually low, with a rich chemistry of fragments evident.35 While some of these peaks may be assigned to hydrocarbon fragments (e.g. 28 m/z corresponds to CH2![[double bond, length as m-dash]](https://www.rsc.org/images/entities/char_e001.gif) CH2), some are assigned to oxygenated species. The fragment at 88 m/z corresponds to the precursor with a cleaved ethyl, and the fragment at 71 m/z corresponds to further removal of the ester oxygen. The fragment at 59 m/z corresponds to CH3CH2CH2O. Thus, while some of these neutral peaks retain the ester group (peaks 116 and 88 m/z), many of them have lost ester functionality due to fragmentation and removal of oxygen. Note that this is not the case for the positive ion spectra in the γ regime, where the dominant peak is the protonated precursor which retains functionality.
CH2), some are assigned to oxygenated species. The fragment at 88 m/z corresponds to the precursor with a cleaved ethyl, and the fragment at 71 m/z corresponds to further removal of the ester oxygen. The fragment at 59 m/z corresponds to CH3CH2CH2O. Thus, while some of these neutral peaks retain the ester group (peaks 116 and 88 m/z), many of them have lost ester functionality due to fragmentation and removal of oxygen. Note that this is not the case for the positive ion spectra in the γ regime, where the dominant peak is the protonated precursor which retains functionality.
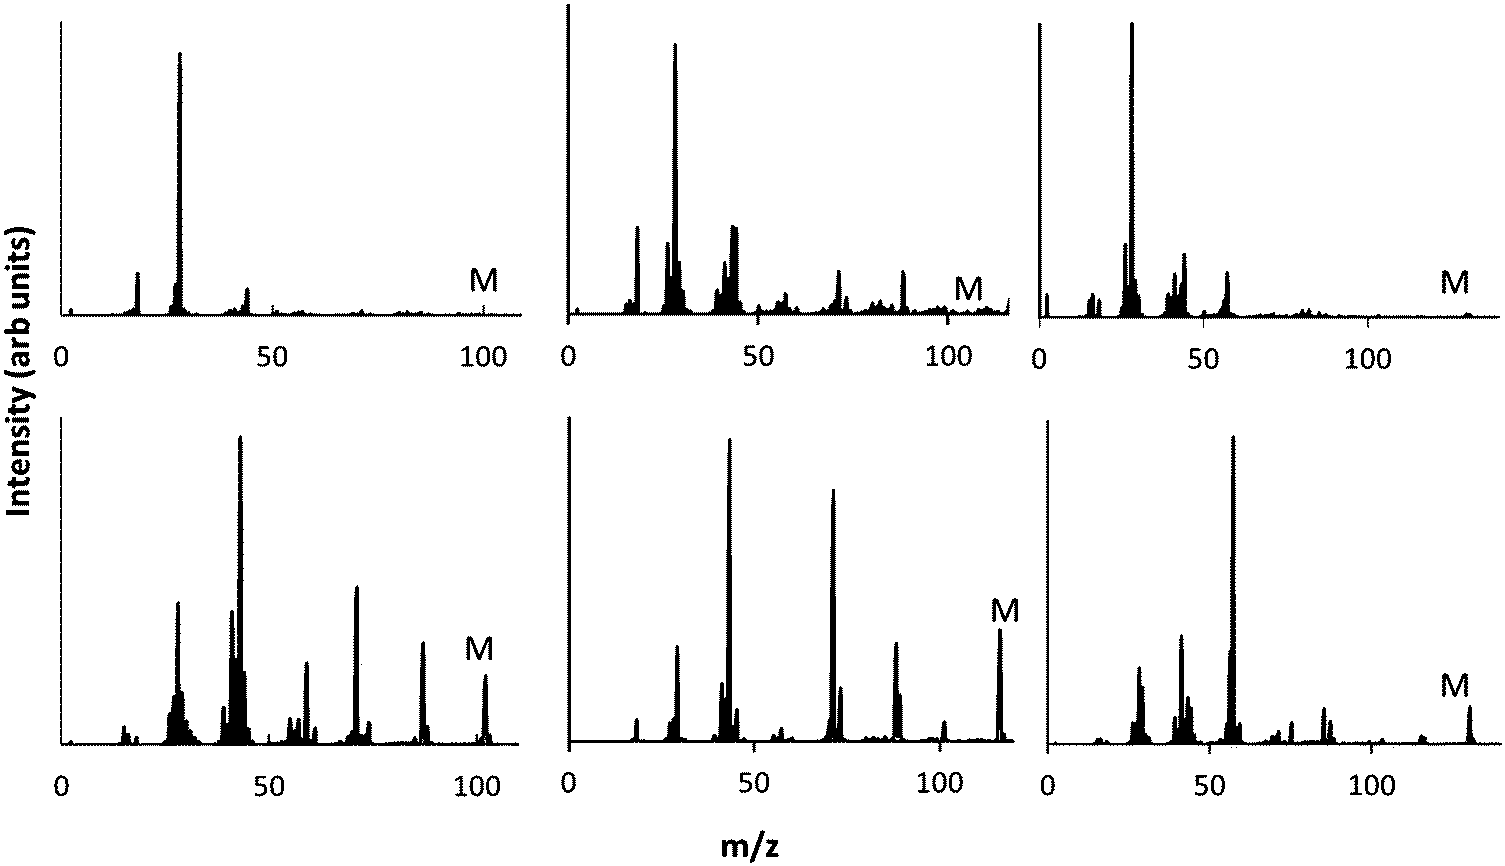 | ||
| Fig. 4 Plasma phase mass spectra of neutral species at low (top) and high pressure (bottom) for 3 precursors MIB (left) EIB (middle) and ETMA (right). | ||
Ion flux vs. deposition rate
The ion flux was measured as a function of the applied power under the high and low pressures used above for each precursor. The data in Fig. 5 shows that at low pressure the ion flux is 2–10 times lower than the high pressure ion flux at the same power depending on the precursor. This is consistent with previous measurements using this plasma chamber for ethanol and ethyl bromoisobutyrate.34,36 The ion flux measured for EIB was approximately 10 times lower than those for MIB and ETMA at equivalent power inputs. The reason for this is unclear, but we speculate that subtle changes in chemical structure result in changes in collisional cross-section and/or ionisation potential.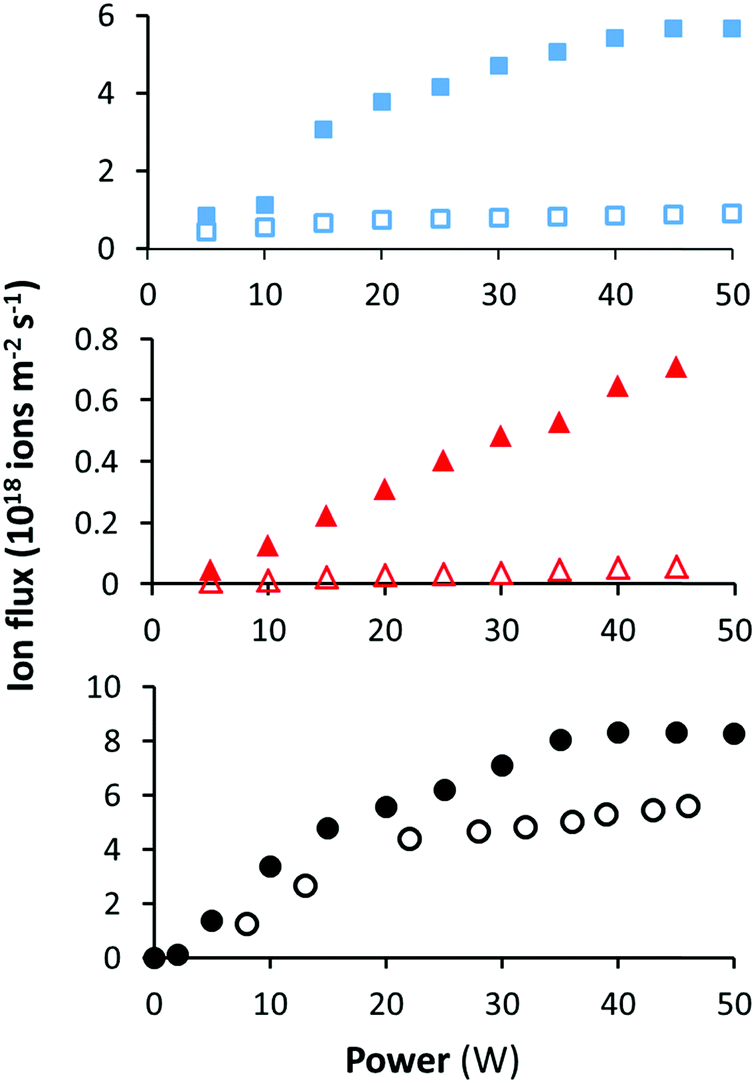 | ||
| Fig. 5 Ion flux as a function of power at low (open symbols) and high pressures (closed symbols) for MIB (top), EIB (middle) and ETMA (bottom) as measured by the OctIV probe. | ||
The deposition rates in the α and γ regimes were measured for each precursor by QCM, as shown in Table 2. As ions only make up a very small proportion of the particles in the plasma, the total flux of species to surfaces is dominated by neutral species. In the γ regime, despite the flux of species including neutrals and ions increasing in proportion to the increase in pressure, the deposition rate only increased marginally. This generally indicates an increase in the ion contribution to the deposit.37 By combining the measured ion flux and calculated average ion mass for each precursor from the plasma phase mass spectrum, the ion mass flux was calculated for each condition. It has been shown previously that the sticking probability of ions depends on the ion energy and chemistry, but is generally in the range of 20–50%.38 The results in Table 2 show that in the α regime, the ion mass flux is less than the total deposition rate for MIB and EIB, and slightly higher for ETMA. After taking into account a sticking probability lower than 1, the contribution of ions to the deposit is likely to be low compared to neutral deposition. However, in the γ regime, the ion mass flux increased dramatically while the total deposition rate only increased slightly. Thus, in the γ regime the deposits for MIB and ETMA are potentially entirely generated by ions. This is consistent with previous observations for unsaturated esters and carboxylic acids including propionic acid35 and ethyl bromoisobutyrate.36
| Precursor | Plasma regime | Ion flux (1018 ions per m2 s) | Ion mass flux (μg m−2 s−1) | Deposition rate (μg m−2 s−1) |
|---|---|---|---|---|
| MIB | α | 0.9 | 123 | 260 |
| γ | 5.7 | 930 | 360 | |
| EIB | α | 0.1 | 14 | 200 |
| γ | 0.7 | 131 | 240 | |
| ETMA | α | 5.5 | 451 | 312 |
| γ | 9.5 | 1957 | 360 | |
Surface analysis
The plasma polymer deposits from the 3 precursors in the α and γ regimes were analysed by XPS. Wide scans revealed that the deposits consisted of carbon and oxygen as expected. To reveal the specific chemistry and functionality of the deposits, the narrow scans of the C 1s core-level peaks were analysed as shown in Fig. 6.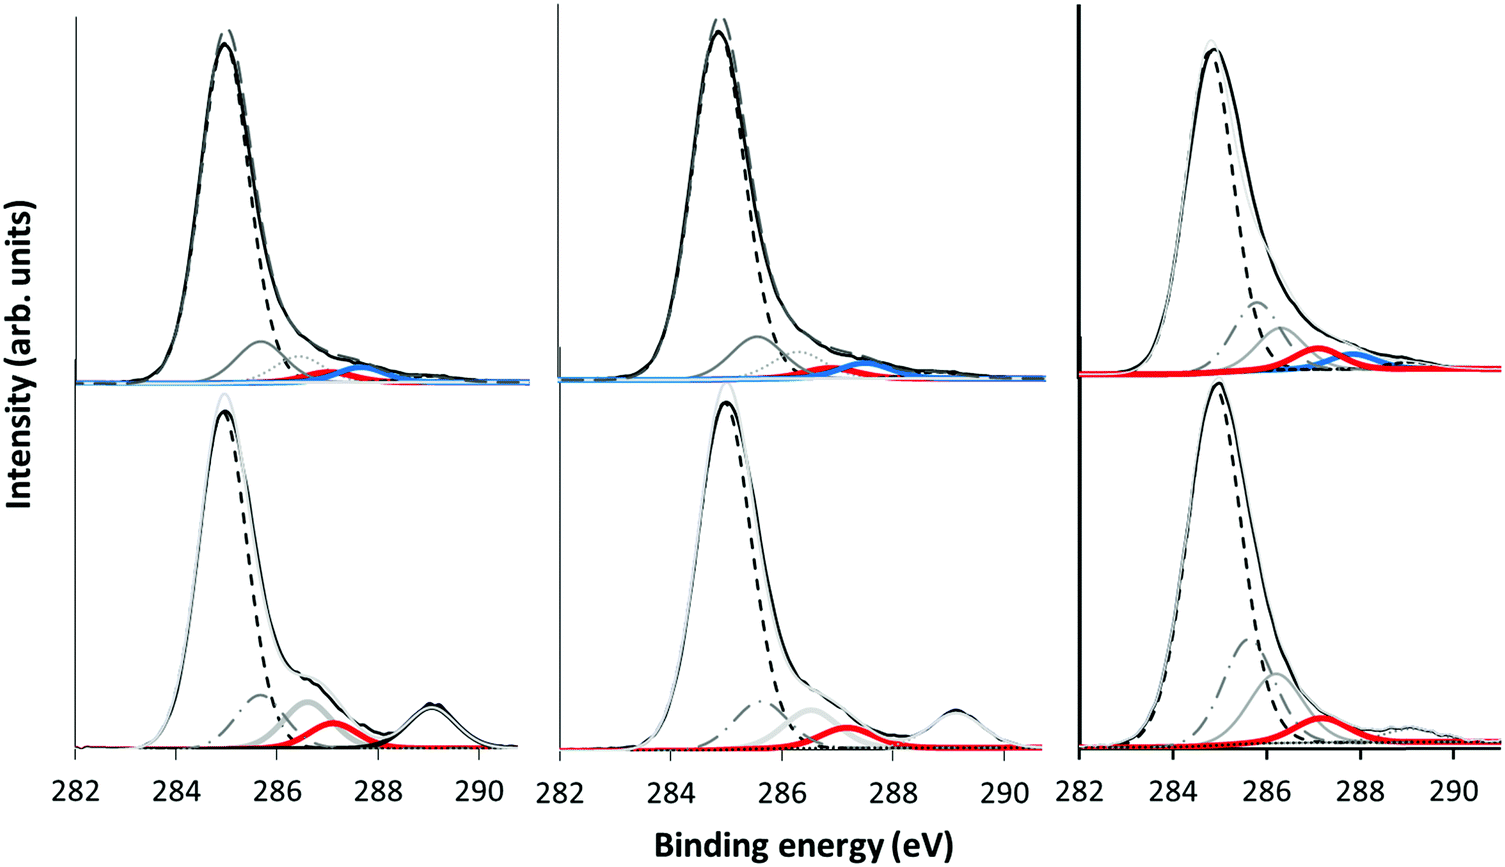 | ||
Fig. 6 Narrow scan C 1s XP spectra of plasma polymer deposits from MIB (left), EIB (middle) and ETMA (right) precursors at low (top) and high (bottom) pressure. The O–![[C with combining low line]](https://www.rsc.org/images/entities/char_0043_0332.gif) –COO and O synthetic peaks are marked in red and blue respectively. –COO and O synthetic peaks are marked in red and blue respectively. | ||
Following the procedure of Gengenbach et al.,16 curve fits were obtained by including synthetic peaks which could be justified from the precursor structure and plasma phase mass spectrum results. Taking α mode EIB as an example, synthetic peaks were included which correspond to carbon environments which appear in the precursor structure. These are clearly seen at 285 eV for aliphatic hydrocarbons, (–H/R), alcohol or ether carbon (–OH/R) at +1.5 eV, and the ester carbon (COOH/R) at +4.2 eV. A beta (β)-shifted component (β-C–H/R) at +0.7 eV is also fitted corresponding to –COOH/R in the precursor, however for the plasma polymer spectra we expect this synthetic peak to also have contributions from –C–O and –CO due to structural rearrangements. These positions are in good agreement with previous literature.39,40 With the addition of each synthetic peak, the χ2 decreased as shown in the ESI† (Fig. S1). The plasma mass spectra results for EIB exhibit a peak which corresponds to loss of the terminal OC2H5 group, leaving a hydrocarbon with a carbonyl oxygen. Thus a fifth synthetic peak was included for O at +2.8 eV. The χ2 was further reduced by inclusion of a synthetic peak at +2.2 eV which we assign to an ether carbon which is beta shifted by an adjacent carboxyl group. A likely candidate structure for this environment is given in Scheme 2, which for EIB results from combination of the 89 m/z fragment and an intact precursor, both of which are measured in the plasma phase by mass spectrometry. Inclusion of further synthetic peaks did not decrease the χ2, and any peaks identified were difficult to chemically justify. Thus, the XP spectra were fitted using the 6 synthetic peaks described above and the peak fitting results are summarised in Table 3.
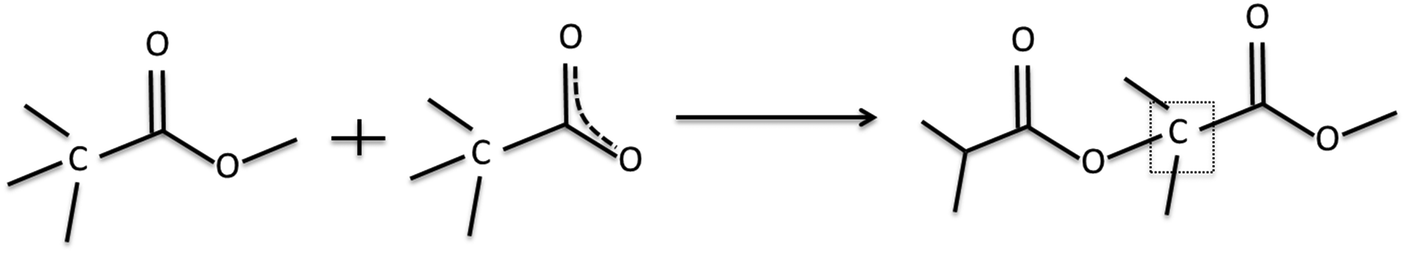 | ||
| Scheme 2 Proposed structure containing a beta shifted ether carbon, marked in the box. | ||
| Precursor | Regime | –C/H |
–O |
O |
O–O |
β-C–H/R | O––COO |
|---|---|---|---|---|---|---|---|
| 285 eV | 286.5 eV | 287.8 eV | 289.2 eV | 285.7 eV | 287.2 eV | ||
| MIB | α | 77.5 | 6 | 3.3 | 1.4 | 9.4 | 2.4 |
| γ | 66.8 | 9.2 | — | 8.2 | 10.6 | 5 | |
| Theoretical | 40 | 20 | — | 20 | 20 | — | |
| EIB | α | 78 | 4.7 | 2.6 | 1.2 | 10.7 | 2.8 |
| γ | 71.2 | 7.8 | — | 7.1 | 9.7 | 4.2 | |
| Theoretical | 50 | 16.7 | — | 16.7 | 16.7 | — | |
| ETMA | α | 68.3 | 10.9 | 3.2 | 1.4 | 11.7 | 4.8 |
| γ | 63.5 | 12.3 | — | 2.3 | 17.4 | 4.4 | |
| Theoretical | 57 | 14.3 | — | 14.3 | 14.3 | — | |
Comparing the hydrocarbon level when crossing the transition between the plasma regimes, the C–C/H peak is higher in relative intensity in the α regime than in the γ regime. Increased hydrocarbon content is typically associated with precursor fragmentation and loss of simple neutral fragments. In this case, oxygen functionality is generally lost due to formation of CO and CO2 fragments which are pumped out of the chamber. Thus, the changes in C–C/H intensity observed here agree with the plasma phase mass spectra which showed higher fragmentation in the α regime.
Interestingly, the carbonyl peak (CO) at +2.8 eV could only be fitted in the α regime, while in the γ regime this synthetic peak was absent. This is also in agreement with the plasma mass spectra and deposition kinetics data which showed fragmentation of the ions and a higher component of neutral deposition in the α regime which is always fragmented. For EIB, the ion at 71 m/z is assigned to the precursor after the loss of the terminal OC2H5 group. This peak is evident in the ion mass spectra in the α regime. In the γ regime when the ion component of deposition increases, there is less fragmentation of the ions, resulting in little formation of carbonyl groups as shown by the very low intensity of the 71 m/z peak.
The carbonyl and beta-shifted ether environments indicate fragmentation and structural rearrangements, either pre-deposition or on the coating surface. As there is no evidence of a beta-shifted ether structure in the plasma phase mass spectra, we assign this re-arrangement to processes at the surface due to high energy ion impacts.
In the fitting of plasma coatings of MIB and EIB, it is clear from the spectra that at high pressure (γ regime) there is greater retention of the ester group than in the α regime (up to six fold higher). Based on the precursor structures, the ester retention is 42% in the γ mode and only 7% in α mode for both MIB and EIB. For ETMA the α and γ regime ester retentions are 16% and 10% respectively. When we consider all of the synthetic peaks together we can appreciate that the γ regime deposits have a stronger structural resemblance to the starting precursor.
Discussion
Plasma phase interactions
Plasma phase analysis shows there are differences in the chemistry of the ions and neutral species which arrive at surfaces in contact with the plasma. Analysis of the neutral species shows that increasing the pressure at constant power results in lower fragmentation of neutral species. For example, the intensity of EIB at 116 m/z is very low at low pressure, but increases with pressure. Concomitantly, the intensity of smaller fragments decreases as pressure increases. This could be for two reasons; the energy input per molecule decreases as pressure increases, and the density of the bulk plasma decreases in the γ regime as discussed above.In the case of ions though, the change in ion chemistry with pressure is much more dramatic. In the α regime, the precursor ion is only a small component of the total ion intensity. However in the γ regime, the precursor ion is by far the dominant ion. This can be explained by the different sources of hot electrons in the plasma. In α mode, electrons are heated in the bulk of the plasma and reach an average temperature of typically around 3 eV. At this average temperature, relatively few electrons have enough kinetic energy to ionise precursor molecules (>10 eV) while many are able to cause bond scission (∼3–8 eV). In addition, the ions which are created in the bulk of the plasma may have significant distance to travel before arriving at the surface. For a typical laboratory scale reactor, this distance could be 10 s of centimetres. Precursor ions in α mode are therefore likely to undergo further fragmentation due to electron–ion collisions before arriving at the surface.
In γ mode though, there are two distinct plasma regions which can be visually observed; the bulk plasma which is low density, and a region of higher density close to surfaces in contact with the plasma. The region of higher plasma density near surfaces is due to electrons being liberated in the sheath region and being accelerated away from the surface due to the strong electric field within the sheath. These hot electrons being ejected from the sheath increase the plasma density close to the surface. This opens a range of possible interactions which result in protonated precursor ions being formed in this region of high plasma density; hot electron–neutral ionization collisions, ion–neutral collisions in the sheath resulting in transfer of a proton to the neutral molecule, or generation of free protons due to fragmentation which then attach to neutral molecules. While we cannot be sure of the mechanism of neutral molecule protonation from the data presented here, it is clear that transitioning from the α to γ regime results in an increased density of these ions close to the surface. This means that newly created precursor ions may only have a very short distance to travel to the surface, resulting in less likelihood of subsequent electron–ion collisions and fragmentation. The result is a flux of protonated precursor ions which retain their structure. Also important is that the ion flux measurements in Fig. 5 show that the ion flux increases by up to 10 times when the pressure is increased. The neutral flux though is proportional to the pressure. The ratio of ions to neutral molecules arriving at the surface then increases with pressure.
Plasma–surface interactions
For a deposit to form on the surface, particles arriving at the surface must convert energy into chemical bonds with surface atoms. In the case of neutral species this can be chemical energy in the form of radical sites or double bonds. As the precursors used in this study are all saturated, radical propagation via double bonds is not possible. Therefore neutral deposition must be due to creation of surface radical sites, and combination with plasma phase radicals. Surface radical sites are created by high energy ion impacts. While the ion flux to surfaces is lower at low pressure, the ion energy distribution is significantly higher. For example, for MIB in the α regime, the ions are almost exclusively ∼30 eV which is enough energy to etch surfaces41 and create surface radicals. In the γ regime the ion energy distribution is much lower, with relatively few ions >10 eV. Therefore, we can expect the surface radical density to be higher in α mode, which explains why the deposition is dominated by neutral deposition.Direct ion deposition is also possible, and the net probability of ions sticking to the surface is strongly dependent on the ion energy. While the sticking probability increases with ion energy38 the probability of ion etching increases too.41 Thus, at the high ion energies typical of the α regime studied here, the net sticking probability may be reduced, and there is the possibility of ion impacts causing structural rearrangements. Conversely, in γ mode the ion energies are attenutated due to ion–neutral collisions in the sheath and a significant portion of the ions arrive <15 eV. At these energies the ions are “soft landed” and do not cause etching or structural damage.41 Thus, in γ mode the ions arriving are largely intact precursor ions, and they arrive with sufficient energy to deposit but not enough to lose functionality due to etching.
Comparison with other precursors
In two recent papers we explored the PP process as a function of pressure for two precursors. Ethanol plasmas were studied at a fixed power of 15 W from 0.02–0.08 mbar.34 Similar results to this investigation were observed, with a transition from the α to γ regime observed at around 0.05 mbar. In comparing the plasma phase chemistry between the two regimes, the ion chemistry was not significantly changed, however the fragmentation of the neutral species was lower in the γ regime. The transition was accompanied by an increase in the ion flux and an increase in oxidised carbon in the plasma deposit. This was explained by the increase in ion energy flux to the surface, the product of ion flux and ion energy. This was for a small and relatively simple precursor, which revealed that pressure plays a critical role in plasma chemistry and the energetics of surface interactions. Increasing the energy flux resulted in increased rearrangements and incorporation of oxygen due to surface processes.Following this, plasma deposition of ethyl bromoisobutyrate (EBIB) was studied with the aim of retaining the α-bromo isobutyryl group which can be used to initiate atom transfer radical polymerisation (ATRP) (see Table 1).36 The fragility of the α-bromo isobutyryl group in the plasma was observed by neutral mass spectrometry with only very small peaks featuring this group measured under all conditions tested; many of the fragments observed in the plasma had lost the Br atom which is critical to the utility of the deposits. Protonated EBIB ions were observed however, showing that if plasma conditions could be tuned to promote ionic deposition, surfaces capable of initiating ATRP may be possible. The plasma deposits from α regime EBIB were shown to be poor at initiating ATRP with hydroxyethyl methacrylate due to the deposition process being dominated by neutral deposition. However when the pressure was increased such that the plasma was in γ mode, the deposit was shown to be able to initiate ATRP, demonstrating a clear link between the plasma phase ion chemistry and the chemistry of the deposit. Most interesting was that increasing the power at constant pressure such that the plasma transitioned from α to γ mode increased α-bromo isobutyryl group retention as measured by ion mass spectrometry and the ability of the deposit to initiate ATRP. This result was totally counter to conventional wisdom in the field, and showed that the Yasuda parameter is not universal even for a single plasma system.
The current work is consistent with these previous studies, and shows the same principles can be applied for a new range of precursors. For all the precursors tested, neutral species exhibit considerable fragmentation which can only be limited by lowering power and increasing pressure, but fragmentation and loss of functionality is always present in the neutral species. In the ion mass spectra though, protonated precursor ions are formed and the flux of these ions to surfaces can be maximised by operating the plasma in γ mode. Additionally, the dominant mechanism of deposition shifts from neutral deposition to ionic deposition when transitioning from α to γ mode. Operating in γ mode also decreases the ion energy such that degradation and structural scrambling through high energy ion impacts is limited.
Conclusions
We have shown that pressure plays a critical role in the retention of ester functionality for three related precursors. Increasing the pressure for each precursor at constant RF power increased the retention of the ester group. This would previously have been correlated with a decrease in the Yasuda parameter W/FM, however we have demonstrated there is a fundamental shift in the plasma which affects the chemistry of the ions arriving at surfaces and physics of surface interactions. By operating the plasma in the γ regime, the deposition processes are dominated by soft landed ions, and these ions are predominantly the protonated precursors which retain the ester group.These results contribute to the goal of a fuller knowledge of the relationships between plasma and sheath processes and the resultant chemistry of plasma polymers. The new insights can be exploited to guide the formation of ultra-thin films that retain hitherto unachievable levels of structural chemistry.
Acknowledgements
The authors wish to acknowledge financial support from the Australian Research Council under the Discovery Project DP160105001.References
- F. H. Schacher, P. A. Rupar and I. Manners, Angew. Chem., Int. Ed., 2012, 51, 7898–7921 CrossRef CAS PubMed.
- A. L. Hook, C.-Y. Chang, J. Yang, J. Luckett, A. Cockayne, S. Atkinson, Y. Mei, R. Bayston, D. J. Irvine, R. Langer, D. G. Anderson, P. Williams, M. C. Davies and M. R. Alexander, Nat. Biotechnol., 2012, 30, 868–875 CrossRef CAS PubMed.
- A. D. Celiz, J. G. W. Smith, R. Langer, D. G. Anderson, D. A. Winkler, D. A. Barrett, M. C. Davies, L. E. Young, C. Denning and M. R. Alexander, Nat. Mater., 2014, 13, 570–579 CrossRef CAS PubMed.
- Y. Mei, K. Saha, S. R. Bogatyrev, J. Yang, A. L. Hook, I. Kalcioglu, S.-W. Cho, M. Mitalipova, N. Pyzocha, N. F. Rojas, K. J. V. Vliet, M. C. Davies, M. R. Alexander, R. Langer, R. Jaenisch and D. G. Anderson, Nat. Mater., 2010, 9, 768–778 CrossRef CAS PubMed.
- S. Prakasha, M. B. Karacor and S. Banerjee, Surf. Sci. Rep., 2009, 64, 233–254 CrossRef.
- P. L. Golas and K. Matyjaszewski, Chem. Soc. Rev., 2010, 39, 1338–1354 RSC.
- R. Barbey, L. Lavanant, D. Paripovic, N. Schüwer, C. Sugnaux, S. Tugulu and H.-A. Klok, Chem. Rev., 2009, 109, 5437–5527 CrossRef CAS PubMed.
- J. B. Decoste, G. W. Peterson, M. W. Smith, C. A. Stone and C. R. Willis, J. Am. Chem. Soc., 2012, 134, 1486–1489 CrossRef CAS PubMed.
- Y.-S. Min, E. J. Bae, B. S. Oh, D. Kang and W. Park, J. Am. Chem. Soc., 2005, 127, 12498–12499 CrossRef CAS PubMed.
- S. G. Im, K. W. Bong, B.-S. Kim, S. H. Baxamusa, P. T. Hammond, P. S. Doyle and K. K. Gleason, J. Am. Chem. Soc., 2008, 130, 14424–14425 CrossRef CAS PubMed.
- S. Roy, X. Chen, M.-H. Li, Y. Peng, F. Anariba and Z. Gao, J. Am. Chem. Soc., 2009, 131, 12211–12217 CrossRef CAS PubMed.
- P. C. Nicolson, R. C. Baron, P. Chabrecek, A. Domschke, H. J. Griesser, A. Ho, J. Hopken, B. G. Laycock, Q. Liu, D. Lohmann, G. F. Meijs, E. Papaspiliotopoulos, J. S. Riffle, K. Schindhelm, D. Sweeney, W. L. Terry, J. Vogt and L. C. Winterton, Extended wear ophthalmic lens, US5760100 A, 1998 Search PubMed.
- J. Friedrich, Plasma Processes Polym., 2011, 8, 783–802 CrossRef CAS.
- F. Khelifa, S. Ershov, Y. Habibi, R. Snyders and P. Dubois, Chem. Rev., 2016, 116, 3975–4005 CrossRef CAS PubMed.
- Y. Li, B. W. Muir, C. D. Easton, L. Thomsen, D. R. Nisbet and J. S. Forsythe, Appl. Surf. Sci., 2014, 288, 288–294 CrossRef CAS.
- T. R. Gengenbach, R. C. Chatelier and H. J. Griesser, Surf. Interface Anal., 1996, 24, 271–281 CrossRef CAS.
- P.-L. Girard-Lauriault, P. M. Dietrich, T. Gross, T. Wirth and W. E. S. Unger, Plasma Processes Polym., 2013, 10, 388–395 CrossRef CAS.
- J. Ryssy, E. Prioste-Amaral, D. F. N. Assuncao, N. Rogers, G. T. S. Kirby, L. E. Smith and A. Michelmore, Phys. Chem. Chem. Phys., 2016, 18, 4496–4504 RSC.
- G. Padron-Wells, B. C. Jarvis, A. K. Jindal and M. J. Goeckner, Colloids Surf., B, 2009, 68, 163–170 CrossRef CAS PubMed.
- L. M. Szott, M. J. Stein, B. D. Ratner and T. A. Horbett, J. Biomed. Mater. Res., Part A, 2011, 96, 150–161 CrossRef PubMed.
- H. Yasuda, Plasma polymerization, Academic Press, New York, 1985 Search PubMed.
- D. Beyer, W. Knoll, H. Ringsdorf, J.-H. Wang, R. B. Timmons and P. Sluka, J. Biomed. Mater. Res., Part A, 1997, 36, 181–189 CrossRef CAS.
- M. R. Alexander and T. M. Duc, Polymer, 1999, 40, 5479–5488 CrossRef CAS.
- D. Hegemann, B. Hanselmann, S. Guimond, G. Fortunato, M.-M. Giraud and A. G. Guex, Surf. Coat. Technol., 2014, 255, 90–95 CrossRef CAS.
- E. Makhneva, A. Manakhov, P. Skládal and L. Zajíčková, Surf. Coat. Technol., 2016, 290, 116–123 CrossRef CAS.
- J. D. Whittle, R. D. Short, D. A. Steele, J. W. Bradley, P. M. Bryant, F. Jan, H. Biederman, A. A. Serov, A. Choukurov, A. L. Hook, W. A. Ciridon, G. Ceccone, D. Hegemann, E. Korner and A. Michelmore, Plasma Processes Polym., 2013, 10, 767–778 CrossRef CAS.
- R. d'Agostino and F. Palumbo, Plasma Processes Polym., 2012, 9, 844–849 CrossRef.
- M. A. Lieberman and A. J. Lichtenberg, Principles of plasma discharges and materials processing, John Wiley & Sons, New Jersey, 2005 Search PubMed.
- V. Lisovskiy and V. Yegorenkov, Vacuum, 2004, 74, 19–28 CrossRef CAS.
- A. Michelmore, J. D. Whittle, R. D. Short, R. W. Boswell and C. Charles, Plasma Processes Polym., 2014, 11, 833–841 CrossRef CAS.
- D. Barton, A. G. Shard, R. D. Short and J. W. Bradley, J. Phys. Chem. B, 2005, 109, 3207–3211 CrossRef CAS PubMed.
- C. Charles, R. W. Boswell and R. K. Porteous, J. Vac. Sci. Technol., A, 1992, 10, 398–403 CAS.
- E. Kawamura, V. Vahedi, M. A. Lieberman and C. K. Birdsall, Plasma Sources Sci. Technol., 1999, 8, R45–R64 CrossRef CAS.
- S. Saboohi, M. Jasieniak, B. R. Coad, H. J. Griesser, R. D. Short and A. Michelmore, J. Phys. Chem. B, 2015, 119, 15359–15369 CrossRef CAS PubMed.
- S. A. Voronin, M. R. Alexander and J. W. Bradley, Surf. Coat. Technol., 2006, 201, 768–775 CrossRef CAS.
- S. Saboohi, B. R. Coad, A. Michelmore, R. D. Short and H. J. Griesser, ACS Appl. Mater. Interfaces, 2016, 8, 16493–16502 CAS.
- S. Peter, K. Graupner, D. Grambole and F. Richter, J. Appl. Phys., 2007, 102, 053304 CrossRef.
- P. N. Brookes, S. Fraser, R. D. Short, L. Hanley, E. Fuoco, A. Roberts and S. J. Hutton, J. Electron Spectrosc. Relat. Phenom., 2001, 121, 281–297 CrossRef CAS.
- D. Briggs, Surface analysis of polymers by XPS and static SIMS, University Press, Cambridge, 1998 Search PubMed.
- G. Beamson and D. Briggs, High resolution XPS of organic polymers: the Scienta ESCA300 database, John Wiley and Sons, Chichester, 1992 Search PubMed.
- D. C. Jacobs, Annu. Rev. Phys. Chem., 2002, 53, 379–407 CrossRef CAS PubMed.
Footnote |
| † Electronic supplementary information (ESI) available. See DOI: 10.1039/c6cp08630f |
| This journal is © the Owner Societies 2017 |